Mountain Village, CO Map & Demographics
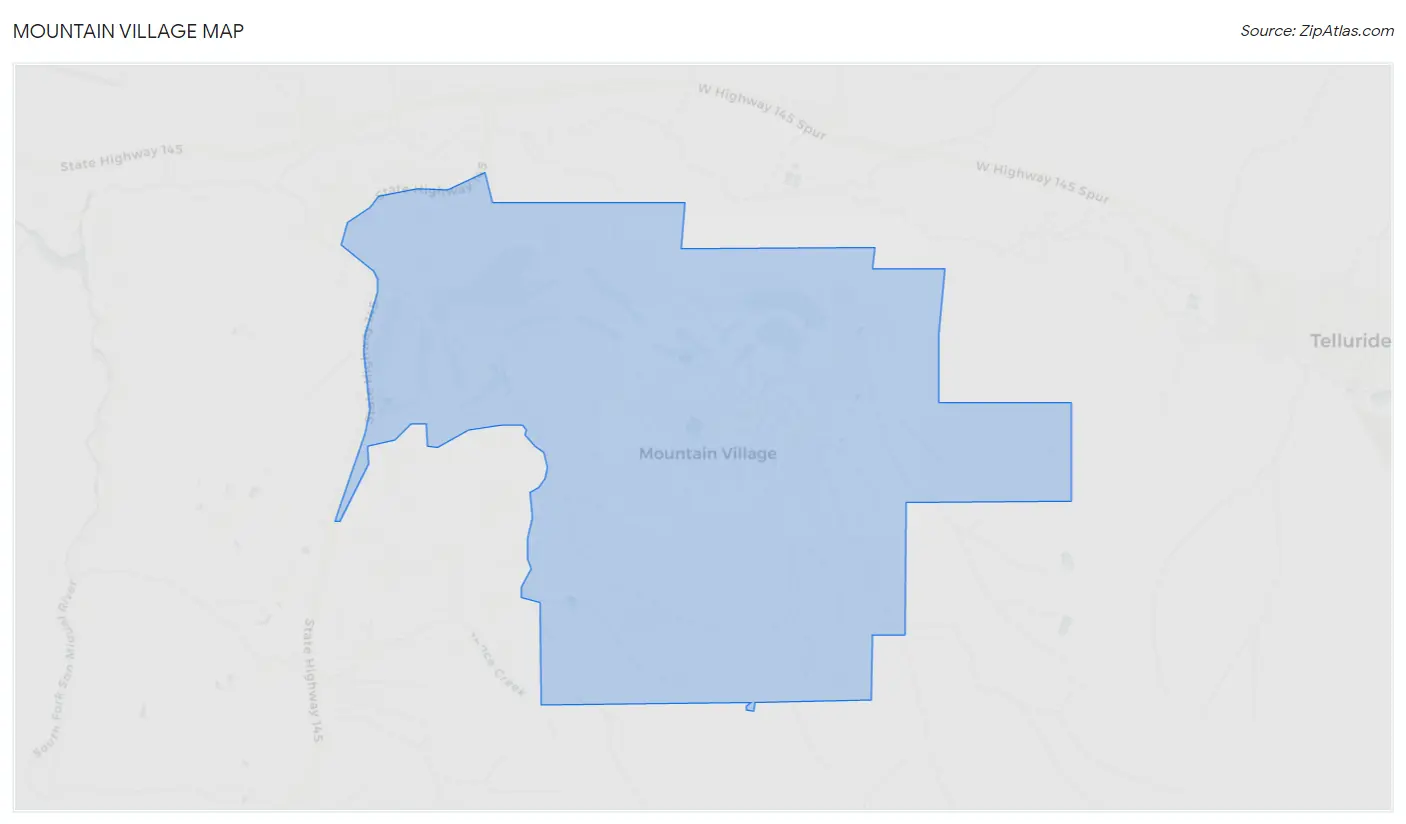
Mountain Village Map
Mountain Village Overview
$80,843
PER CAPITA INCOME
$140,357
AVG FAMILY INCOME
$56,917
AVG HOUSEHOLD INCOME
25.7%
WAGE / INCOME GAP [ % ]
74.3¢/ $1
WAGE / INCOME GAP [ $ ]
0.67
INEQUALITY / GINI INDEX
1,582
TOTAL POPULATION
923
MALE POPULATION
659
FEMALE POPULATION
140.06
MALES / 100 FEMALES
71.40
FEMALES / 100 MALES
34.2
MEDIAN AGE
2.5
AVG FAMILY SIZE
1.8
AVG HOUSEHOLD SIZE
1,130
LABOR FORCE [ PEOPLE ]
77.9%
PERCENT IN LABOR FORCE
5.5%
UNEMPLOYMENT RATE
Mountain Village Area Codes
Income in Mountain Village
Income Overview in Mountain Village
Per Capita Income in Mountain Village is $80,843, while median incomes of families and households are $140,357 and $56,917 respectively.
| Characteristic | Number | Measure |
| Per Capita Income | 1,582 | $80,843 |
| Median Family Income | 296 | $140,357 |
| Mean Family Income | 296 | $309,124 |
| Median Household Income | 869 | $56,917 |
| Mean Household Income | 869 | $147,858 |
| Income Deficit | 296 | $0 |
| Wage / Income Gap (%) | 1,582 | 25.75% |
| Wage / Income Gap ($) | 1,582 | 74.25¢ per $1 |
| Gini / Inequality Index | 1,582 | 0.67 |
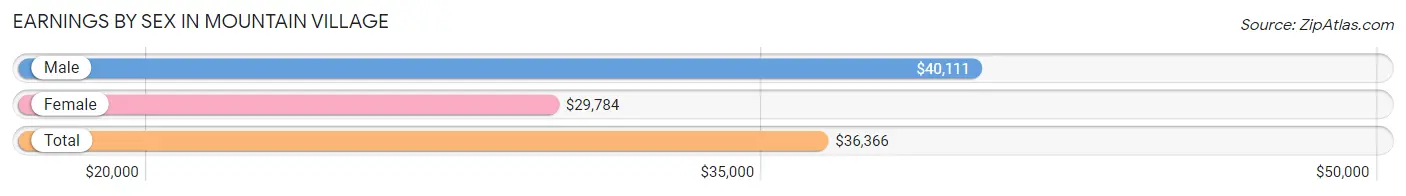
Earnings by Sex in Mountain Village
Average Earnings in Mountain Village are $36,366, $40,111 for men and $29,784 for women, a difference of 25.8%.
| Sex | Number | Average Earnings |
| Male | 730 (61.3%) | $40,111 |
| Female | 460 (38.7%) | $29,784 |
| Total | 1,190 (100.0%) | $36,366 |
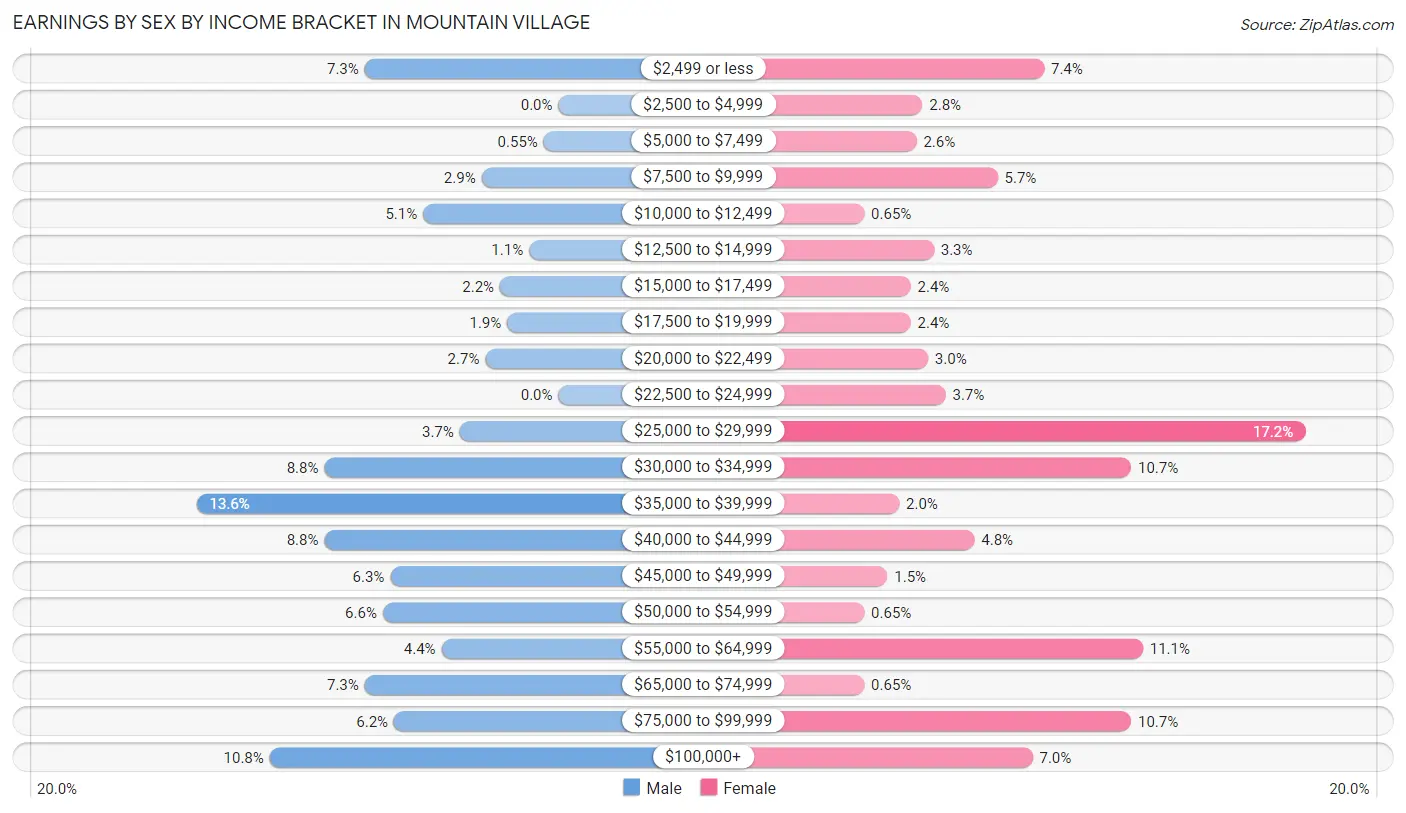
Earnings by Sex by Income Bracket in Mountain Village
The most common earnings brackets in Mountain Village are $35,000 to $39,999 for men (99 | 13.6%) and $25,000 to $29,999 for women (79 | 17.2%).
| Income | Male | Female |
| $2,499 or less | 53 (7.3%) | 34 (7.4%) |
| $2,500 to $4,999 | 0 (0.0%) | 13 (2.8%) |
| $5,000 to $7,499 | 4 (0.5%) | 12 (2.6%) |
| $7,500 to $9,999 | 21 (2.9%) | 26 (5.7%) |
| $10,000 to $12,499 | 37 (5.1%) | 3 (0.6%) |
| $12,500 to $14,999 | 8 (1.1%) | 15 (3.3%) |
| $15,000 to $17,499 | 16 (2.2%) | 11 (2.4%) |
| $17,500 to $19,999 | 14 (1.9%) | 11 (2.4%) |
| $20,000 to $22,499 | 20 (2.7%) | 14 (3.0%) |
| $22,500 to $24,999 | 0 (0.0%) | 17 (3.7%) |
| $25,000 to $29,999 | 27 (3.7%) | 79 (17.2%) |
| $30,000 to $34,999 | 64 (8.8%) | 49 (10.6%) |
| $35,000 to $39,999 | 99 (13.6%) | 9 (2.0%) |
| $40,000 to $44,999 | 64 (8.8%) | 22 (4.8%) |
| $45,000 to $49,999 | 46 (6.3%) | 7 (1.5%) |
| $50,000 to $54,999 | 48 (6.6%) | 3 (0.6%) |
| $55,000 to $64,999 | 32 (4.4%) | 51 (11.1%) |
| $65,000 to $74,999 | 53 (7.3%) | 3 (0.6%) |
| $75,000 to $99,999 | 45 (6.2%) | 49 (10.6%) |
| $100,000+ | 79 (10.8%) | 32 (7.0%) |
| Total | 730 (100.0%) | 460 (100.0%) |
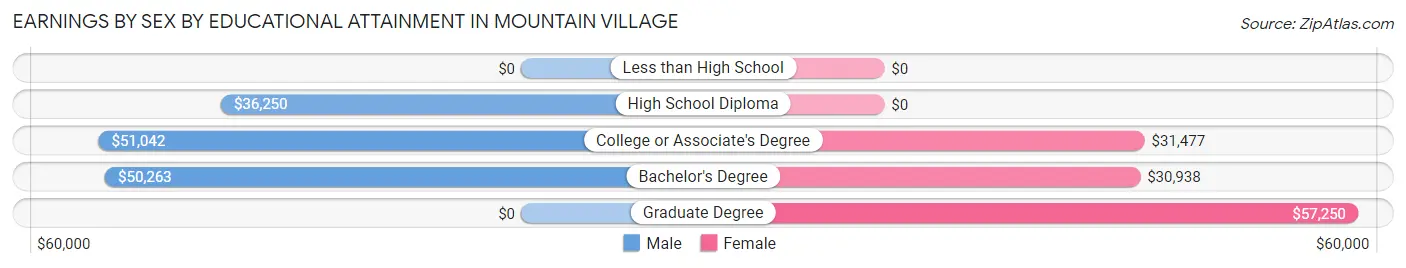
Earnings by Sex by Educational Attainment in Mountain Village
Average earnings in Mountain Village are $42,056 for men and $32,232 for women, a difference of 23.4%. Men with an educational attainment of college or associate's degree enjoy the highest average annual earnings of $51,042, while those with high school diploma education earn the least with $36,250. Women with an educational attainment of graduate degree earn the most with the average annual earnings of $57,250, while those with bachelor's degree education have the smallest earnings of $30,938.
| Educational Attainment | Male Income | Female Income |
| Less than High School | - | - |
| High School Diploma | $36,250 | $0 |
| College or Associate's Degree | $51,042 | $31,477 |
| Bachelor's Degree | $50,263 | $30,938 |
| Graduate Degree | - | - |
| Total | $42,056 | $32,232 |
Family Income in Mountain Village
Family Income Brackets in Mountain Village
According to the Mountain Village family income data, there are 102 families falling into the $200,000+ income range, which is the most common income bracket and makes up 34.5% of all families.
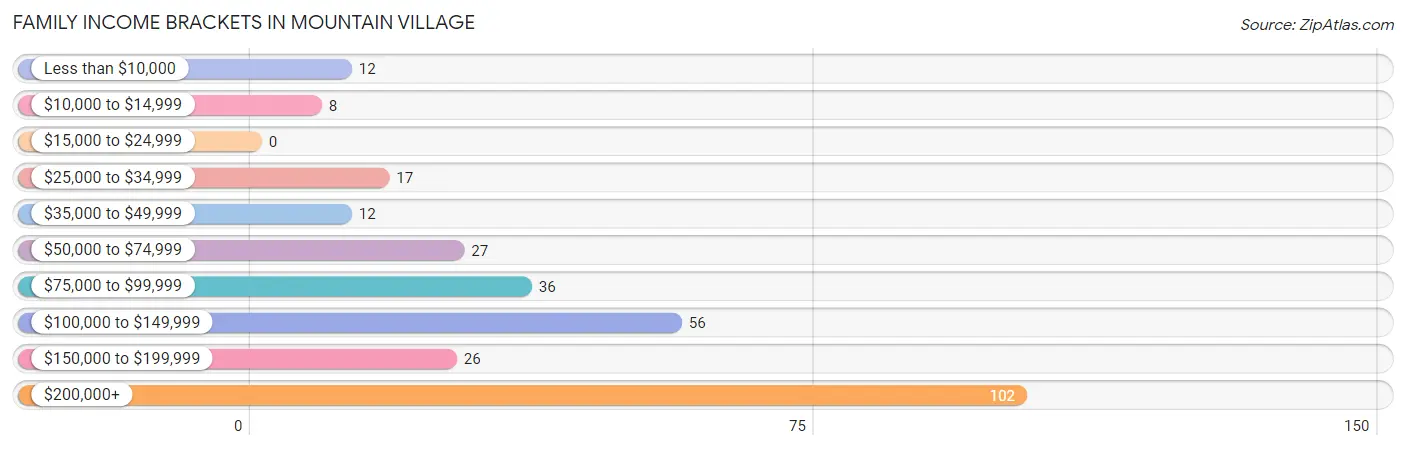
| Income Bracket | # Families | % Families |
| Less than $10,000 | 12 | 4.1% |
| $10,000 to $14,999 | 8 | 2.7% |
| $15,000 to $24,999 | 0 | 0.0% |
| $25,000 to $34,999 | 17 | 5.7% |
| $35,000 to $49,999 | 12 | 4.1% |
| $50,000 to $74,999 | 27 | 9.1% |
| $75,000 to $99,999 | 36 | 12.2% |
| $100,000 to $149,999 | 56 | 18.9% |
| $150,000 to $199,999 | 26 | 8.8% |
| $200,000+ | 102 | 34.5% |
Family Income by Famaliy Size in Mountain Village
4-person families (22 | 7.4%) account for the highest median family income in Mountain Village with $190,833 per family, while 2-person families (198 | 66.9%) have the highest median income of $60,312 per family member.
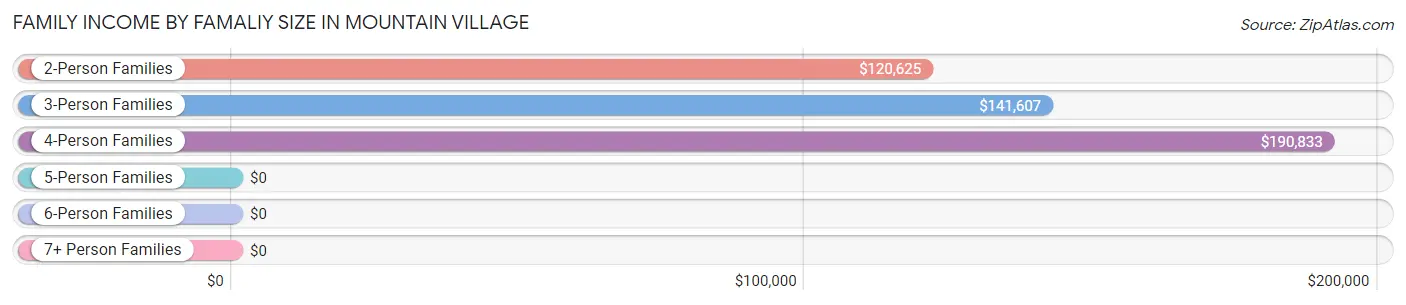
| Income Bracket | # Families | Median Income |
| 2-Person Families | 198 (66.9%) | $120,625 |
| 3-Person Families | 65 (22.0%) | $141,607 |
| 4-Person Families | 22 (7.4%) | $190,833 |
| 5-Person Families | 11 (3.7%) | $0 |
| 6-Person Families | 0 (0.0%) | $0 |
| 7+ Person Families | 0 (0.0%) | $0 |
| Total | 296 (100.0%) | $140,357 |
Family Income by Number of Earners in Mountain Village
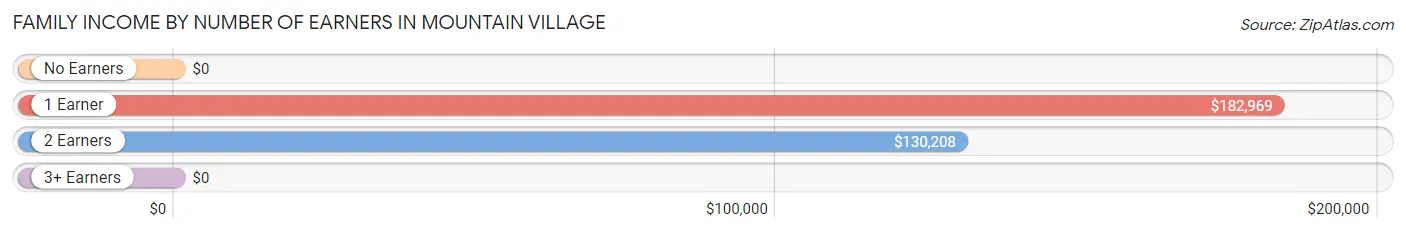
| Number of Earners | # Families | Median Income |
| No Earners | 56 (18.9%) | $0 |
| 1 Earner | 83 (28.0%) | $182,969 |
| 2 Earners | 147 (49.7%) | $130,208 |
| 3+ Earners | 10 (3.4%) | $0 |
| Total | 296 (100.0%) | $140,357 |
Household Income in Mountain Village
Household Income Brackets in Mountain Village
With 149 households falling in the category, the $35,000 to $49,999 income range is the most frequent in Mountain Village, accounting for 17.2% of all households. In contrast, only 30 households (3.5%) fall into the $15,000 to $24,999 income bracket, making it the least populous group.
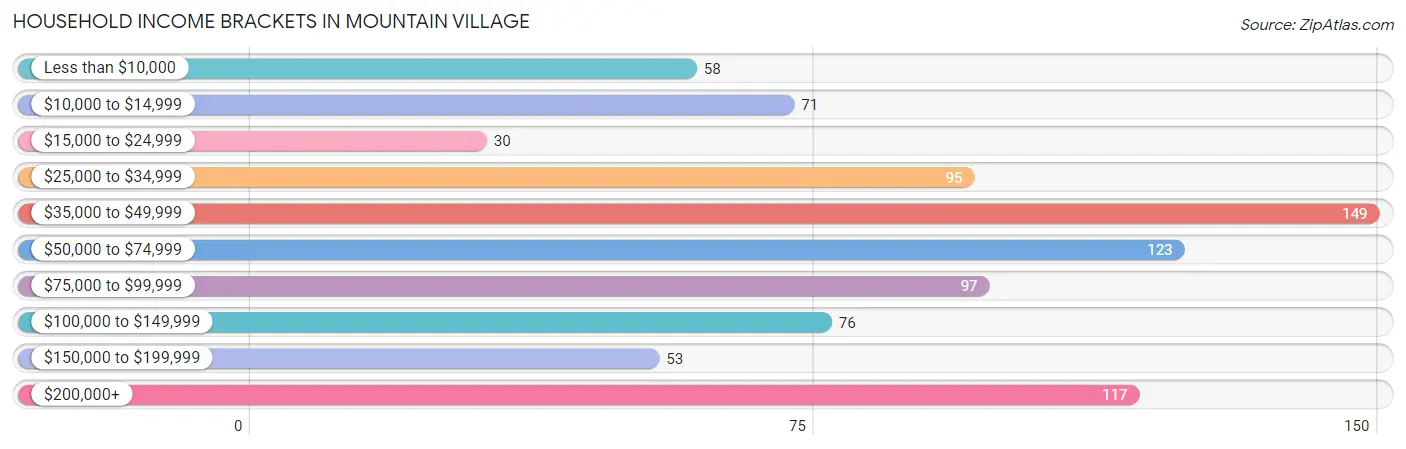
| Income Bracket | # Households | % Households |
| Less than $10,000 | 58 | 6.7% |
| $10,000 to $14,999 | 71 | 8.2% |
| $15,000 to $24,999 | 30 | 3.5% |
| $25,000 to $34,999 | 95 | 10.9% |
| $35,000 to $49,999 | 149 | 17.1% |
| $50,000 to $74,999 | 123 | 14.2% |
| $75,000 to $99,999 | 97 | 11.2% |
| $100,000 to $149,999 | 76 | 8.7% |
| $150,000 to $199,999 | 53 | 6.1% |
| $200,000+ | 117 | 13.5% |
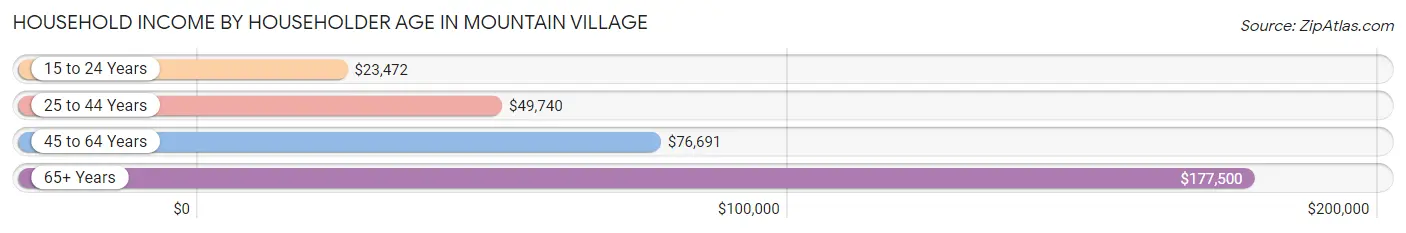
Household Income by Householder Age in Mountain Village
The median household income in Mountain Village is $56,917, with the highest median household income of $177,500 found in the 65+ years age bracket for the primary householder. A total of 126 households (14.5%) fall into this category. Meanwhile, the 15 to 24 years age bracket for the primary householder has the lowest median household income of $23,472, with 113 households (13.0%) in this group.
| Income Bracket | # Households | Median Income |
| 15 to 24 Years | 113 (13.0%) | $23,472 |
| 25 to 44 Years | 415 (47.8%) | $49,740 |
| 45 to 64 Years | 215 (24.7%) | $76,691 |
| 65+ Years | 126 (14.5%) | $177,500 |
| Total | 869 (100.0%) | $56,917 |
Poverty in Mountain Village
Income Below Poverty by Sex and Age in Mountain Village
With 16.1% poverty level for males and 18.8% for females among the residents of Mountain Village, 16 and 17 year old males and 12 to 14 year old females are the most vulnerable to poverty, with 16 males (80.0%) and 9 females (81.8%) in their respective age groups living below the poverty level.
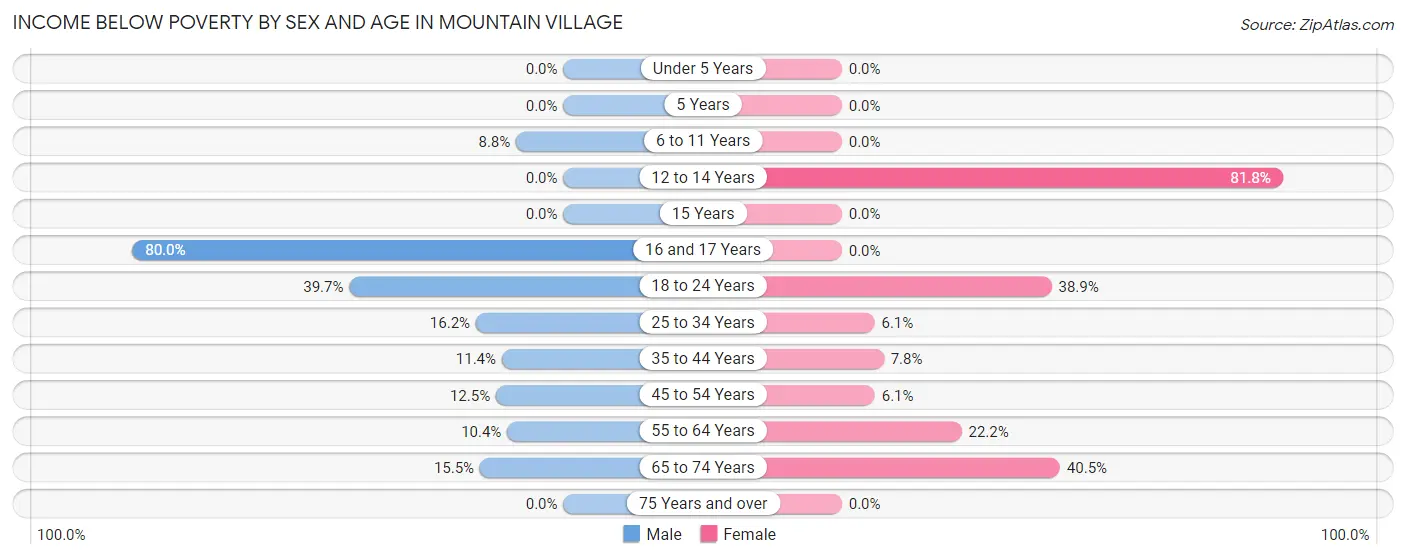
| Age Bracket | Male | Female |
| Under 5 Years | 0 (0.0%) | 0 (0.0%) |
| 5 Years | 0 (0.0%) | 0 (0.0%) |
| 6 to 11 Years | 5 (8.8%) | 0 (0.0%) |
| 12 to 14 Years | 0 (0.0%) | 9 (81.8%) |
| 15 Years | 0 (0.0%) | 0 (0.0%) |
| 16 and 17 Years | 16 (80.0%) | 0 (0.0%) |
| 18 to 24 Years | 31 (39.7%) | 51 (38.9%) |
| 25 to 34 Years | 49 (16.2%) | 11 (6.1%) |
| 35 to 44 Years | 17 (11.4%) | 7 (7.8%) |
| 45 to 54 Years | 8 (12.5%) | 3 (6.1%) |
| 55 to 64 Years | 10 (10.4%) | 26 (22.2%) |
| 65 to 74 Years | 13 (15.5%) | 17 (40.5%) |
| 75 Years and over | 0 (0.0%) | 0 (0.0%) |
| Total | 149 (16.1%) | 124 (18.8%) |
Income Above Poverty by Sex and Age in Mountain Village
According to the poverty statistics in Mountain Village, males aged under 5 years and females aged under 5 years are the age groups that are most secure financially, with 100.0% of males and 100.0% of females in these age groups living above the poverty line.
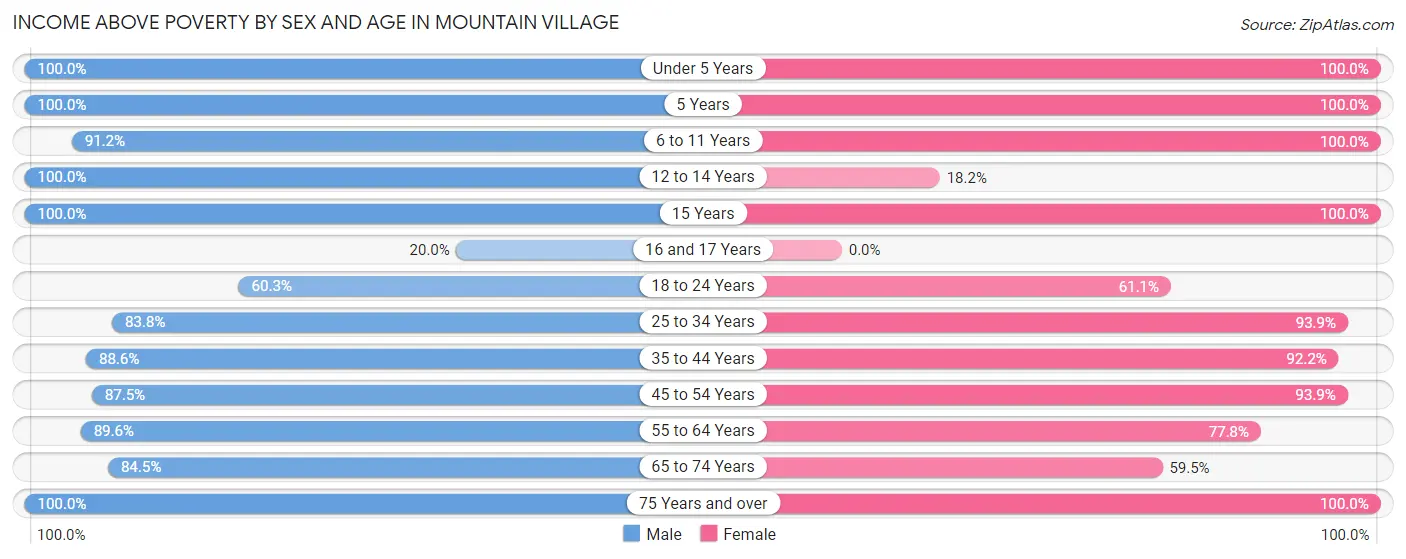
| Age Bracket | Male | Female |
| Under 5 Years | 9 (100.0%) | 13 (100.0%) |
| 5 Years | 6 (100.0%) | 9 (100.0%) |
| 6 to 11 Years | 52 (91.2%) | 7 (100.0%) |
| 12 to 14 Years | 13 (100.0%) | 2 (18.2%) |
| 15 Years | 1 (100.0%) | 5 (100.0%) |
| 16 and 17 Years | 4 (20.0%) | 0 (0.0%) |
| 18 to 24 Years | 47 (60.3%) | 80 (61.1%) |
| 25 to 34 Years | 253 (83.8%) | 170 (93.9%) |
| 35 to 44 Years | 132 (88.6%) | 83 (92.2%) |
| 45 to 54 Years | 56 (87.5%) | 46 (93.9%) |
| 55 to 64 Years | 86 (89.6%) | 91 (77.8%) |
| 65 to 74 Years | 71 (84.5%) | 25 (59.5%) |
| 75 Years and over | 44 (100.0%) | 4 (100.0%) |
| Total | 774 (83.9%) | 535 (81.2%) |
Income Below Poverty Among Married-Couple Families in Mountain Village
The poverty statistics for married-couple families in Mountain Village show that 6.6% or 17 of the total 257 families live below the poverty line. Families with 3 or 4 children have the highest poverty rate of 72.7%, comprising of 8 families. On the other hand, families with 1 or 2 children have the lowest poverty rate of 0.0%, which includes 0 families.
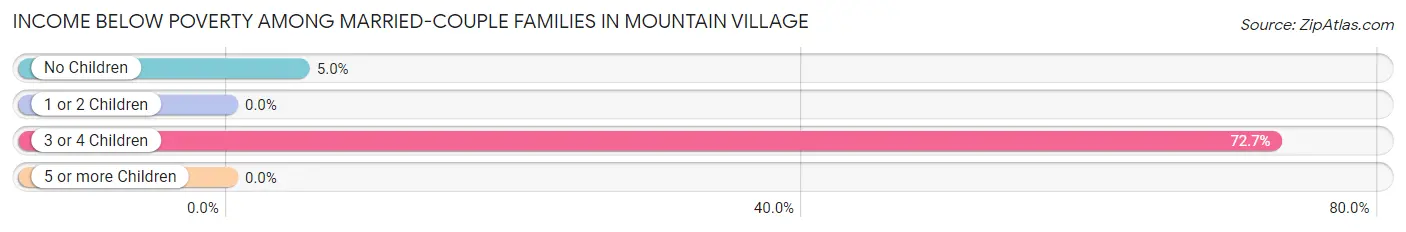
| Children | Above Poverty | Below Poverty |
| No Children | 171 (95.0%) | 9 (5.0%) |
| 1 or 2 Children | 66 (100.0%) | 0 (0.0%) |
| 3 or 4 Children | 3 (27.3%) | 8 (72.7%) |
| 5 or more Children | 0 (0.0%) | 0 (0.0%) |
| Total | 240 (93.4%) | 17 (6.6%) |
Income Below Poverty Among Single-Parent Households in Mountain Village
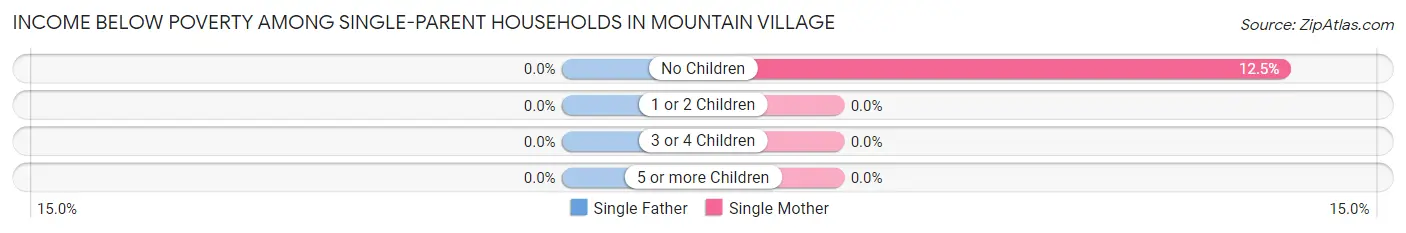
| Children | Single Father | Single Mother |
| No Children | 0 (0.0%) | 3 (12.5%) |
| 1 or 2 Children | 0 (0.0%) | 0 (0.0%) |
| 3 or 4 Children | 0 (0.0%) | 0 (0.0%) |
| 5 or more Children | 0 (0.0%) | 0 (0.0%) |
| Total | 0 (0.0%) | 3 (12.5%) |
Income Below Poverty Among Married-Couple vs Single-Parent Households in Mountain Village
The poverty data for Mountain Village shows that 17 of the married-couple family households (6.6%) and 3 of the single-parent households (7.7%) are living below the poverty level. Within the married-couple family households, those with 3 or 4 children have the highest poverty rate, with 8 households (72.7%) falling below the poverty line. Among the single-parent households, those with no children have the highest poverty rate, with 3 household (12.5%) living below poverty.
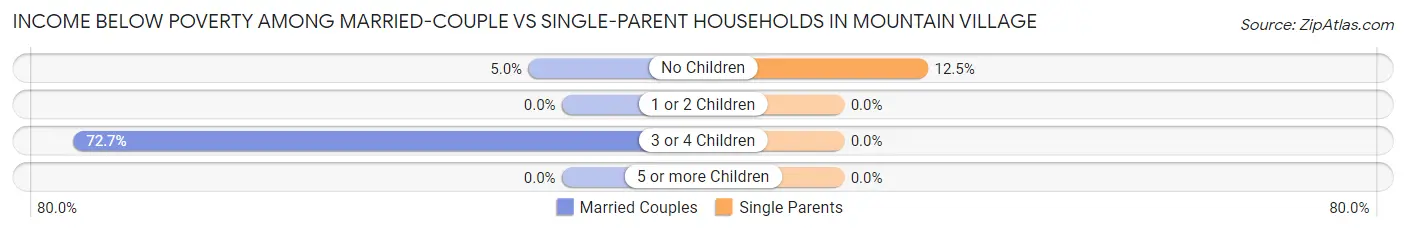
| Children | Married-Couple Families | Single-Parent Households |
| No Children | 9 (5.0%) | 3 (12.5%) |
| 1 or 2 Children | 0 (0.0%) | 0 (0.0%) |
| 3 or 4 Children | 8 (72.7%) | 0 (0.0%) |
| 5 or more Children | 0 (0.0%) | 0 (0.0%) |
| Total | 17 (6.6%) | 3 (7.7%) |
Race in Mountain Village
The most populous races in Mountain Village are White / Caucasian (1,249 | 78.9%), Hispanic or Latino (323 | 20.4%), and Two or more Races (180 | 11.4%).
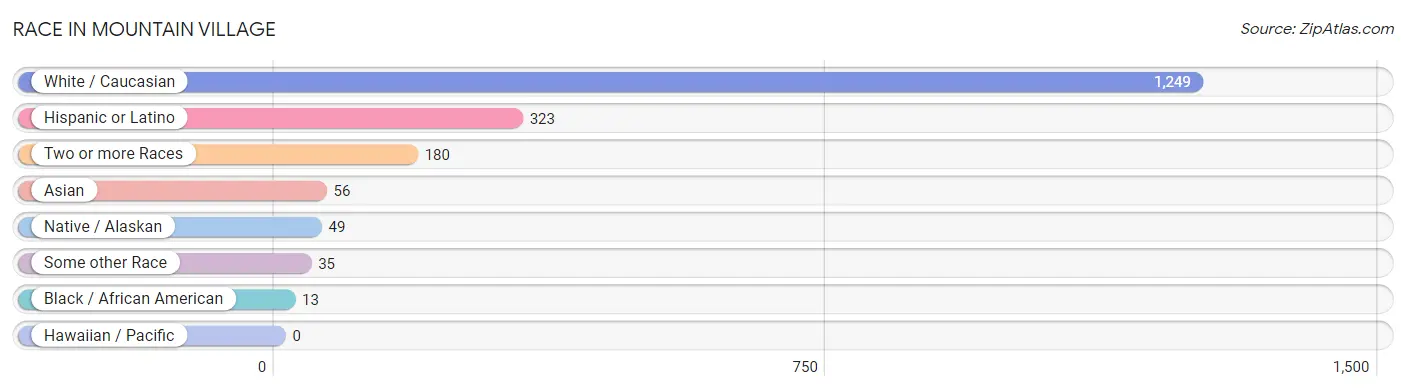
| Race | # Population | % Population |
| Asian | 56 | 3.5% |
| Black / African American | 13 | 0.8% |
| Hawaiian / Pacific | 0 | 0.0% |
| Hispanic or Latino | 323 | 20.4% |
| Native / Alaskan | 49 | 3.1% |
| White / Caucasian | 1,249 | 78.9% |
| Two or more Races | 180 | 11.4% |
| Some other Race | 35 | 2.2% |
| Total | 1,582 | 100.0% |
Ancestry in Mountain Village
The most populous ancestries reported in Mountain Village are Mexican (255 | 16.1%), German (185 | 11.7%), Irish (179 | 11.3%), English (124 | 7.8%), and European (92 | 5.8%), together accounting for 52.8% of all Mountain Village residents.
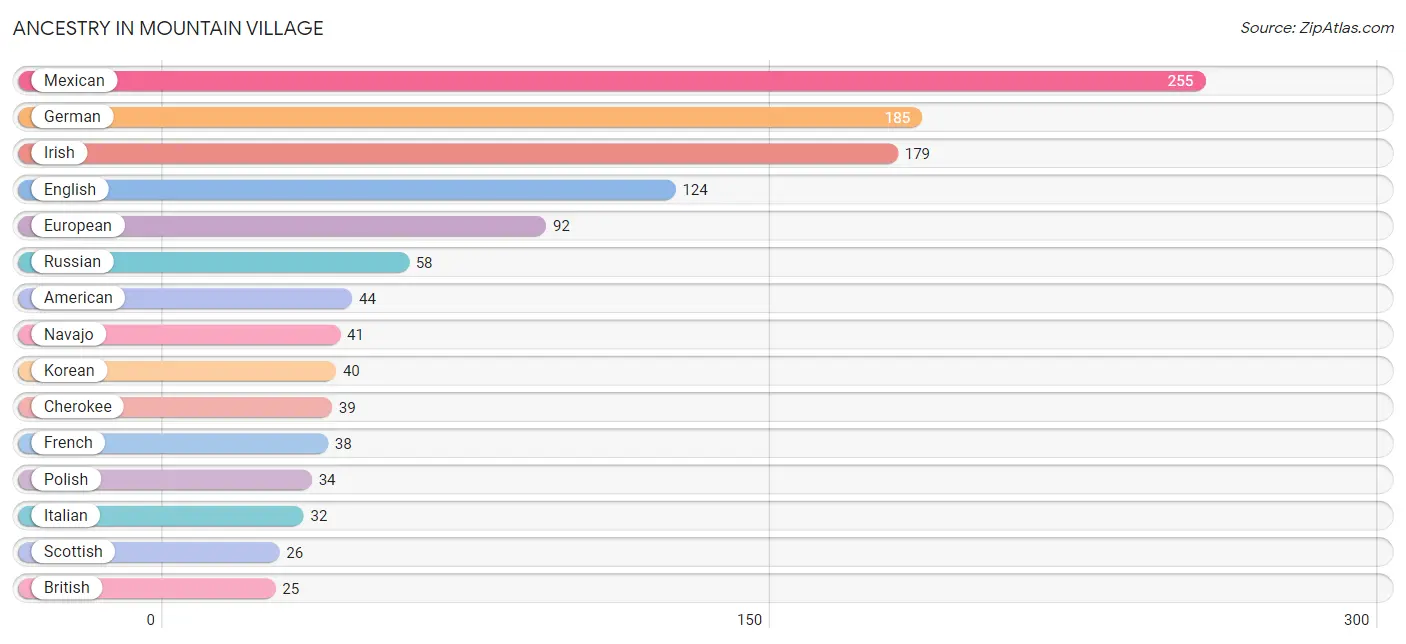
| Ancestry | # Population | % Population |
| American | 44 | 2.8% |
| Arab | 4 | 0.3% |
| Australian | 3 | 0.2% |
| Austrian | 5 | 0.3% |
| British | 25 | 1.6% |
| Canadian | 6 | 0.4% |
| Central American | 11 | 0.7% |
| Cherokee | 39 | 2.5% |
| Cuban | 11 | 0.7% |
| Czech | 16 | 1.0% |
| Danish | 8 | 0.5% |
| Dutch | 15 | 0.9% |
| English | 124 | 7.8% |
| European | 92 | 5.8% |
| Finnish | 2 | 0.1% |
| French | 38 | 2.4% |
| French Canadian | 4 | 0.3% |
| German | 185 | 11.7% |
| Hungarian | 7 | 0.4% |
| Indian (Asian) | 10 | 0.6% |
| Irish | 179 | 11.3% |
| Italian | 32 | 2.0% |
| Korean | 40 | 2.5% |
| Lebanese | 4 | 0.3% |
| Lithuanian | 2 | 0.1% |
| Mexican | 255 | 16.1% |
| Navajo | 41 | 2.6% |
| Northern European | 9 | 0.6% |
| Norwegian | 6 | 0.4% |
| Pakistani | 6 | 0.4% |
| Panamanian | 11 | 0.7% |
| Polish | 34 | 2.1% |
| Portuguese | 7 | 0.4% |
| Romanian | 24 | 1.5% |
| Russian | 58 | 3.7% |
| Scandinavian | 12 | 0.8% |
| Scotch-Irish | 24 | 1.5% |
| Scottish | 26 | 1.6% |
| Slovene | 4 | 0.3% |
| Spanish | 10 | 0.6% |
| Swedish | 11 | 0.7% |
| Swiss | 3 | 0.2% |
| Ukrainian | 6 | 0.4% |
| Welsh | 6 | 0.4% | View All 44 Rows |
Immigrants in Mountain Village
The most numerous immigrant groups reported in Mountain Village came from Latin America (194 | 12.3%), Central America (184 | 11.6%), Mexico (184 | 11.6%), Asia (61 | 3.9%), and South Eastern Asia (57 | 3.6%), together accounting for 43.0% of all Mountain Village residents.
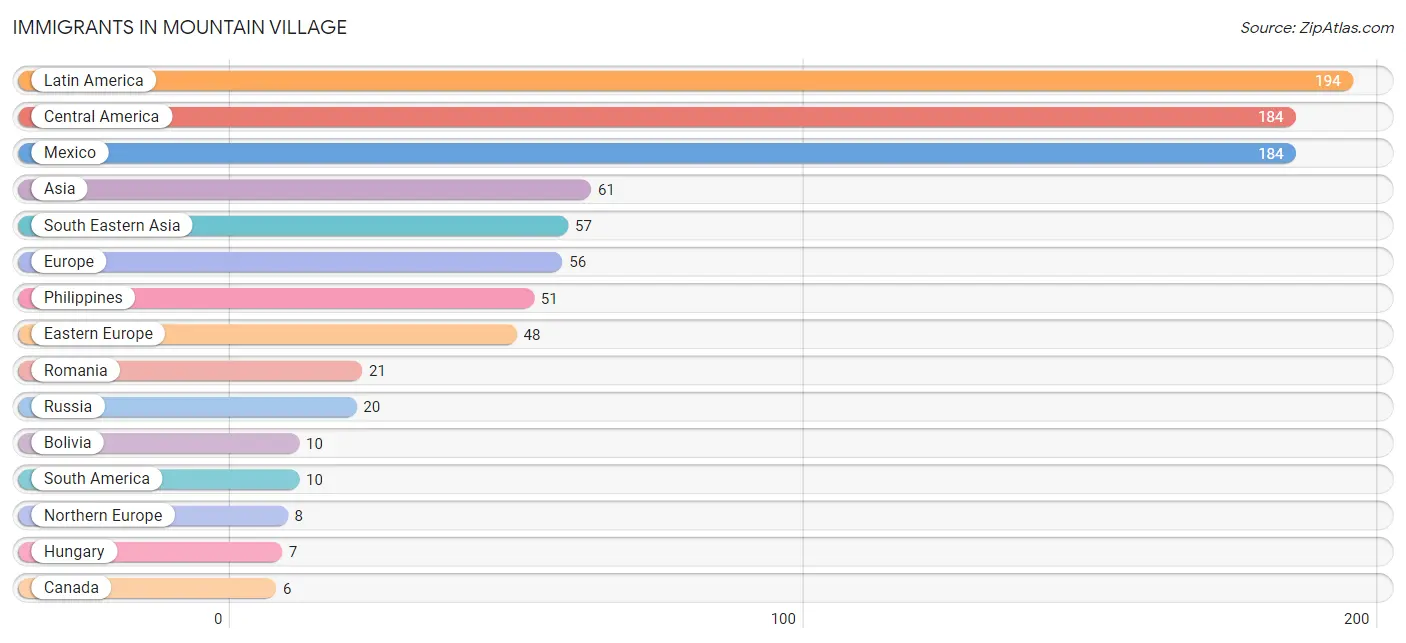
| Immigration Origin | # Population | % Population |
| Asia | 61 | 3.9% |
| Australia | 3 | 0.2% |
| Bolivia | 10 | 0.6% |
| Canada | 6 | 0.4% |
| Central America | 184 | 11.6% |
| China | 4 | 0.3% |
| Eastern Asia | 4 | 0.3% |
| Eastern Europe | 48 | 3.0% |
| Europe | 56 | 3.5% |
| Hong Kong | 4 | 0.3% |
| Hungary | 7 | 0.4% |
| Latin America | 194 | 12.3% |
| Mexico | 184 | 11.6% |
| Northern Europe | 8 | 0.5% |
| Oceania | 3 | 0.2% |
| Philippines | 51 | 3.2% |
| Romania | 21 | 1.3% |
| Russia | 20 | 1.3% |
| Scotland | 5 | 0.3% |
| South America | 10 | 0.6% |
| South Eastern Asia | 57 | 3.6% |
| Thailand | 6 | 0.4% | View All 22 Rows |
Sex and Age in Mountain Village
Sex and Age in Mountain Village
The most populous age groups in Mountain Village are 25 to 29 Years (154 | 16.7%) for men and 25 to 29 Years (143 | 21.7%) for women.
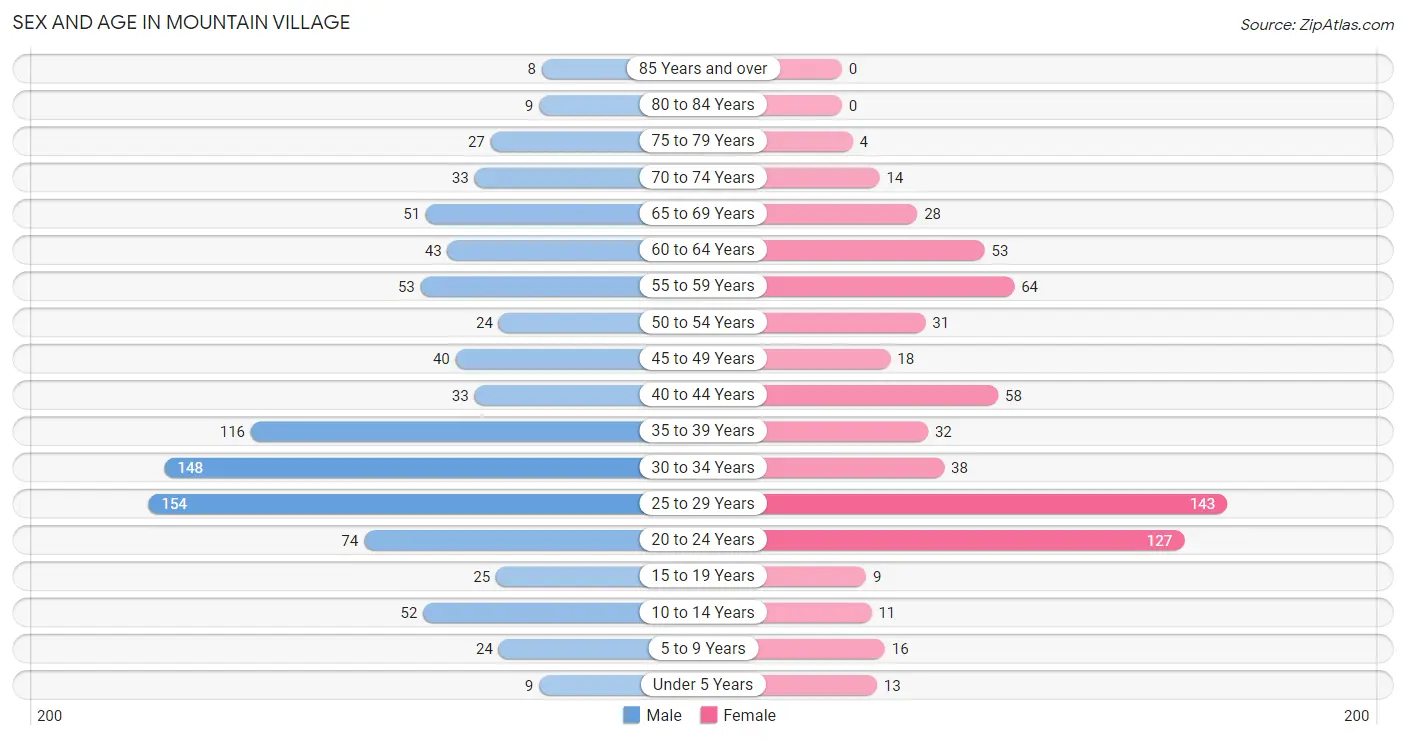
| Age Bracket | Male | Female |
| Under 5 Years | 9 (1.0%) | 13 (2.0%) |
| 5 to 9 Years | 24 (2.6%) | 16 (2.4%) |
| 10 to 14 Years | 52 (5.6%) | 11 (1.7%) |
| 15 to 19 Years | 25 (2.7%) | 9 (1.4%) |
| 20 to 24 Years | 74 (8.0%) | 127 (19.3%) |
| 25 to 29 Years | 154 (16.7%) | 143 (21.7%) |
| 30 to 34 Years | 148 (16.0%) | 38 (5.8%) |
| 35 to 39 Years | 116 (12.6%) | 32 (4.9%) |
| 40 to 44 Years | 33 (3.6%) | 58 (8.8%) |
| 45 to 49 Years | 40 (4.3%) | 18 (2.7%) |
| 50 to 54 Years | 24 (2.6%) | 31 (4.7%) |
| 55 to 59 Years | 53 (5.7%) | 64 (9.7%) |
| 60 to 64 Years | 43 (4.7%) | 53 (8.0%) |
| 65 to 69 Years | 51 (5.5%) | 28 (4.3%) |
| 70 to 74 Years | 33 (3.6%) | 14 (2.1%) |
| 75 to 79 Years | 27 (2.9%) | 4 (0.6%) |
| 80 to 84 Years | 9 (1.0%) | 0 (0.0%) |
| 85 Years and over | 8 (0.9%) | 0 (0.0%) |
| Total | 923 (100.0%) | 659 (100.0%) |
Families and Households in Mountain Village
Median Family Size in Mountain Village
The median family size in Mountain Village is 2.50 persons per family, with married-couple families (257 | 86.8%) accounting for the largest median family size of 2.53 persons per family. On the other hand, single male/father families (15 | 5.1%) represent the smallest median family size with 2.20 persons per family.
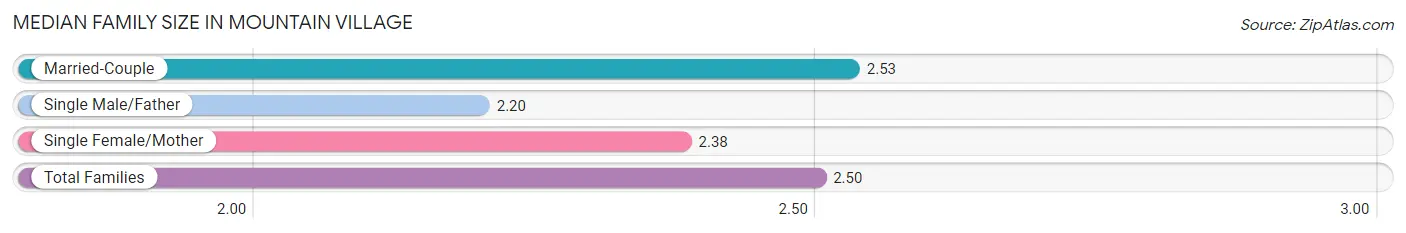
| Family Type | # Families | Family Size |
| Married-Couple | 257 (86.8%) | 2.53 |
| Single Male/Father | 15 (5.1%) | 2.20 |
| Single Female/Mother | 24 (8.1%) | 2.38 |
| Total Families | 296 (100.0%) | 2.50 |
Median Household Size in Mountain Village
The median household size in Mountain Village is 1.82 persons per household, with married-couple households (257 | 29.6%) accounting for the largest median household size of 2.54 persons per household. non-family households (573 | 65.9%) represent the smallest median household size with 1.45 persons per household.
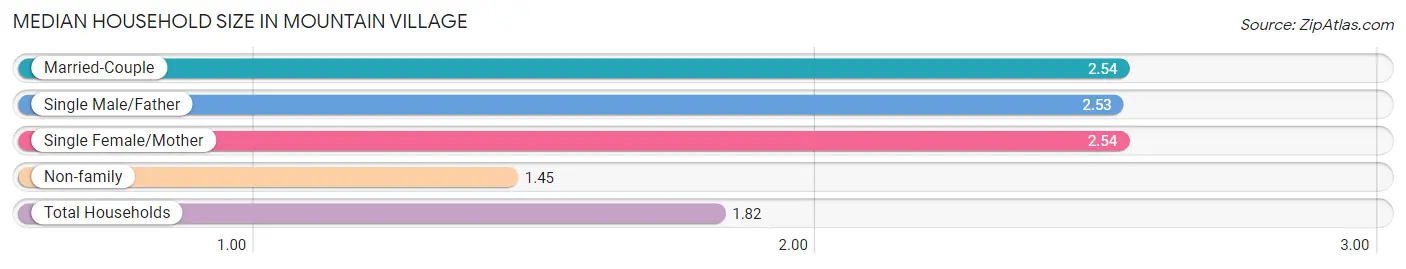
| Household Type | # Households | Household Size |
| Married-Couple | 257 (29.6%) | 2.54 |
| Single Male/Father | 15 (1.7%) | 2.53 |
| Single Female/Mother | 24 (2.8%) | 2.54 |
| Non-family | 573 (65.9%) | 1.45 |
| Total Households | 869 (100.0%) | 1.82 |
Household Size by Marriage Status in Mountain Village
Out of a total of 869 households in Mountain Village, 296 (34.1%) are family households, while 573 (65.9%) are nonfamily households. The most numerous type of family households are 2-person households, comprising 193, and the most common type of nonfamily households are 1-person households, comprising 415.
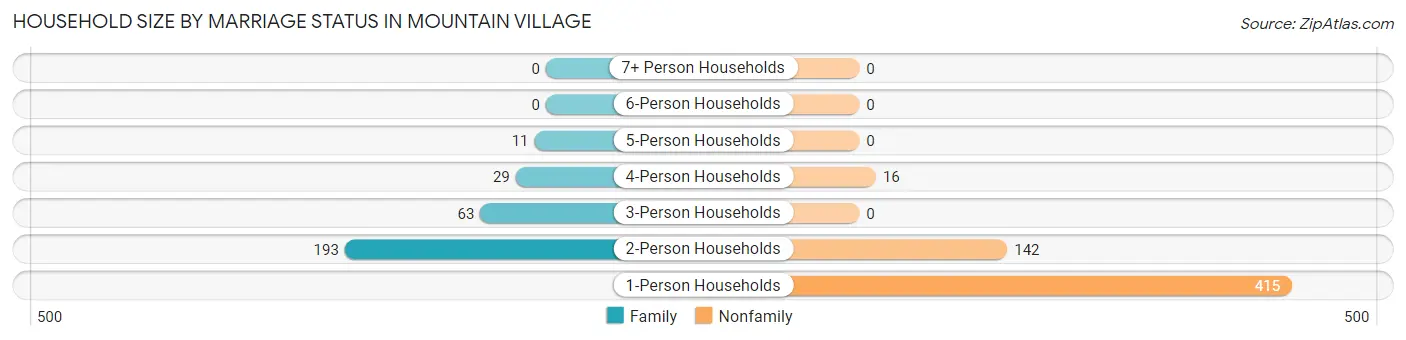
| Household Size | Family Households | Nonfamily Households |
| 1-Person Households | - | 415 (47.8%) |
| 2-Person Households | 193 (22.2%) | 142 (16.3%) |
| 3-Person Households | 63 (7.2%) | 0 (0.0%) |
| 4-Person Households | 29 (3.3%) | 16 (1.8%) |
| 5-Person Households | 11 (1.3%) | 0 (0.0%) |
| 6-Person Households | 0 (0.0%) | 0 (0.0%) |
| 7+ Person Households | 0 (0.0%) | 0 (0.0%) |
| Total | 296 (34.1%) | 573 (65.9%) |
Female Fertility in Mountain Village
Fertility by Age in Mountain Village
Average fertility rate in Mountain Village is 47.0 births per 1,000 women. Women in the age bracket of 20 to 34 years have the highest fertility rate with 55.0 births per 1,000 women. Women in the age bracket of 20 to 34 years acount for 85.0% of all women with births.
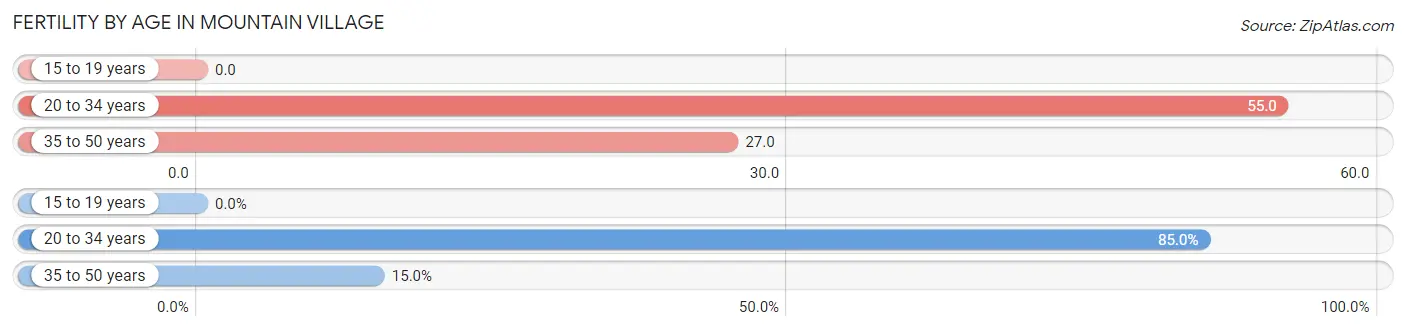
| Age Bracket | Women with Births | Births / 1,000 Women |
| 15 to 19 years | 0 (0.0%) | 0.0 |
| 20 to 34 years | 17 (85.0%) | 55.0 |
| 35 to 50 years | 3 (15.0%) | 27.0 |
| Total | 20 (100.0%) | 47.0 |
Fertility by Age by Marriage Status in Mountain Village
15.0% of women with births (20) in Mountain Village are married. The highest percentage of unmarried women with births falls into 20 to 34 years age bracket with 100.0% of them unmarried at the time of birth, while the lowest percentage of unmarried women with births belong to 35 to 50 years age bracket with 0.0% of them unmarried.
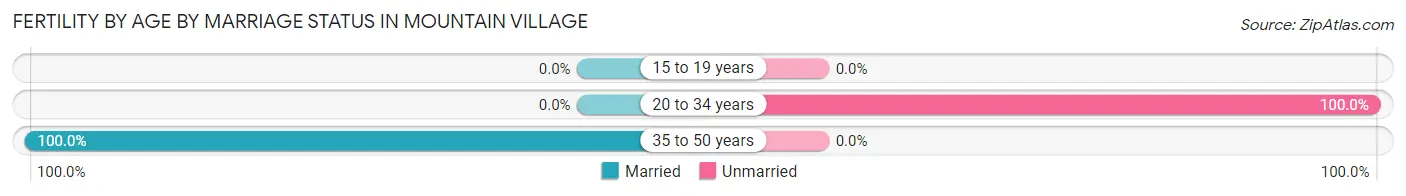
| Age Bracket | Married | Unmarried |
| 15 to 19 years | 0 (0.0%) | 0 (0.0%) |
| 20 to 34 years | 0 (0.0%) | 17 (100.0%) |
| 35 to 50 years | 3 (100.0%) | 0 (0.0%) |
| Total | 3 (15.0%) | 17 (85.0%) |
Fertility by Education in Mountain Village
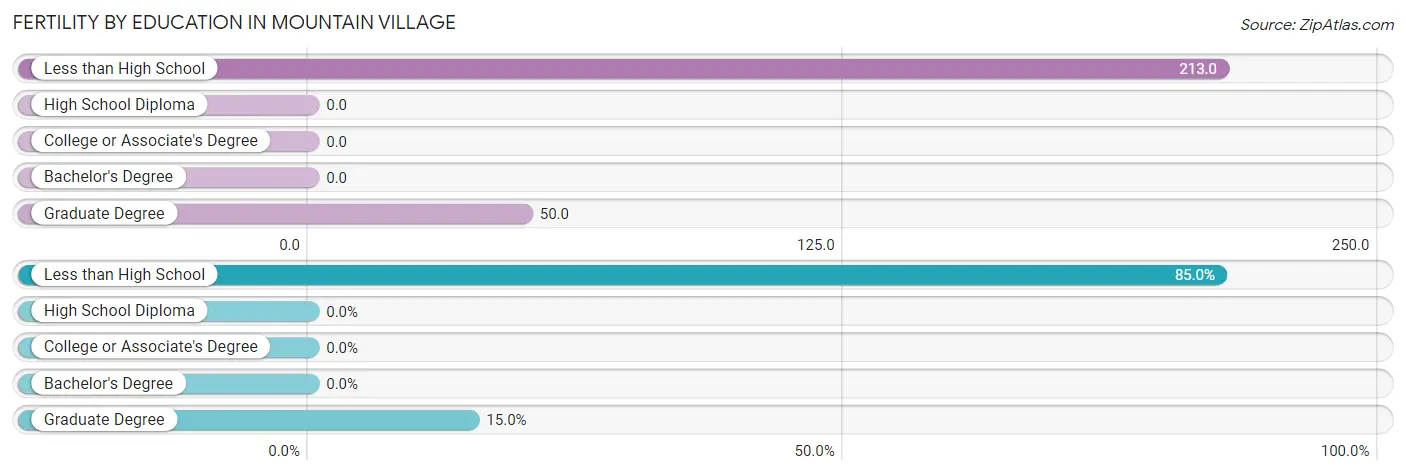
| Educational Attainment | Women with Births | Births / 1,000 Women |
| Less than High School | 17 (85.0%) | 213.0 |
| High School Diploma | 0 (0.0%) | 0.0 |
| College or Associate's Degree | 0 (0.0%) | 0.0 |
| Bachelor's Degree | 0 (0.0%) | 0.0 |
| Graduate Degree | 3 (15.0%) | 50.0 |
| Total | 20 (100.0%) | 47.0 |
Fertility by Education by Marriage Status in Mountain Village
85.0% of women with births in Mountain Village are unmarried. Women with the educational attainment of graduate degree are most likely to be married with 100.0% of them married at childbirth, while women with the educational attainment of less than high school are least likely to be married with 100.0% of them unmarried at childbirth.
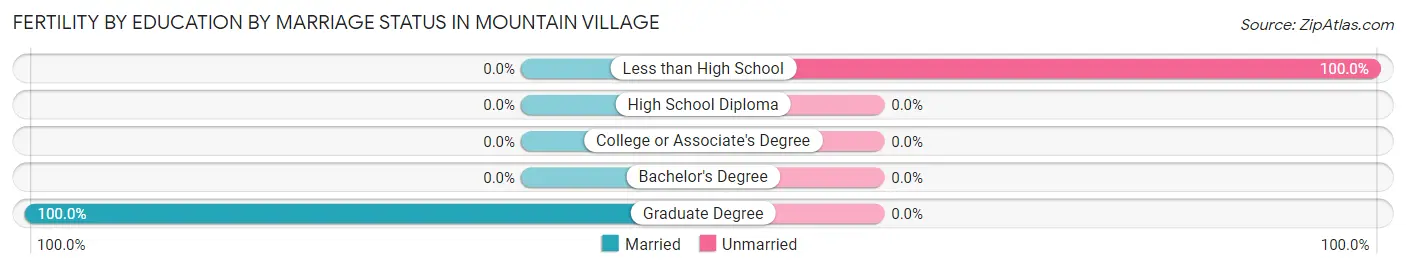
| Educational Attainment | Married | Unmarried |
| Less than High School | 0 (0.0%) | 17 (100.0%) |
| High School Diploma | 0 (0.0%) | 0 (0.0%) |
| College or Associate's Degree | 0 (0.0%) | 0 (0.0%) |
| Bachelor's Degree | 0 (0.0%) | 0 (0.0%) |
| Graduate Degree | 3 (100.0%) | 0 (0.0%) |
| Total | 3 (15.0%) | 17 (85.0%) |
Employment Characteristics in Mountain Village
Employment by Class of Employer in Mountain Village
Among the 1,066 employed individuals in Mountain Village, private company employees (796 | 74.7%), local government employees (100 | 9.4%), and self-employed (incorporated) (51 | 4.8%) make up the most common classes of employment.
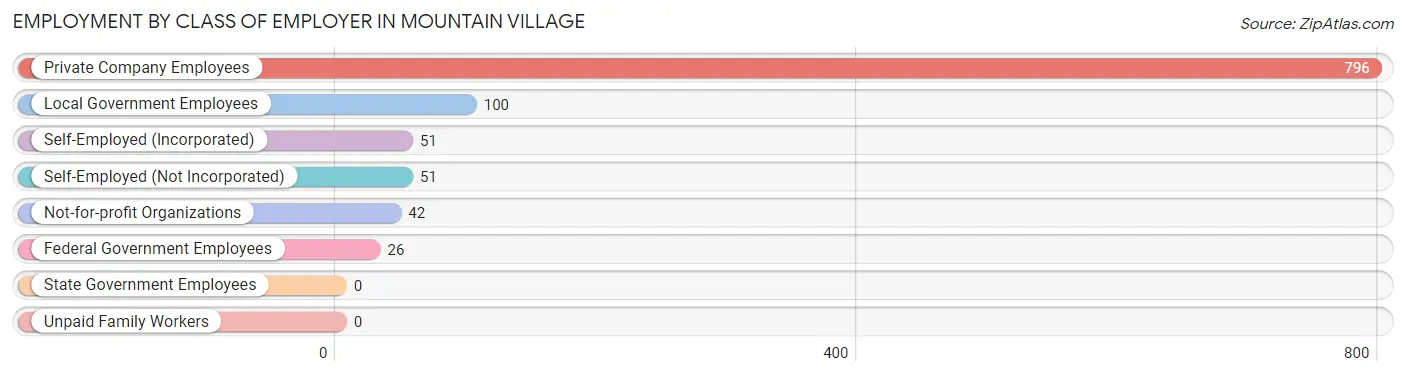
| Employer Class | # Employees | % Employees |
| Private Company Employees | 796 | 74.7% |
| Self-Employed (Incorporated) | 51 | 4.8% |
| Self-Employed (Not Incorporated) | 51 | 4.8% |
| Not-for-profit Organizations | 42 | 3.9% |
| Local Government Employees | 100 | 9.4% |
| State Government Employees | 0 | 0.0% |
| Federal Government Employees | 26 | 2.4% |
| Unpaid Family Workers | 0 | 0.0% |
| Total | 1,066 | 100.0% |
Employment Status by Age in Mountain Village
According to the labor force statistics for Mountain Village, out of the total population over 16 years of age (1,451), 77.9% or 1,130 individuals are in the labor force, with 5.5% or 62 of them unemployed. The age group with the highest labor force participation rate is 25 to 29 years, with 100.0% or 297 individuals in the labor force. Within the labor force, the 55 to 59 years age range has the highest percentage of unemployed individuals, with 14.8% or 13 of them being unemployed.
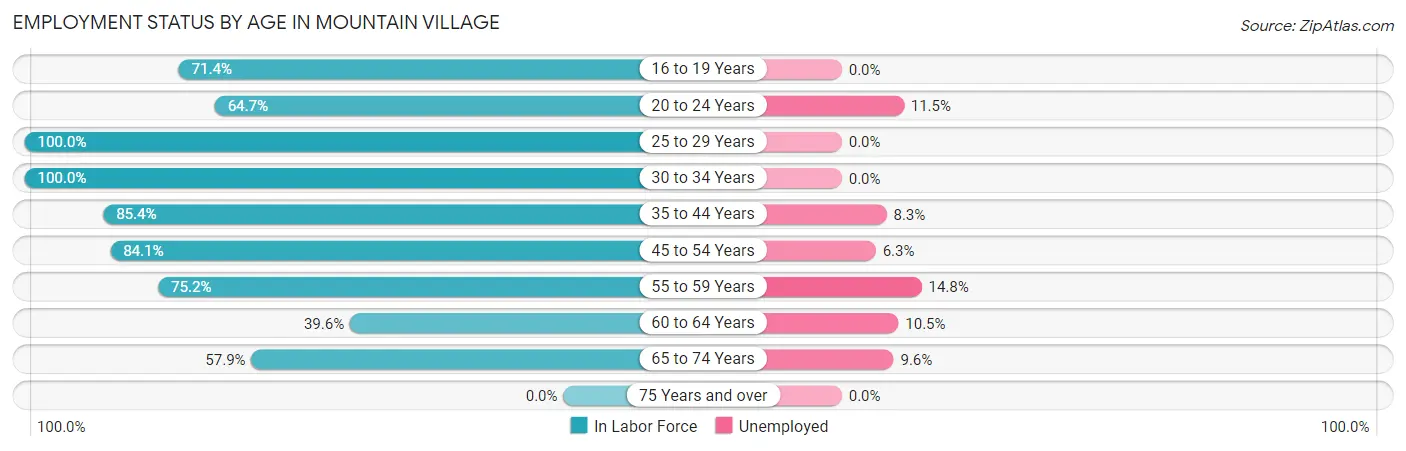
| Age Bracket | In Labor Force | Unemployed |
| 16 to 19 Years | 20 (71.4%) | 0 (0.0%) |
| 20 to 24 Years | 130 (64.7%) | 15 (11.5%) |
| 25 to 29 Years | 297 (100.0%) | 0 (0.0%) |
| 30 to 34 Years | 186 (100.0%) | 0 (0.0%) |
| 35 to 44 Years | 204 (85.4%) | 17 (8.3%) |
| 45 to 54 Years | 95 (84.1%) | 6 (6.3%) |
| 55 to 59 Years | 88 (75.2%) | 13 (14.8%) |
| 60 to 64 Years | 38 (39.6%) | 4 (10.5%) |
| 65 to 74 Years | 73 (57.9%) | 7 (9.6%) |
| 75 Years and over | 0 (0.0%) | 0 (0.0%) |
| Total | 1,130 (77.9%) | 62 (5.5%) |
Employment Status by Educational Attainment in Mountain Village
According to labor force statistics for Mountain Village, 86.6% of individuals (908) out of the total population between 25 and 64 years of age (1,048) are in the labor force, with 4.4% or 40 of them being unemployed. The group with the highest labor force participation rate are those with the educational attainment of high school diploma, with 98.4% or 241 individuals in the labor force. Within the labor force, individuals with college / associate degree education have the highest percentage of unemployment, with 5.2% or 10 of them being unemployed.
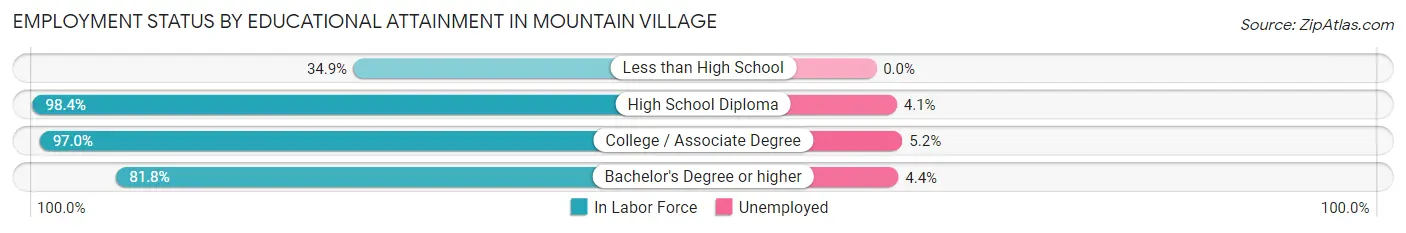
| Educational Attainment | In Labor Force | Unemployed |
| Less than High School | 15 (34.9%) | 0 (0.0%) |
| High School Diploma | 241 (98.4%) | 10 (4.1%) |
| College / Associate Degree | 193 (97.0%) | 10 (5.2%) |
| Bachelor's Degree or higher | 459 (81.8%) | 25 (4.4%) |
| Total | 908 (86.6%) | 46 (4.4%) |
Employment Occupations by Sex in Mountain Village
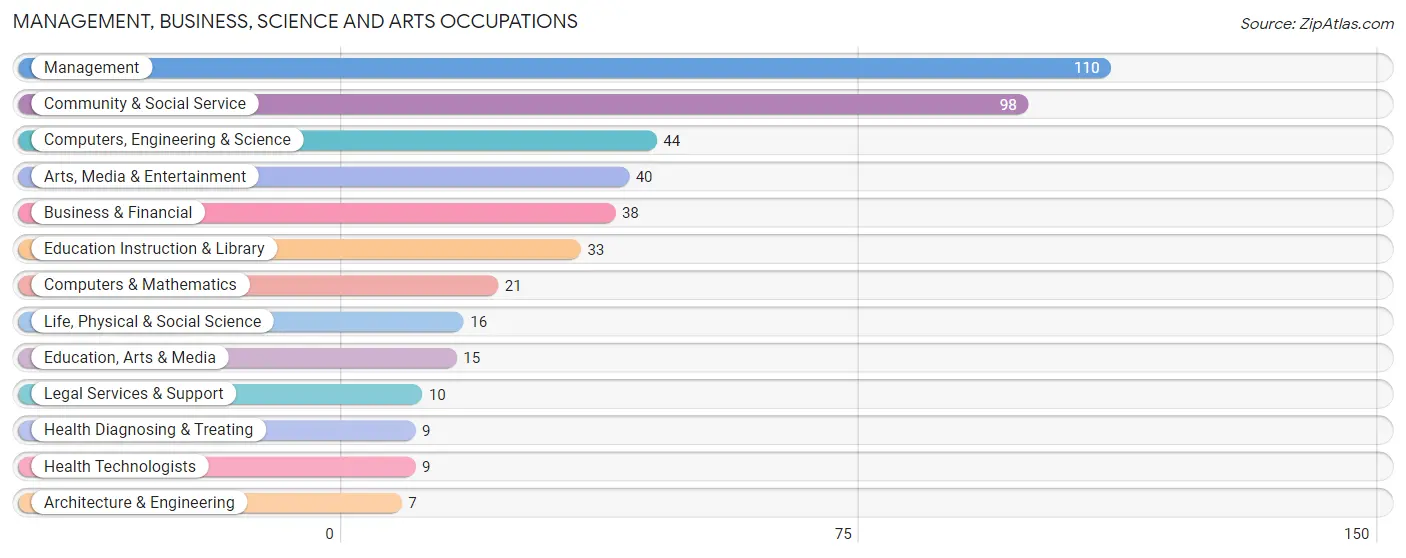
Management, Business, Science and Arts Occupations
The most common Management, Business, Science and Arts occupations in Mountain Village are Management (110 | 10.3%), Community & Social Service (98 | 9.2%), Computers, Engineering & Science (44 | 4.1%), Arts, Media & Entertainment (40 | 3.7%), and Business & Financial (38 | 3.5%).
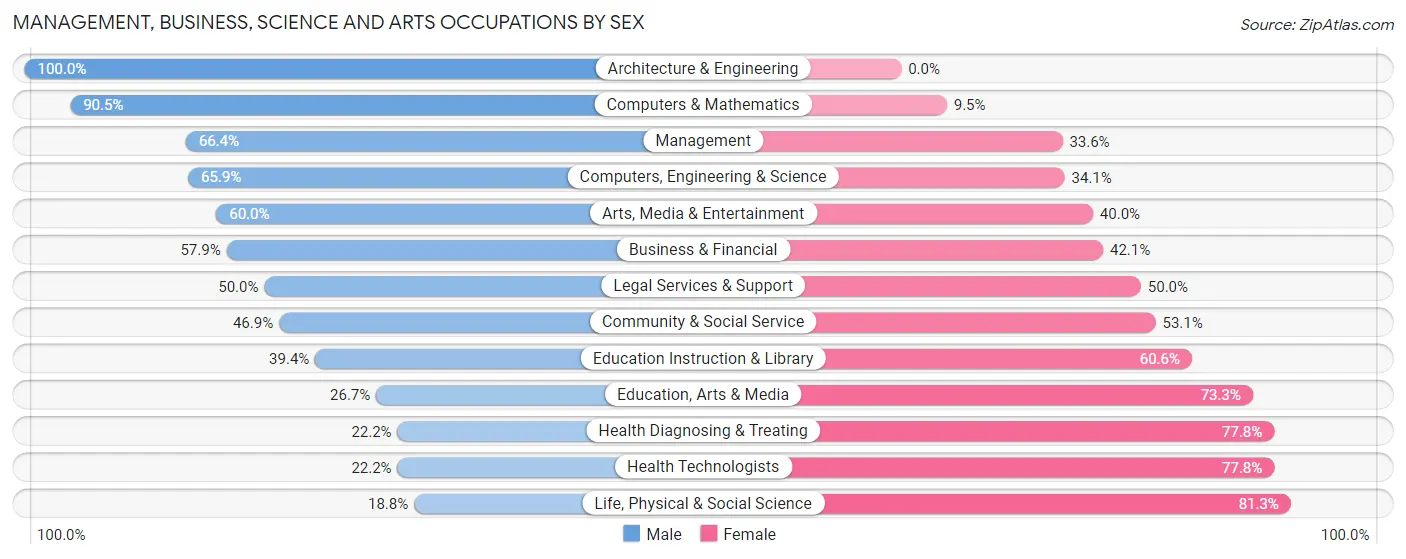
Management, Business, Science and Arts Occupations by Sex
Within the Management, Business, Science and Arts occupations in Mountain Village, the most male-oriented occupations are Architecture & Engineering (100.0%), Computers & Mathematics (90.5%), and Management (66.4%), while the most female-oriented occupations are Life, Physical & Social Science (81.2%), Health Diagnosing & Treating (77.8%), and Health Technologists (77.8%).
| Occupation | Male | Female |
| Management | 73 (66.4%) | 37 (33.6%) |
| Business & Financial | 22 (57.9%) | 16 (42.1%) |
| Computers, Engineering & Science | 29 (65.9%) | 15 (34.1%) |
| Computers & Mathematics | 19 (90.5%) | 2 (9.5%) |
| Architecture & Engineering | 7 (100.0%) | 0 (0.0%) |
| Life, Physical & Social Science | 3 (18.8%) | 13 (81.2%) |
| Community & Social Service | 46 (46.9%) | 52 (53.1%) |
| Education, Arts & Media | 4 (26.7%) | 11 (73.3%) |
| Legal Services & Support | 5 (50.0%) | 5 (50.0%) |
| Education Instruction & Library | 13 (39.4%) | 20 (60.6%) |
| Arts, Media & Entertainment | 24 (60.0%) | 16 (40.0%) |
| Health Diagnosing & Treating | 2 (22.2%) | 7 (77.8%) |
| Health Technologists | 2 (22.2%) | 7 (77.8%) |
| Total (Category) | 172 (57.5%) | 127 (42.5%) |
| Total (Overall) | 685 (64.1%) | 384 (35.9%) |
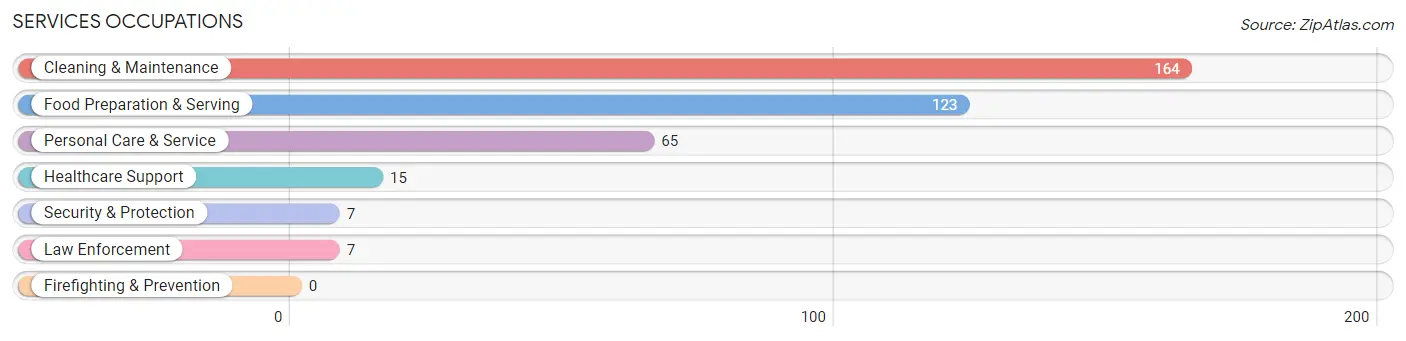
Services Occupations
The most common Services occupations in Mountain Village are Cleaning & Maintenance (164 | 15.3%), Food Preparation & Serving (123 | 11.5%), Personal Care & Service (65 | 6.1%), Healthcare Support (15 | 1.4%), and Security & Protection (7 | 0.6%).
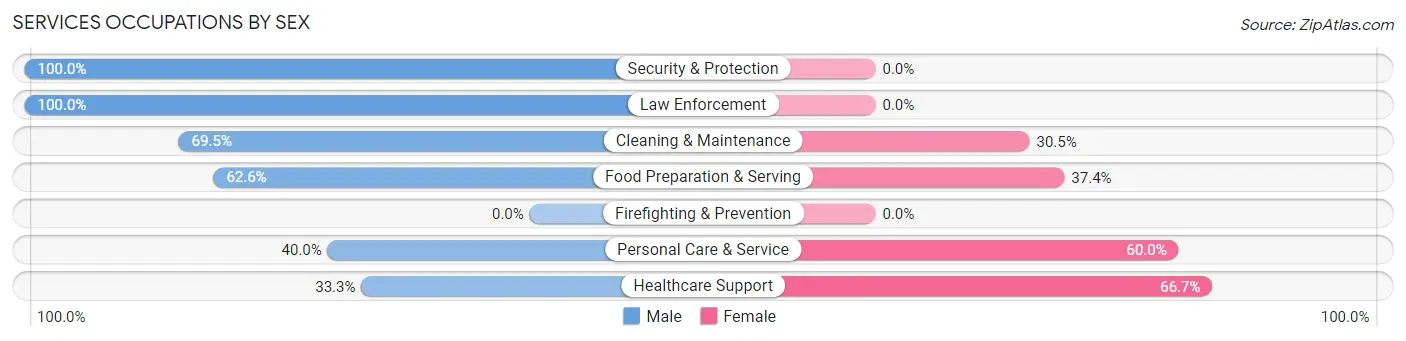
Services Occupations by Sex
Within the Services occupations in Mountain Village, the most male-oriented occupations are Security & Protection (100.0%), Law Enforcement (100.0%), and Cleaning & Maintenance (69.5%), while the most female-oriented occupations are Healthcare Support (66.7%), Personal Care & Service (60.0%), and Food Preparation & Serving (37.4%).
| Occupation | Male | Female |
| Healthcare Support | 5 (33.3%) | 10 (66.7%) |
| Security & Protection | 7 (100.0%) | 0 (0.0%) |
| Firefighting & Prevention | 0 (0.0%) | 0 (0.0%) |
| Law Enforcement | 7 (100.0%) | 0 (0.0%) |
| Food Preparation & Serving | 77 (62.6%) | 46 (37.4%) |
| Cleaning & Maintenance | 114 (69.5%) | 50 (30.5%) |
| Personal Care & Service | 26 (40.0%) | 39 (60.0%) |
| Total (Category) | 229 (61.2%) | 145 (38.8%) |
| Total (Overall) | 685 (64.1%) | 384 (35.9%) |
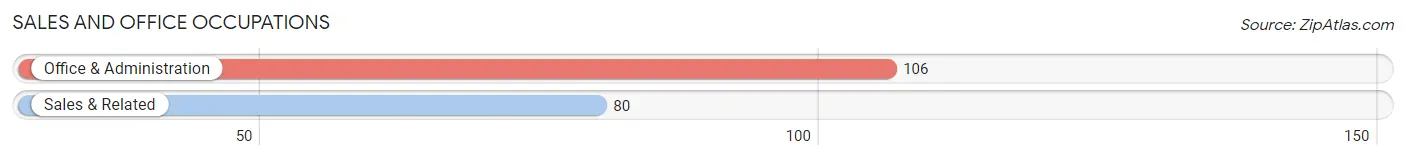
Sales and Office Occupations
The most common Sales and Office occupations in Mountain Village are Office & Administration (106 | 9.9%), and Sales & Related (80 | 7.5%).
Sales and Office Occupations by Sex
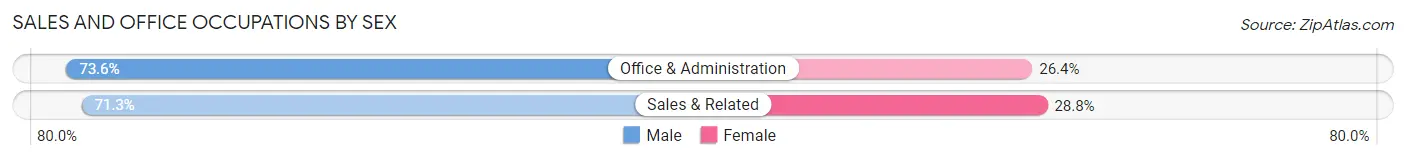
| Occupation | Male | Female |
| Sales & Related | 57 (71.3%) | 23 (28.7%) |
| Office & Administration | 78 (73.6%) | 28 (26.4%) |
| Total (Category) | 135 (72.6%) | 51 (27.4%) |
| Total (Overall) | 685 (64.1%) | 384 (35.9%) |
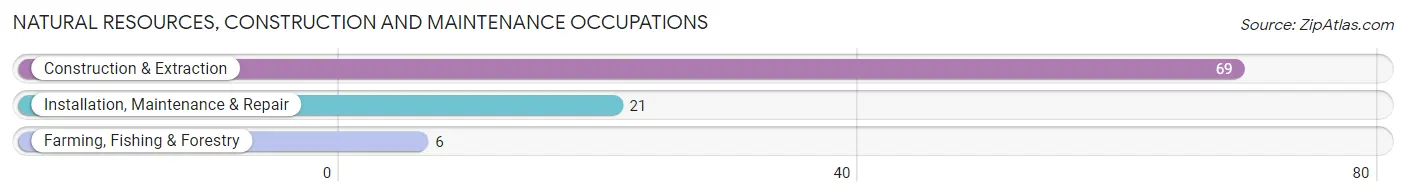
Natural Resources, Construction and Maintenance Occupations
The most common Natural Resources, Construction and Maintenance occupations in Mountain Village are Construction & Extraction (69 | 6.5%), Installation, Maintenance & Repair (21 | 2.0%), and Farming, Fishing & Forestry (6 | 0.6%).
Natural Resources, Construction and Maintenance Occupations by Sex
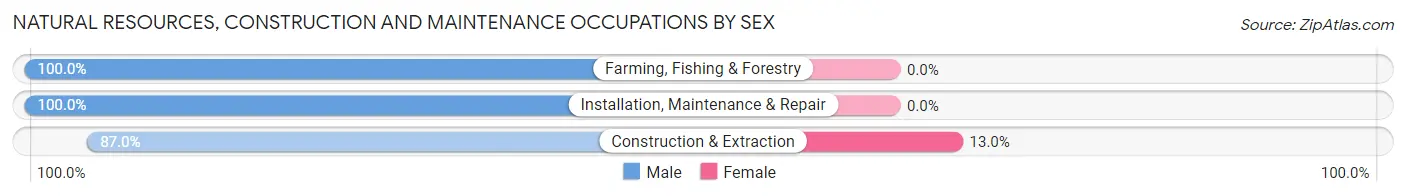
| Occupation | Male | Female |
| Farming, Fishing & Forestry | 6 (100.0%) | 0 (0.0%) |
| Construction & Extraction | 60 (87.0%) | 9 (13.0%) |
| Installation, Maintenance & Repair | 21 (100.0%) | 0 (0.0%) |
| Total (Category) | 87 (90.6%) | 9 (9.4%) |
| Total (Overall) | 685 (64.1%) | 384 (35.9%) |
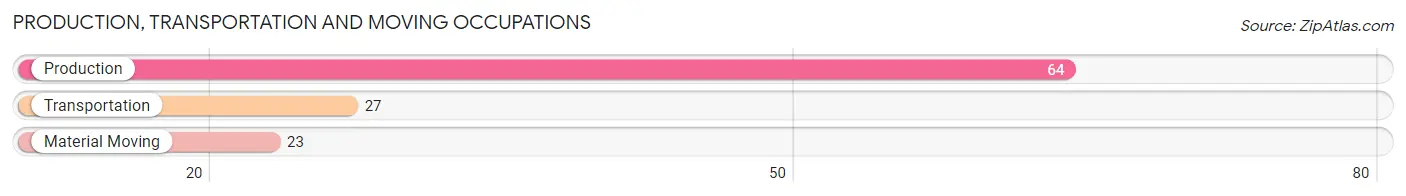
Production, Transportation and Moving Occupations
The most common Production, Transportation and Moving occupations in Mountain Village are Production (64 | 6.0%), Transportation (27 | 2.5%), and Material Moving (23 | 2.1%).
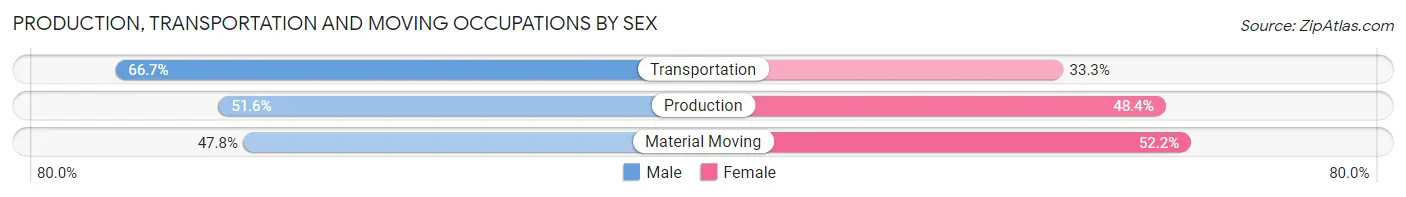
Production, Transportation and Moving Occupations by Sex
| Occupation | Male | Female |
| Production | 33 (51.6%) | 31 (48.4%) |
| Transportation | 18 (66.7%) | 9 (33.3%) |
| Material Moving | 11 (47.8%) | 12 (52.2%) |
| Total (Category) | 62 (54.4%) | 52 (45.6%) |
| Total (Overall) | 685 (64.1%) | 384 (35.9%) |
Employment Industries by Sex in Mountain Village
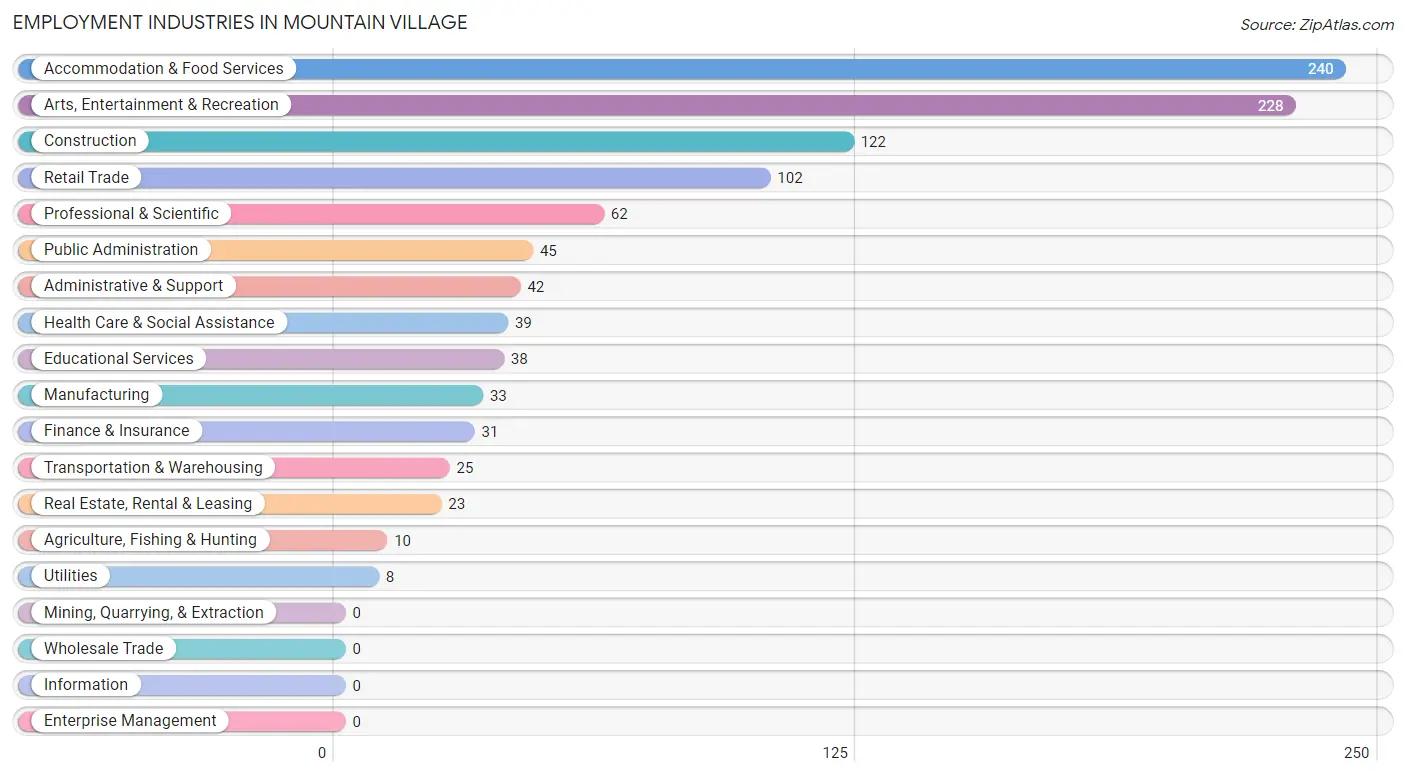
Employment Industries in Mountain Village
The major employment industries in Mountain Village include Accommodation & Food Services (240 | 22.5%), Arts, Entertainment & Recreation (228 | 21.3%), Construction (122 | 11.4%), Retail Trade (102 | 9.5%), and Professional & Scientific (62 | 5.8%).
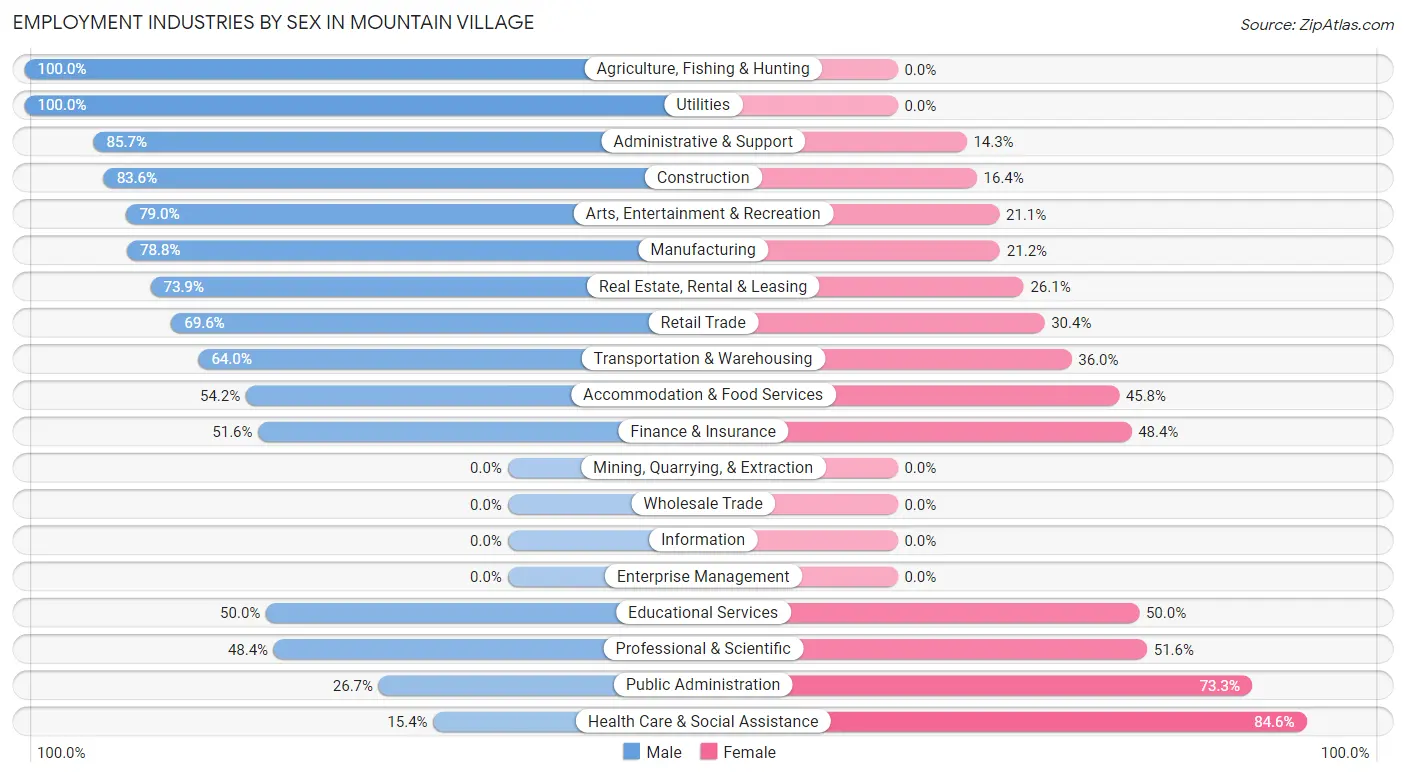
Employment Industries by Sex in Mountain Village
The Mountain Village industries that see more men than women are Agriculture, Fishing & Hunting (100.0%), Utilities (100.0%), and Administrative & Support (85.7%), whereas the industries that tend to have a higher number of women are Health Care & Social Assistance (84.6%), Public Administration (73.3%), and Professional & Scientific (51.6%).
| Industry | Male | Female |
| Agriculture, Fishing & Hunting | 10 (100.0%) | 0 (0.0%) |
| Mining, Quarrying, & Extraction | 0 (0.0%) | 0 (0.0%) |
| Construction | 102 (83.6%) | 20 (16.4%) |
| Manufacturing | 26 (78.8%) | 7 (21.2%) |
| Wholesale Trade | 0 (0.0%) | 0 (0.0%) |
| Retail Trade | 71 (69.6%) | 31 (30.4%) |
| Transportation & Warehousing | 16 (64.0%) | 9 (36.0%) |
| Utilities | 8 (100.0%) | 0 (0.0%) |
| Information | 0 (0.0%) | 0 (0.0%) |
| Finance & Insurance | 16 (51.6%) | 15 (48.4%) |
| Real Estate, Rental & Leasing | 17 (73.9%) | 6 (26.1%) |
| Professional & Scientific | 30 (48.4%) | 32 (51.6%) |
| Enterprise Management | 0 (0.0%) | 0 (0.0%) |
| Administrative & Support | 36 (85.7%) | 6 (14.3%) |
| Educational Services | 19 (50.0%) | 19 (50.0%) |
| Health Care & Social Assistance | 6 (15.4%) | 33 (84.6%) |
| Arts, Entertainment & Recreation | 180 (78.9%) | 48 (21.0%) |
| Accommodation & Food Services | 130 (54.2%) | 110 (45.8%) |
| Public Administration | 12 (26.7%) | 33 (73.3%) |
| Total | 685 (64.1%) | 384 (35.9%) |
Education in Mountain Village
School Enrollment in Mountain Village
The most common levels of schooling among the 158 students in Mountain Village are middle school (63 | 39.9%), high school (26 | 16.5%), and elementary school (22 | 13.9%).
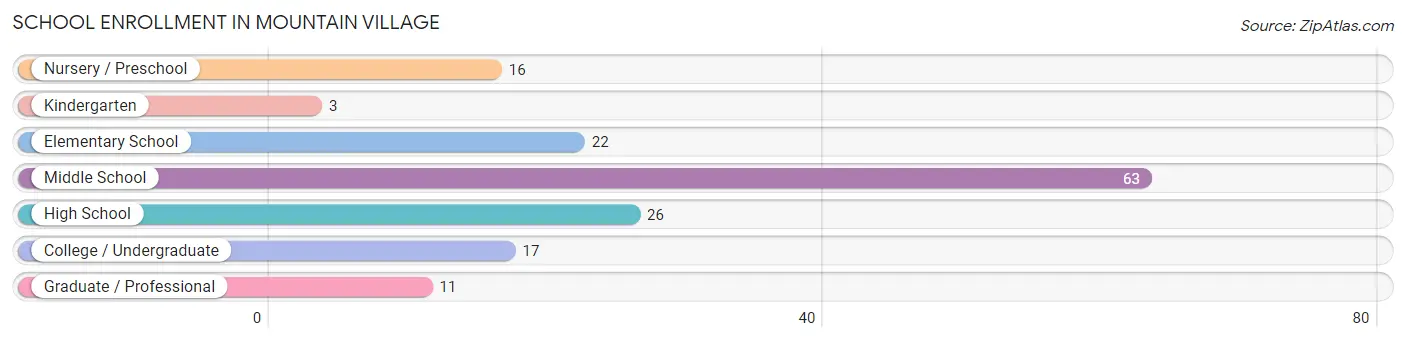
| School Level | # Students | % Students |
| Nursery / Preschool | 16 | 10.1% |
| Kindergarten | 3 | 1.9% |
| Elementary School | 22 | 13.9% |
| Middle School | 63 | 39.9% |
| High School | 26 | 16.5% |
| College / Undergraduate | 17 | 10.8% |
| Graduate / Professional | 11 | 7.0% |
| Total | 158 | 100.0% |
School Enrollment by Age by Funding Source in Mountain Village
Out of a total of 158 students who are enrolled in schools in Mountain Village, 3 (1.9%) attend a private institution, while the remaining 155 (98.1%) are enrolled in public schools. The age group of 35 years and over has the highest likelihood of being enrolled in private schools, with 3 (21.4% in the age bracket) enrolled. Conversely, the age group of 3 to 4 year olds has the lowest likelihood of being enrolled in a private school, with 4 (100.0% in the age bracket) attending a public institution.
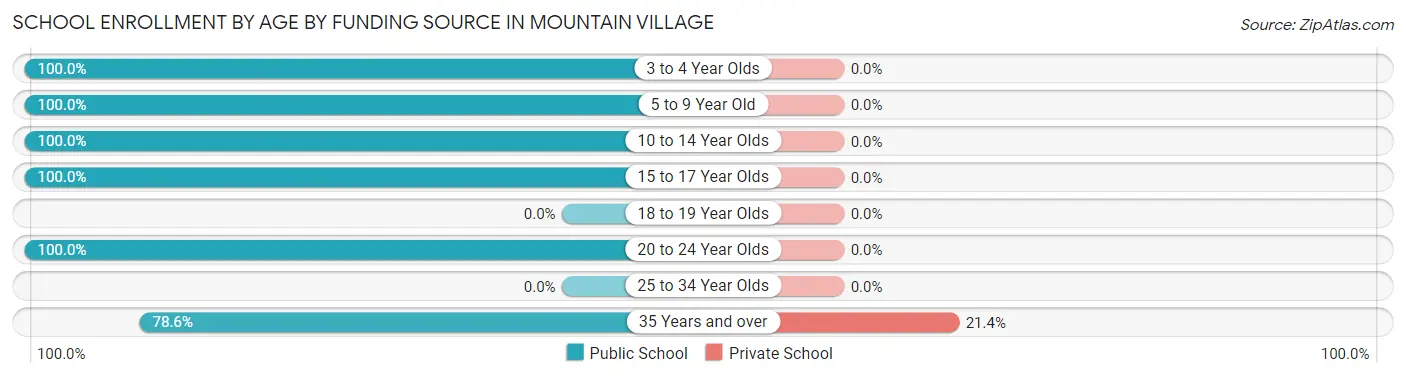
| Age Bracket | Public School | Private School |
| 3 to 4 Year Olds | 4 (100.0%) | 0 (0.0%) |
| 5 to 9 Year Old | 37 (100.0%) | 0 (0.0%) |
| 10 to 14 Year Olds | 63 (100.0%) | 0 (0.0%) |
| 15 to 17 Year Olds | 26 (100.0%) | 0 (0.0%) |
| 18 to 19 Year Olds | 0 (0.0%) | 0 (0.0%) |
| 20 to 24 Year Olds | 14 (100.0%) | 0 (0.0%) |
| 25 to 34 Year Olds | 0 (0.0%) | 0 (0.0%) |
| 35 Years and over | 11 (78.6%) | 3 (21.4%) |
| Total | 155 (98.1%) | 3 (1.9%) |
Educational Attainment by Field of Study in Mountain Village
Business (130 | 17.7%), social sciences (109 | 14.9%), bio, nature & agricultural (74 | 10.1%), education (55 | 7.5%), and physical & health sciences (53 | 7.2%) are the most common fields of study among 733 individuals in Mountain Village who have obtained a bachelor's degree or higher.
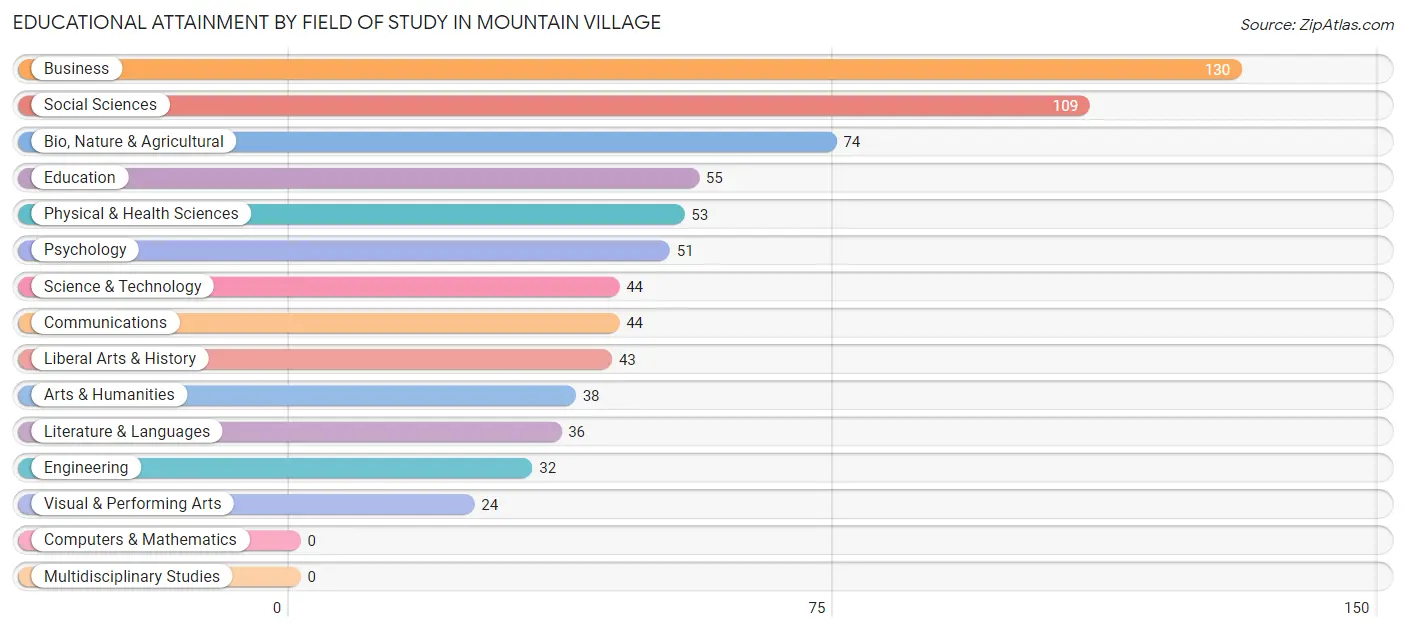
| Field of Study | # Graduates | % Graduates |
| Computers & Mathematics | 0 | 0.0% |
| Bio, Nature & Agricultural | 74 | 10.1% |
| Physical & Health Sciences | 53 | 7.2% |
| Psychology | 51 | 7.0% |
| Social Sciences | 109 | 14.9% |
| Engineering | 32 | 4.4% |
| Multidisciplinary Studies | 0 | 0.0% |
| Science & Technology | 44 | 6.0% |
| Business | 130 | 17.7% |
| Education | 55 | 7.5% |
| Literature & Languages | 36 | 4.9% |
| Liberal Arts & History | 43 | 5.9% |
| Visual & Performing Arts | 24 | 3.3% |
| Communications | 44 | 6.0% |
| Arts & Humanities | 38 | 5.2% |
| Total | 733 | 100.0% |
Transportation & Commute in Mountain Village
Vehicle Availability by Sex in Mountain Village
The most prevalent vehicle ownership categories in Mountain Village are males with 1 vehicle (417, accounting for 60.9%) and females with 1 vehicle (184, making up 109.5%).
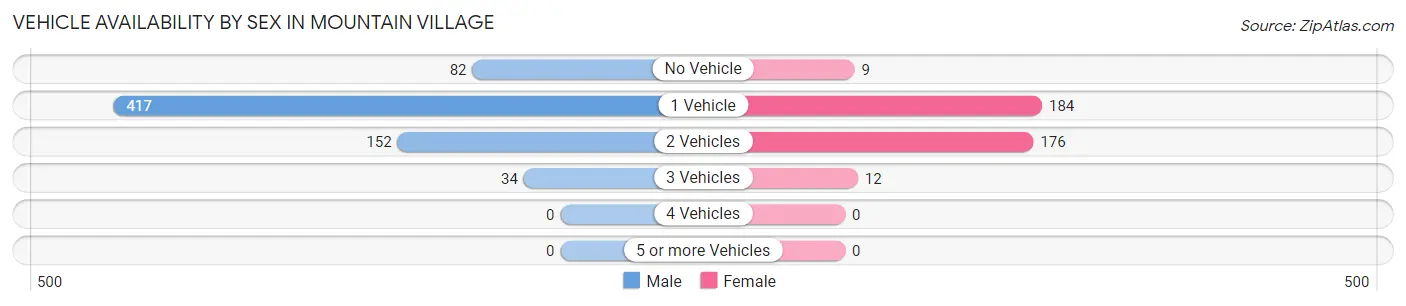
| Vehicles Available | Male | Female |
| No Vehicle | 82 (12.0%) | 9 (2.4%) |
| 1 Vehicle | 417 (60.9%) | 184 (48.3%) |
| 2 Vehicles | 152 (22.2%) | 176 (46.2%) |
| 3 Vehicles | 34 (5.0%) | 12 (3.2%) |
| 4 Vehicles | 0 (0.0%) | 0 (0.0%) |
| 5 or more Vehicles | 0 (0.0%) | 0 (0.0%) |
| Total | 685 (100.0%) | 381 (100.0%) |
Commute Time in Mountain Village
The most frequently occuring commute durations in Mountain Village are 15 to 19 minutes (268 commuters, 26.9%), 10 to 14 minutes (262 commuters, 26.3%), and 5 to 9 minutes (207 commuters, 20.7%).
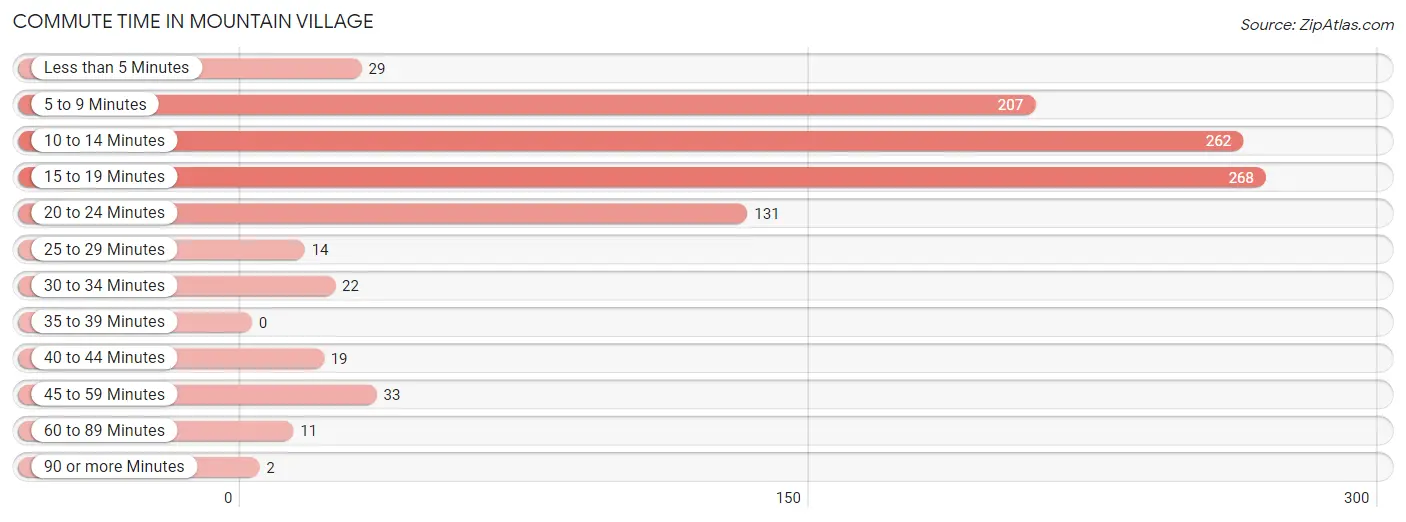
| Commute Time | # Commuters | % Commuters |
| Less than 5 Minutes | 29 | 2.9% |
| 5 to 9 Minutes | 207 | 20.7% |
| 10 to 14 Minutes | 262 | 26.3% |
| 15 to 19 Minutes | 268 | 26.9% |
| 20 to 24 Minutes | 131 | 13.1% |
| 25 to 29 Minutes | 14 | 1.4% |
| 30 to 34 Minutes | 22 | 2.2% |
| 35 to 39 Minutes | 0 | 0.0% |
| 40 to 44 Minutes | 19 | 1.9% |
| 45 to 59 Minutes | 33 | 3.3% |
| 60 to 89 Minutes | 11 | 1.1% |
| 90 or more Minutes | 2 | 0.2% |
Commute Time by Sex in Mountain Village
The most common commute times in Mountain Village are 15 to 19 minutes (194 commuters, 29.6%) for males and 10 to 14 minutes (88 commuters, 25.7%) for females.
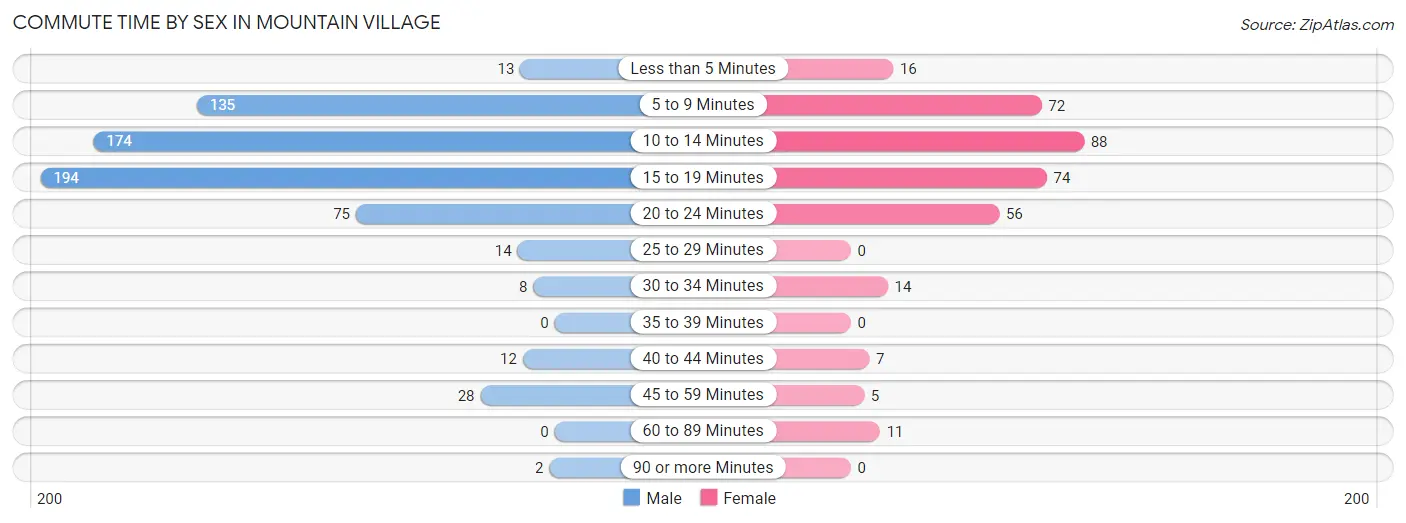
| Commute Time | Male | Female |
| Less than 5 Minutes | 13 (2.0%) | 16 (4.7%) |
| 5 to 9 Minutes | 135 (20.6%) | 72 (21.0%) |
| 10 to 14 Minutes | 174 (26.6%) | 88 (25.7%) |
| 15 to 19 Minutes | 194 (29.6%) | 74 (21.6%) |
| 20 to 24 Minutes | 75 (11.5%) | 56 (16.3%) |
| 25 to 29 Minutes | 14 (2.1%) | 0 (0.0%) |
| 30 to 34 Minutes | 8 (1.2%) | 14 (4.1%) |
| 35 to 39 Minutes | 0 (0.0%) | 0 (0.0%) |
| 40 to 44 Minutes | 12 (1.8%) | 7 (2.0%) |
| 45 to 59 Minutes | 28 (4.3%) | 5 (1.5%) |
| 60 to 89 Minutes | 0 (0.0%) | 11 (3.2%) |
| 90 or more Minutes | 2 (0.3%) | 0 (0.0%) |
Time of Departure to Work by Sex in Mountain Village
The most frequent times of departure to work in Mountain Village are 7:30 AM to 7:59 AM (142, 21.7%) for males and 12:00 PM to 3:59 PM (87, 25.4%) for females.
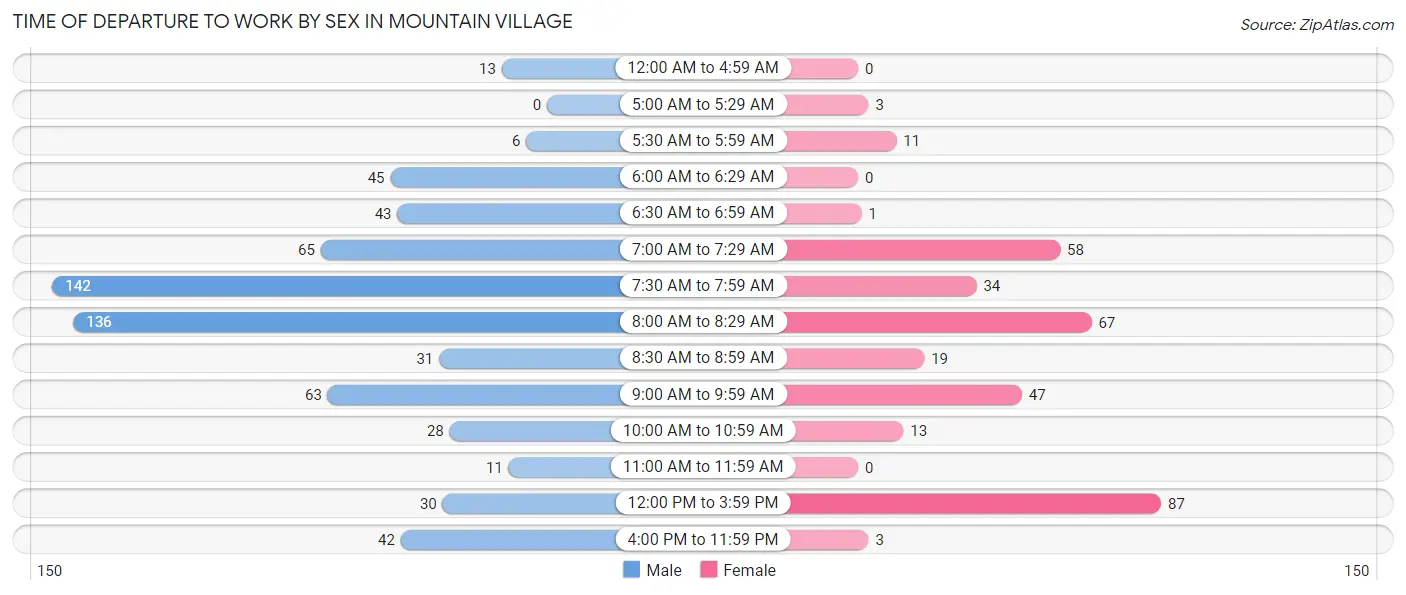
| Time of Departure | Male | Female |
| 12:00 AM to 4:59 AM | 13 (2.0%) | 0 (0.0%) |
| 5:00 AM to 5:29 AM | 0 (0.0%) | 3 (0.9%) |
| 5:30 AM to 5:59 AM | 6 (0.9%) | 11 (3.2%) |
| 6:00 AM to 6:29 AM | 45 (6.9%) | 0 (0.0%) |
| 6:30 AM to 6:59 AM | 43 (6.6%) | 1 (0.3%) |
| 7:00 AM to 7:29 AM | 65 (9.9%) | 58 (16.9%) |
| 7:30 AM to 7:59 AM | 142 (21.7%) | 34 (9.9%) |
| 8:00 AM to 8:29 AM | 136 (20.8%) | 67 (19.5%) |
| 8:30 AM to 8:59 AM | 31 (4.7%) | 19 (5.5%) |
| 9:00 AM to 9:59 AM | 63 (9.6%) | 47 (13.7%) |
| 10:00 AM to 10:59 AM | 28 (4.3%) | 13 (3.8%) |
| 11:00 AM to 11:59 AM | 11 (1.7%) | 0 (0.0%) |
| 12:00 PM to 3:59 PM | 30 (4.6%) | 87 (25.4%) |
| 4:00 PM to 11:59 PM | 42 (6.4%) | 3 (0.9%) |
| Total | 655 (100.0%) | 343 (100.0%) |
Housing Occupancy in Mountain Village
Occupancy by Ownership in Mountain Village
Of the total 869 dwellings in Mountain Village, owner-occupied units account for 273 (31.4%), while renter-occupied units make up 596 (68.6%).
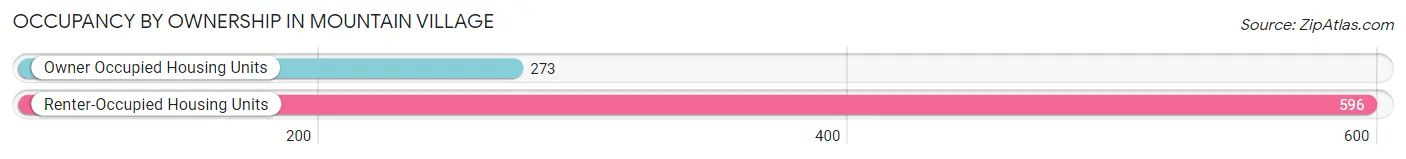
| Occupancy | # Housing Units | % Housing Units |
| Owner Occupied Housing Units | 273 | 31.4% |
| Renter-Occupied Housing Units | 596 | 68.6% |
| Total Occupied Housing Units | 869 | 100.0% |
Occupancy by Household Size in Mountain Village
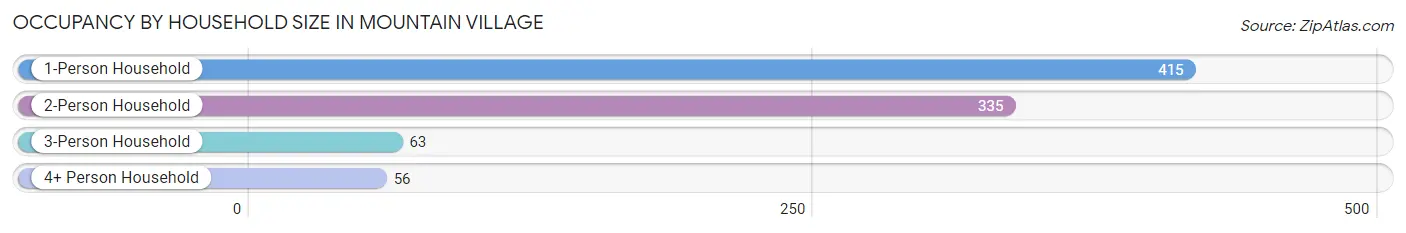
| Household Size | # Housing Units | % Housing Units |
| 1-Person Household | 415 | 47.8% |
| 2-Person Household | 335 | 38.6% |
| 3-Person Household | 63 | 7.2% |
| 4+ Person Household | 56 | 6.4% |
| Total Housing Units | 869 | 100.0% |
Occupancy by Ownership by Household Size in Mountain Village
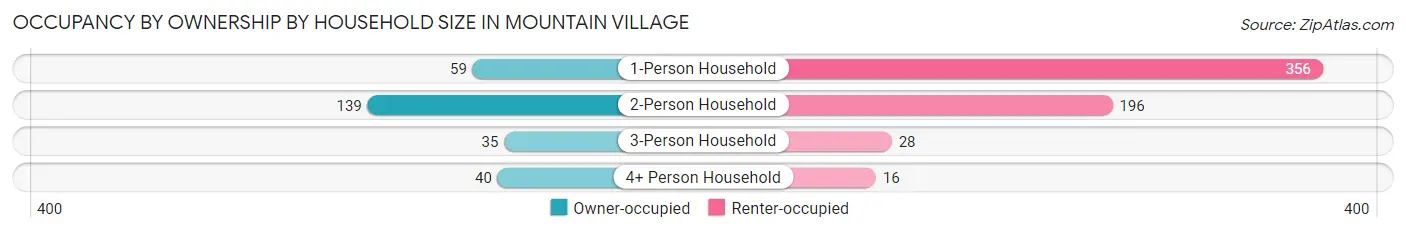
| Household Size | Owner-occupied | Renter-occupied |
| 1-Person Household | 59 (14.2%) | 356 (85.8%) |
| 2-Person Household | 139 (41.5%) | 196 (58.5%) |
| 3-Person Household | 35 (55.6%) | 28 (44.4%) |
| 4+ Person Household | 40 (71.4%) | 16 (28.6%) |
| Total Housing Units | 273 (31.4%) | 596 (68.6%) |
Occupancy by Educational Attainment in Mountain Village
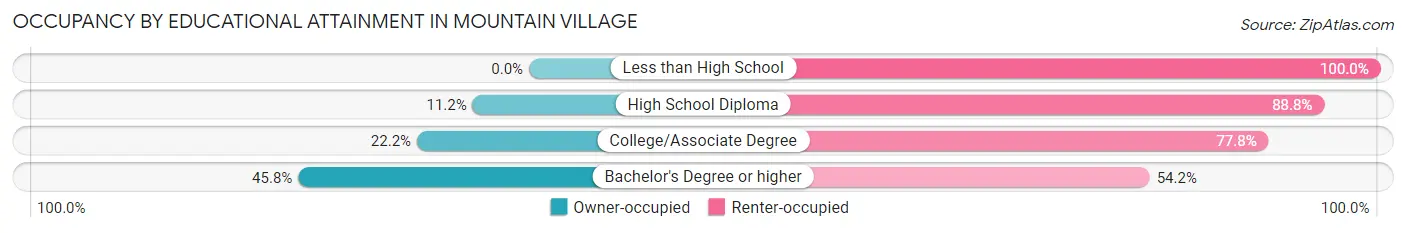
| Household Size | Owner-occupied | Renter-occupied |
| Less than High School | 0 (0.0%) | 56 (100.0%) |
| High School Diploma | 19 (11.2%) | 151 (88.8%) |
| College/Associate Degree | 38 (22.2%) | 133 (77.8%) |
| Bachelor's Degree or higher | 216 (45.8%) | 256 (54.2%) |
Occupancy by Age of Householder in Mountain Village
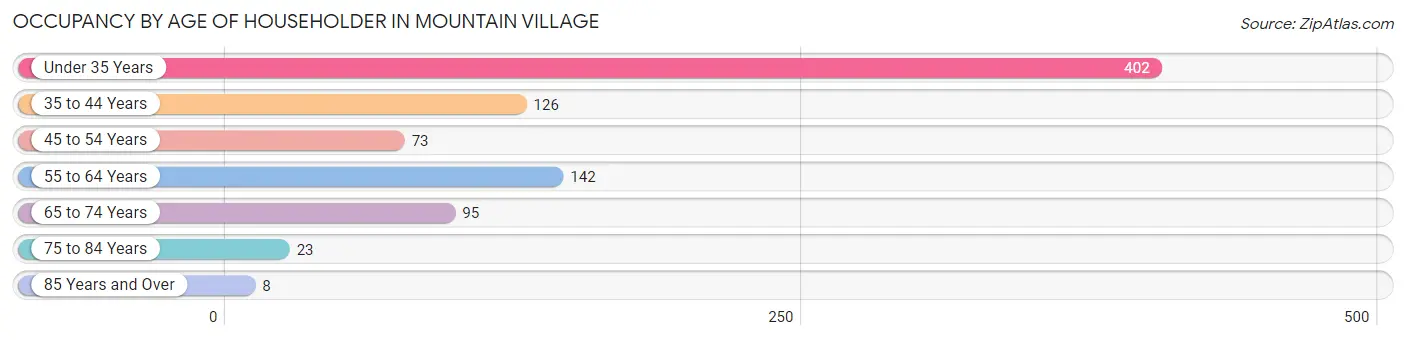
| Age Bracket | # Households | % Households |
| Under 35 Years | 402 | 46.3% |
| 35 to 44 Years | 126 | 14.5% |
| 45 to 54 Years | 73 | 8.4% |
| 55 to 64 Years | 142 | 16.3% |
| 65 to 74 Years | 95 | 10.9% |
| 75 to 84 Years | 23 | 2.6% |
| 85 Years and Over | 8 | 0.9% |
| Total | 869 | 100.0% |
Housing Finances in Mountain Village
Median Income by Occupancy in Mountain Village
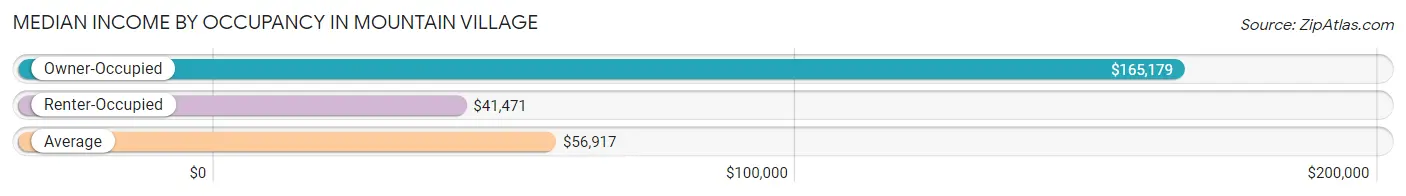
| Occupancy Type | # Households | Median Income |
| Owner-Occupied | 273 (31.4%) | $165,179 |
| Renter-Occupied | 596 (68.6%) | $41,471 |
| Average | 869 (100.0%) | $56,917 |
Occupancy by Householder Income Bracket in Mountain Village
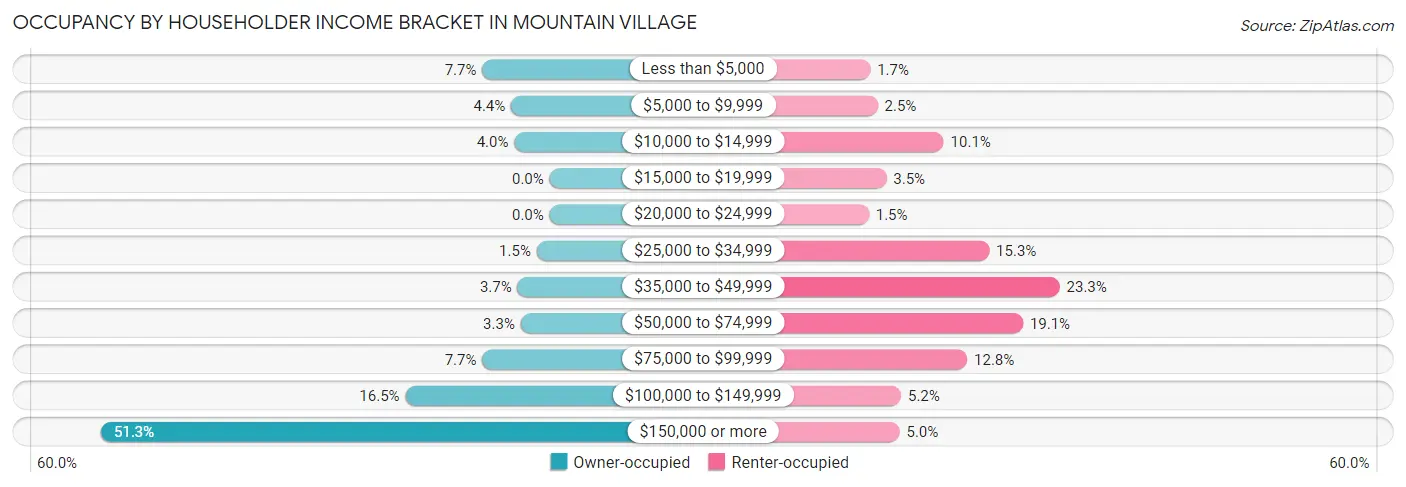
| Income Bracket | Owner-occupied | Renter-occupied |
| Less than $5,000 | 21 (7.7%) | 10 (1.7%) |
| $5,000 to $9,999 | 12 (4.4%) | 15 (2.5%) |
| $10,000 to $14,999 | 11 (4.0%) | 60 (10.1%) |
| $15,000 to $19,999 | 0 (0.0%) | 21 (3.5%) |
| $20,000 to $24,999 | 0 (0.0%) | 9 (1.5%) |
| $25,000 to $34,999 | 4 (1.5%) | 91 (15.3%) |
| $35,000 to $49,999 | 10 (3.7%) | 139 (23.3%) |
| $50,000 to $74,999 | 9 (3.3%) | 114 (19.1%) |
| $75,000 to $99,999 | 21 (7.7%) | 76 (12.8%) |
| $100,000 to $149,999 | 45 (16.5%) | 31 (5.2%) |
| $150,000 or more | 140 (51.3%) | 30 (5.0%) |
| Total | 273 (100.0%) | 596 (100.0%) |
Monthly Housing Cost Tiers in Mountain Village
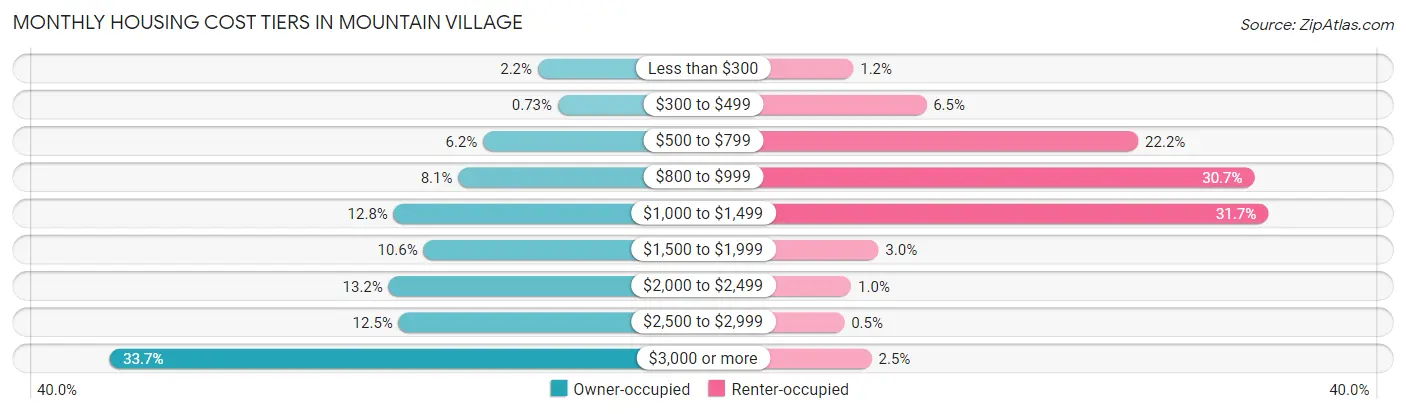
| Monthly Cost | Owner-occupied | Renter-occupied |
| Less than $300 | 6 (2.2%) | 7 (1.2%) |
| $300 to $499 | 2 (0.7%) | 39 (6.5%) |
| $500 to $799 | 17 (6.2%) | 132 (22.2%) |
| $800 to $999 | 22 (8.1%) | 183 (30.7%) |
| $1,000 to $1,499 | 35 (12.8%) | 189 (31.7%) |
| $1,500 to $1,999 | 29 (10.6%) | 18 (3.0%) |
| $2,000 to $2,499 | 36 (13.2%) | 6 (1.0%) |
| $2,500 to $2,999 | 34 (12.4%) | 3 (0.5%) |
| $3,000 or more | 92 (33.7%) | 15 (2.5%) |
| Total | 273 (100.0%) | 596 (100.0%) |
Physical Housing Characteristics in Mountain Village
Housing Structures in Mountain Village
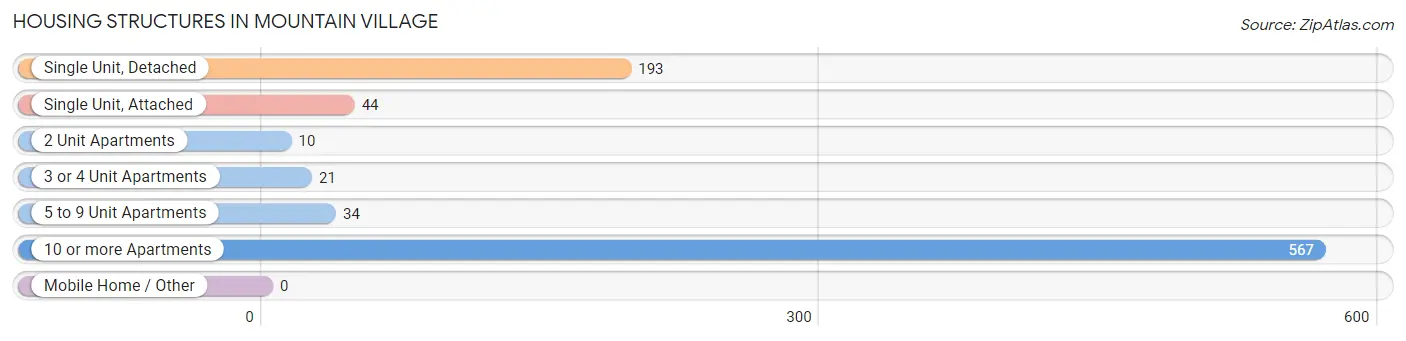
| Structure Type | # Housing Units | % Housing Units |
| Single Unit, Detached | 193 | 22.2% |
| Single Unit, Attached | 44 | 5.1% |
| 2 Unit Apartments | 10 | 1.1% |
| 3 or 4 Unit Apartments | 21 | 2.4% |
| 5 to 9 Unit Apartments | 34 | 3.9% |
| 10 or more Apartments | 567 | 65.2% |
| Mobile Home / Other | 0 | 0.0% |
| Total | 869 | 100.0% |
Housing Structures by Occupancy in Mountain Village
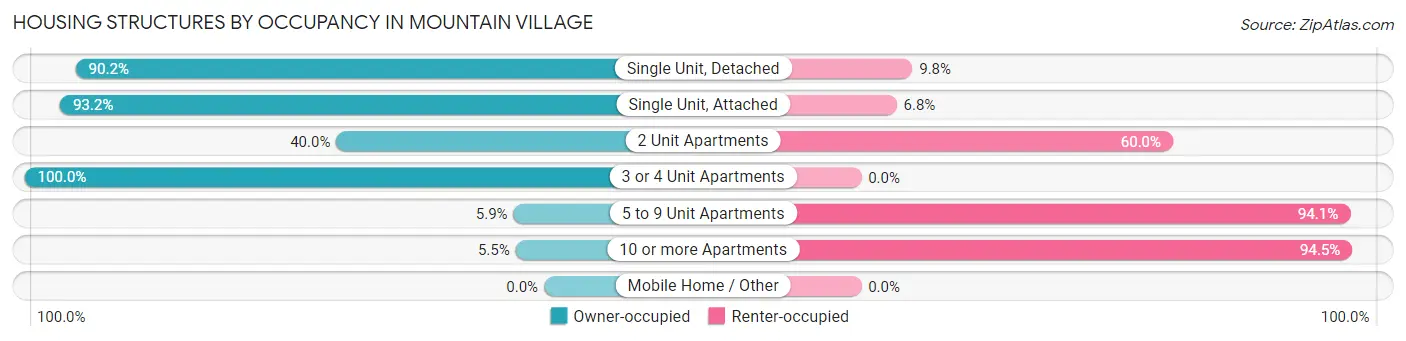
| Structure Type | Owner-occupied | Renter-occupied |
| Single Unit, Detached | 174 (90.2%) | 19 (9.8%) |
| Single Unit, Attached | 41 (93.2%) | 3 (6.8%) |
| 2 Unit Apartments | 4 (40.0%) | 6 (60.0%) |
| 3 or 4 Unit Apartments | 21 (100.0%) | 0 (0.0%) |
| 5 to 9 Unit Apartments | 2 (5.9%) | 32 (94.1%) |
| 10 or more Apartments | 31 (5.5%) | 536 (94.5%) |
| Mobile Home / Other | 0 (0.0%) | 0 (0.0%) |
| Total | 273 (31.4%) | 596 (68.6%) |
Housing Structures by Number of Rooms in Mountain Village
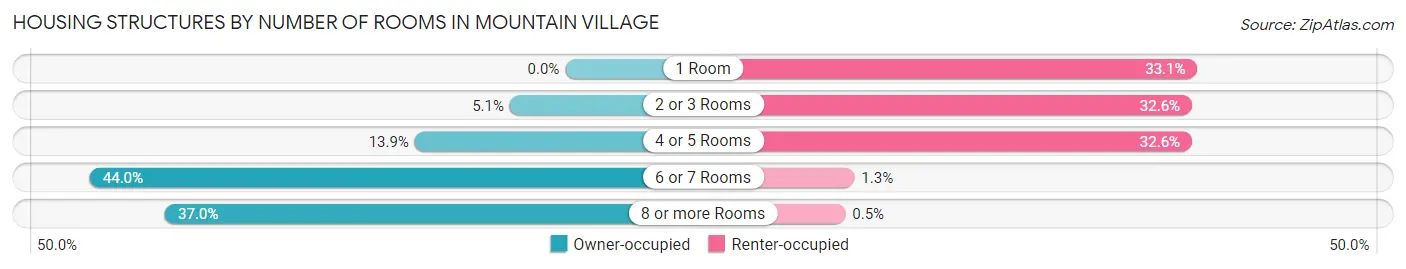
| Number of Rooms | Owner-occupied | Renter-occupied |
| 1 Room | 0 (0.0%) | 197 (33.1%) |
| 2 or 3 Rooms | 14 (5.1%) | 194 (32.6%) |
| 4 or 5 Rooms | 38 (13.9%) | 194 (32.6%) |
| 6 or 7 Rooms | 120 (44.0%) | 8 (1.3%) |
| 8 or more Rooms | 101 (37.0%) | 3 (0.5%) |
| Total | 273 (100.0%) | 596 (100.0%) |
Housing Structure by Heating Type in Mountain Village
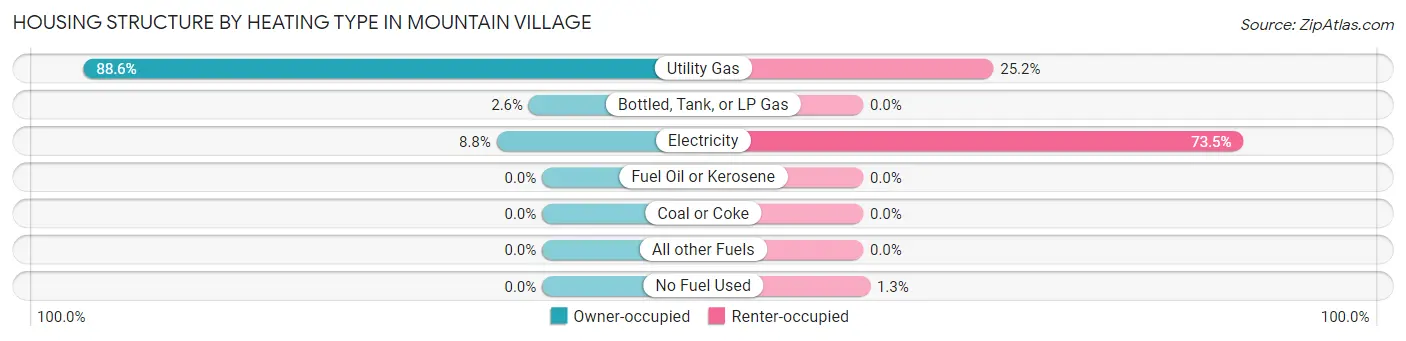
| Heating Type | Owner-occupied | Renter-occupied |
| Utility Gas | 242 (88.6%) | 150 (25.2%) |
| Bottled, Tank, or LP Gas | 7 (2.6%) | 0 (0.0%) |
| Electricity | 24 (8.8%) | 438 (73.5%) |
| Fuel Oil or Kerosene | 0 (0.0%) | 0 (0.0%) |
| Coal or Coke | 0 (0.0%) | 0 (0.0%) |
| All other Fuels | 0 (0.0%) | 0 (0.0%) |
| No Fuel Used | 0 (0.0%) | 8 (1.3%) |
| Total | 273 (100.0%) | 596 (100.0%) |
Household Vehicle Usage in Mountain Village
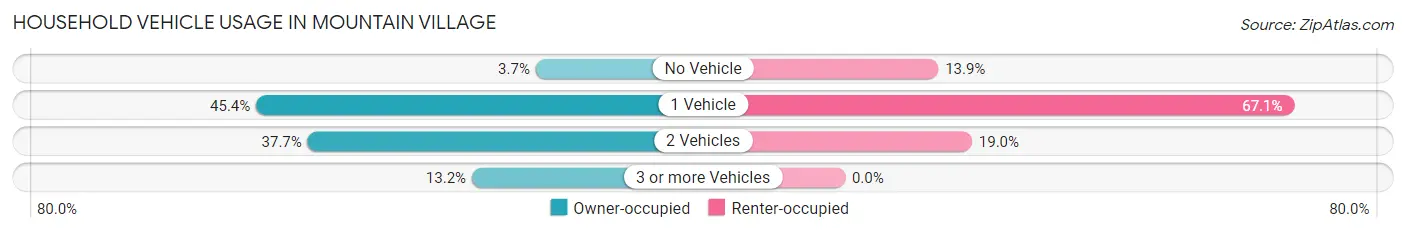
| Vehicles per Household | Owner-occupied | Renter-occupied |
| No Vehicle | 10 (3.7%) | 83 (13.9%) |
| 1 Vehicle | 124 (45.4%) | 400 (67.1%) |
| 2 Vehicles | 103 (37.7%) | 113 (19.0%) |
| 3 or more Vehicles | 36 (13.2%) | 0 (0.0%) |
| Total | 273 (100.0%) | 596 (100.0%) |
Real Estate & Mortgages in Mountain Village
Real Estate and Mortgage Overview in Mountain Village
| Characteristic | Without Mortgage | With Mortgage |
| Housing Units | 110 | 163 |
| Median Property Value | $2,000,001 | $1,312,500 |
| Median Household Income | - | - |
| Monthly Housing Costs | $1,157 | $89 |
| Real Estate Taxes | $6,351 | $2 |
Property Value by Mortgage Status in Mountain Village
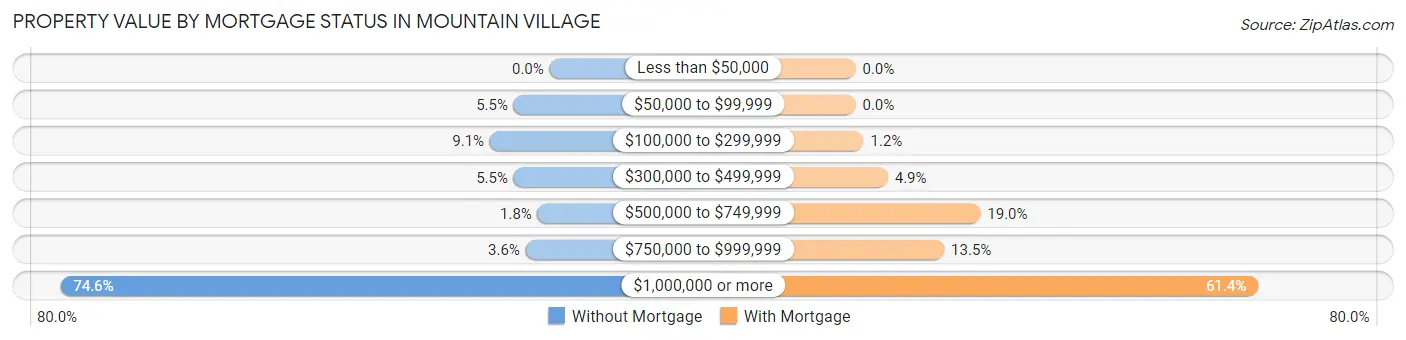
| Property Value | Without Mortgage | With Mortgage |
| Less than $50,000 | 0 (0.0%) | 0 (0.0%) |
| $50,000 to $99,999 | 6 (5.4%) | 0 (0.0%) |
| $100,000 to $299,999 | 10 (9.1%) | 2 (1.2%) |
| $300,000 to $499,999 | 6 (5.4%) | 8 (4.9%) |
| $500,000 to $749,999 | 2 (1.8%) | 31 (19.0%) |
| $750,000 to $999,999 | 4 (3.6%) | 22 (13.5%) |
| $1,000,000 or more | 82 (74.6%) | 100 (61.4%) |
| Total | 110 (100.0%) | 163 (100.0%) |
Household Income by Mortgage Status in Mountain Village
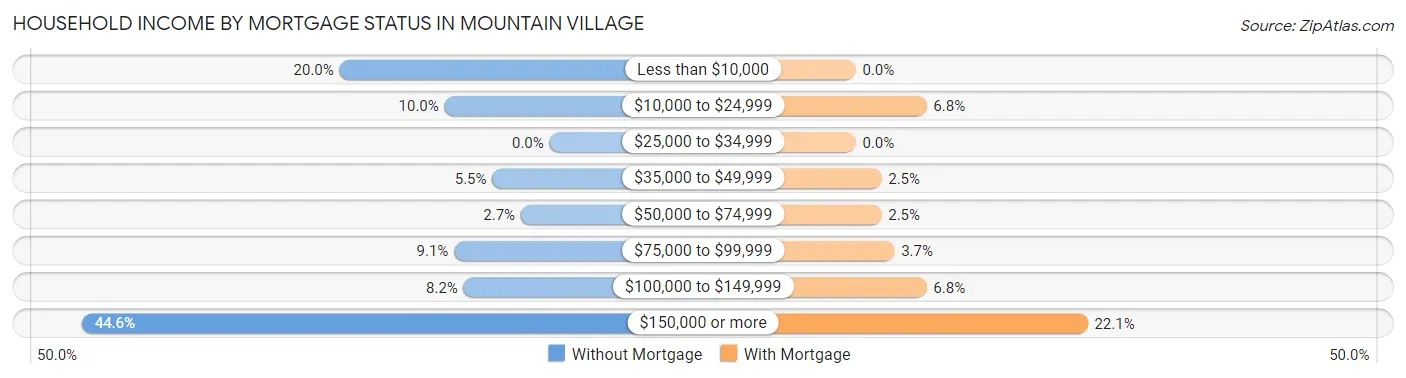
| Household Income | Without Mortgage | With Mortgage |
| Less than $10,000 | 22 (20.0%) | 0 (0.0%) |
| $10,000 to $24,999 | 11 (10.0%) | 11 (6.8%) |
| $25,000 to $34,999 | 0 (0.0%) | 0 (0.0%) |
| $35,000 to $49,999 | 6 (5.4%) | 4 (2.5%) |
| $50,000 to $74,999 | 3 (2.7%) | 4 (2.5%) |
| $75,000 to $99,999 | 10 (9.1%) | 6 (3.7%) |
| $100,000 to $149,999 | 9 (8.2%) | 11 (6.8%) |
| $150,000 or more | 49 (44.6%) | 36 (22.1%) |
| Total | 110 (100.0%) | 163 (100.0%) |
Property Value to Household Income Ratio in Mountain Village
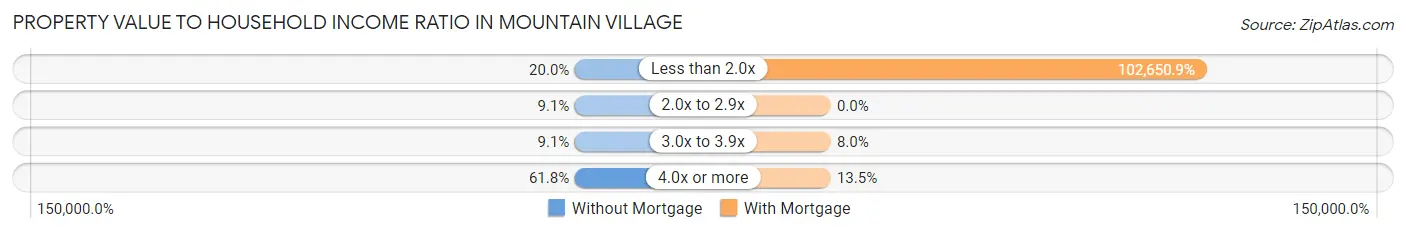
| Value-to-Income Ratio | Without Mortgage | With Mortgage |
| Less than 2.0x | 22 (20.0%) | 167,321 (102,650.9%) |
| 2.0x to 2.9x | 10 (9.1%) | 0 (0.0%) |
| 3.0x to 3.9x | 10 (9.1%) | 13 (8.0%) |
| 4.0x or more | 68 (61.8%) | 22 (13.5%) |
| Total | 110 (100.0%) | 163 (100.0%) |
Real Estate Taxes by Mortgage Status in Mountain Village
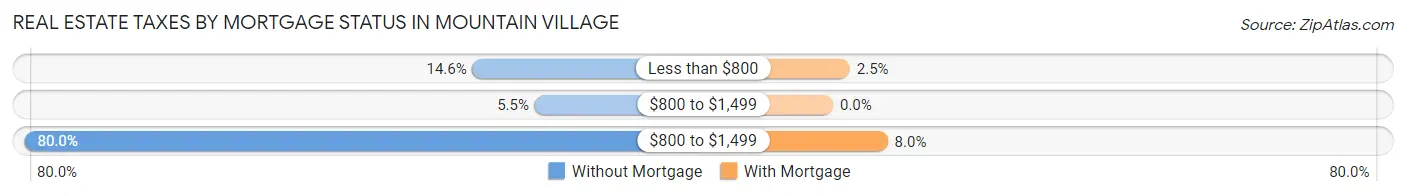
| Property Taxes | Without Mortgage | With Mortgage |
| Less than $800 | 16 (14.5%) | 4 (2.5%) |
| $800 to $1,499 | 6 (5.4%) | 0 (0.0%) |
| $800 to $1,499 | 88 (80.0%) | 13 (8.0%) |
| Total | 110 (100.0%) | 163 (100.0%) |
Health & Disability in Mountain Village
Health Insurance Coverage by Age in Mountain Village
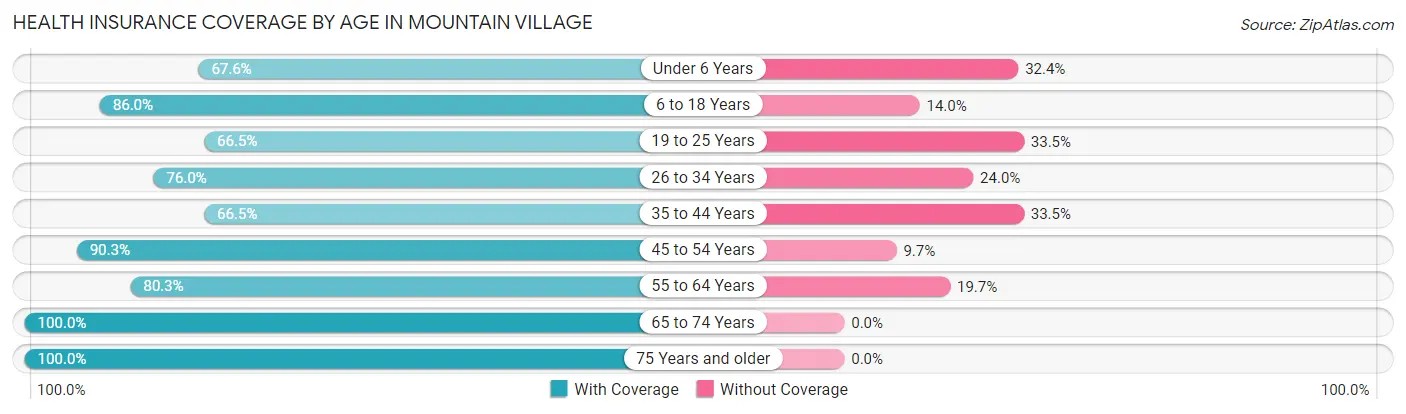
| Age Bracket | With Coverage | Without Coverage |
| Under 6 Years | 25 (67.6%) | 12 (32.4%) |
| 6 to 18 Years | 98 (86.0%) | 16 (14.0%) |
| 19 to 25 Years | 153 (66.5%) | 77 (33.5%) |
| 26 to 34 Years | 351 (76.0%) | 111 (24.0%) |
| 35 to 44 Years | 159 (66.5%) | 80 (33.5%) |
| 45 to 54 Years | 102 (90.3%) | 11 (9.7%) |
| 55 to 64 Years | 171 (80.3%) | 42 (19.7%) |
| 65 to 74 Years | 126 (100.0%) | 0 (0.0%) |
| 75 Years and older | 48 (100.0%) | 0 (0.0%) |
| Total | 1,233 (77.9%) | 349 (22.1%) |
Health Insurance Coverage by Citizenship Status in Mountain Village
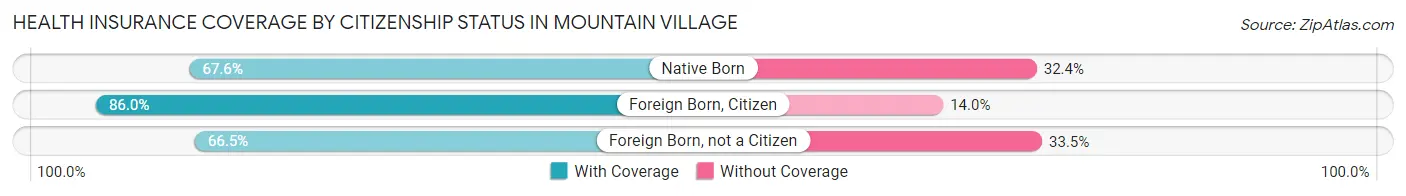
| Citizenship Status | With Coverage | Without Coverage |
| Native Born | 25 (67.6%) | 12 (32.4%) |
| Foreign Born, Citizen | 98 (86.0%) | 16 (14.0%) |
| Foreign Born, not a Citizen | 153 (66.5%) | 77 (33.5%) |
Health Insurance Coverage by Household Income in Mountain Village
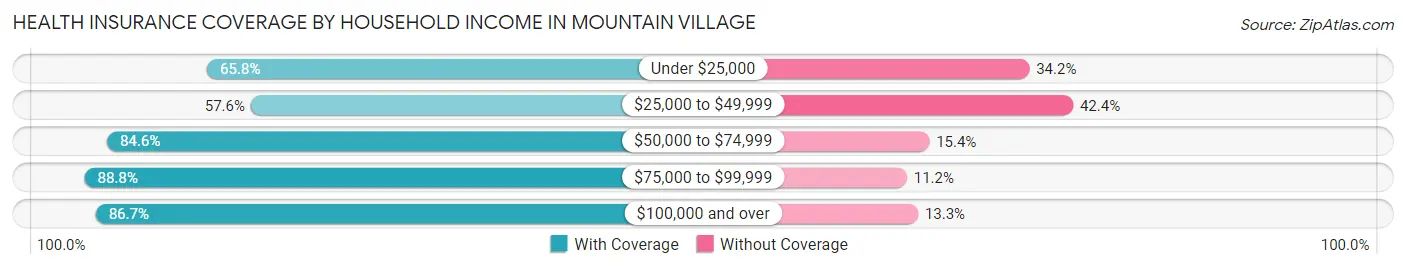
| Household Income | With Coverage | Without Coverage |
| Under $25,000 | 129 (65.8%) | 67 (34.2%) |
| $25,000 to $49,999 | 189 (57.6%) | 139 (42.4%) |
| $50,000 to $74,999 | 219 (84.6%) | 40 (15.4%) |
| $75,000 to $99,999 | 150 (88.8%) | 19 (11.2%) |
| $100,000 and over | 546 (86.7%) | 84 (13.3%) |
Public vs Private Health Insurance Coverage by Age in Mountain Village
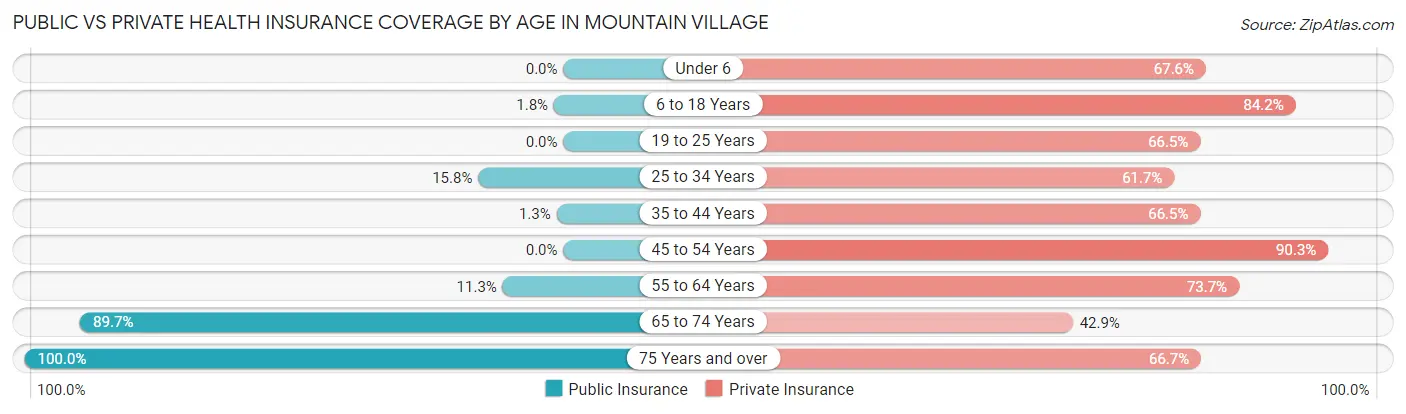
| Age Bracket | Public Insurance | Private Insurance |
| Under 6 | 0 (0.0%) | 25 (67.6%) |
| 6 to 18 Years | 2 (1.8%) | 96 (84.2%) |
| 19 to 25 Years | 0 (0.0%) | 153 (66.5%) |
| 25 to 34 Years | 73 (15.8%) | 285 (61.7%) |
| 35 to 44 Years | 3 (1.3%) | 159 (66.5%) |
| 45 to 54 Years | 0 (0.0%) | 102 (90.3%) |
| 55 to 64 Years | 24 (11.3%) | 157 (73.7%) |
| 65 to 74 Years | 113 (89.7%) | 54 (42.9%) |
| 75 Years and over | 48 (100.0%) | 32 (66.7%) |
| Total | 263 (16.6%) | 1,063 (67.2%) |
Disability Status by Sex by Age in Mountain Village
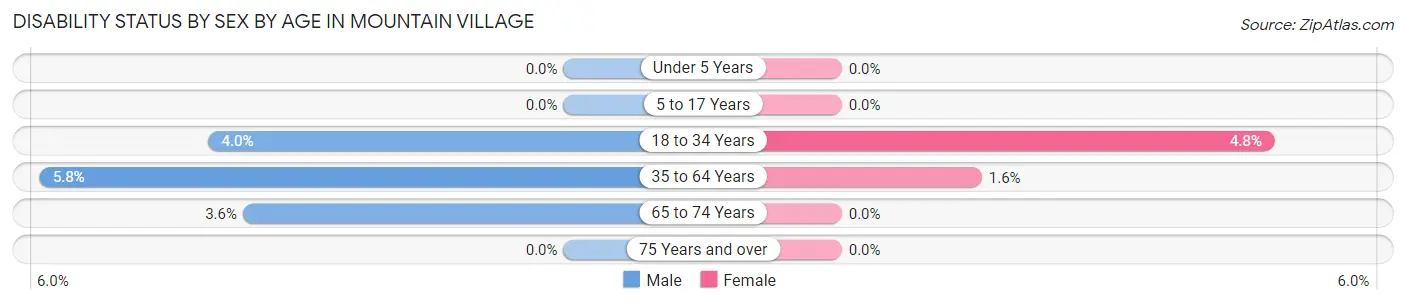
| Age Bracket | Male | Female |
| Under 5 Years | 0 (0.0%) | 0 (0.0%) |
| 5 to 17 Years | 0 (0.0%) | 0 (0.0%) |
| 18 to 34 Years | 15 (4.0%) | 15 (4.8%) |
| 35 to 64 Years | 18 (5.8%) | 4 (1.6%) |
| 65 to 74 Years | 3 (3.6%) | 0 (0.0%) |
| 75 Years and over | 0 (0.0%) | 0 (0.0%) |
Disability Class by Sex by Age in Mountain Village
Disability Class: Hearing Difficulty
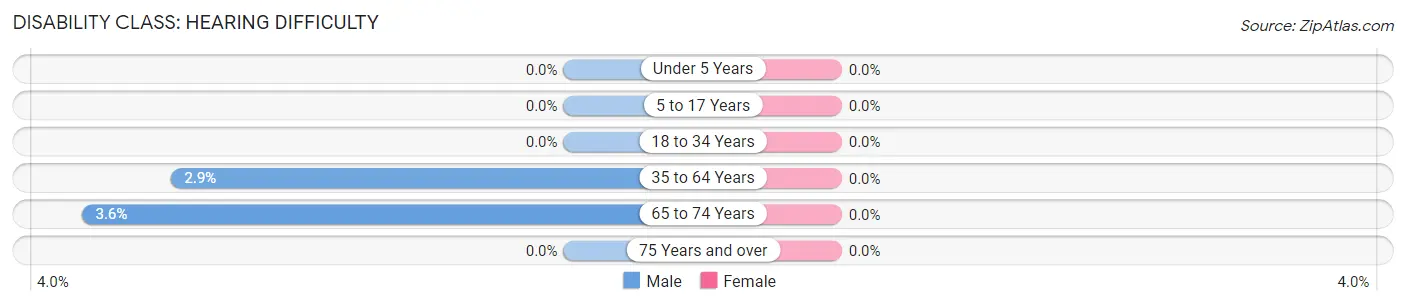
| Age Bracket | Male | Female |
| Under 5 Years | 0 (0.0%) | 0 (0.0%) |
| 5 to 17 Years | 0 (0.0%) | 0 (0.0%) |
| 18 to 34 Years | 0 (0.0%) | 0 (0.0%) |
| 35 to 64 Years | 9 (2.9%) | 0 (0.0%) |
| 65 to 74 Years | 3 (3.6%) | 0 (0.0%) |
| 75 Years and over | 0 (0.0%) | 0 (0.0%) |
Disability Class: Vision Difficulty
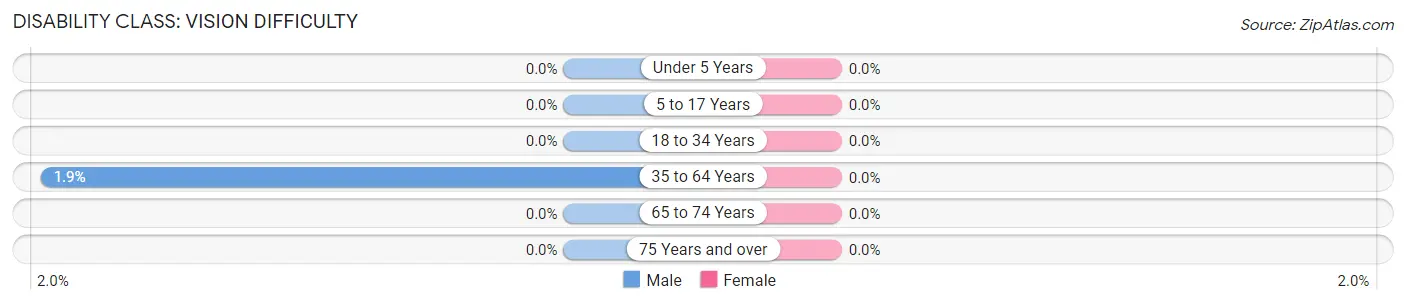
| Age Bracket | Male | Female |
| Under 5 Years | 0 (0.0%) | 0 (0.0%) |
| 5 to 17 Years | 0 (0.0%) | 0 (0.0%) |
| 18 to 34 Years | 0 (0.0%) | 0 (0.0%) |
| 35 to 64 Years | 6 (1.9%) | 0 (0.0%) |
| 65 to 74 Years | 0 (0.0%) | 0 (0.0%) |
| 75 Years and over | 0 (0.0%) | 0 (0.0%) |
Disability Class: Cognitive Difficulty
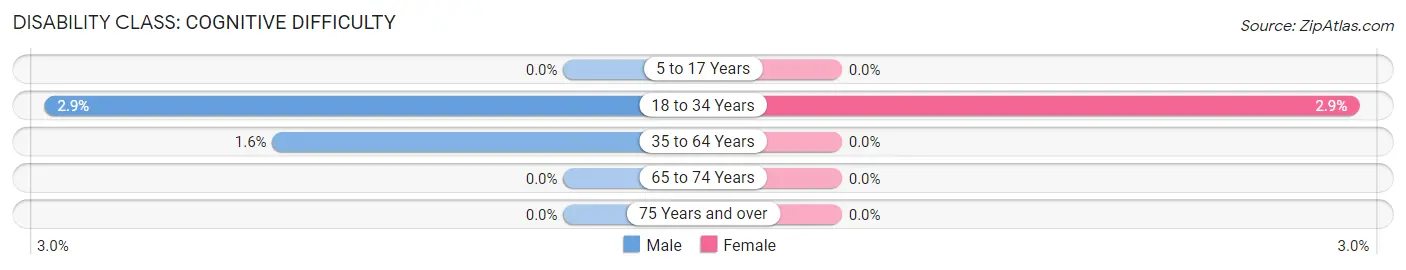
| Age Bracket | Male | Female |
| 5 to 17 Years | 0 (0.0%) | 0 (0.0%) |
| 18 to 34 Years | 11 (2.9%) | 9 (2.9%) |
| 35 to 64 Years | 5 (1.6%) | 0 (0.0%) |
| 65 to 74 Years | 0 (0.0%) | 0 (0.0%) |
| 75 Years and over | 0 (0.0%) | 0 (0.0%) |
Disability Class: Ambulatory Difficulty
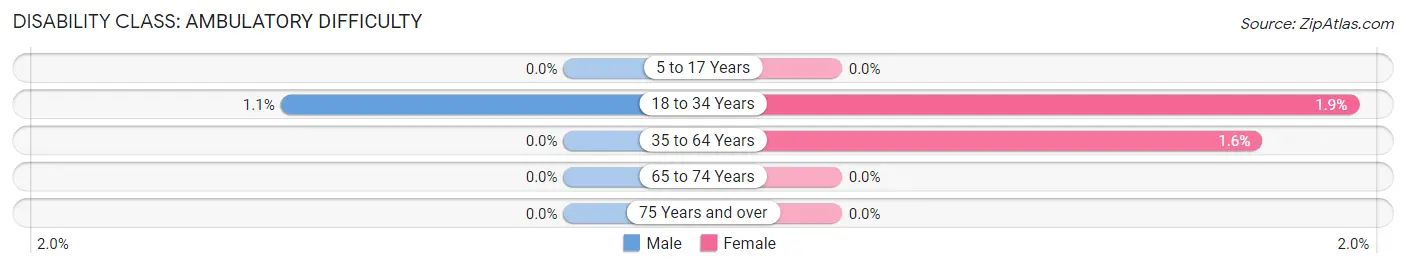
| Age Bracket | Male | Female |
| 5 to 17 Years | 0 (0.0%) | 0 (0.0%) |
| 18 to 34 Years | 4 (1.1%) | 6 (1.9%) |
| 35 to 64 Years | 0 (0.0%) | 4 (1.6%) |
| 65 to 74 Years | 0 (0.0%) | 0 (0.0%) |
| 75 Years and over | 0 (0.0%) | 0 (0.0%) |
Disability Class: Self-Care Difficulty
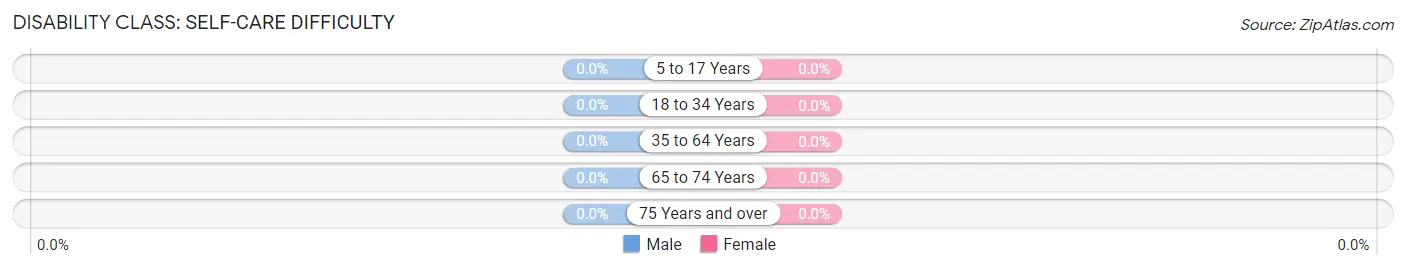
| Age Bracket | Male | Female |
| 5 to 17 Years | 0 (0.0%) | 0 (0.0%) |
| 18 to 34 Years | 0 (0.0%) | 0 (0.0%) |
| 35 to 64 Years | 0 (0.0%) | 0 (0.0%) |
| 65 to 74 Years | 0 (0.0%) | 0 (0.0%) |
| 75 Years and over | 0 (0.0%) | 0 (0.0%) |
Technology Access in Mountain Village
Computing Device Access in Mountain Village
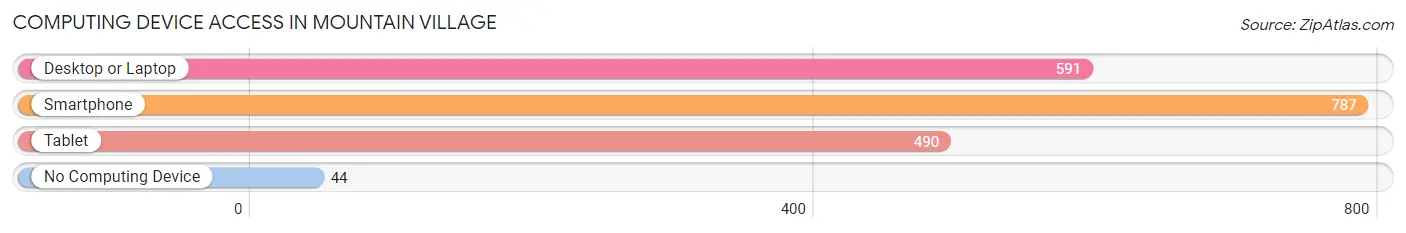
| Device Type | # Households | % Households |
| Desktop or Laptop | 591 | 68.0% |
| Smartphone | 787 | 90.6% |
| Tablet | 490 | 56.4% |
| No Computing Device | 44 | 5.1% |
| Total | 869 | 100.0% |
Internet Access in Mountain Village
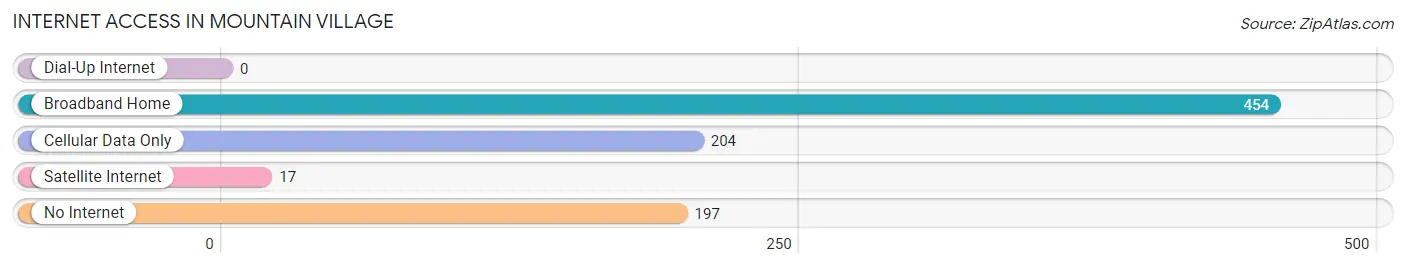
| Internet Type | # Households | % Households |
| Dial-Up Internet | 0 | 0.0% |
| Broadband Home | 454 | 52.2% |
| Cellular Data Only | 204 | 23.5% |
| Satellite Internet | 17 | 2.0% |
| No Internet | 197 | 22.7% |
| Total | 869 | 100.0% |
Mountain Village Summary
Mountain Village, Colorado is a small town located in the San Juan Mountains of southwestern Colorado. It is situated at an elevation of 9,500 feet, making it one of the highest towns in the United States. The town is located in San Miguel County and is part of the Telluride Micropolitan Statistical Area. The town was founded in 1883 and has a population of approximately 500 people.
Geography
Mountain Village is located in the San Juan Mountains of southwestern Colorado. It is situated at an elevation of 9,500 feet, making it one of the highest towns in the United States. The town is located in San Miguel County and is part of the Telluride Micropolitan Statistical Area. The town is surrounded by the Uncompahgre National Forest and is close to the ski resort of Telluride. The town is located in a valley surrounded by mountains, with the highest peak being Mount Wilson at 14,246 feet. The town is located in a temperate climate, with temperatures ranging from the low 30s in the winter to the mid-70s in the summer.
Economy
Mountain Village’s economy is largely based on tourism. The town is home to the Telluride Ski Resort, which is one of the most popular ski resorts in the United States. The resort attracts thousands of visitors each year, and provides jobs for many of the town’s residents. The town is also home to several restaurants, bars, and shops, which cater to the tourists who visit the area. The town is also home to several art galleries, which showcase the work of local artists.
Demographics
As of the 2010 census, the population of Mountain Village was 500 people. The racial makeup of the town was 95.2% White, 0.6% African American, 0.4% Native American, 0.4% Asian, 0.2% Pacific Islander, 0.8% from other races, and 2.4% from two or more races. Hispanic or Latino of any race were 4.2% of the population. The median age of the town was 43.2 years. The median household income was $68,750 and the median family income was $77,500.
History
Mountain Village was founded in 1883 by miners who were looking for gold and silver in the area. The town was originally called “Mountain City”, but the name was changed to “Mountain Village” in 1887. The town was incorporated in 1895 and was home to a variety of businesses, including a hotel, a general store, and a post office. The town was also home to a number of mines, which provided jobs for many of the town’s residents.
In the early 1900s, the town began to decline as the mines began to close. In the 1950s, the town was revitalized when the Telluride Ski Resort was built nearby. The resort brought in thousands of visitors each year, and provided jobs for many of the town’s residents. The town has continued to grow since then, and is now home to a variety of businesses, restaurants, and shops.
Common Questions
What is Per Capita Income in Mountain Village?
Per Capita income in Mountain Village is $80,843.
What is the Median Family Income in Mountain Village?
Median Family Income in Mountain Village is $140,357.
What is the Median Household income in Mountain Village?
Median Household Income in Mountain Village is $56,917.
What is Income or Wage Gap in Mountain Village?
Income or Wage Gap in Mountain Village is 25.7%.
Women in Mountain Village earn 74.3 cents for every dollar earned by a man.
What is Inequality or Gini Index in Mountain Village?
Inequality or Gini Index in Mountain Village is 0.67.
What is the Total Population of Mountain Village?
Total Population of Mountain Village is 1,582.
What is the Total Male Population of Mountain Village?
Total Male Population of Mountain Village is 923.
What is the Total Female Population of Mountain Village?
Total Female Population of Mountain Village is 659.
What is the Ratio of Males per 100 Females in Mountain Village?
There are 140.06 Males per 100 Females in Mountain Village.
What is the Ratio of Females per 100 Males in Mountain Village?
There are 71.40 Females per 100 Males in Mountain Village.
What is the Median Population Age in Mountain Village?
Median Population Age in Mountain Village is 34.2 Years.
What is the Average Family Size in Mountain Village
Average Family Size in Mountain Village is 2.5 People.
What is the Average Household Size in Mountain Village
Average Household Size in Mountain Village is 1.8 People.
How Large is the Labor Force in Mountain Village?
There are 1,130 People in the Labor Forcein in Mountain Village.
What is the Percentage of People in the Labor Force in Mountain Village?
77.9% of People are in the Labor Force in Mountain Village.
What is the Unemployment Rate in Mountain Village?
Unemployment Rate in Mountain Village is 5.5%.