Zip Codes with the Highest Percentage of Population Employed in Food Preparation & Serving in Broomfield, CO
RELATED REPORTS & OPTIONS
Food Preparation & Serving
Broomfield
Compare Zip Codes
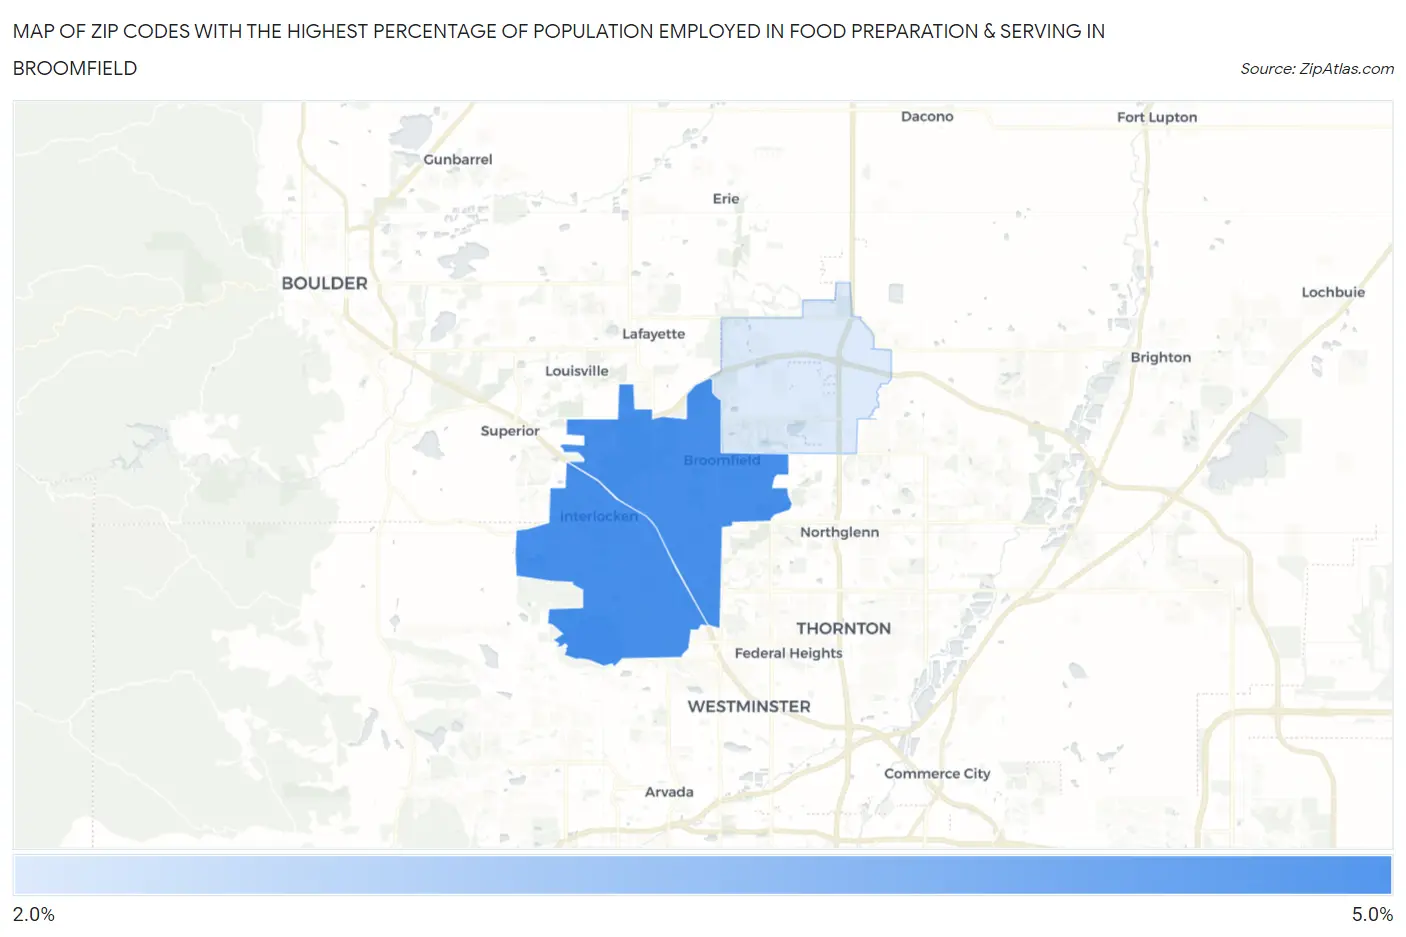
Map of Zip Codes with the Highest Percentage of Population Employed in Food Preparation & Serving in Broomfield
2.6%
5.0%
Zip Codes with the Highest Percentage of Population Employed in Food Preparation & Serving in Broomfield, CO
| Zip Code | % Employed | vs State | vs National | |
| 1. | 80021 | 5.0% | 5.2%(-0.229)#194 | 5.3%(-0.333)#13,134 |
| 2. | 80020 | 4.9% | 5.2%(-0.242)#195 | 5.3%(-0.347)#13,187 |
| 3. | 80023 | 2.6% | 5.2%(-2.59)#343 | 5.3%(-2.70)#22,827 |
1
Common Questions
What are the Top Zip Codes with the Highest Percentage of Population Employed in Food Preparation & Serving in Broomfield, CO?
Top Zip Codes with the Highest Percentage of Population Employed in Food Preparation & Serving in Broomfield, CO are:
What zip code has the Highest Percentage of Population Employed in Food Preparation & Serving in Broomfield, CO?
80021 has the Highest Percentage of Population Employed in Food Preparation & Serving in Broomfield, CO with 5.0%.
What is the Percentage of Population Employed in Food Preparation & Serving in Broomfield, CO?
Percentage of Population Employed in Food Preparation & Serving in Broomfield is 4.4%.
What is the Percentage of Population Employed in Food Preparation & Serving in Colorado?
Percentage of Population Employed in Food Preparation & Serving in Colorado is 5.2%.
What is the Percentage of Population Employed in Food Preparation & Serving in the United States?
Percentage of Population Employed in Food Preparation & Serving in the United States is 5.3%.