Derby, CO Map & Demographics
Derby Map
Derby Overview
$25,668
PER CAPITA INCOME
$92,718
AVG FAMILY INCOME
$77,261
AVG HOUSEHOLD INCOME
12.4%
WAGE / INCOME GAP [ % ]
87.6¢/ $1
WAGE / INCOME GAP [ $ ]
0.35
INEQUALITY / GINI INDEX
9,009
TOTAL POPULATION
4,704
MALE POPULATION
4,305
FEMALE POPULATION
109.27
MALES / 100 FEMALES
91.52
FEMALES / 100 MALES
31.9
MEDIAN AGE
3.9
AVG FAMILY SIZE
3.5
AVG HOUSEHOLD SIZE
4,456
LABOR FORCE [ PEOPLE ]
65.9%
PERCENT IN LABOR FORCE
4.8%
UNEMPLOYMENT RATE
Income in Derby
Income Overview in Derby
Per Capita Income in Derby is $25,668, while median incomes of families and households are $92,718 and $77,261 respectively.
| Characteristic | Number | Measure |
| Per Capita Income | 9,009 | $25,668 |
| Median Family Income | 2,078 | $92,718 |
| Mean Family Income | 2,078 | $92,290 |
| Median Household Income | 2,527 | $77,261 |
| Mean Household Income | 2,527 | $87,868 |
| Income Deficit | 2,078 | $0 |
| Wage / Income Gap (%) | 9,009 | 12.44% |
| Wage / Income Gap ($) | 9,009 | 87.56¢ per $1 |
| Gini / Inequality Index | 9,009 | 0.35 |
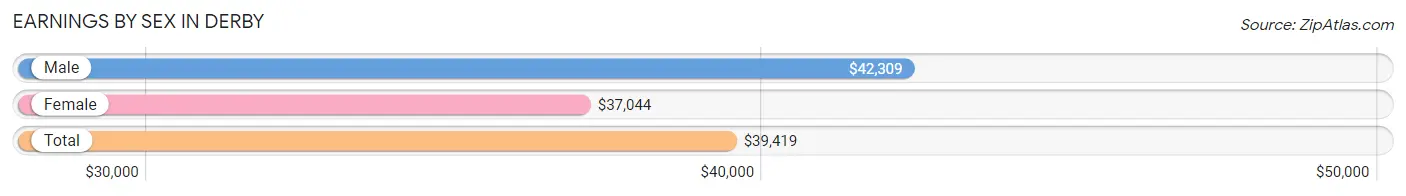
Earnings by Sex in Derby
Average Earnings in Derby are $39,419, $42,309 for men and $37,044 for women, a difference of 12.4%.
| Sex | Number | Average Earnings |
| Male | 2,809 (58.6%) | $42,309 |
| Female | 1,987 (41.4%) | $37,044 |
| Total | 4,796 (100.0%) | $39,419 |
Earnings by Sex by Income Bracket in Derby
The most common earnings brackets in Derby are $75,000 to $99,999 for men (403 | 14.3%) and $40,000 to $44,999 for women (278 | 14.0%).
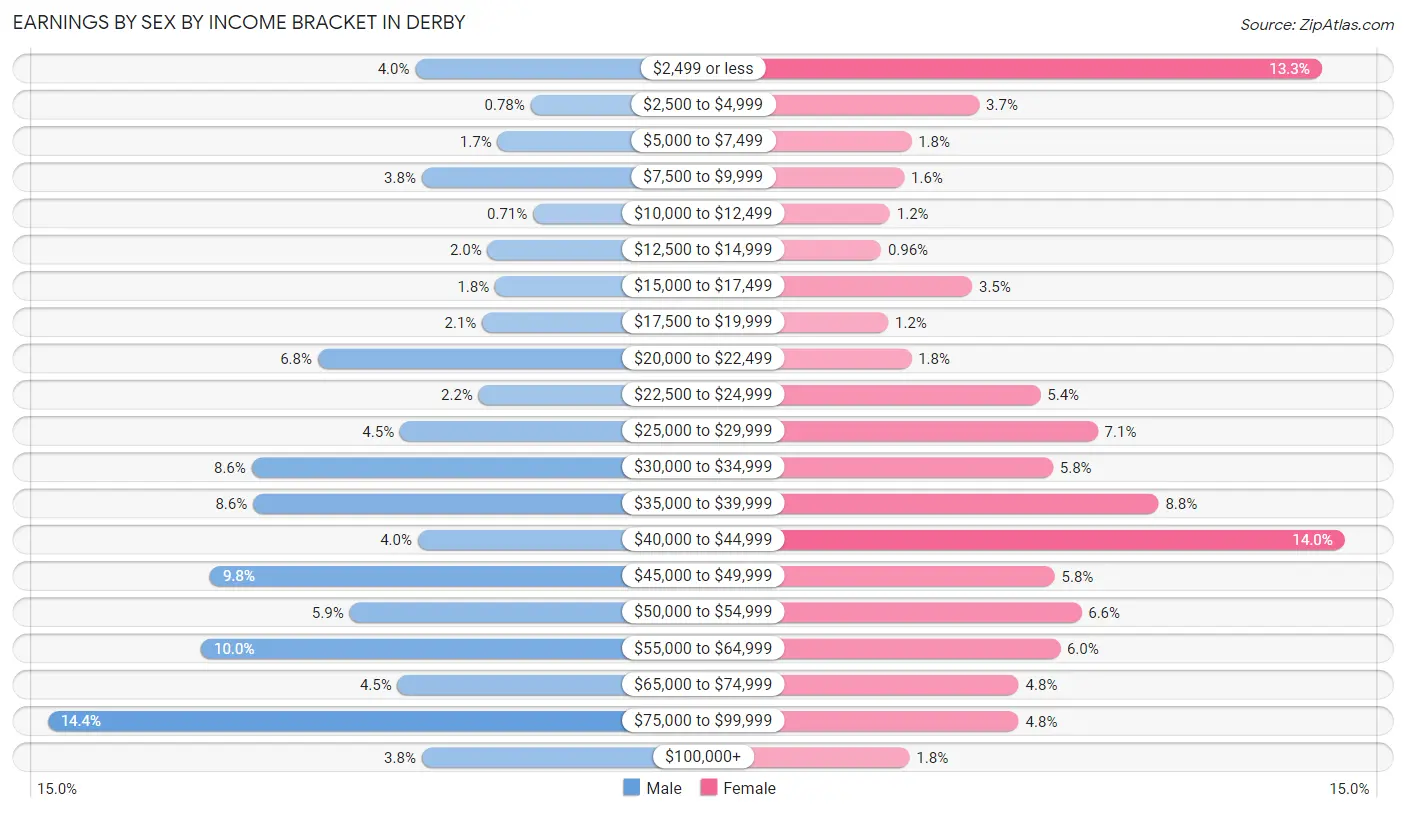
| Income | Male | Female |
| $2,499 or less | 113 (4.0%) | 265 (13.3%) |
| $2,500 to $4,999 | 22 (0.8%) | 74 (3.7%) |
| $5,000 to $7,499 | 48 (1.7%) | 36 (1.8%) |
| $7,500 to $9,999 | 108 (3.8%) | 32 (1.6%) |
| $10,000 to $12,499 | 20 (0.7%) | 24 (1.2%) |
| $12,500 to $14,999 | 56 (2.0%) | 19 (1.0%) |
| $15,000 to $17,499 | 50 (1.8%) | 70 (3.5%) |
| $17,500 to $19,999 | 60 (2.1%) | 23 (1.2%) |
| $20,000 to $22,499 | 190 (6.8%) | 36 (1.8%) |
| $22,500 to $24,999 | 63 (2.2%) | 108 (5.4%) |
| $25,000 to $29,999 | 125 (4.4%) | 140 (7.0%) |
| $30,000 to $34,999 | 242 (8.6%) | 115 (5.8%) |
| $35,000 to $39,999 | 241 (8.6%) | 174 (8.8%) |
| $40,000 to $44,999 | 111 (4.0%) | 278 (14.0%) |
| $45,000 to $49,999 | 275 (9.8%) | 116 (5.8%) |
| $50,000 to $54,999 | 165 (5.9%) | 131 (6.6%) |
| $55,000 to $64,999 | 282 (10.0%) | 119 (6.0%) |
| $65,000 to $74,999 | 127 (4.5%) | 96 (4.8%) |
| $75,000 to $99,999 | 403 (14.3%) | 96 (4.8%) |
| $100,000+ | 108 (3.8%) | 35 (1.8%) |
| Total | 2,809 (100.0%) | 1,987 (100.0%) |
Earnings by Sex by Educational Attainment in Derby
Average earnings in Derby are $48,281 for men and $39,077 for women, a difference of 19.1%. Men with an educational attainment of bachelor's degree enjoy the highest average annual earnings of $58,193, while those with high school diploma education earn the least with $37,750. Women with an educational attainment of graduate degree earn the most with the average annual earnings of $44,886, while those with high school diploma education have the smallest earnings of $31,859.
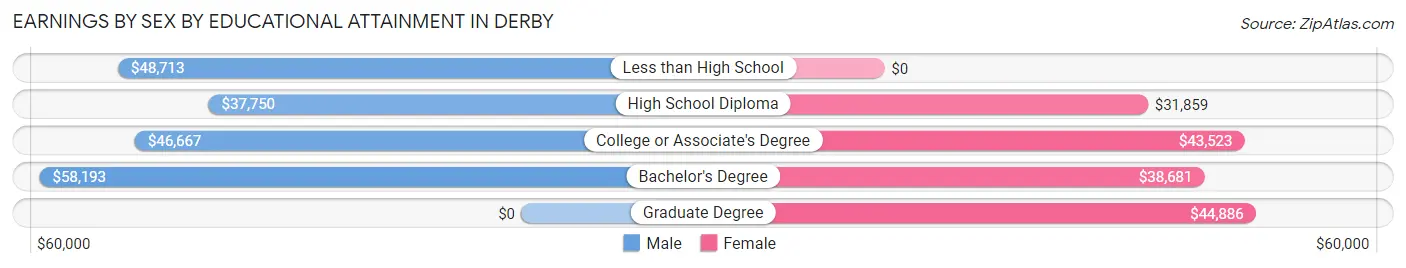
| Educational Attainment | Male Income | Female Income |
| Less than High School | $48,713 | $0 |
| High School Diploma | $37,750 | $31,859 |
| College or Associate's Degree | $46,667 | $43,523 |
| Bachelor's Degree | $58,193 | $38,681 |
| Graduate Degree | - | - |
| Total | $48,281 | $39,077 |
Family Income in Derby
Family Income Brackets in Derby
According to the Derby family income data, there are 484 families falling into the $50,000 to $74,999 income range, which is the most common income bracket and makes up 23.3% of all families. Conversely, the $15,000 to $24,999 income bracket is the least frequent group with only 29 families (1.4%) belonging to this category.
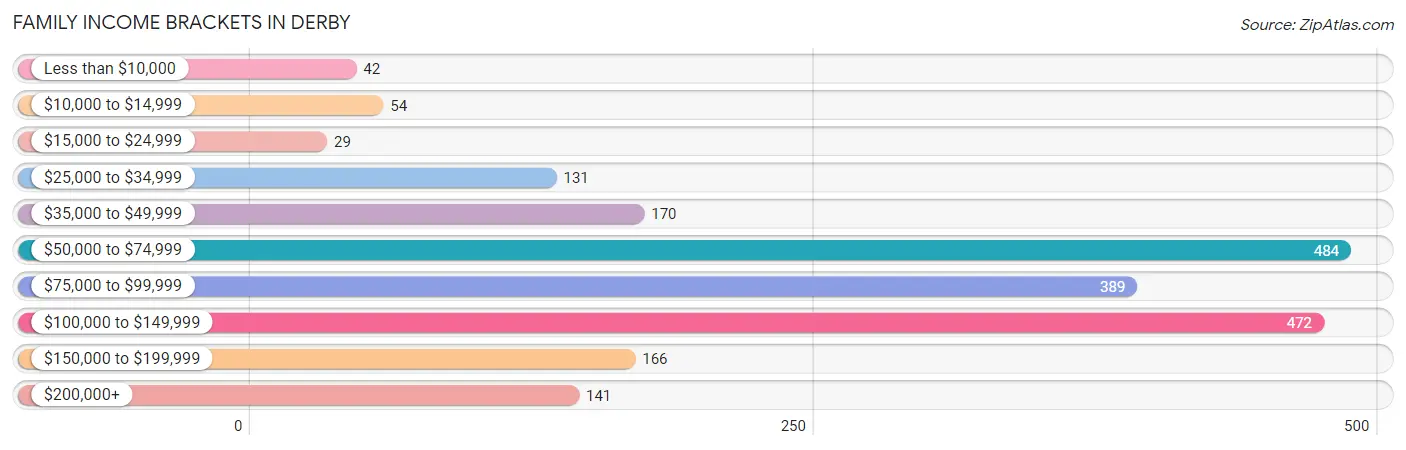
| Income Bracket | # Families | % Families |
| Less than $10,000 | 42 | 2.0% |
| $10,000 to $14,999 | 54 | 2.6% |
| $15,000 to $24,999 | 29 | 1.4% |
| $25,000 to $34,999 | 131 | 6.3% |
| $35,000 to $49,999 | 170 | 8.2% |
| $50,000 to $74,999 | 484 | 23.3% |
| $75,000 to $99,999 | 389 | 18.7% |
| $100,000 to $149,999 | 472 | 22.7% |
| $150,000 to $199,999 | 166 | 8.0% |
| $200,000+ | 141 | 6.8% |
Family Income by Famaliy Size in Derby
7+ person families (89 | 4.3%) account for the highest median family income in Derby with $187,083 per family, while 2-person families (513 | 24.7%) have the highest median income of $34,110 per family member.
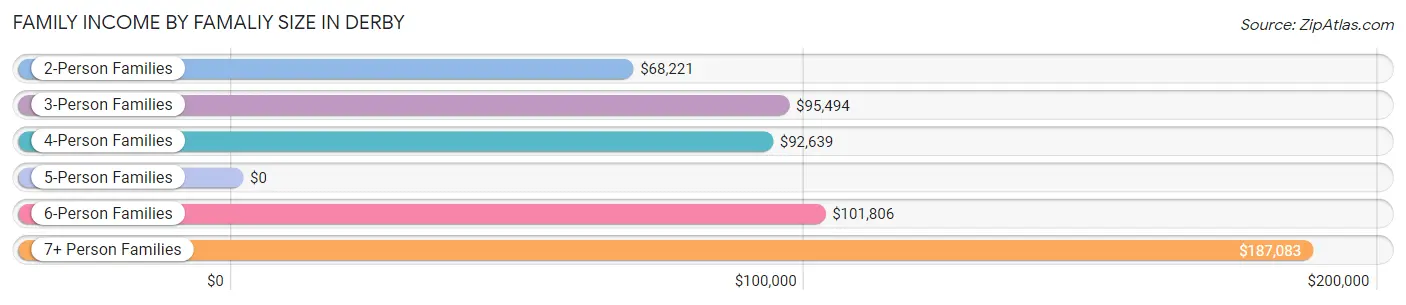
| Income Bracket | # Families | Median Income |
| 2-Person Families | 513 (24.7%) | $68,221 |
| 3-Person Families | 505 (24.3%) | $95,494 |
| 4-Person Families | 532 (25.6%) | $92,639 |
| 5-Person Families | 210 (10.1%) | $0 |
| 6-Person Families | 229 (11.0%) | $101,806 |
| 7+ Person Families | 89 (4.3%) | $187,083 |
| Total | 2,078 (100.0%) | $92,718 |
Family Income by Number of Earners in Derby
The median family income in Derby is $92,718, with families comprising 3+ earners (591) having the highest median family income of $102,454, while families with no earners (92) have the lowest median family income of $48,654, accounting for 28.4% and 4.4% of families, respectively.
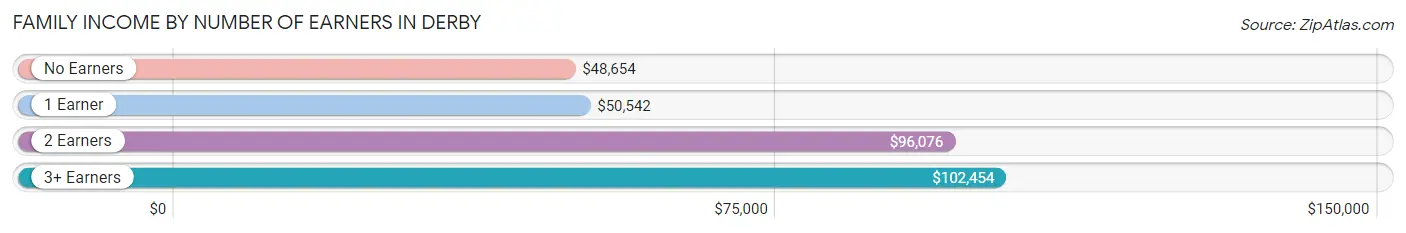
| Number of Earners | # Families | Median Income |
| No Earners | 92 (4.4%) | $48,654 |
| 1 Earner | 644 (31.0%) | $50,542 |
| 2 Earners | 751 (36.1%) | $96,076 |
| 3+ Earners | 591 (28.4%) | $102,454 |
| Total | 2,078 (100.0%) | $92,718 |
Household Income in Derby
Household Income Brackets in Derby
With 581 households falling in the category, the $50,000 to $74,999 income range is the most frequent in Derby, accounting for 23.0% of all households. In contrast, only 48 households (1.9%) fall into the $15,000 to $24,999 income bracket, making it the least populous group.
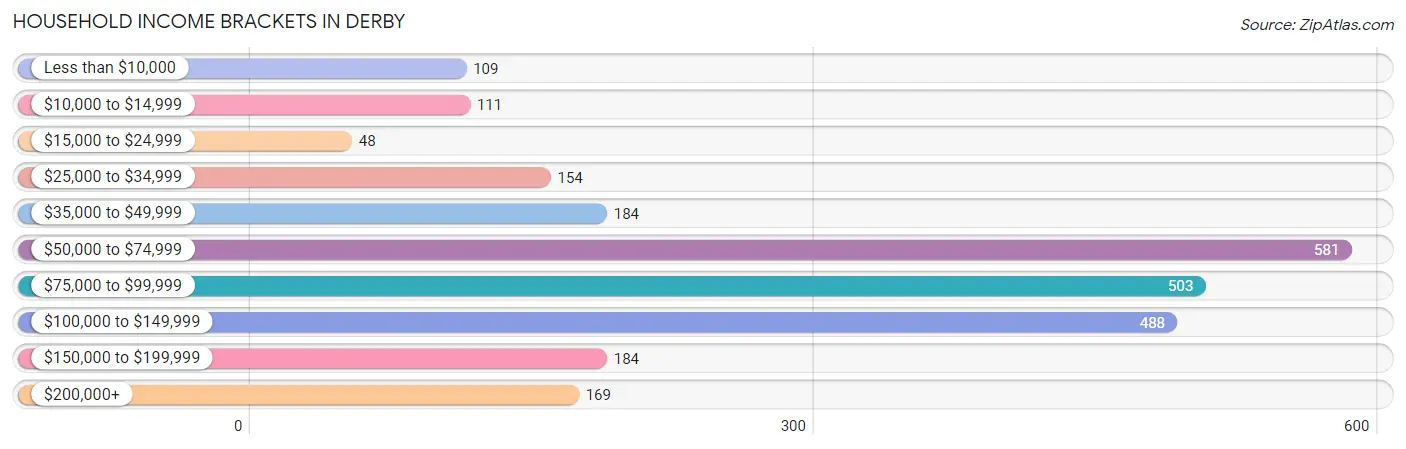
| Income Bracket | # Households | % Households |
| Less than $10,000 | 109 | 4.3% |
| $10,000 to $14,999 | 111 | 4.4% |
| $15,000 to $24,999 | 48 | 1.9% |
| $25,000 to $34,999 | 154 | 6.1% |
| $35,000 to $49,999 | 184 | 7.3% |
| $50,000 to $74,999 | 581 | 23.0% |
| $75,000 to $99,999 | 503 | 19.9% |
| $100,000 to $149,999 | 488 | 19.3% |
| $150,000 to $199,999 | 184 | 7.3% |
| $200,000+ | 169 | 6.7% |
Household Income by Householder Age in Derby
The median household income in Derby is $77,261, with the highest median household income of $95,000 found in the 45 to 64 years age bracket for the primary householder. A total of 1,202 households (47.6%) fall into this category. Meanwhile, the 15 to 24 years age bracket for the primary householder has the lowest median household income of $0, with 174 households (6.9%) in this group.
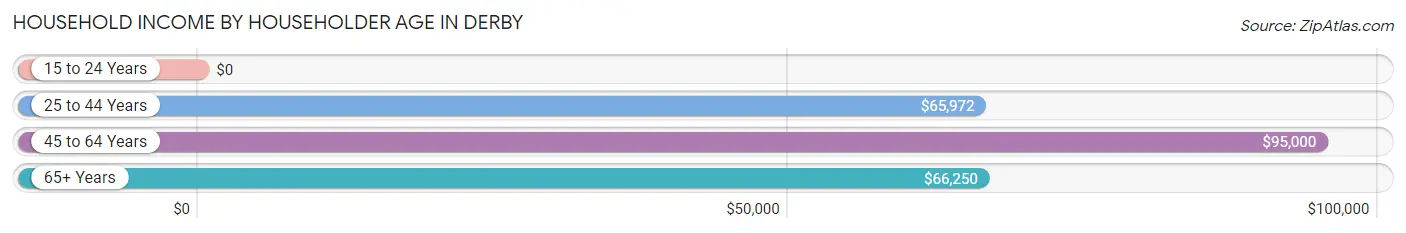
| Income Bracket | # Households | Median Income |
| 15 to 24 Years | 174 (6.9%) | $0 |
| 25 to 44 Years | 826 (32.7%) | $65,972 |
| 45 to 64 Years | 1,202 (47.6%) | $95,000 |
| 65+ Years | 325 (12.9%) | $66,250 |
| Total | 2,527 (100.0%) | $77,261 |
Poverty in Derby
Income Below Poverty by Sex and Age in Derby
With 10.3% poverty level for males and 14.9% for females among the residents of Derby, 6 to 11 year old males and 16 and 17 year old females are the most vulnerable to poverty, with 137 males (36.7%) and 102 females (45.7%) in their respective age groups living below the poverty level.
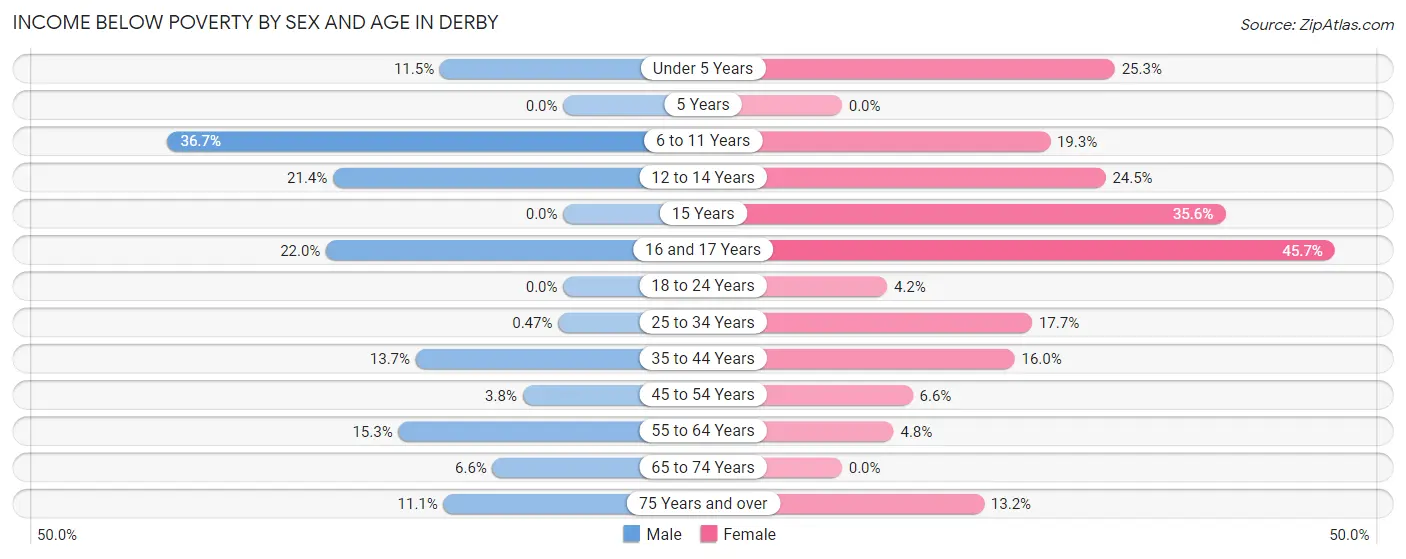
| Age Bracket | Male | Female |
| Under 5 Years | 26 (11.5%) | 76 (25.3%) |
| 5 Years | 0 (0.0%) | 0 (0.0%) |
| 6 to 11 Years | 137 (36.7%) | 97 (19.3%) |
| 12 to 14 Years | 56 (21.4%) | 58 (24.5%) |
| 15 Years | 0 (0.0%) | 16 (35.6%) |
| 16 and 17 Years | 46 (22.0%) | 102 (45.7%) |
| 18 to 24 Years | 0 (0.0%) | 15 (4.2%) |
| 25 to 34 Years | 3 (0.5%) | 108 (17.6%) |
| 35 to 44 Years | 85 (13.7%) | 92 (16.0%) |
| 45 to 54 Years | 26 (3.8%) | 48 (6.6%) |
| 55 to 64 Years | 69 (15.3%) | 18 (4.8%) |
| 65 to 74 Years | 21 (6.6%) | 0 (0.0%) |
| 75 Years and over | 8 (11.1%) | 12 (13.2%) |
| Total | 477 (10.3%) | 642 (14.9%) |
Income Above Poverty by Sex and Age in Derby
According to the poverty statistics in Derby, males aged 5 years and females aged 5 years are the age groups that are most secure financially, with 100.0% of males and 100.0% of females in these age groups living above the poverty line.
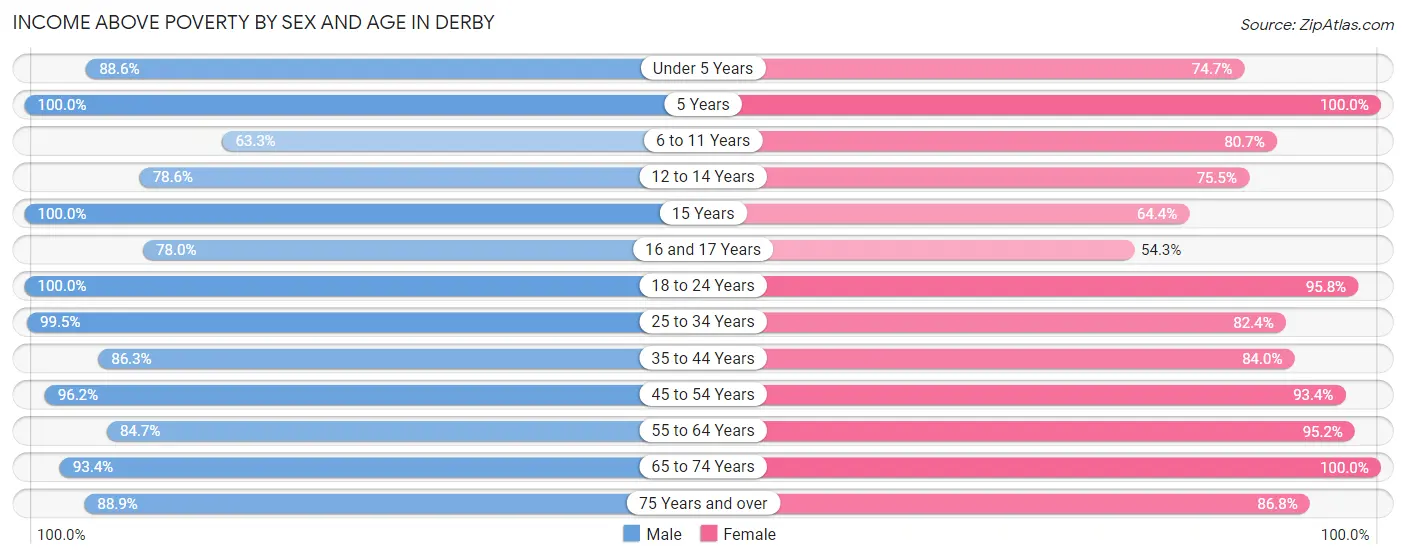
| Age Bracket | Male | Female |
| Under 5 Years | 201 (88.5%) | 224 (74.7%) |
| 5 Years | 117 (100.0%) | 29 (100.0%) |
| 6 to 11 Years | 236 (63.3%) | 405 (80.7%) |
| 12 to 14 Years | 206 (78.6%) | 179 (75.5%) |
| 15 Years | 106 (100.0%) | 29 (64.4%) |
| 16 and 17 Years | 163 (78.0%) | 121 (54.3%) |
| 18 to 24 Years | 563 (100.0%) | 342 (95.8%) |
| 25 to 34 Years | 637 (99.5%) | 504 (82.4%) |
| 35 to 44 Years | 536 (86.3%) | 482 (84.0%) |
| 45 to 54 Years | 664 (96.2%) | 683 (93.4%) |
| 55 to 64 Years | 382 (84.7%) | 357 (95.2%) |
| 65 to 74 Years | 299 (93.4%) | 229 (100.0%) |
| 75 Years and over | 64 (88.9%) | 79 (86.8%) |
| Total | 4,174 (89.7%) | 3,663 (85.1%) |
Income Below Poverty Among Married-Couple Families in Derby
The poverty statistics for married-couple families in Derby show that 3.6% or 51 of the total 1,420 families live below the poverty line. Families with 5 or more children have the highest poverty rate of 100.0%, comprising of 27 families. On the other hand, families with no children have the lowest poverty rate of 0.0%, which includes 0 families.
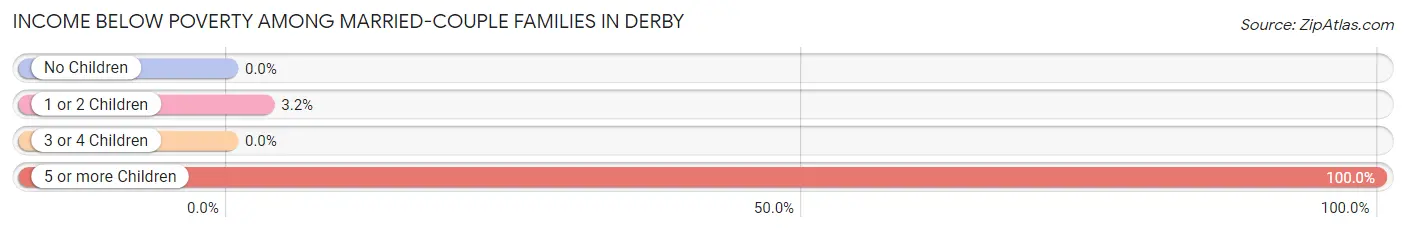
| Children | Above Poverty | Below Poverty |
| No Children | 501 (100.0%) | 0 (0.0%) |
| 1 or 2 Children | 736 (96.8%) | 24 (3.2%) |
| 3 or 4 Children | 132 (100.0%) | 0 (0.0%) |
| 5 or more Children | 0 (0.0%) | 27 (100.0%) |
| Total | 1,369 (96.4%) | 51 (3.6%) |
Income Below Poverty Among Single-Parent Households in Derby
According to the poverty data in Derby, 20.9% or 55 single-father households and 16.0% or 63 single-mother households are living below the poverty line. Among single-father households, those with 3 or 4 children have the highest poverty rate, with 26 households (81.2%) experiencing poverty. Likewise, among single-mother households, those with 3 or 4 children have the highest poverty rate, with 48 households (44.9%) falling below the poverty line.
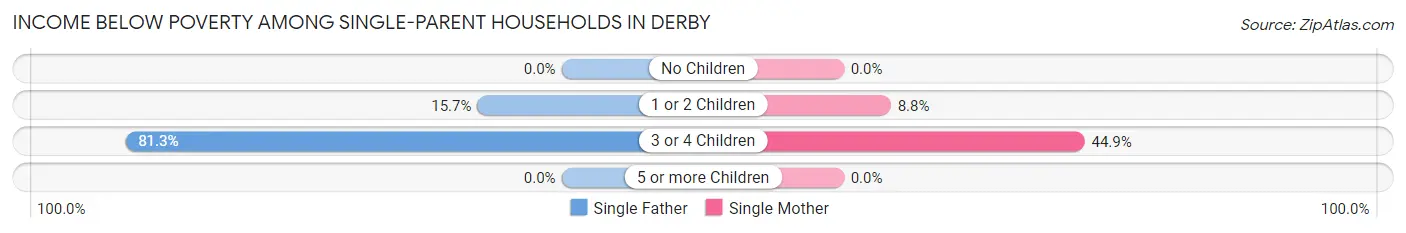
| Children | Single Father | Single Mother |
| No Children | 0 (0.0%) | 0 (0.0%) |
| 1 or 2 Children | 29 (15.7%) | 15 (8.8%) |
| 3 or 4 Children | 26 (81.2%) | 48 (44.9%) |
| 5 or more Children | 0 (0.0%) | 0 (0.0%) |
| Total | 55 (20.9%) | 63 (16.0%) |
Income Below Poverty Among Married-Couple vs Single-Parent Households in Derby
The poverty data for Derby shows that 51 of the married-couple family households (3.6%) and 118 of the single-parent households (17.9%) are living below the poverty level. Within the married-couple family households, those with 5 or more children have the highest poverty rate, with 27 households (100.0%) falling below the poverty line. Among the single-parent households, those with 3 or 4 children have the highest poverty rate, with 74 household (53.2%) living below poverty.
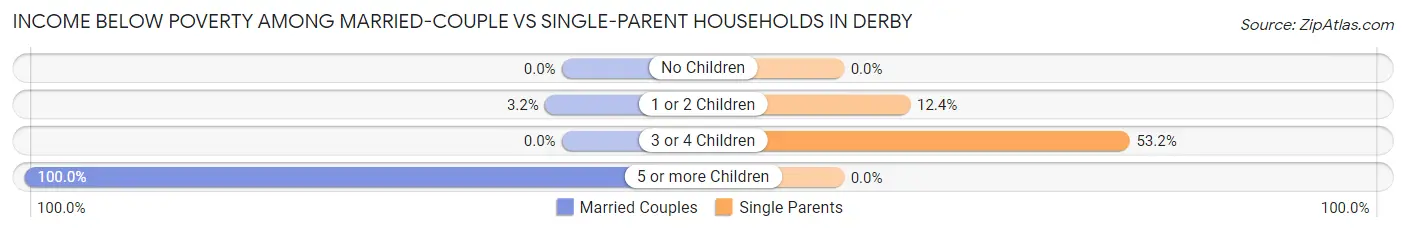
| Children | Married-Couple Families | Single-Parent Households |
| No Children | 0 (0.0%) | 0 (0.0%) |
| 1 or 2 Children | 24 (3.2%) | 44 (12.4%) |
| 3 or 4 Children | 0 (0.0%) | 74 (53.2%) |
| 5 or more Children | 27 (100.0%) | 0 (0.0%) |
| Total | 51 (3.6%) | 118 (17.9%) |
Race in Derby
The most populous races in Derby are Hispanic or Latino (6,617 | 73.5%), White / Caucasian (5,721 | 63.5%), and Two or more Races (1,757 | 19.5%).
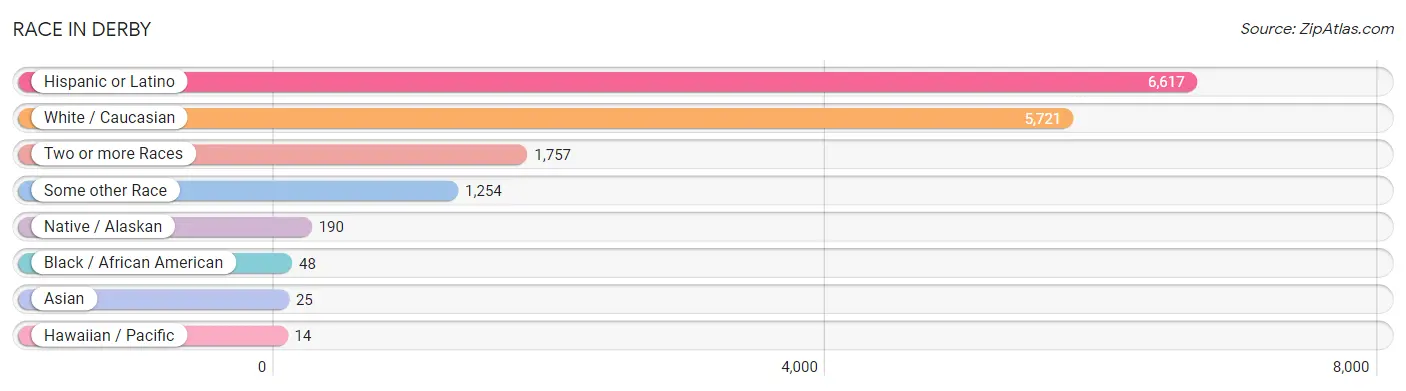
| Race | # Population | % Population |
| Asian | 25 | 0.3% |
| Black / African American | 48 | 0.5% |
| Hawaiian / Pacific | 14 | 0.2% |
| Hispanic or Latino | 6,617 | 73.5% |
| Native / Alaskan | 190 | 2.1% |
| White / Caucasian | 5,721 | 63.5% |
| Two or more Races | 1,757 | 19.5% |
| Some other Race | 1,254 | 13.9% |
| Total | 9,009 | 100.0% |
Ancestry in Derby
The most populous ancestries reported in Derby are Mexican (5,588 | 62.0%), German (431 | 4.8%), English (219 | 2.4%), American (199 | 2.2%), and Scottish (169 | 1.9%), together accounting for 73.3% of all Derby residents.
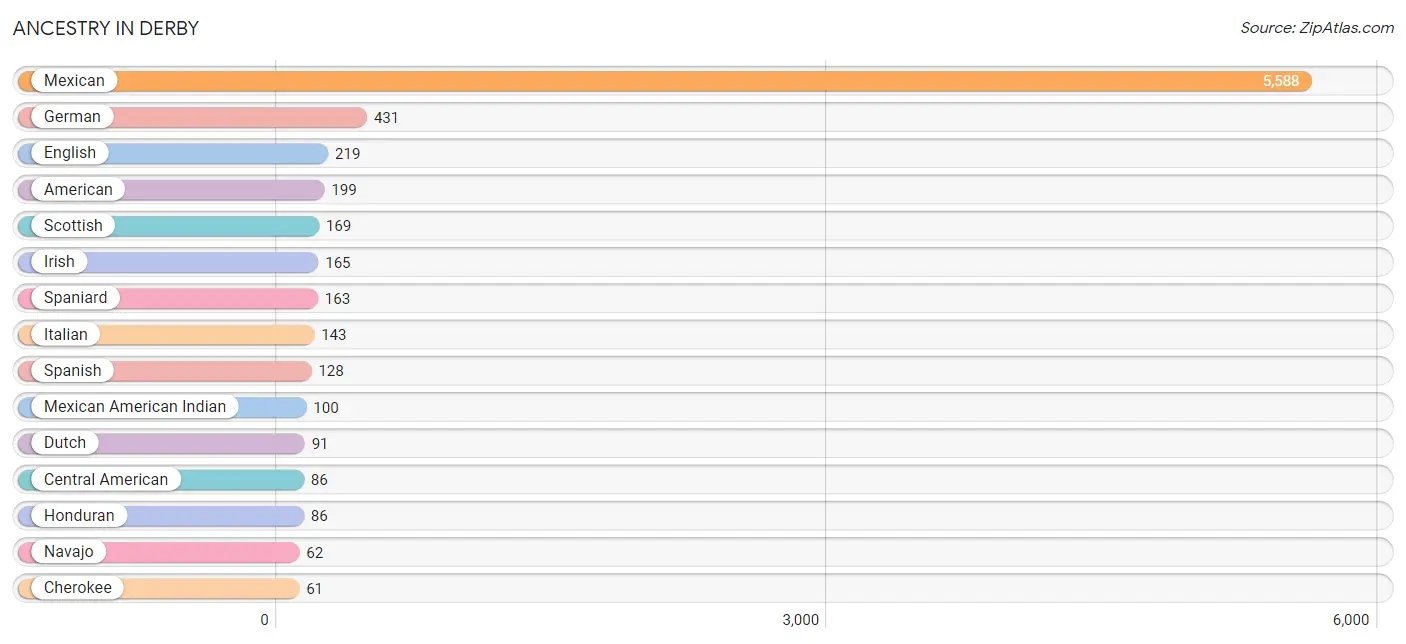
| Ancestry | # Population | % Population |
| American | 199 | 2.2% |
| Apache | 2 | 0.0% |
| Austrian | 17 | 0.2% |
| Central American | 86 | 0.9% |
| Cherokee | 61 | 0.7% |
| Chilean | 6 | 0.1% |
| Danish | 16 | 0.2% |
| Dutch | 91 | 1.0% |
| English | 219 | 2.4% |
| European | 34 | 0.4% |
| Finnish | 12 | 0.1% |
| French | 29 | 0.3% |
| French Canadian | 14 | 0.2% |
| German | 431 | 4.8% |
| Greek | 57 | 0.6% |
| Honduran | 86 | 0.9% |
| Irish | 165 | 1.8% |
| Italian | 143 | 1.6% |
| Korean | 11 | 0.1% |
| Mexican | 5,588 | 62.0% |
| Mexican American Indian | 100 | 1.1% |
| Navajo | 62 | 0.7% |
| Norwegian | 16 | 0.2% |
| Pakistani | 14 | 0.2% |
| Polish | 6 | 0.1% |
| Russian | 17 | 0.2% |
| Samoan | 56 | 0.6% |
| Scandinavian | 1 | 0.0% |
| Scotch-Irish | 16 | 0.2% |
| Scottish | 169 | 1.9% |
| Sioux | 61 | 0.7% |
| South American | 6 | 0.1% |
| Spaniard | 163 | 1.8% |
| Spanish | 128 | 1.4% |
| Sri Lankan | 24 | 0.3% |
| Swedish | 10 | 0.1% |
| Turkish | 9 | 0.1% |
| Ukrainian | 53 | 0.6% |
| Welsh | 8 | 0.1% | View All 39 Rows |
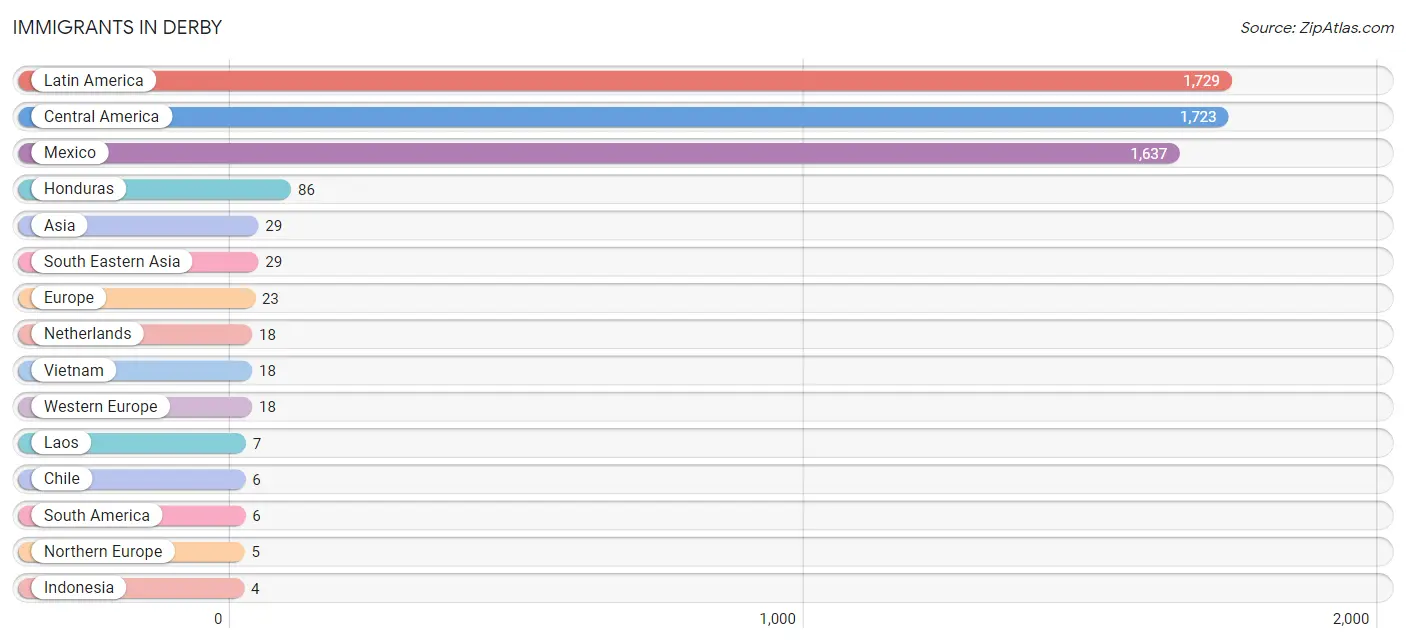
Immigrants in Derby
The most numerous immigrant groups reported in Derby came from Latin America (1,729 | 19.2%), Central America (1,723 | 19.1%), Mexico (1,637 | 18.2%), Honduras (86 | 0.9%), and Asia (29 | 0.3%), together accounting for 57.8% of all Derby residents.
| Immigration Origin | # Population | % Population |
| Asia | 29 | 0.3% |
| Central America | 1,723 | 19.1% |
| Chile | 6 | 0.1% |
| Europe | 23 | 0.3% |
| Honduras | 86 | 0.9% |
| Indonesia | 4 | 0.0% |
| Laos | 7 | 0.1% |
| Latin America | 1,729 | 19.2% |
| Mexico | 1,637 | 18.2% |
| Netherlands | 18 | 0.2% |
| Northern Europe | 5 | 0.1% |
| South America | 6 | 0.1% |
| South Eastern Asia | 29 | 0.3% |
| Vietnam | 18 | 0.2% |
| Western Europe | 18 | 0.2% | View All 15 Rows |
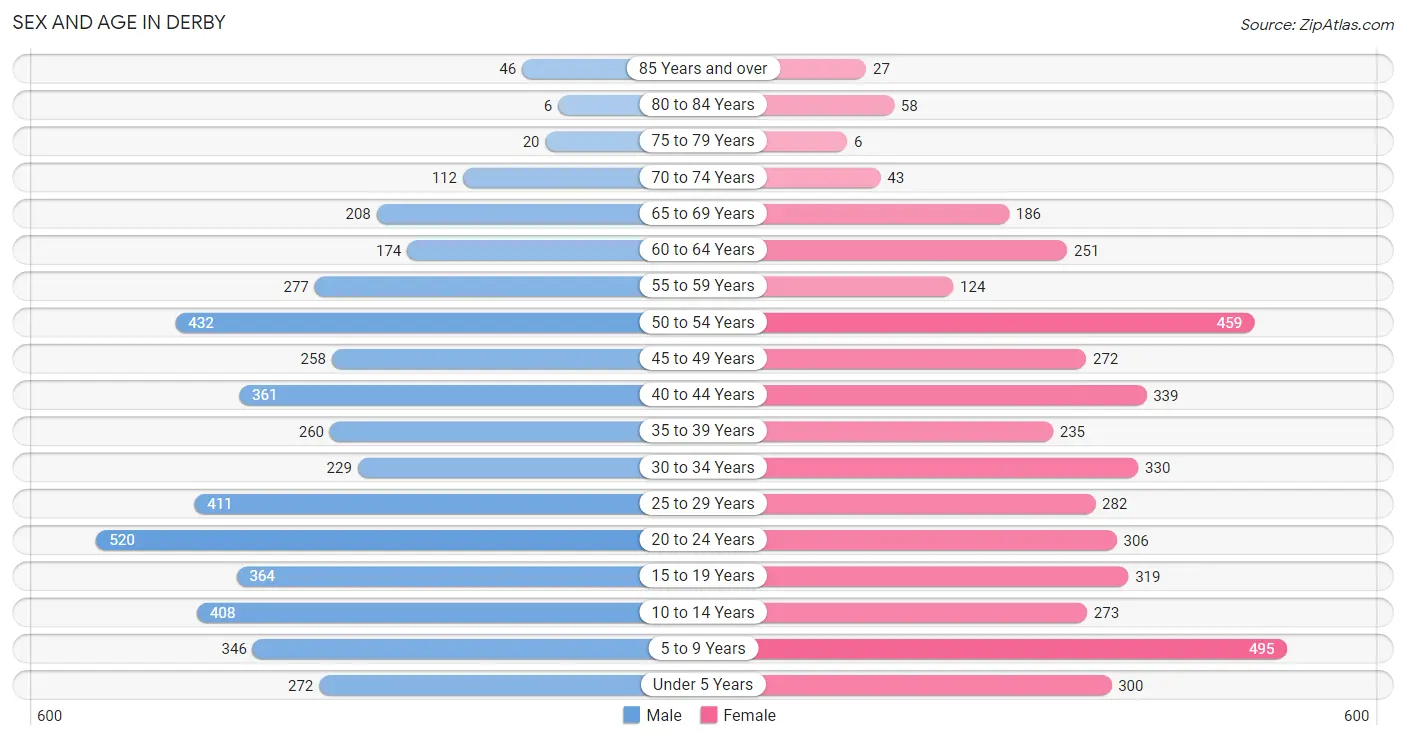
Sex and Age in Derby
Sex and Age in Derby
The most populous age groups in Derby are 20 to 24 Years (520 | 11.1%) for men and 5 to 9 Years (495 | 11.5%) for women.
| Age Bracket | Male | Female |
| Under 5 Years | 272 (5.8%) | 300 (7.0%) |
| 5 to 9 Years | 346 (7.4%) | 495 (11.5%) |
| 10 to 14 Years | 408 (8.7%) | 273 (6.3%) |
| 15 to 19 Years | 364 (7.7%) | 319 (7.4%) |
| 20 to 24 Years | 520 (11.1%) | 306 (7.1%) |
| 25 to 29 Years | 411 (8.7%) | 282 (6.6%) |
| 30 to 34 Years | 229 (4.9%) | 330 (7.7%) |
| 35 to 39 Years | 260 (5.5%) | 235 (5.5%) |
| 40 to 44 Years | 361 (7.7%) | 339 (7.9%) |
| 45 to 49 Years | 258 (5.5%) | 272 (6.3%) |
| 50 to 54 Years | 432 (9.2%) | 459 (10.7%) |
| 55 to 59 Years | 277 (5.9%) | 124 (2.9%) |
| 60 to 64 Years | 174 (3.7%) | 251 (5.8%) |
| 65 to 69 Years | 208 (4.4%) | 186 (4.3%) |
| 70 to 74 Years | 112 (2.4%) | 43 (1.0%) |
| 75 to 79 Years | 20 (0.4%) | 6 (0.1%) |
| 80 to 84 Years | 6 (0.1%) | 58 (1.3%) |
| 85 Years and over | 46 (1.0%) | 27 (0.6%) |
| Total | 4,704 (100.0%) | 4,305 (100.0%) |
Families and Households in Derby
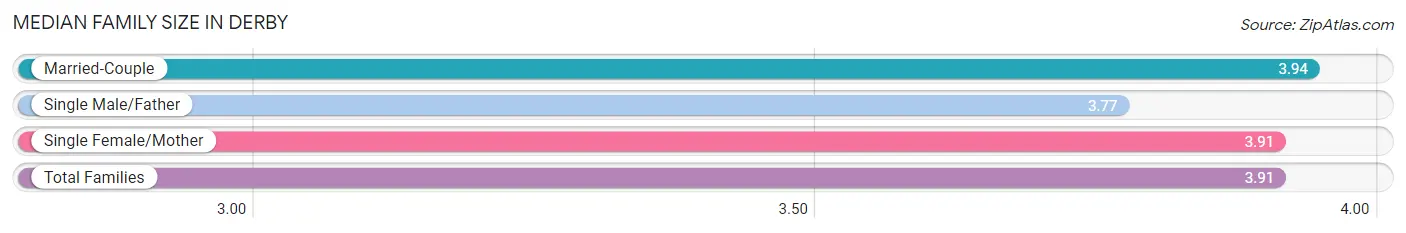
Median Family Size in Derby
The median family size in Derby is 3.91 persons per family, with married-couple families (1,420 | 68.3%) accounting for the largest median family size of 3.94 persons per family. On the other hand, single male/father families (263 | 12.7%) represent the smallest median family size with 3.77 persons per family.
| Family Type | # Families | Family Size |
| Married-Couple | 1,420 (68.3%) | 3.94 |
| Single Male/Father | 263 (12.7%) | 3.77 |
| Single Female/Mother | 395 (19.0%) | 3.91 |
| Total Families | 2,078 (100.0%) | 3.91 |
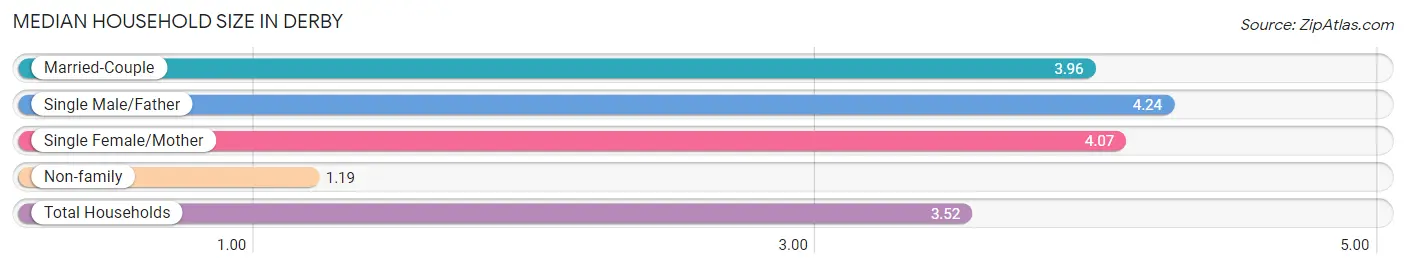
Median Household Size in Derby
The median household size in Derby is 3.52 persons per household, with single male/father households (263 | 10.4%) accounting for the largest median household size of 4.24 persons per household. non-family households (449 | 17.8%) represent the smallest median household size with 1.19 persons per household.
| Household Type | # Households | Household Size |
| Married-Couple | 1,420 (56.2%) | 3.96 |
| Single Male/Father | 263 (10.4%) | 4.24 |
| Single Female/Mother | 395 (15.6%) | 4.07 |
| Non-family | 449 (17.8%) | 1.19 |
| Total Households | 2,527 (100.0%) | 3.52 |
Household Size by Marriage Status in Derby
Out of a total of 2,527 households in Derby, 2,078 (82.2%) are family households, while 449 (17.8%) are nonfamily households. The most numerous type of family households are 4-person households, comprising 532, and the most common type of nonfamily households are 1-person households, comprising 370.
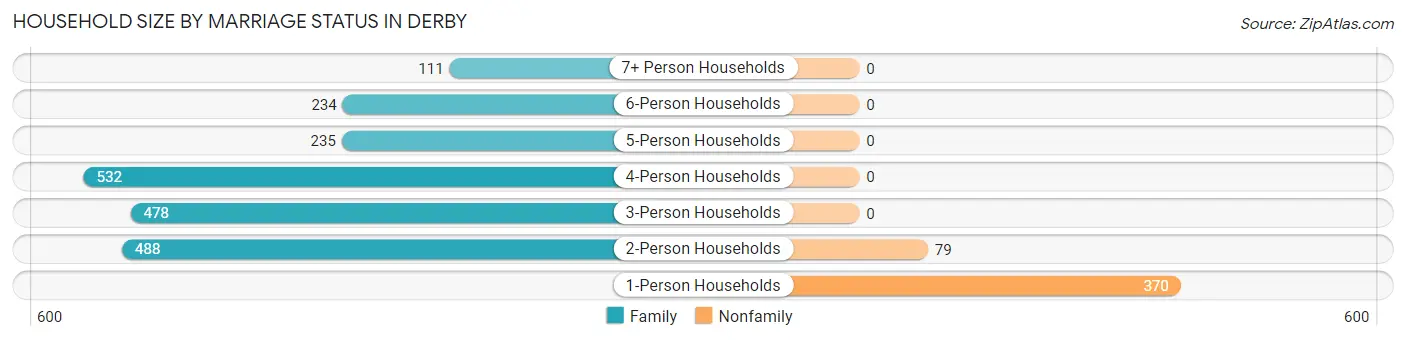
| Household Size | Family Households | Nonfamily Households |
| 1-Person Households | - | 370 (14.6%) |
| 2-Person Households | 488 (19.3%) | 79 (3.1%) |
| 3-Person Households | 478 (18.9%) | 0 (0.0%) |
| 4-Person Households | 532 (21.0%) | 0 (0.0%) |
| 5-Person Households | 235 (9.3%) | 0 (0.0%) |
| 6-Person Households | 234 (9.3%) | 0 (0.0%) |
| 7+ Person Households | 111 (4.4%) | 0 (0.0%) |
| Total | 2,078 (82.2%) | 449 (17.8%) |
Female Fertility in Derby
Fertility by Age in Derby
Average fertility rate in Derby is 67.0 births per 1,000 women. Women in the age bracket of 20 to 34 years have the highest fertility rate with 138.0 births per 1,000 women. Women in the age bracket of 20 to 34 years acount for 79.4% of all women with births.
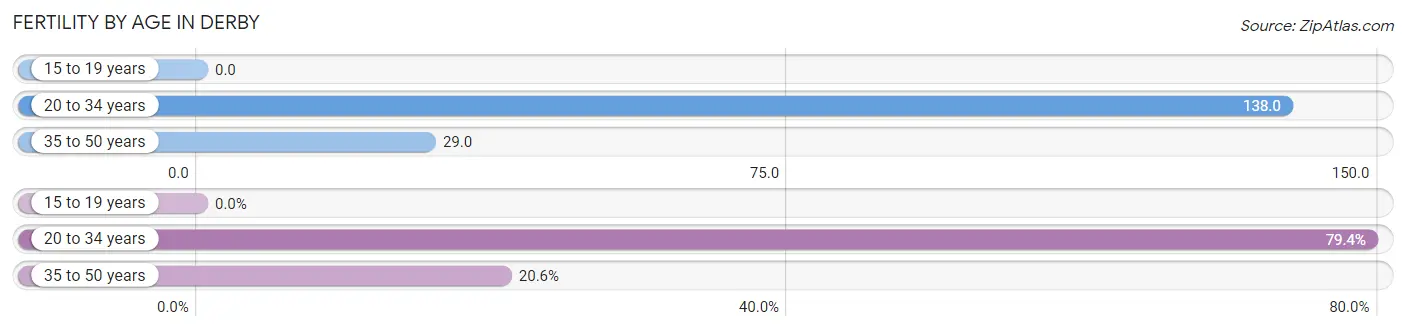
| Age Bracket | Women with Births | Births / 1,000 Women |
| 15 to 19 years | 0 (0.0%) | 0.0 |
| 20 to 34 years | 127 (79.4%) | 138.0 |
| 35 to 50 years | 33 (20.6%) | 29.0 |
| Total | 160 (100.0%) | 67.0 |
Fertility by Age by Marriage Status in Derby
30.6% of women with births (160) in Derby are married. The highest percentage of unmarried women with births falls into 20 to 34 years age bracket with 87.4% of them unmarried at the time of birth, while the lowest percentage of unmarried women with births belong to 35 to 50 years age bracket with 0.0% of them unmarried.
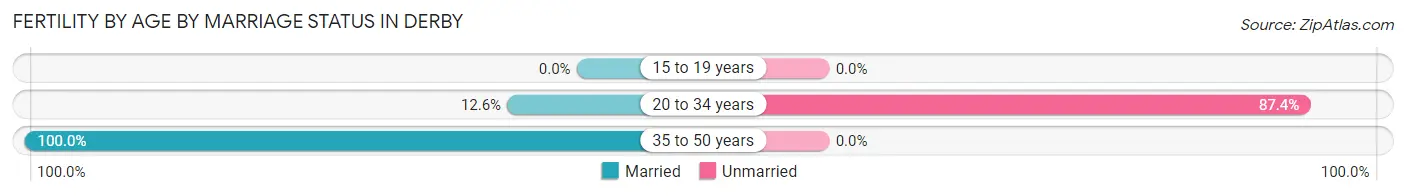
| Age Bracket | Married | Unmarried |
| 15 to 19 years | 0 (0.0%) | 0 (0.0%) |
| 20 to 34 years | 16 (12.6%) | 111 (87.4%) |
| 35 to 50 years | 33 (100.0%) | 0 (0.0%) |
| Total | 49 (30.6%) | 111 (69.4%) |
Fertility by Education in Derby
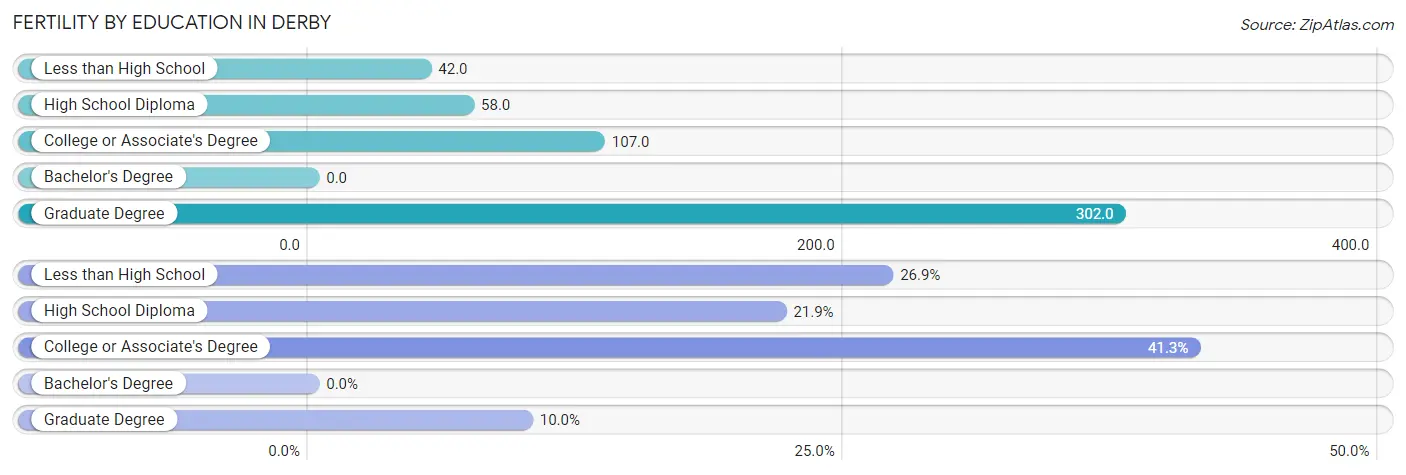
| Educational Attainment | Women with Births | Births / 1,000 Women |
| Less than High School | 43 (26.9%) | 42.0 |
| High School Diploma | 35 (21.9%) | 58.0 |
| College or Associate's Degree | 66 (41.2%) | 107.0 |
| Bachelor's Degree | 0 (0.0%) | 0.0 |
| Graduate Degree | 16 (10.0%) | 302.0 |
| Total | 160 (100.0%) | 67.0 |
Fertility by Education by Marriage Status in Derby
69.4% of women with births in Derby are unmarried. Women with the educational attainment of graduate degree are most likely to be married with 100.0% of them married at childbirth, while women with the educational attainment of high school diploma are least likely to be married with 100.0% of them unmarried at childbirth.
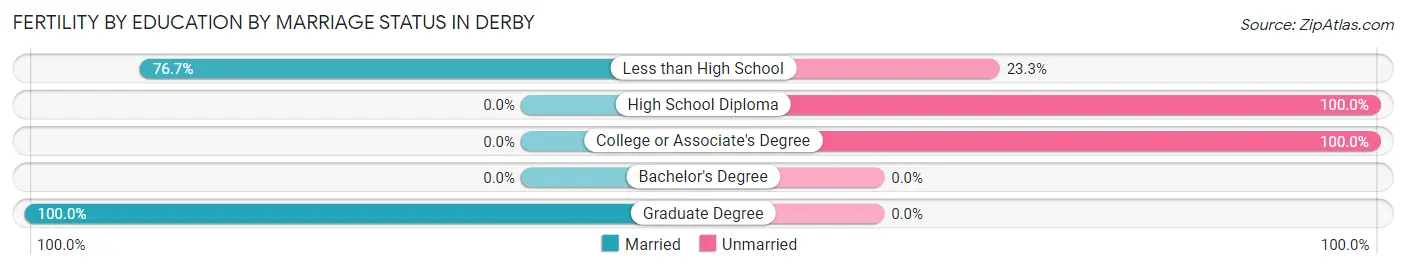
| Educational Attainment | Married | Unmarried |
| Less than High School | 33 (76.7%) | 10 (23.3%) |
| High School Diploma | 0 (0.0%) | 35 (100.0%) |
| College or Associate's Degree | 0 (0.0%) | 66 (100.0%) |
| Bachelor's Degree | 0 (0.0%) | 0 (0.0%) |
| Graduate Degree | 16 (100.0%) | 0 (0.0%) |
| Total | 49 (30.6%) | 111 (69.4%) |
Employment Characteristics in Derby
Employment by Class of Employer in Derby
Among the 4,088 employed individuals in Derby, private company employees (3,140 | 76.8%), not-for-profit organizations (262 | 6.4%), and local government employees (251 | 6.1%) make up the most common classes of employment.
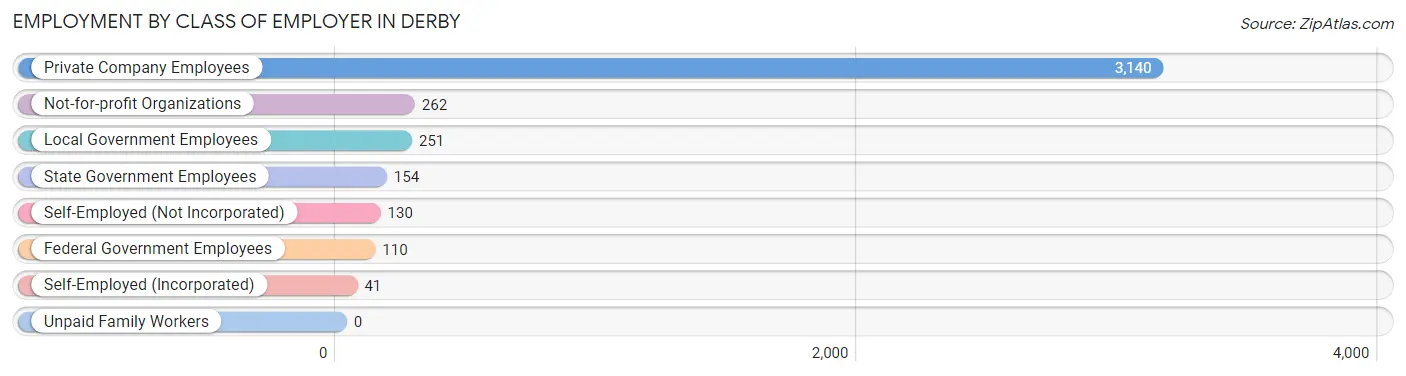
| Employer Class | # Employees | % Employees |
| Private Company Employees | 3,140 | 76.8% |
| Self-Employed (Incorporated) | 41 | 1.0% |
| Self-Employed (Not Incorporated) | 130 | 3.2% |
| Not-for-profit Organizations | 262 | 6.4% |
| Local Government Employees | 251 | 6.1% |
| State Government Employees | 154 | 3.8% |
| Federal Government Employees | 110 | 2.7% |
| Unpaid Family Workers | 0 | 0.0% |
| Total | 4,088 | 100.0% |
Employment Status by Age in Derby
According to the labor force statistics for Derby, out of the total population over 16 years of age (6,762), 65.9% or 4,456 individuals are in the labor force, with 4.8% or 214 of them unemployed. The age group with the highest labor force participation rate is 20 to 24 years, with 89.1% or 736 individuals in the labor force. Within the labor force, the 16 to 19 years age range has the highest percentage of unemployed individuals, with 22.0% or 54 of them being unemployed.
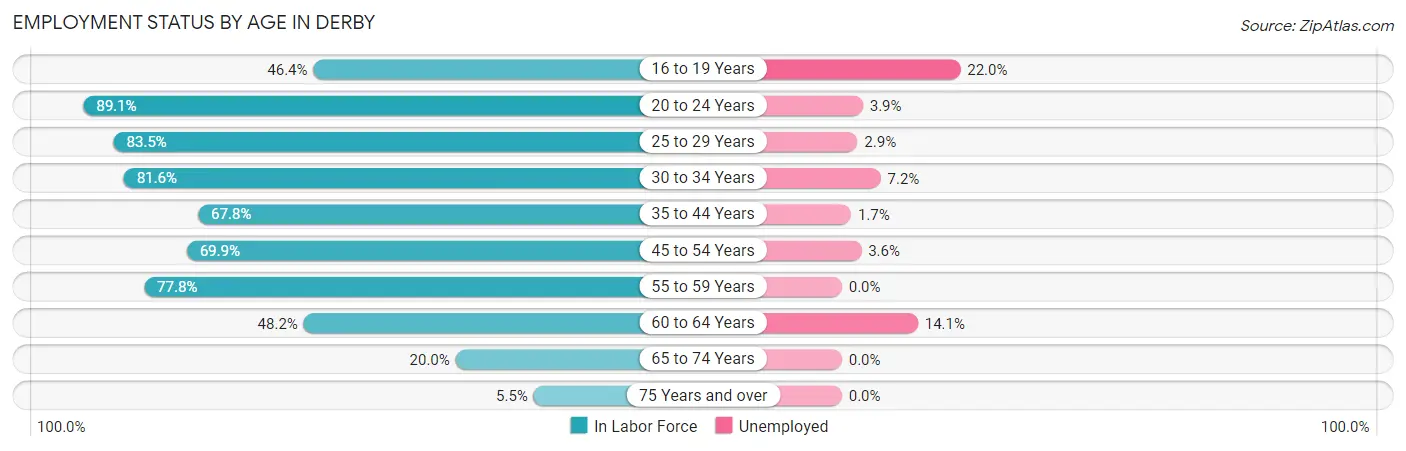
| Age Bracket | In Labor Force | Unemployed |
| 16 to 19 Years | 246 (46.4%) | 54 (22.0%) |
| 20 to 24 Years | 736 (89.1%) | 29 (3.9%) |
| 25 to 29 Years | 579 (83.5%) | 17 (2.9%) |
| 30 to 34 Years | 456 (81.6%) | 33 (7.2%) |
| 35 to 44 Years | 810 (67.8%) | 14 (1.7%) |
| 45 to 54 Years | 993 (69.9%) | 36 (3.6%) |
| 55 to 59 Years | 312 (77.8%) | 0 (0.0%) |
| 60 to 64 Years | 205 (48.2%) | 29 (14.1%) |
| 65 to 74 Years | 110 (20.0%) | 0 (0.0%) |
| 75 Years and over | 9 (5.5%) | 0 (0.0%) |
| Total | 4,456 (65.9%) | 214 (4.8%) |
Employment Status by Educational Attainment in Derby
According to labor force statistics for Derby, 71.5% of individuals (3,356) out of the total population between 25 and 64 years of age (4,694) are in the labor force, with 3.8% or 128 of them being unemployed. The group with the highest labor force participation rate are those with the educational attainment of bachelor's degree or higher, with 94.9% or 391 individuals in the labor force. Within the labor force, individuals with college / associate degree education have the highest percentage of unemployment, with 6.3% or 53 of them being unemployed.
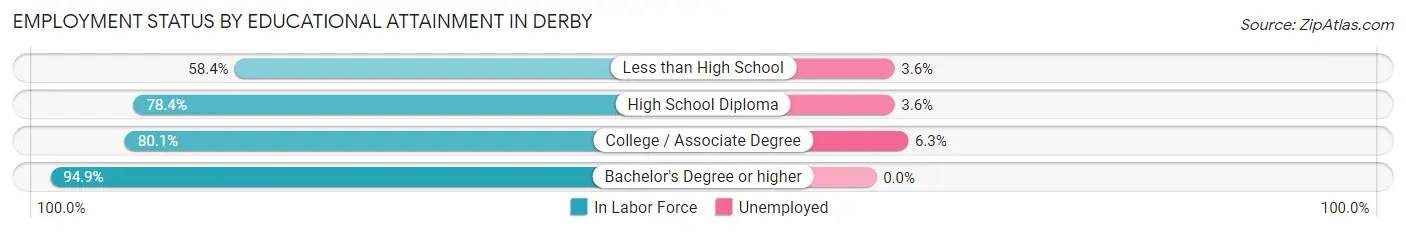
| Educational Attainment | In Labor Force | Unemployed |
| Less than High School | 1,200 (58.4%) | 74 (3.6%) |
| High School Diploma | 923 (78.4%) | 42 (3.6%) |
| College / Associate Degree | 841 (80.1%) | 66 (6.3%) |
| Bachelor's Degree or higher | 391 (94.9%) | 0 (0.0%) |
| Total | 3,356 (71.5%) | 178 (3.8%) |
Employment Occupations by Sex in Derby
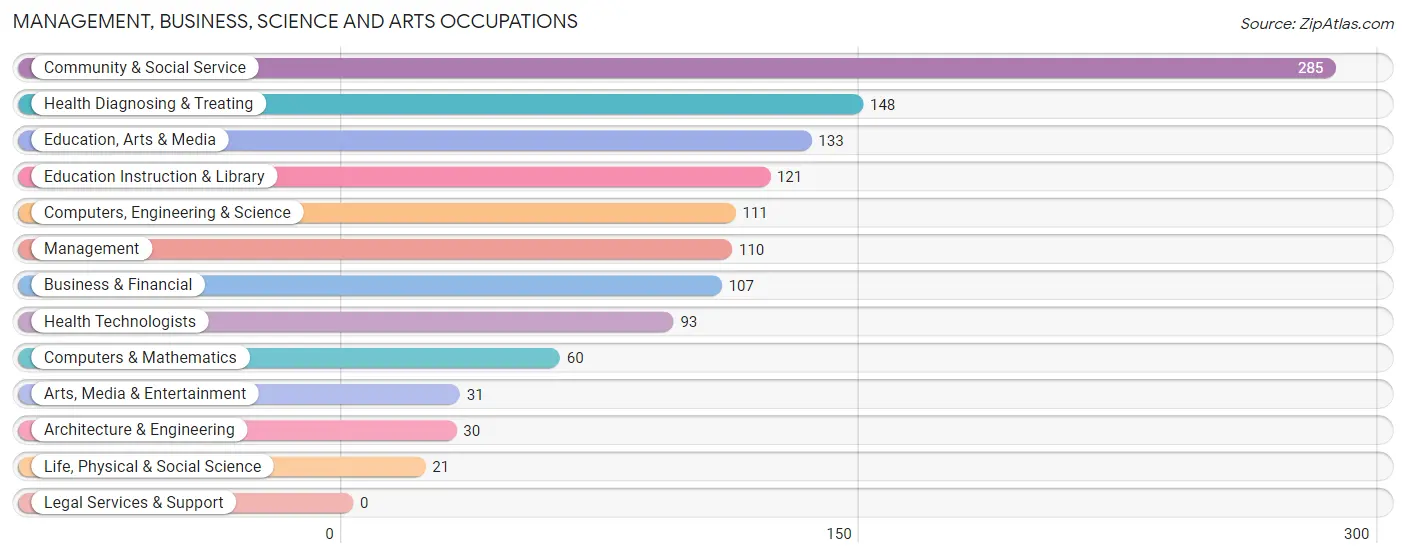
Management, Business, Science and Arts Occupations
The most common Management, Business, Science and Arts occupations in Derby are Community & Social Service (285 | 6.7%), Health Diagnosing & Treating (148 | 3.5%), Education, Arts & Media (133 | 3.1%), Education Instruction & Library (121 | 2.9%), and Computers, Engineering & Science (111 | 2.6%).
Management, Business, Science and Arts Occupations by Sex
Within the Management, Business, Science and Arts occupations in Derby, the most male-oriented occupations are Education, Arts & Media (88.7%), Management (83.6%), and Architecture & Engineering (66.7%), while the most female-oriented occupations are Business & Financial (100.0%), Health Technologists (100.0%), and Computers & Mathematics (86.7%).
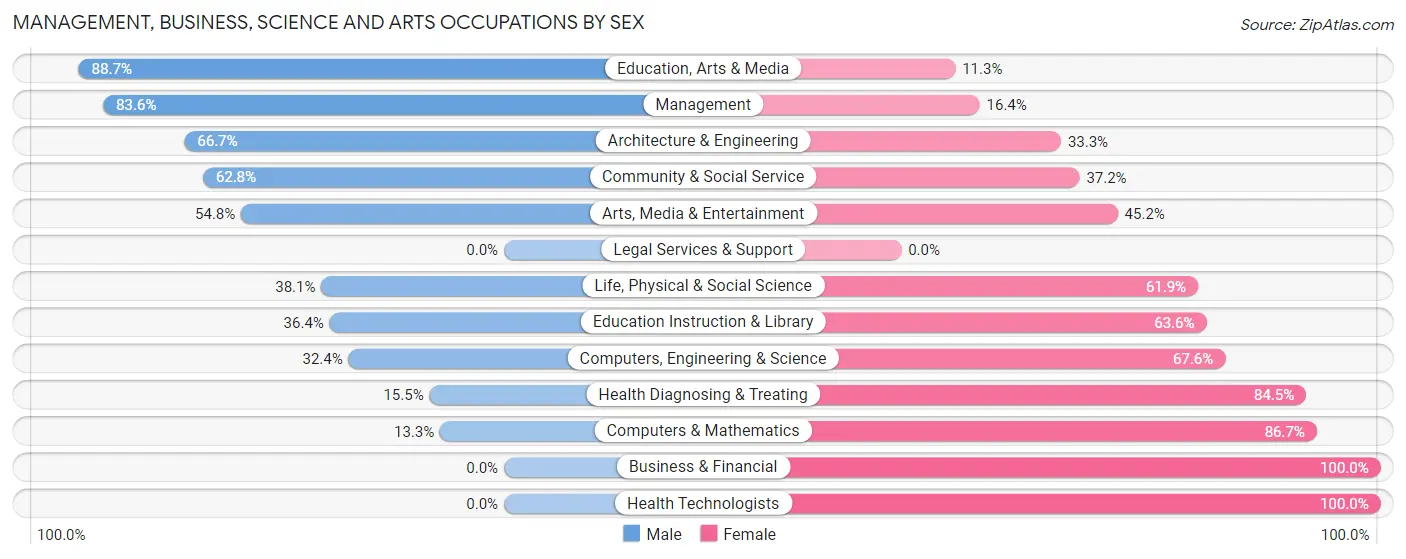
| Occupation | Male | Female |
| Management | 92 (83.6%) | 18 (16.4%) |
| Business & Financial | 0 (0.0%) | 107 (100.0%) |
| Computers, Engineering & Science | 36 (32.4%) | 75 (67.6%) |
| Computers & Mathematics | 8 (13.3%) | 52 (86.7%) |
| Architecture & Engineering | 20 (66.7%) | 10 (33.3%) |
| Life, Physical & Social Science | 8 (38.1%) | 13 (61.9%) |
| Community & Social Service | 179 (62.8%) | 106 (37.2%) |
| Education, Arts & Media | 118 (88.7%) | 15 (11.3%) |
| Legal Services & Support | 0 (0.0%) | 0 (0.0%) |
| Education Instruction & Library | 44 (36.4%) | 77 (63.6%) |
| Arts, Media & Entertainment | 17 (54.8%) | 14 (45.2%) |
| Health Diagnosing & Treating | 23 (15.5%) | 125 (84.5%) |
| Health Technologists | 0 (0.0%) | 93 (100.0%) |
| Total (Category) | 330 (43.4%) | 431 (56.6%) |
| Total (Overall) | 2,624 (61.8%) | 1,620 (38.2%) |
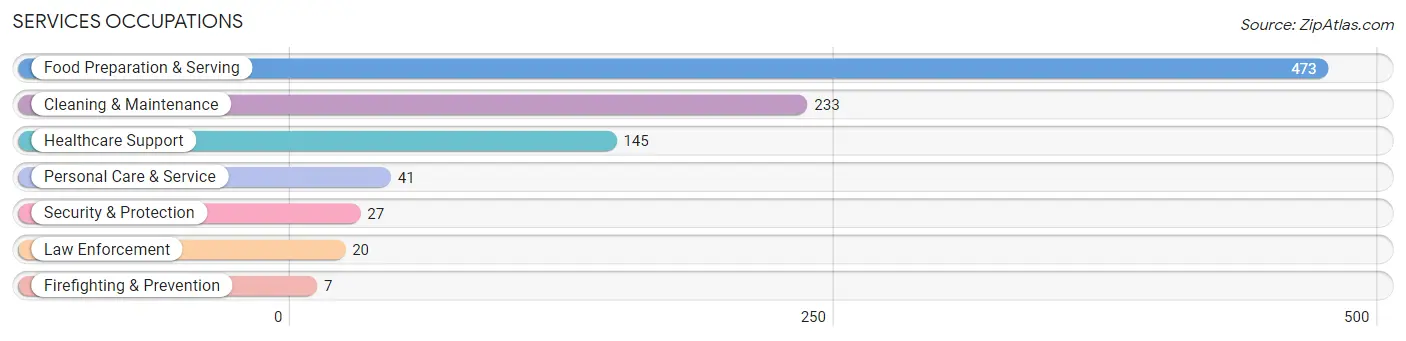
Services Occupations
The most common Services occupations in Derby are Food Preparation & Serving (473 | 11.2%), Cleaning & Maintenance (233 | 5.5%), Healthcare Support (145 | 3.4%), Personal Care & Service (41 | 1.0%), and Security & Protection (27 | 0.6%).
Services Occupations by Sex
Within the Services occupations in Derby, the most male-oriented occupations are Cleaning & Maintenance (76.8%), Food Preparation & Serving (58.4%), and Law Enforcement (25.0%), while the most female-oriented occupations are Healthcare Support (100.0%), Firefighting & Prevention (100.0%), and Personal Care & Service (100.0%).
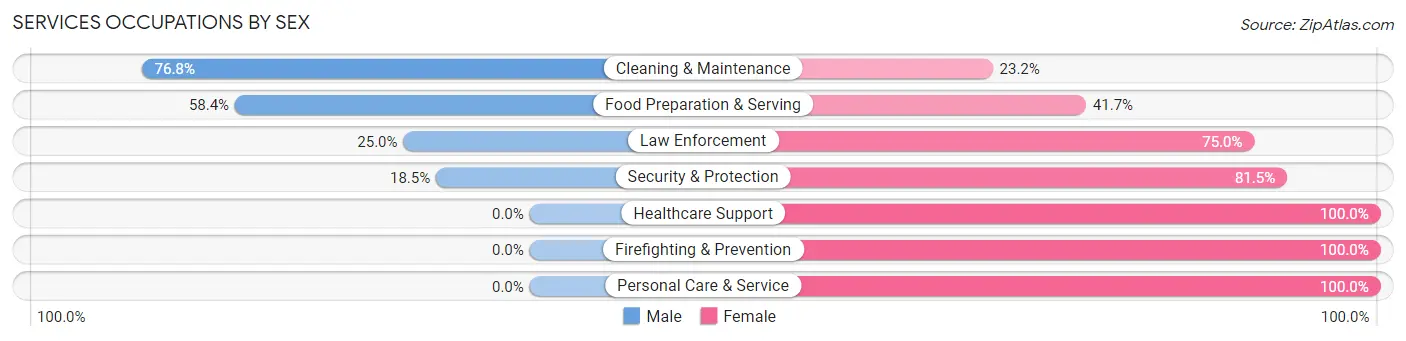
| Occupation | Male | Female |
| Healthcare Support | 0 (0.0%) | 145 (100.0%) |
| Security & Protection | 5 (18.5%) | 22 (81.5%) |
| Firefighting & Prevention | 0 (0.0%) | 7 (100.0%) |
| Law Enforcement | 5 (25.0%) | 15 (75.0%) |
| Food Preparation & Serving | 276 (58.4%) | 197 (41.6%) |
| Cleaning & Maintenance | 179 (76.8%) | 54 (23.2%) |
| Personal Care & Service | 0 (0.0%) | 41 (100.0%) |
| Total (Category) | 460 (50.0%) | 459 (49.9%) |
| Total (Overall) | 2,624 (61.8%) | 1,620 (38.2%) |
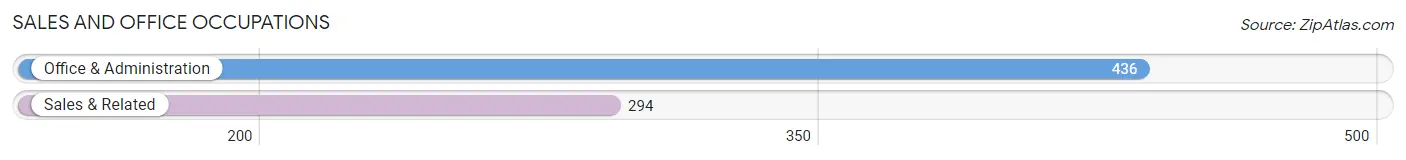
Sales and Office Occupations
The most common Sales and Office occupations in Derby are Office & Administration (436 | 10.3%), and Sales & Related (294 | 6.9%).
Sales and Office Occupations by Sex
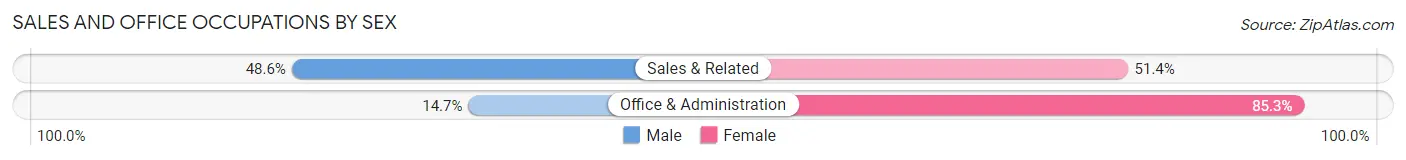
| Occupation | Male | Female |
| Sales & Related | 143 (48.6%) | 151 (51.4%) |
| Office & Administration | 64 (14.7%) | 372 (85.3%) |
| Total (Category) | 207 (28.4%) | 523 (71.6%) |
| Total (Overall) | 2,624 (61.8%) | 1,620 (38.2%) |
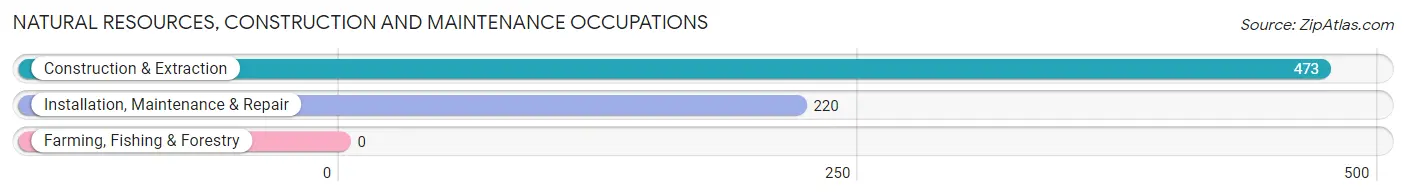
Natural Resources, Construction and Maintenance Occupations
The most common Natural Resources, Construction and Maintenance occupations in Derby are Construction & Extraction (473 | 11.2%), and Installation, Maintenance & Repair (220 | 5.2%).
Natural Resources, Construction and Maintenance Occupations by Sex
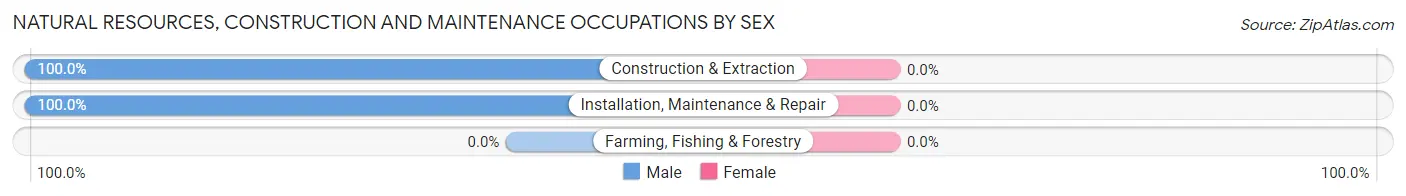
| Occupation | Male | Female |
| Farming, Fishing & Forestry | 0 (0.0%) | 0 (0.0%) |
| Construction & Extraction | 473 (100.0%) | 0 (0.0%) |
| Installation, Maintenance & Repair | 220 (100.0%) | 0 (0.0%) |
| Total (Category) | 693 (100.0%) | 0 (0.0%) |
| Total (Overall) | 2,624 (61.8%) | 1,620 (38.2%) |
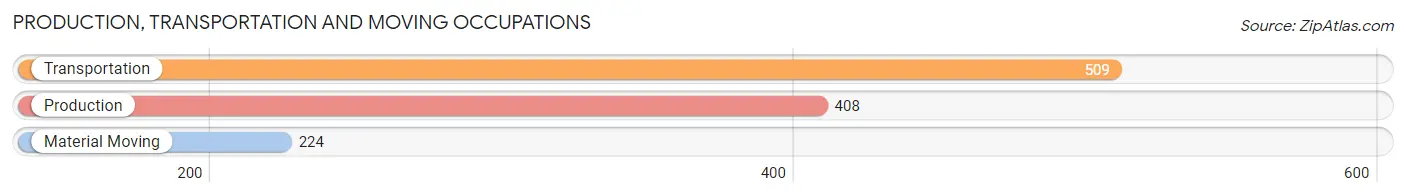
Production, Transportation and Moving Occupations
The most common Production, Transportation and Moving occupations in Derby are Transportation (509 | 12.0%), Production (408 | 9.6%), and Material Moving (224 | 5.3%).
Production, Transportation and Moving Occupations by Sex
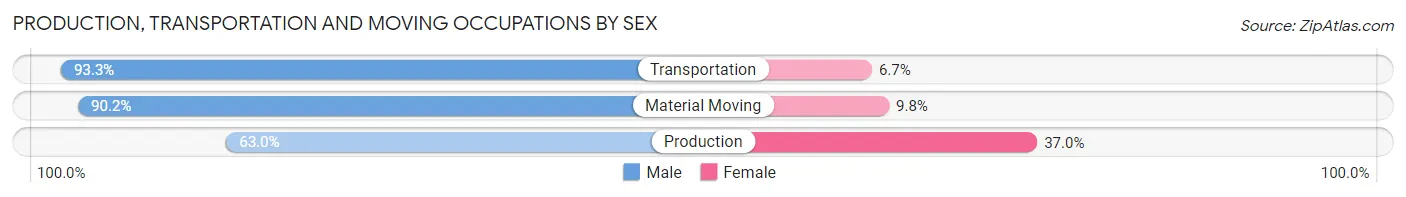
| Occupation | Male | Female |
| Production | 257 (63.0%) | 151 (37.0%) |
| Transportation | 475 (93.3%) | 34 (6.7%) |
| Material Moving | 202 (90.2%) | 22 (9.8%) |
| Total (Category) | 934 (81.9%) | 207 (18.1%) |
| Total (Overall) | 2,624 (61.8%) | 1,620 (38.2%) |
Employment Industries by Sex in Derby
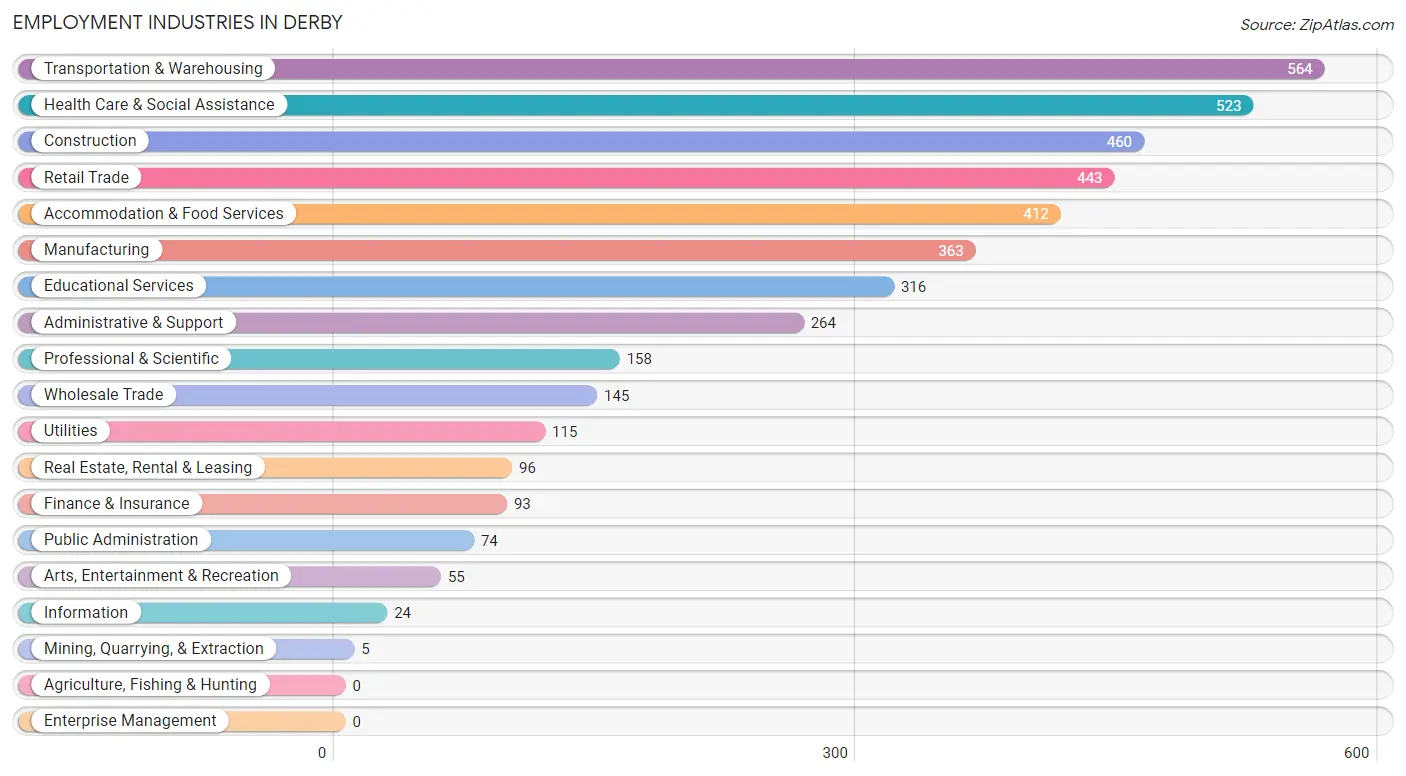
Employment Industries in Derby
The major employment industries in Derby include Transportation & Warehousing (564 | 13.3%), Health Care & Social Assistance (523 | 12.3%), Construction (460 | 10.8%), Retail Trade (443 | 10.4%), and Accommodation & Food Services (412 | 9.7%).
Employment Industries by Sex in Derby
The Derby industries that see more men than women are Construction (98.5%), Real Estate, Rental & Leasing (95.8%), and Utilities (93.9%), whereas the industries that tend to have a higher number of women are Mining, Quarrying, & Extraction (100.0%), Information (100.0%), and Health Care & Social Assistance (95.6%).
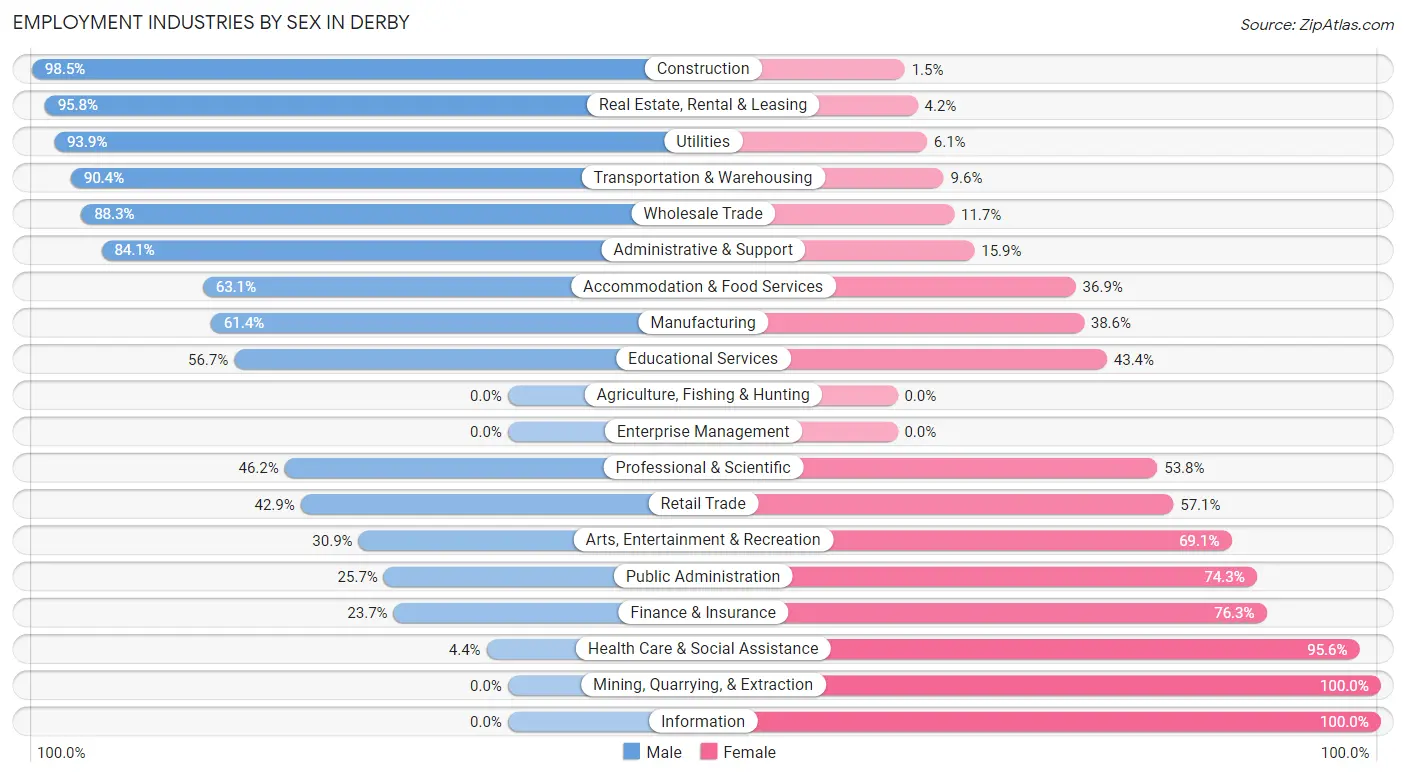
| Industry | Male | Female |
| Agriculture, Fishing & Hunting | 0 (0.0%) | 0 (0.0%) |
| Mining, Quarrying, & Extraction | 0 (0.0%) | 5 (100.0%) |
| Construction | 453 (98.5%) | 7 (1.5%) |
| Manufacturing | 223 (61.4%) | 140 (38.6%) |
| Wholesale Trade | 128 (88.3%) | 17 (11.7%) |
| Retail Trade | 190 (42.9%) | 253 (57.1%) |
| Transportation & Warehousing | 510 (90.4%) | 54 (9.6%) |
| Utilities | 108 (93.9%) | 7 (6.1%) |
| Information | 0 (0.0%) | 24 (100.0%) |
| Finance & Insurance | 22 (23.7%) | 71 (76.3%) |
| Real Estate, Rental & Leasing | 92 (95.8%) | 4 (4.2%) |
| Professional & Scientific | 73 (46.2%) | 85 (53.8%) |
| Enterprise Management | 0 (0.0%) | 0 (0.0%) |
| Administrative & Support | 222 (84.1%) | 42 (15.9%) |
| Educational Services | 179 (56.7%) | 137 (43.3%) |
| Health Care & Social Assistance | 23 (4.4%) | 500 (95.6%) |
| Arts, Entertainment & Recreation | 17 (30.9%) | 38 (69.1%) |
| Accommodation & Food Services | 260 (63.1%) | 152 (36.9%) |
| Public Administration | 19 (25.7%) | 55 (74.3%) |
| Total | 2,624 (61.8%) | 1,620 (38.2%) |
Education in Derby
School Enrollment in Derby
The most common levels of schooling among the 2,436 students in Derby are elementary school (706 | 29.0%), high school (671 | 27.6%), and middle school (471 | 19.3%).
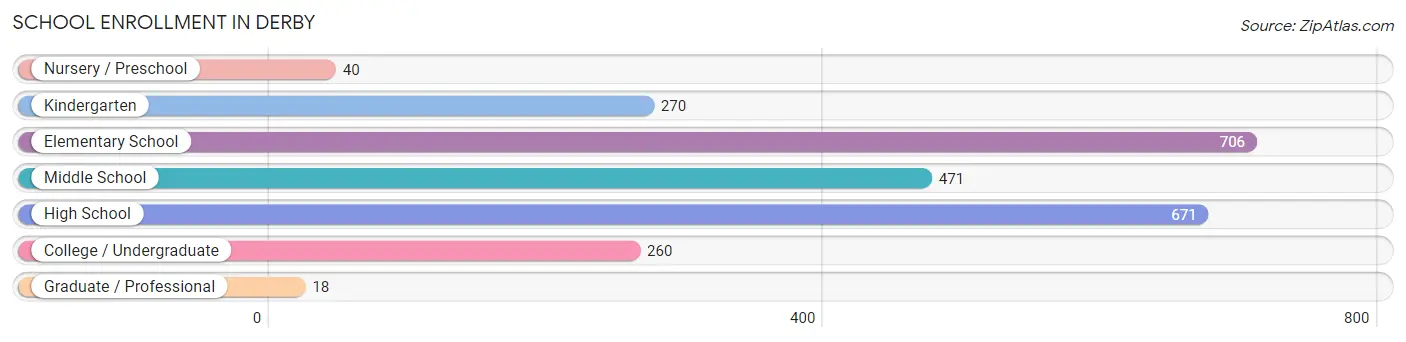
| School Level | # Students | % Students |
| Nursery / Preschool | 40 | 1.6% |
| Kindergarten | 270 | 11.1% |
| Elementary School | 706 | 29.0% |
| Middle School | 471 | 19.3% |
| High School | 671 | 27.6% |
| College / Undergraduate | 260 | 10.7% |
| Graduate / Professional | 18 | 0.7% |
| Total | 2,436 | 100.0% |
School Enrollment by Age by Funding Source in Derby
Out of a total of 2,436 students who are enrolled in schools in Derby, 85 (3.5%) attend a private institution, while the remaining 2,351 (96.5%) are enrolled in public schools. The age group of 25 to 34 year olds has the highest likelihood of being enrolled in private schools, with 10 (17.2% in the age bracket) enrolled. Conversely, the age group of 3 to 4 year olds has the lowest likelihood of being enrolled in a private school, with 137 (100.0% in the age bracket) attending a public institution.
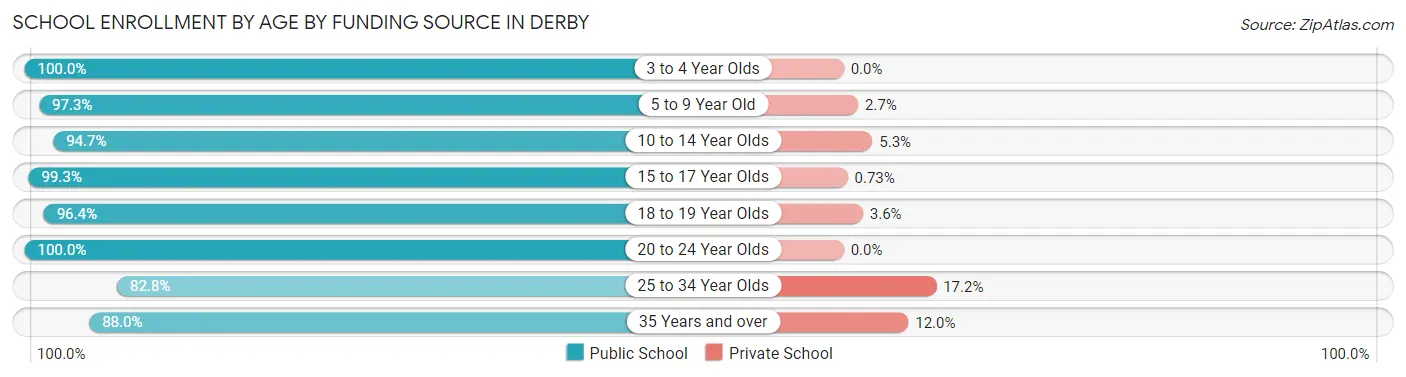
| Age Bracket | Public School | Private School |
| 3 to 4 Year Olds | 137 (100.0%) | 0 (0.0%) |
| 5 to 9 Year Old | 759 (97.3%) | 21 (2.7%) |
| 10 to 14 Year Olds | 638 (94.7%) | 36 (5.3%) |
| 15 to 17 Year Olds | 544 (99.3%) | 4 (0.7%) |
| 18 to 19 Year Olds | 27 (96.4%) | 1 (3.6%) |
| 20 to 24 Year Olds | 103 (100.0%) | 0 (0.0%) |
| 25 to 34 Year Olds | 48 (82.8%) | 10 (17.2%) |
| 35 Years and over | 95 (88.0%) | 13 (12.0%) |
| Total | 2,351 (96.5%) | 85 (3.5%) |
Educational Attainment by Field of Study in Derby
Social sciences (134 | 28.1%), arts & humanities (105 | 22.1%), science & technology (60 | 12.6%), engineering (28 | 5.9%), and liberal arts & history (28 | 5.9%) are the most common fields of study among 476 individuals in Derby who have obtained a bachelor's degree or higher.
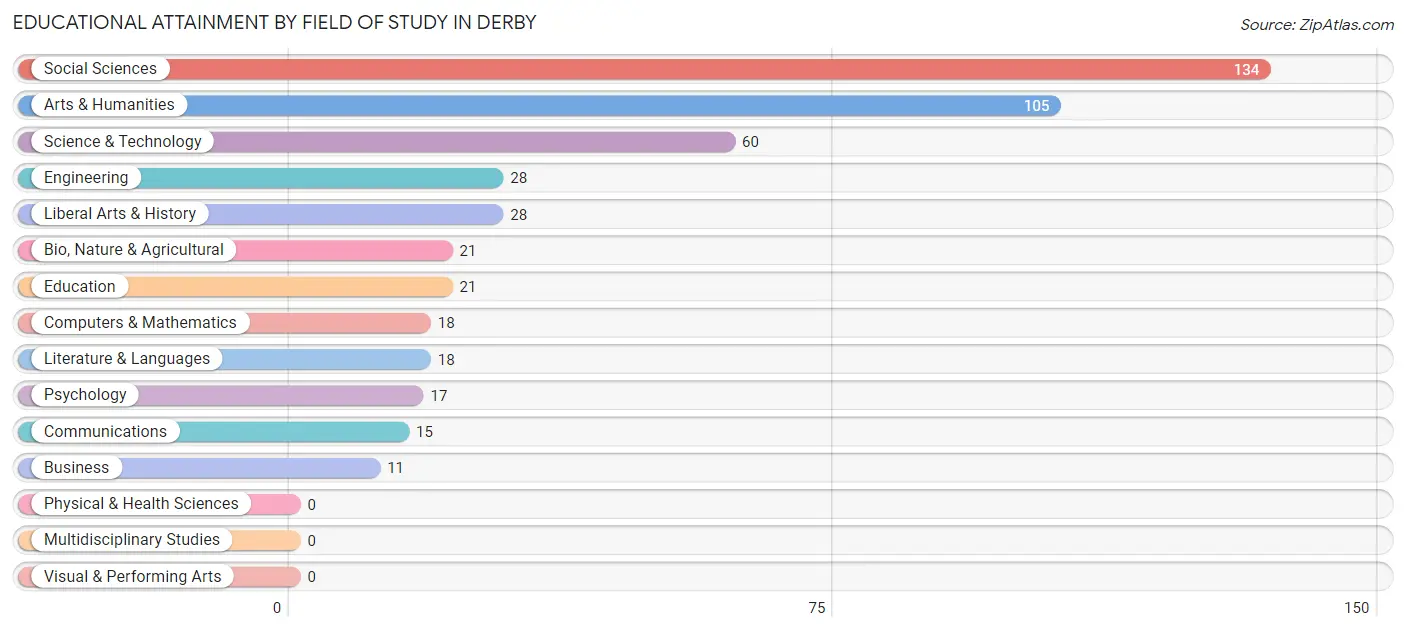
| Field of Study | # Graduates | % Graduates |
| Computers & Mathematics | 18 | 3.8% |
| Bio, Nature & Agricultural | 21 | 4.4% |
| Physical & Health Sciences | 0 | 0.0% |
| Psychology | 17 | 3.6% |
| Social Sciences | 134 | 28.1% |
| Engineering | 28 | 5.9% |
| Multidisciplinary Studies | 0 | 0.0% |
| Science & Technology | 60 | 12.6% |
| Business | 11 | 2.3% |
| Education | 21 | 4.4% |
| Literature & Languages | 18 | 3.8% |
| Liberal Arts & History | 28 | 5.9% |
| Visual & Performing Arts | 0 | 0.0% |
| Communications | 15 | 3.2% |
| Arts & Humanities | 105 | 22.1% |
| Total | 476 | 100.0% |
Transportation & Commute in Derby
Vehicle Availability by Sex in Derby
The most prevalent vehicle ownership categories in Derby are males with 3 vehicles (714, accounting for 27.7%) and females with 3 vehicles (326, making up 47.3%).
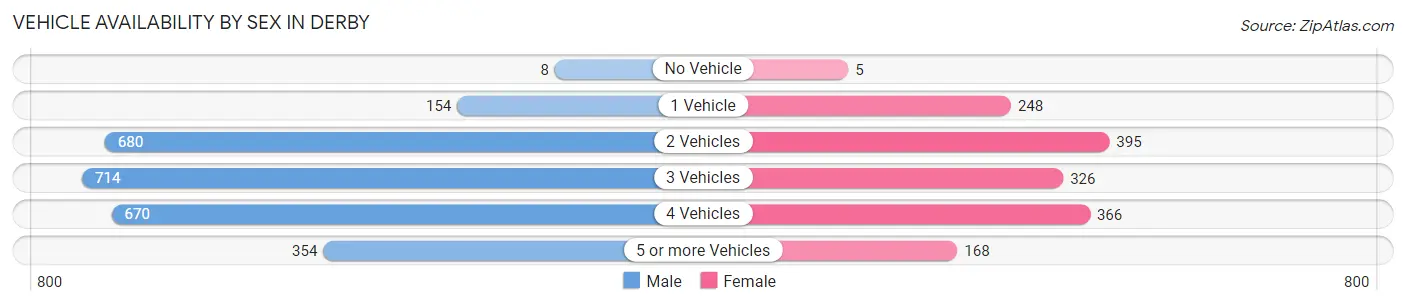
| Vehicles Available | Male | Female |
| No Vehicle | 8 (0.3%) | 5 (0.3%) |
| 1 Vehicle | 154 (6.0%) | 248 (16.5%) |
| 2 Vehicles | 680 (26.4%) | 395 (26.2%) |
| 3 Vehicles | 714 (27.7%) | 326 (21.6%) |
| 4 Vehicles | 670 (26.0%) | 366 (24.3%) |
| 5 or more Vehicles | 354 (13.7%) | 168 (11.1%) |
| Total | 2,580 (100.0%) | 1,508 (100.0%) |
Commute Time in Derby
The most frequently occuring commute durations in Derby are 30 to 34 minutes (1,074 commuters, 27.1%), 15 to 19 minutes (508 commuters, 12.8%), and 5 to 9 minutes (492 commuters, 12.4%).
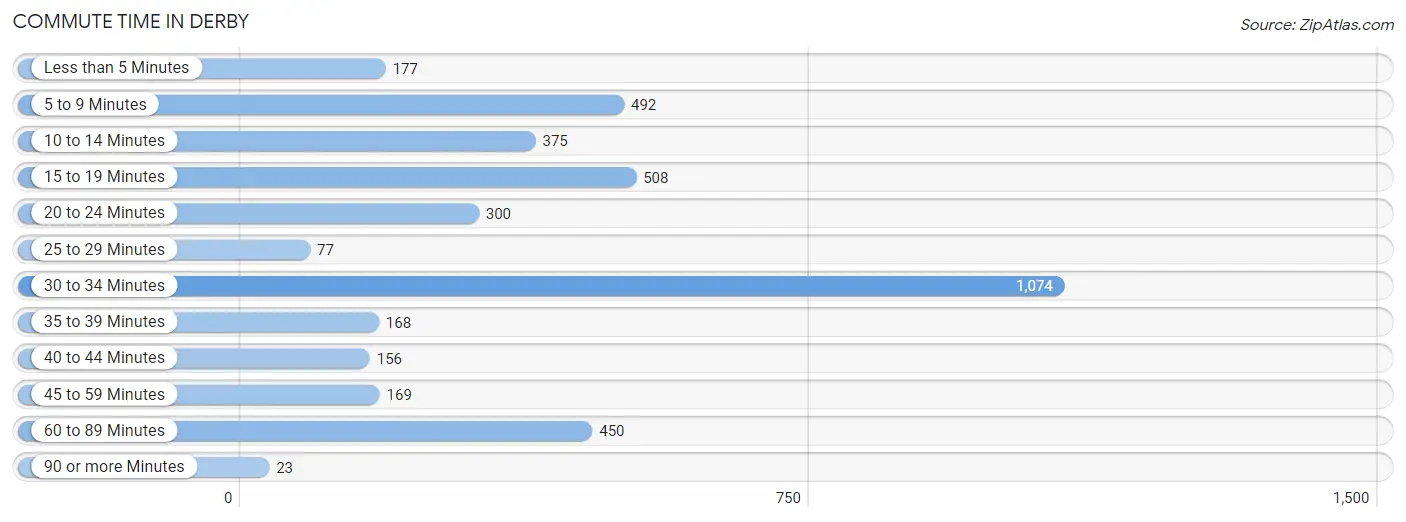
| Commute Time | # Commuters | % Commuters |
| Less than 5 Minutes | 177 | 4.5% |
| 5 to 9 Minutes | 492 | 12.4% |
| 10 to 14 Minutes | 375 | 9.5% |
| 15 to 19 Minutes | 508 | 12.8% |
| 20 to 24 Minutes | 300 | 7.6% |
| 25 to 29 Minutes | 77 | 1.9% |
| 30 to 34 Minutes | 1,074 | 27.1% |
| 35 to 39 Minutes | 168 | 4.2% |
| 40 to 44 Minutes | 156 | 3.9% |
| 45 to 59 Minutes | 169 | 4.3% |
| 60 to 89 Minutes | 450 | 11.3% |
| 90 or more Minutes | 23 | 0.6% |
Commute Time by Sex in Derby
The most common commute times in Derby are 30 to 34 minutes (722 commuters, 28.4%) for males and 30 to 34 minutes (352 commuters, 24.7%) for females.
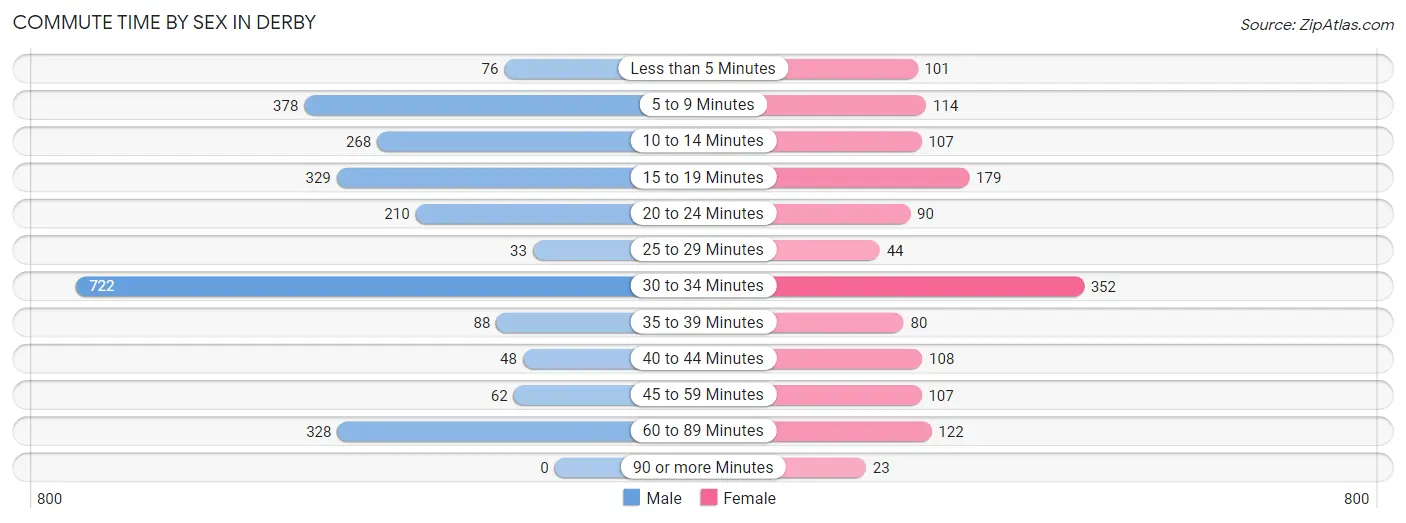
| Commute Time | Male | Female |
| Less than 5 Minutes | 76 (3.0%) | 101 (7.1%) |
| 5 to 9 Minutes | 378 (14.9%) | 114 (8.0%) |
| 10 to 14 Minutes | 268 (10.5%) | 107 (7.5%) |
| 15 to 19 Minutes | 329 (12.9%) | 179 (12.5%) |
| 20 to 24 Minutes | 210 (8.3%) | 90 (6.3%) |
| 25 to 29 Minutes | 33 (1.3%) | 44 (3.1%) |
| 30 to 34 Minutes | 722 (28.4%) | 352 (24.7%) |
| 35 to 39 Minutes | 88 (3.5%) | 80 (5.6%) |
| 40 to 44 Minutes | 48 (1.9%) | 108 (7.6%) |
| 45 to 59 Minutes | 62 (2.4%) | 107 (7.5%) |
| 60 to 89 Minutes | 328 (12.9%) | 122 (8.6%) |
| 90 or more Minutes | 0 (0.0%) | 23 (1.6%) |
Time of Departure to Work by Sex in Derby
The most frequent times of departure to work in Derby are 6:00 AM to 6:29 AM (466, 18.3%) for males and 6:30 AM to 6:59 AM (282, 19.8%) for females.
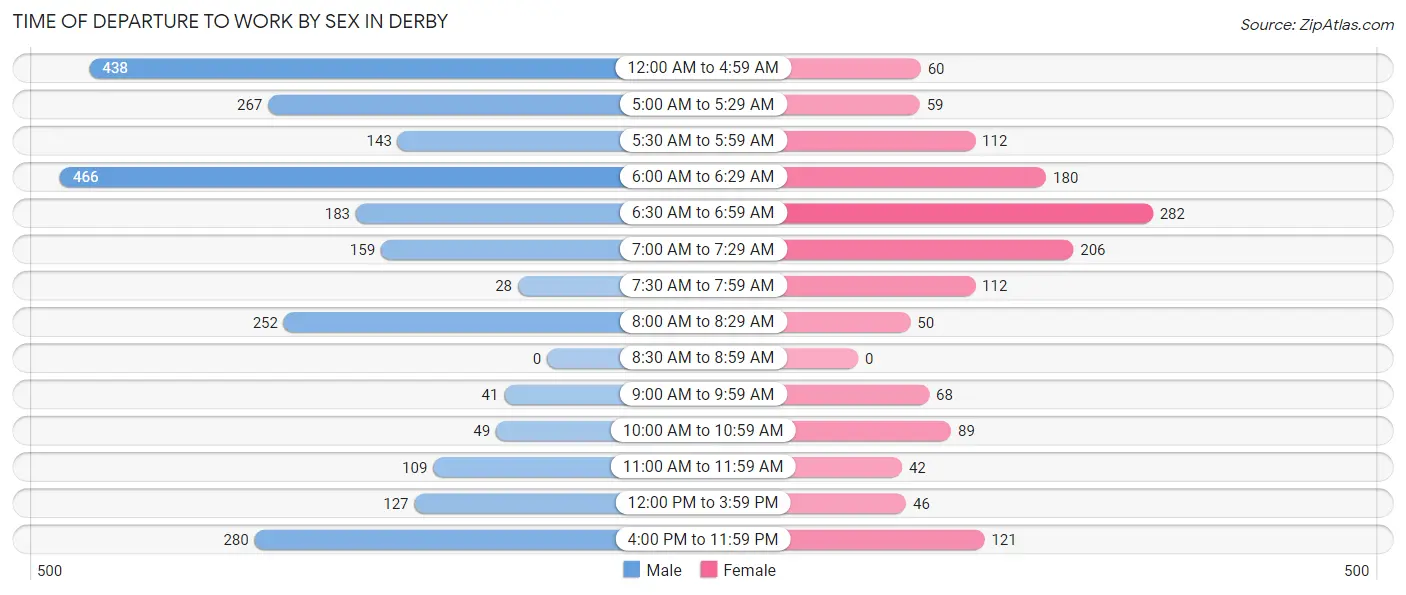
| Time of Departure | Male | Female |
| 12:00 AM to 4:59 AM | 438 (17.2%) | 60 (4.2%) |
| 5:00 AM to 5:29 AM | 267 (10.5%) | 59 (4.1%) |
| 5:30 AM to 5:59 AM | 143 (5.6%) | 112 (7.9%) |
| 6:00 AM to 6:29 AM | 466 (18.3%) | 180 (12.6%) |
| 6:30 AM to 6:59 AM | 183 (7.2%) | 282 (19.8%) |
| 7:00 AM to 7:29 AM | 159 (6.2%) | 206 (14.4%) |
| 7:30 AM to 7:59 AM | 28 (1.1%) | 112 (7.9%) |
| 8:00 AM to 8:29 AM | 252 (9.9%) | 50 (3.5%) |
| 8:30 AM to 8:59 AM | 0 (0.0%) | 0 (0.0%) |
| 9:00 AM to 9:59 AM | 41 (1.6%) | 68 (4.8%) |
| 10:00 AM to 10:59 AM | 49 (1.9%) | 89 (6.2%) |
| 11:00 AM to 11:59 AM | 109 (4.3%) | 42 (2.9%) |
| 12:00 PM to 3:59 PM | 127 (5.0%) | 46 (3.2%) |
| 4:00 PM to 11:59 PM | 280 (11.0%) | 121 (8.5%) |
| Total | 2,542 (100.0%) | 1,427 (100.0%) |
Housing Occupancy in Derby
Occupancy by Ownership in Derby
Of the total 2,527 dwellings in Derby, owner-occupied units account for 1,635 (64.7%), while renter-occupied units make up 892 (35.3%).
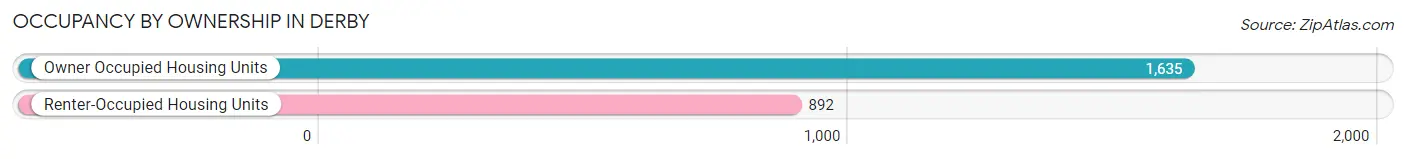
| Occupancy | # Housing Units | % Housing Units |
| Owner Occupied Housing Units | 1,635 | 64.7% |
| Renter-Occupied Housing Units | 892 | 35.3% |
| Total Occupied Housing Units | 2,527 | 100.0% |
Occupancy by Household Size in Derby
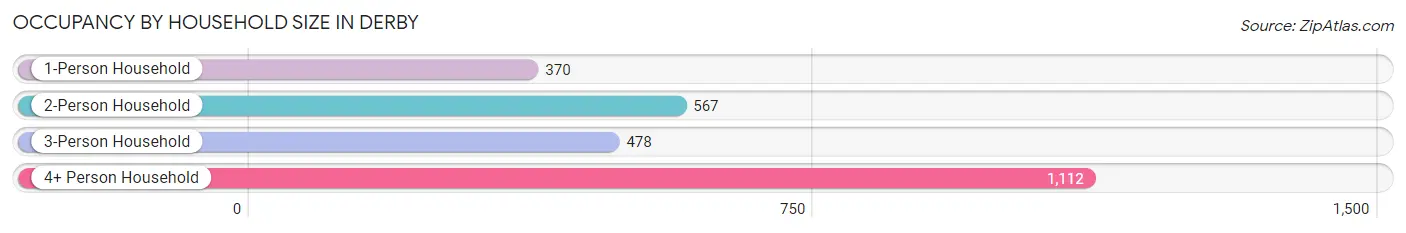
| Household Size | # Housing Units | % Housing Units |
| 1-Person Household | 370 | 14.6% |
| 2-Person Household | 567 | 22.4% |
| 3-Person Household | 478 | 18.9% |
| 4+ Person Household | 1,112 | 44.0% |
| Total Housing Units | 2,527 | 100.0% |
Occupancy by Ownership by Household Size in Derby
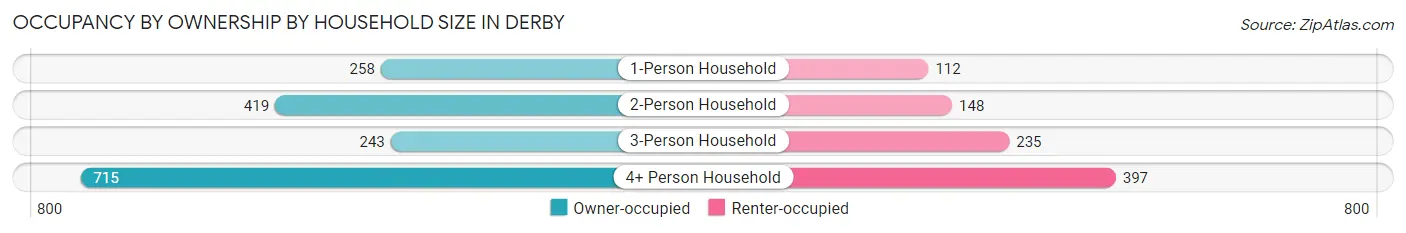
| Household Size | Owner-occupied | Renter-occupied |
| 1-Person Household | 258 (69.7%) | 112 (30.3%) |
| 2-Person Household | 419 (73.9%) | 148 (26.1%) |
| 3-Person Household | 243 (50.8%) | 235 (49.2%) |
| 4+ Person Household | 715 (64.3%) | 397 (35.7%) |
| Total Housing Units | 1,635 (64.7%) | 892 (35.3%) |
Occupancy by Educational Attainment in Derby
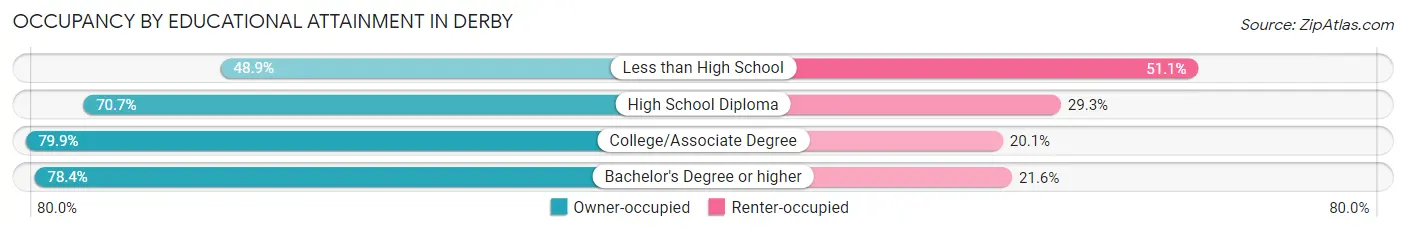
| Household Size | Owner-occupied | Renter-occupied |
| Less than High School | 488 (48.9%) | 510 (51.1%) |
| High School Diploma | 555 (70.7%) | 230 (29.3%) |
| College/Associate Degree | 461 (79.9%) | 116 (20.1%) |
| Bachelor's Degree or higher | 131 (78.4%) | 36 (21.6%) |
Occupancy by Age of Householder in Derby
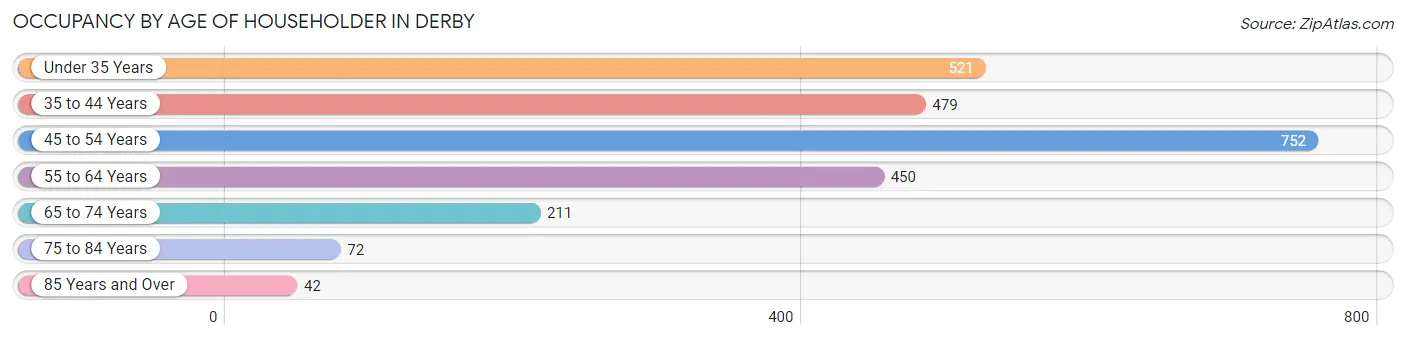
| Age Bracket | # Households | % Households |
| Under 35 Years | 521 | 20.6% |
| 35 to 44 Years | 479 | 19.0% |
| 45 to 54 Years | 752 | 29.8% |
| 55 to 64 Years | 450 | 17.8% |
| 65 to 74 Years | 211 | 8.4% |
| 75 to 84 Years | 72 | 2.9% |
| 85 Years and Over | 42 | 1.7% |
| Total | 2,527 | 100.0% |
Housing Finances in Derby
Median Income by Occupancy in Derby
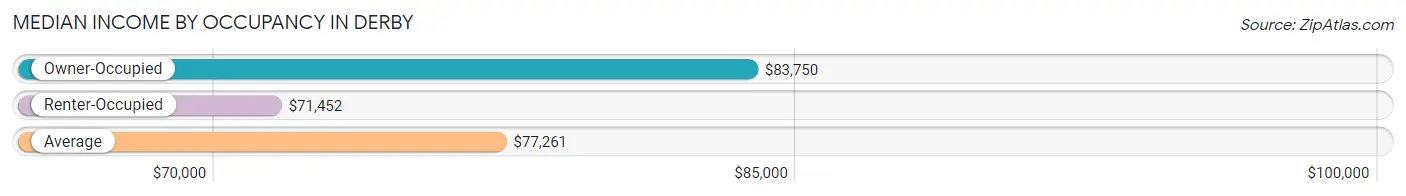
| Occupancy Type | # Households | Median Income |
| Owner-Occupied | 1,635 (64.7%) | $83,750 |
| Renter-Occupied | 892 (35.3%) | $71,452 |
| Average | 2,527 (100.0%) | $77,261 |
Occupancy by Householder Income Bracket in Derby
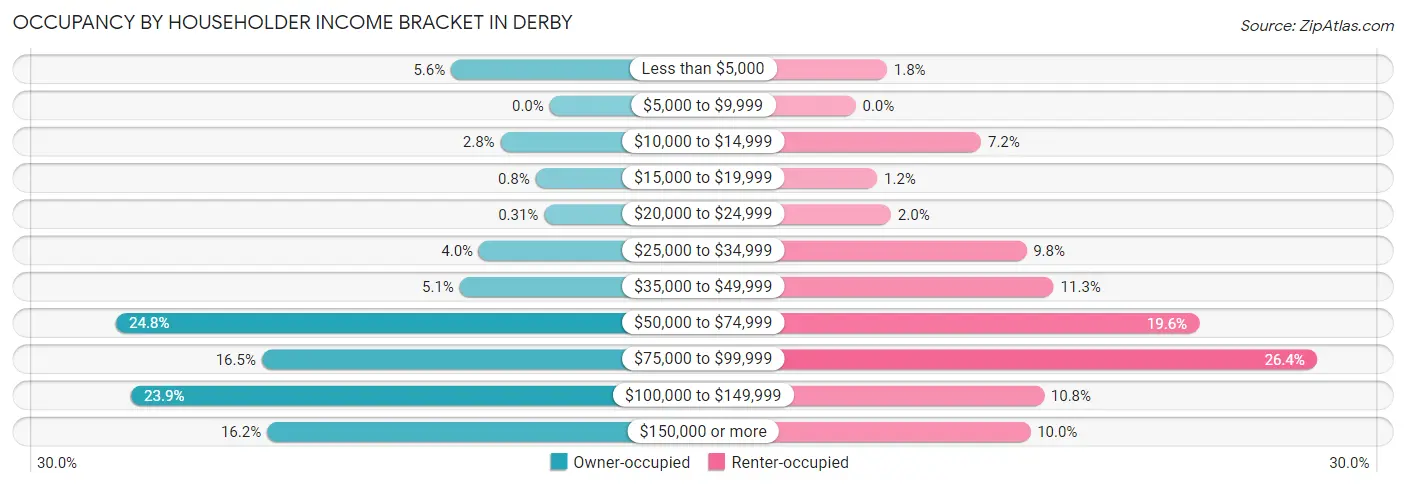
| Income Bracket | Owner-occupied | Renter-occupied |
| Less than $5,000 | 92 (5.6%) | 16 (1.8%) |
| $5,000 to $9,999 | 0 (0.0%) | 0 (0.0%) |
| $10,000 to $14,999 | 46 (2.8%) | 64 (7.2%) |
| $15,000 to $19,999 | 13 (0.8%) | 11 (1.2%) |
| $20,000 to $24,999 | 5 (0.3%) | 18 (2.0%) |
| $25,000 to $34,999 | 66 (4.0%) | 87 (9.8%) |
| $35,000 to $49,999 | 84 (5.1%) | 101 (11.3%) |
| $50,000 to $74,999 | 405 (24.8%) | 175 (19.6%) |
| $75,000 to $99,999 | 269 (16.5%) | 235 (26.4%) |
| $100,000 to $149,999 | 391 (23.9%) | 96 (10.8%) |
| $150,000 or more | 264 (16.2%) | 89 (10.0%) |
| Total | 1,635 (100.0%) | 892 (100.0%) |
Monthly Housing Cost Tiers in Derby
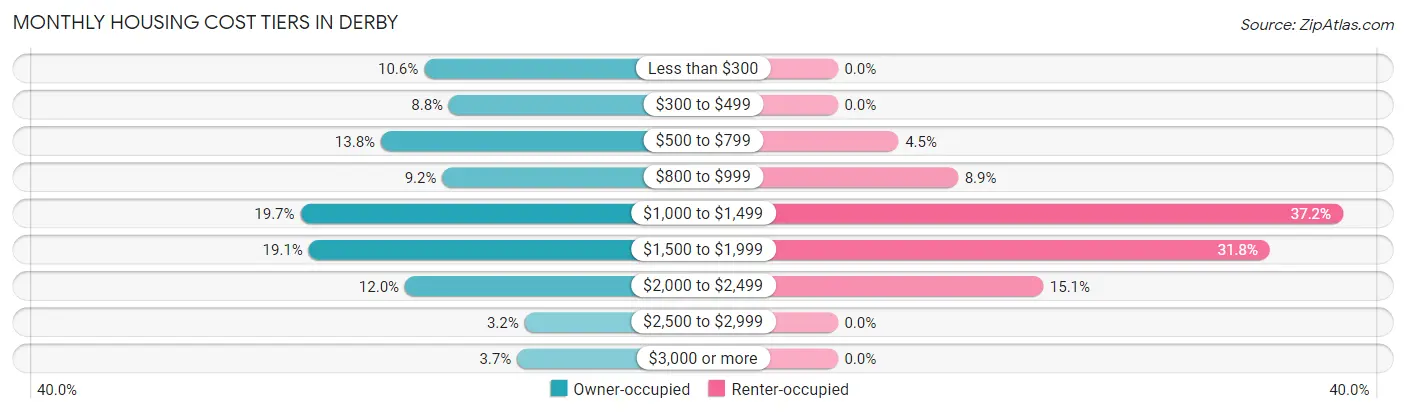
| Monthly Cost | Owner-occupied | Renter-occupied |
| Less than $300 | 173 (10.6%) | 0 (0.0%) |
| $300 to $499 | 143 (8.7%) | 0 (0.0%) |
| $500 to $799 | 225 (13.8%) | 40 (4.5%) |
| $800 to $999 | 151 (9.2%) | 79 (8.9%) |
| $1,000 to $1,499 | 322 (19.7%) | 332 (37.2%) |
| $1,500 to $1,999 | 312 (19.1%) | 284 (31.8%) |
| $2,000 to $2,499 | 196 (12.0%) | 135 (15.1%) |
| $2,500 to $2,999 | 52 (3.2%) | 0 (0.0%) |
| $3,000 or more | 61 (3.7%) | 0 (0.0%) |
| Total | 1,635 (100.0%) | 892 (100.0%) |
Physical Housing Characteristics in Derby
Housing Structures in Derby
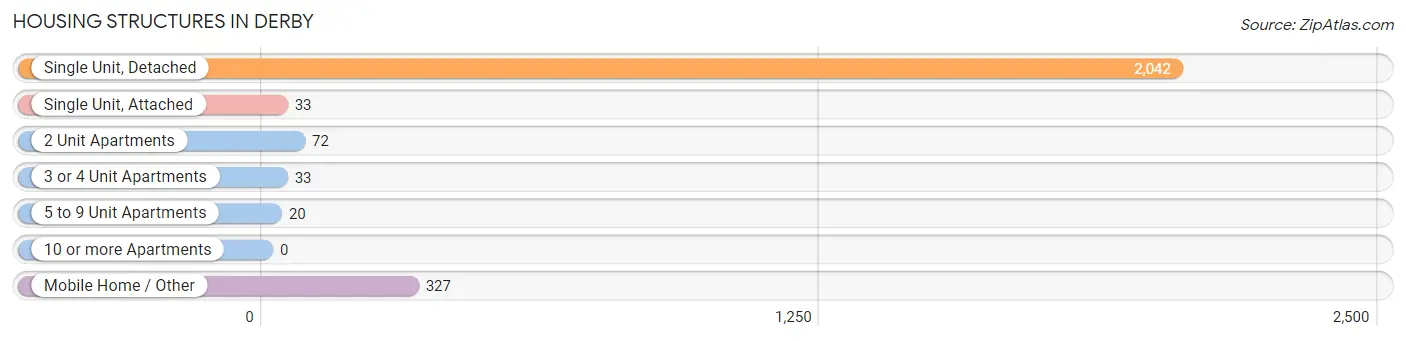
| Structure Type | # Housing Units | % Housing Units |
| Single Unit, Detached | 2,042 | 80.8% |
| Single Unit, Attached | 33 | 1.3% |
| 2 Unit Apartments | 72 | 2.9% |
| 3 or 4 Unit Apartments | 33 | 1.3% |
| 5 to 9 Unit Apartments | 20 | 0.8% |
| 10 or more Apartments | 0 | 0.0% |
| Mobile Home / Other | 327 | 12.9% |
| Total | 2,527 | 100.0% |
Housing Structures by Occupancy in Derby
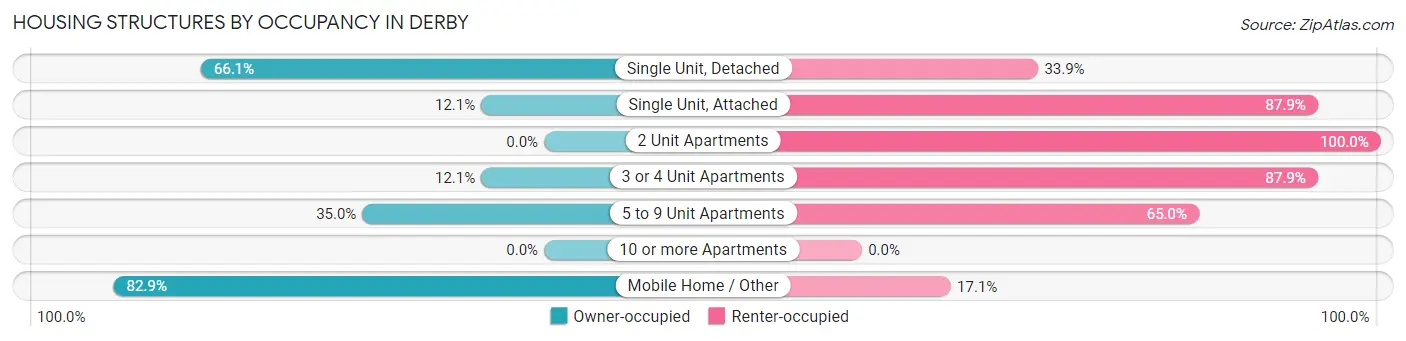
| Structure Type | Owner-occupied | Renter-occupied |
| Single Unit, Detached | 1,349 (66.1%) | 693 (33.9%) |
| Single Unit, Attached | 4 (12.1%) | 29 (87.9%) |
| 2 Unit Apartments | 0 (0.0%) | 72 (100.0%) |
| 3 or 4 Unit Apartments | 4 (12.1%) | 29 (87.9%) |
| 5 to 9 Unit Apartments | 7 (35.0%) | 13 (65.0%) |
| 10 or more Apartments | 0 (0.0%) | 0 (0.0%) |
| Mobile Home / Other | 271 (82.9%) | 56 (17.1%) |
| Total | 1,635 (64.7%) | 892 (35.3%) |
Housing Structures by Number of Rooms in Derby
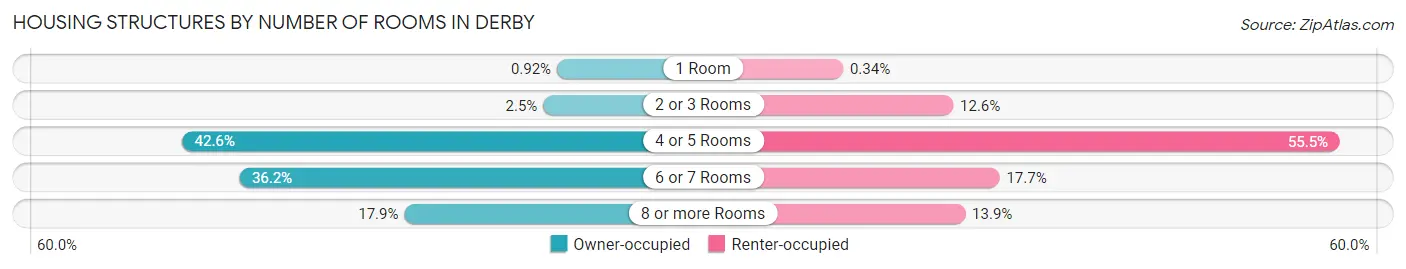
| Number of Rooms | Owner-occupied | Renter-occupied |
| 1 Room | 15 (0.9%) | 3 (0.3%) |
| 2 or 3 Rooms | 40 (2.5%) | 112 (12.6%) |
| 4 or 5 Rooms | 696 (42.6%) | 495 (55.5%) |
| 6 or 7 Rooms | 592 (36.2%) | 158 (17.7%) |
| 8 or more Rooms | 292 (17.9%) | 124 (13.9%) |
| Total | 1,635 (100.0%) | 892 (100.0%) |
Housing Structure by Heating Type in Derby
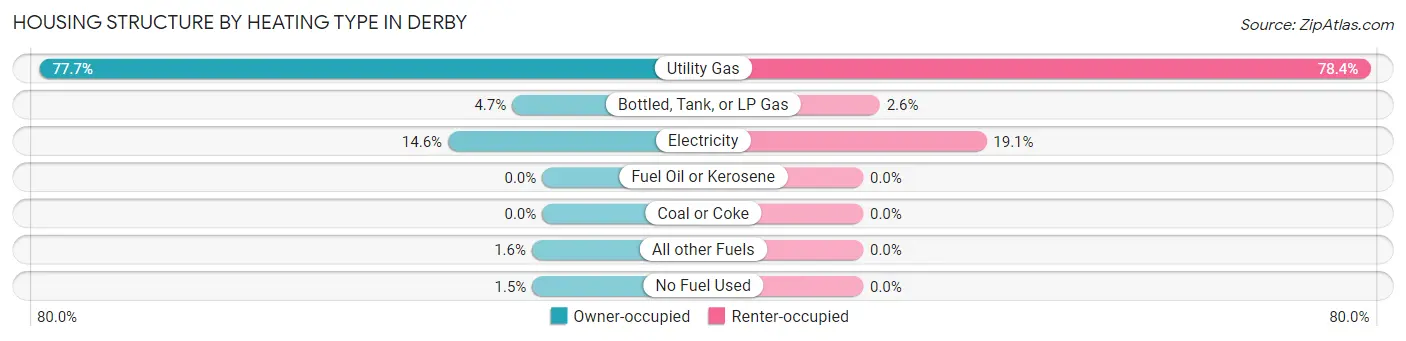
| Heating Type | Owner-occupied | Renter-occupied |
| Utility Gas | 1,270 (77.7%) | 699 (78.4%) |
| Bottled, Tank, or LP Gas | 76 (4.6%) | 23 (2.6%) |
| Electricity | 238 (14.6%) | 170 (19.1%) |
| Fuel Oil or Kerosene | 0 (0.0%) | 0 (0.0%) |
| Coal or Coke | 0 (0.0%) | 0 (0.0%) |
| All other Fuels | 26 (1.6%) | 0 (0.0%) |
| No Fuel Used | 25 (1.5%) | 0 (0.0%) |
| Total | 1,635 (100.0%) | 892 (100.0%) |
Household Vehicle Usage in Derby
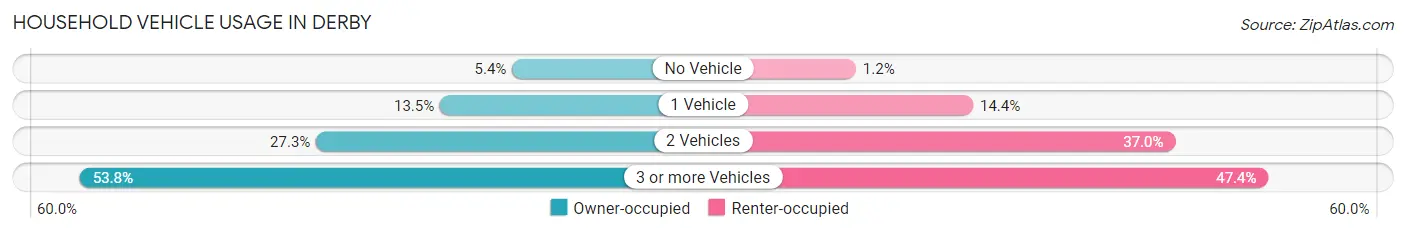
| Vehicles per Household | Owner-occupied | Renter-occupied |
| No Vehicle | 88 (5.4%) | 11 (1.2%) |
| 1 Vehicle | 220 (13.5%) | 128 (14.3%) |
| 2 Vehicles | 447 (27.3%) | 330 (37.0%) |
| 3 or more Vehicles | 880 (53.8%) | 423 (47.4%) |
| Total | 1,635 (100.0%) | 892 (100.0%) |
Real Estate & Mortgages in Derby
Real Estate and Mortgage Overview in Derby
| Characteristic | Without Mortgage | With Mortgage |
| Housing Units | 562 | 1,073 |
| Median Property Value | $250,500 | $331,700 |
| Median Household Income | $67,649 | $250 |
| Monthly Housing Costs | $494 | $61 |
| Real Estate Taxes | $1,099 | $72 |
Property Value by Mortgage Status in Derby
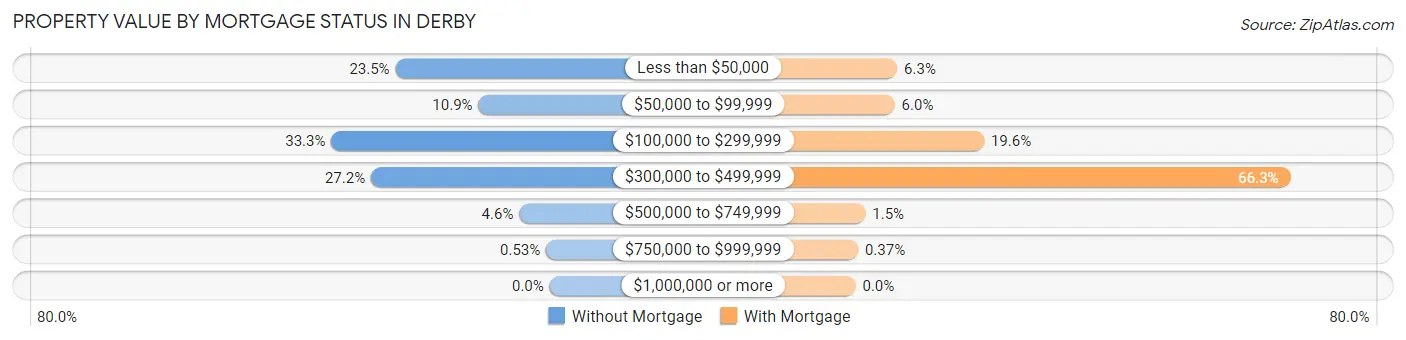
| Property Value | Without Mortgage | With Mortgage |
| Less than $50,000 | 132 (23.5%) | 68 (6.3%) |
| $50,000 to $99,999 | 61 (10.8%) | 64 (6.0%) |
| $100,000 to $299,999 | 187 (33.3%) | 210 (19.6%) |
| $300,000 to $499,999 | 153 (27.2%) | 711 (66.3%) |
| $500,000 to $749,999 | 26 (4.6%) | 16 (1.5%) |
| $750,000 to $999,999 | 3 (0.5%) | 4 (0.4%) |
| $1,000,000 or more | 0 (0.0%) | 0 (0.0%) |
| Total | 562 (100.0%) | 1,073 (100.0%) |
Household Income by Mortgage Status in Derby
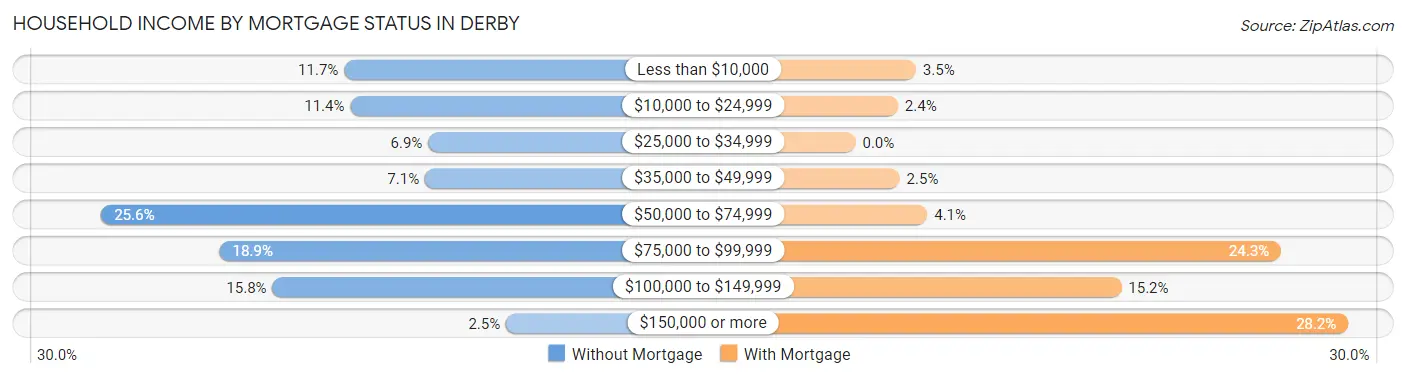
| Household Income | Without Mortgage | With Mortgage |
| Less than $10,000 | 66 (11.7%) | 37 (3.5%) |
| $10,000 to $24,999 | 64 (11.4%) | 26 (2.4%) |
| $25,000 to $34,999 | 39 (6.9%) | 0 (0.0%) |
| $35,000 to $49,999 | 40 (7.1%) | 27 (2.5%) |
| $50,000 to $74,999 | 144 (25.6%) | 44 (4.1%) |
| $75,000 to $99,999 | 106 (18.9%) | 261 (24.3%) |
| $100,000 to $149,999 | 89 (15.8%) | 163 (15.2%) |
| $150,000 or more | 14 (2.5%) | 302 (28.1%) |
| Total | 562 (100.0%) | 1,073 (100.0%) |
Property Value to Household Income Ratio in Derby
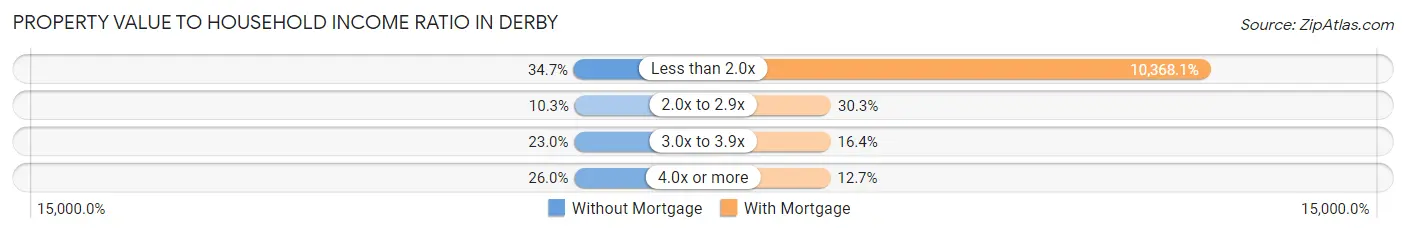
| Value-to-Income Ratio | Without Mortgage | With Mortgage |
| Less than 2.0x | 195 (34.7%) | 111,250 (10,368.1%) |
| 2.0x to 2.9x | 58 (10.3%) | 325 (30.3%) |
| 3.0x to 3.9x | 129 (23.0%) | 176 (16.4%) |
| 4.0x or more | 146 (26.0%) | 136 (12.7%) |
| Total | 562 (100.0%) | 1,073 (100.0%) |
Real Estate Taxes by Mortgage Status in Derby
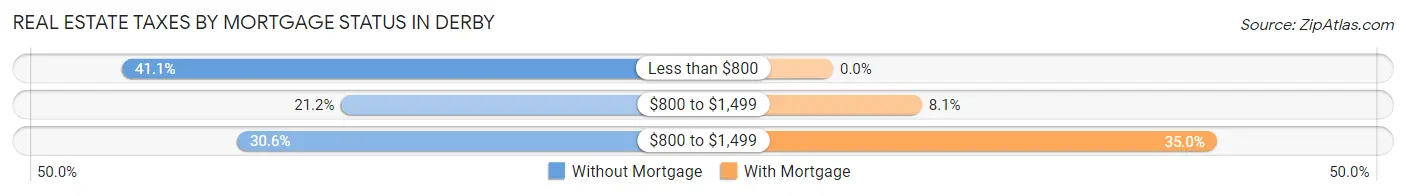
| Property Taxes | Without Mortgage | With Mortgage |
| Less than $800 | 231 (41.1%) | 0 (0.0%) |
| $800 to $1,499 | 119 (21.2%) | 87 (8.1%) |
| $800 to $1,499 | 172 (30.6%) | 376 (35.0%) |
| Total | 562 (100.0%) | 1,073 (100.0%) |
Health & Disability in Derby
Health Insurance Coverage by Age in Derby
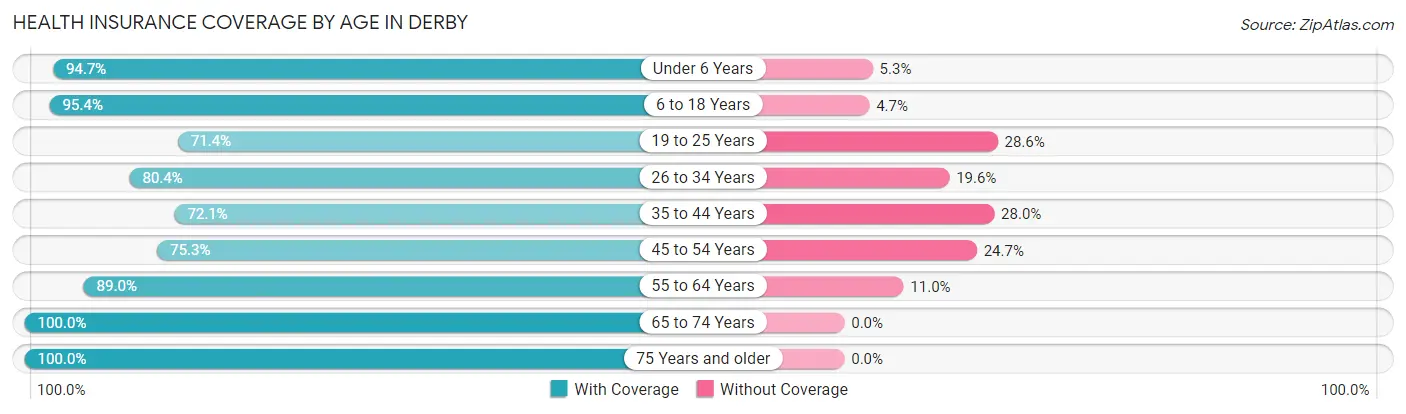
| Age Bracket | With Coverage | Without Coverage |
| Under 6 Years | 680 (94.7%) | 38 (5.3%) |
| 6 to 18 Years | 1,928 (95.4%) | 94 (4.6%) |
| 19 to 25 Years | 665 (71.4%) | 266 (28.6%) |
| 26 to 34 Years | 946 (80.4%) | 230 (19.6%) |
| 35 to 44 Years | 861 (72.1%) | 334 (28.0%) |
| 45 to 54 Years | 1,070 (75.3%) | 351 (24.7%) |
| 55 to 64 Years | 735 (89.0%) | 91 (11.0%) |
| 65 to 74 Years | 549 (100.0%) | 0 (0.0%) |
| 75 Years and older | 163 (100.0%) | 0 (0.0%) |
| Total | 7,597 (84.4%) | 1,404 (15.6%) |
Health Insurance Coverage by Citizenship Status in Derby
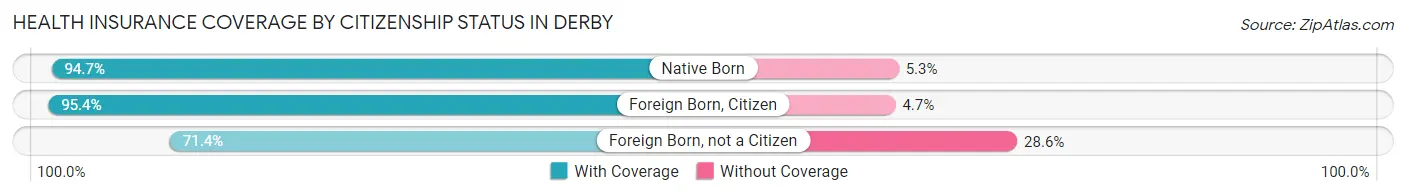
| Citizenship Status | With Coverage | Without Coverage |
| Native Born | 680 (94.7%) | 38 (5.3%) |
| Foreign Born, Citizen | 1,928 (95.4%) | 94 (4.6%) |
| Foreign Born, not a Citizen | 665 (71.4%) | 266 (28.6%) |
Health Insurance Coverage by Household Income in Derby
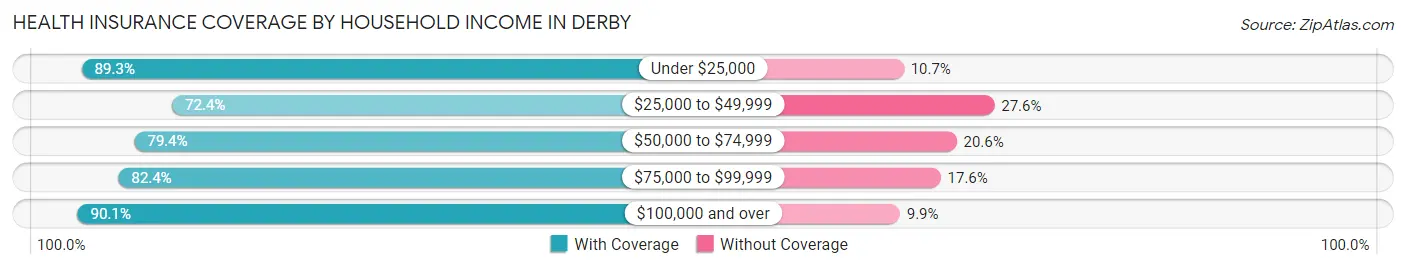
| Household Income | With Coverage | Without Coverage |
| Under $25,000 | 545 (89.3%) | 65 (10.7%) |
| $25,000 to $49,999 | 765 (72.4%) | 292 (27.6%) |
| $50,000 to $74,999 | 1,507 (79.4%) | 390 (20.6%) |
| $75,000 to $99,999 | 1,341 (82.4%) | 286 (17.6%) |
| $100,000 and over | 3,329 (90.1%) | 367 (9.9%) |
Public vs Private Health Insurance Coverage by Age in Derby
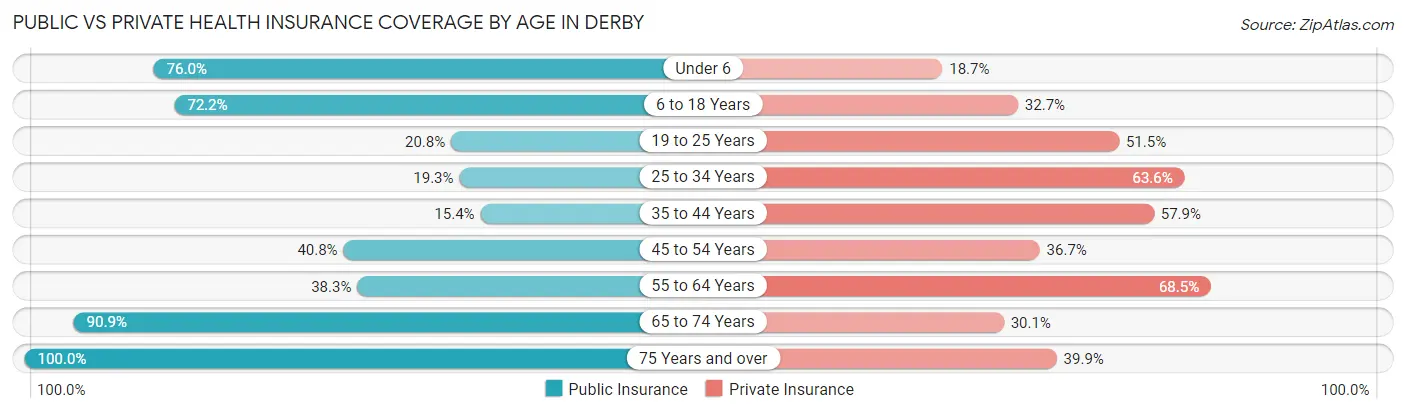
| Age Bracket | Public Insurance | Private Insurance |
| Under 6 | 546 (76.0%) | 134 (18.7%) |
| 6 to 18 Years | 1,460 (72.2%) | 661 (32.7%) |
| 19 to 25 Years | 194 (20.8%) | 479 (51.4%) |
| 25 to 34 Years | 227 (19.3%) | 748 (63.6%) |
| 35 to 44 Years | 184 (15.4%) | 692 (57.9%) |
| 45 to 54 Years | 580 (40.8%) | 522 (36.7%) |
| 55 to 64 Years | 316 (38.3%) | 566 (68.5%) |
| 65 to 74 Years | 499 (90.9%) | 165 (30.0%) |
| 75 Years and over | 163 (100.0%) | 65 (39.9%) |
| Total | 4,169 (46.3%) | 4,032 (44.8%) |
Disability Status by Sex by Age in Derby
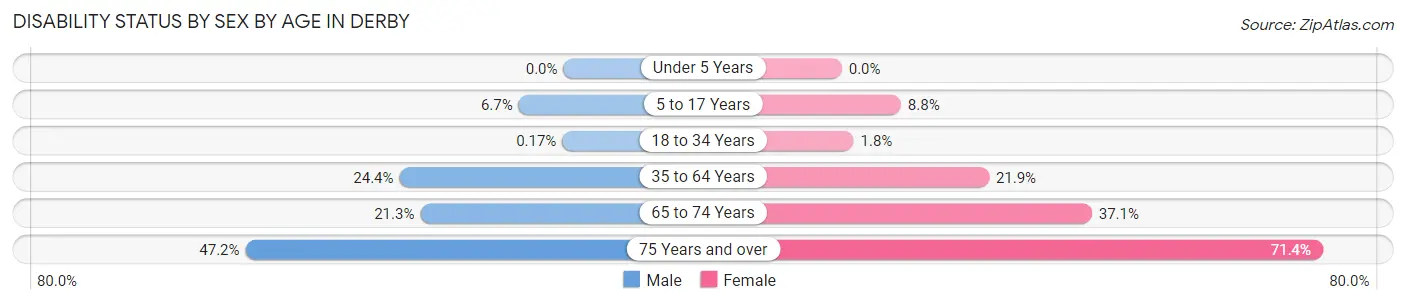
| Age Bracket | Male | Female |
| Under 5 Years | 0 (0.0%) | 0 (0.0%) |
| 5 to 17 Years | 71 (6.7%) | 91 (8.8%) |
| 18 to 34 Years | 2 (0.2%) | 17 (1.8%) |
| 35 to 64 Years | 429 (24.3%) | 367 (21.8%) |
| 65 to 74 Years | 68 (21.2%) | 85 (37.1%) |
| 75 Years and over | 34 (47.2%) | 65 (71.4%) |
Disability Class by Sex by Age in Derby
Disability Class: Hearing Difficulty
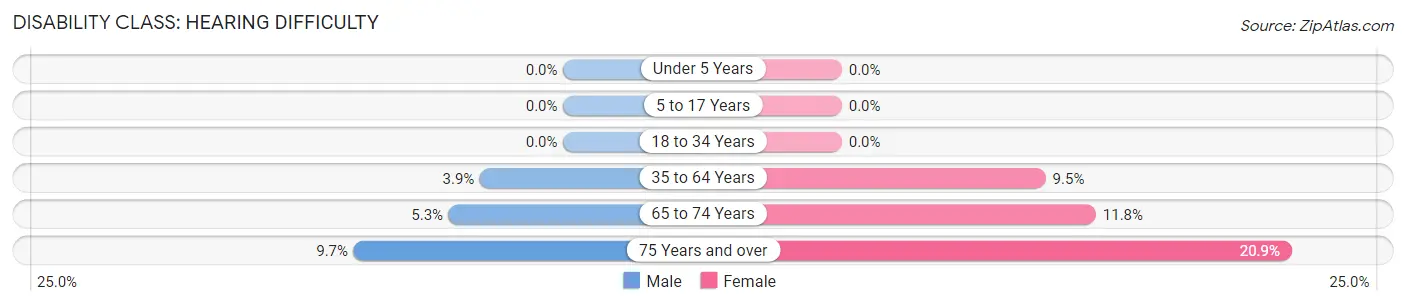
| Age Bracket | Male | Female |
| Under 5 Years | 0 (0.0%) | 0 (0.0%) |
| 5 to 17 Years | 0 (0.0%) | 0 (0.0%) |
| 18 to 34 Years | 0 (0.0%) | 0 (0.0%) |
| 35 to 64 Years | 68 (3.9%) | 159 (9.5%) |
| 65 to 74 Years | 17 (5.3%) | 27 (11.8%) |
| 75 Years and over | 7 (9.7%) | 19 (20.9%) |
Disability Class: Vision Difficulty
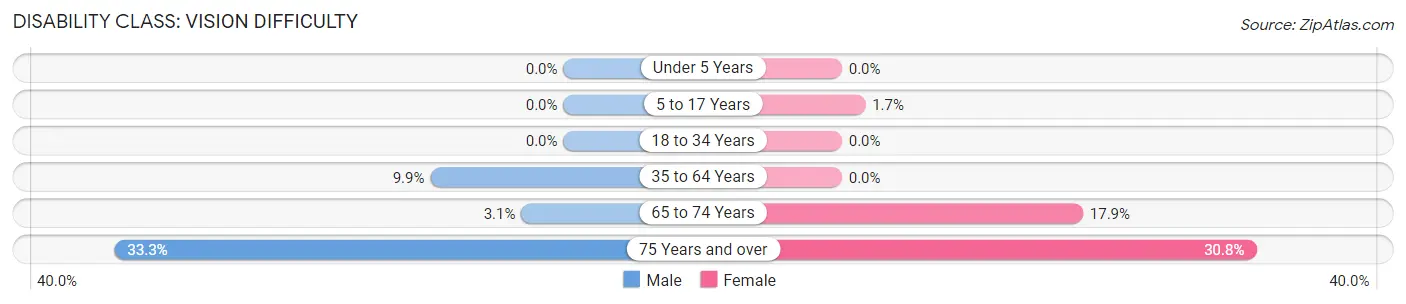
| Age Bracket | Male | Female |
| Under 5 Years | 0 (0.0%) | 0 (0.0%) |
| 5 to 17 Years | 0 (0.0%) | 18 (1.7%) |
| 18 to 34 Years | 0 (0.0%) | 0 (0.0%) |
| 35 to 64 Years | 174 (9.9%) | 0 (0.0%) |
| 65 to 74 Years | 10 (3.1%) | 41 (17.9%) |
| 75 Years and over | 24 (33.3%) | 28 (30.8%) |
Disability Class: Cognitive Difficulty
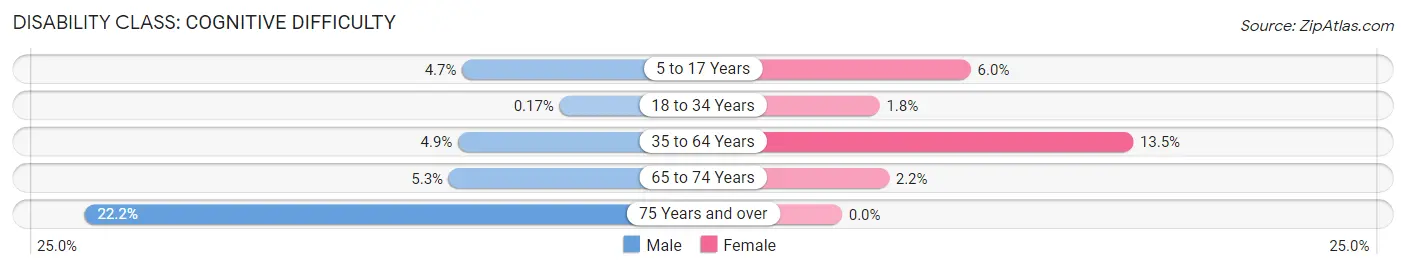
| Age Bracket | Male | Female |
| 5 to 17 Years | 50 (4.7%) | 62 (6.0%) |
| 18 to 34 Years | 2 (0.2%) | 17 (1.8%) |
| 35 to 64 Years | 86 (4.9%) | 227 (13.5%) |
| 65 to 74 Years | 17 (5.3%) | 5 (2.2%) |
| 75 Years and over | 16 (22.2%) | 0 (0.0%) |
Disability Class: Ambulatory Difficulty
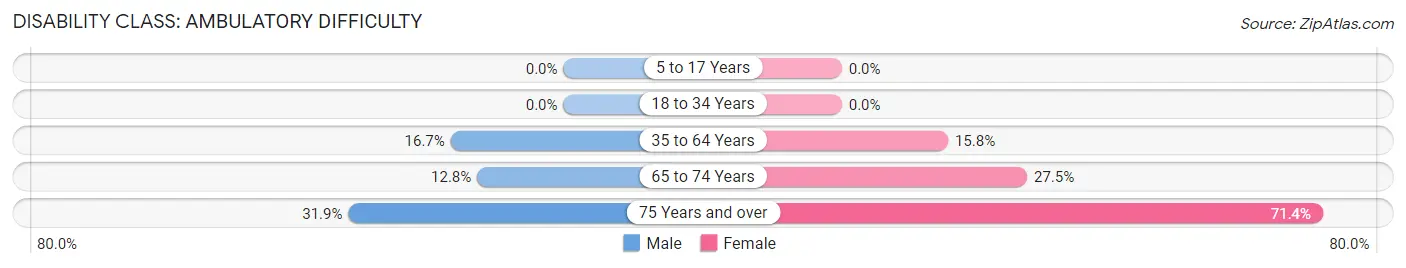
| Age Bracket | Male | Female |
| 5 to 17 Years | 0 (0.0%) | 0 (0.0%) |
| 18 to 34 Years | 0 (0.0%) | 0 (0.0%) |
| 35 to 64 Years | 295 (16.7%) | 265 (15.8%) |
| 65 to 74 Years | 41 (12.8%) | 63 (27.5%) |
| 75 Years and over | 23 (31.9%) | 65 (71.4%) |
Disability Class: Self-Care Difficulty
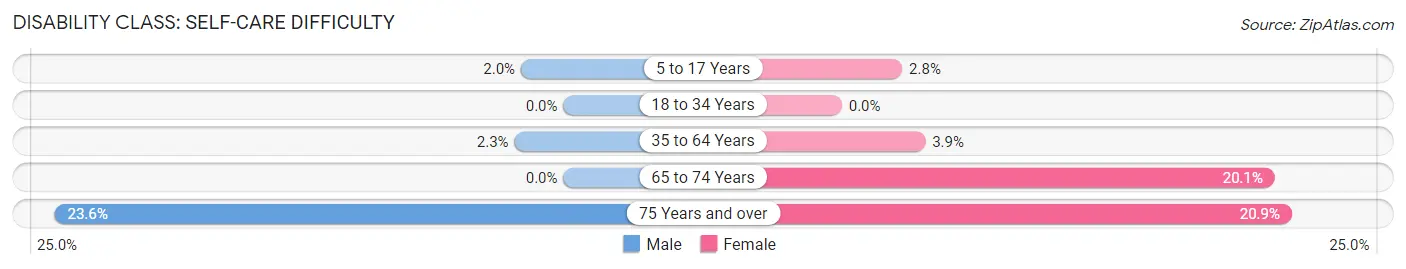
| Age Bracket | Male | Female |
| 5 to 17 Years | 21 (2.0%) | 29 (2.8%) |
| 18 to 34 Years | 0 (0.0%) | 0 (0.0%) |
| 35 to 64 Years | 40 (2.3%) | 65 (3.9%) |
| 65 to 74 Years | 0 (0.0%) | 46 (20.1%) |
| 75 Years and over | 17 (23.6%) | 19 (20.9%) |
Technology Access in Derby
Computing Device Access in Derby
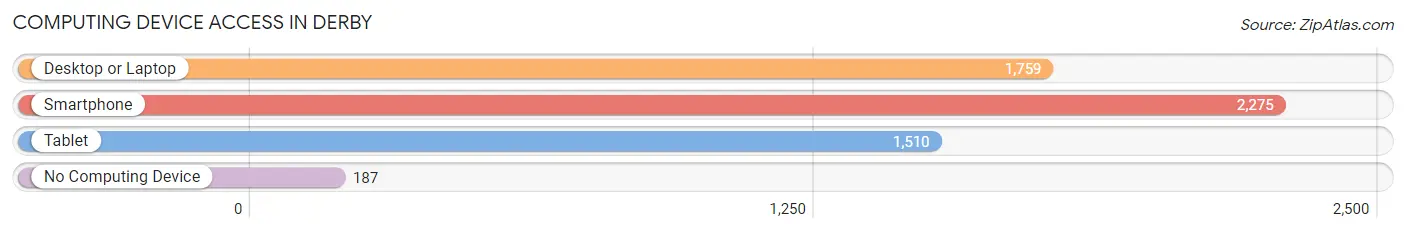
| Device Type | # Households | % Households |
| Desktop or Laptop | 1,759 | 69.6% |
| Smartphone | 2,275 | 90.0% |
| Tablet | 1,510 | 59.8% |
| No Computing Device | 187 | 7.4% |
| Total | 2,527 | 100.0% |
Internet Access in Derby
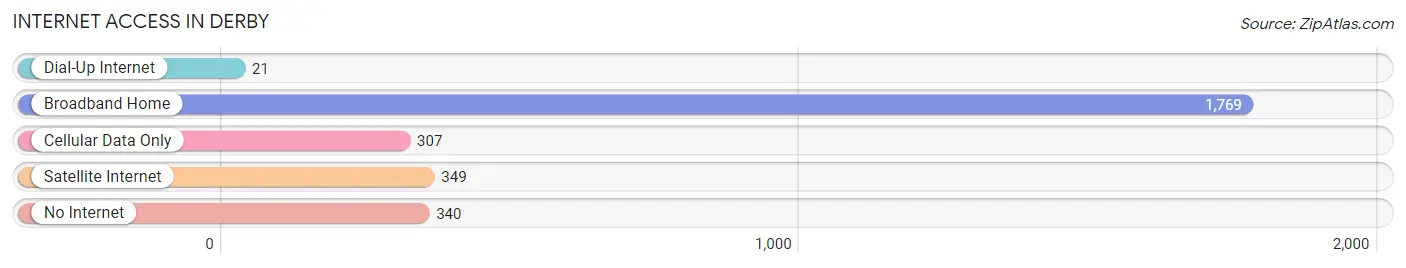
| Internet Type | # Households | % Households |
| Dial-Up Internet | 21 | 0.8% |
| Broadband Home | 1,769 | 70.0% |
| Cellular Data Only | 307 | 12.1% |
| Satellite Internet | 349 | 13.8% |
| No Internet | 340 | 13.5% |
| Total | 2,527 | 100.0% |
Derby Summary
Derby is a small city located in the state of Colorado, United States. It is situated in the Denver-Aurora-Lakewood metropolitan area and is part of the Denver-Aurora-Boulder Combined Statistical Area. The city is located in the eastern part of Arapahoe County and is bordered by the cities of Aurora, Englewood, and Littleton. Derby is a relatively small city, with a population of just over 4,000 people as of the 2010 census.
Geography
Derby is located in the eastern part of Arapahoe County, Colorado, at an elevation of 5,541 feet (1,689 m). The city is situated in the Denver-Aurora-Lakewood metropolitan area and is part of the Denver-Aurora-Boulder Combined Statistical Area. The city is bordered by the cities of Aurora, Englewood, and Littleton. Derby is located in the South Platte River Valley, which is a major agricultural area. The city is located in the foothills of the Rocky Mountains, and is surrounded by rolling hills and open plains.
Economy
Derby’s economy is largely based on agriculture and light industry. The city is home to several small businesses, including a number of restaurants, retail stores, and service providers. The city is also home to a number of corporate offices, including those of the Denver-based energy company Xcel Energy. The city is also home to a number of small manufacturing companies, including a number of food processing plants.
Demographics
As of the 2010 census, Derby had a population of 4,072 people. The racial makeup of the city was 79.2% White, 8.2% African American, 0.7% Native American, 1.2% Asian, 0.1% Pacific Islander, 7.2% from other races, and 3.5% from two or more races. Hispanic or Latino of any race were 16.2% of the population.
The median income for a household in the city was $50,945, and the median income for a family was $60,945. The per capita income for the city was $25,945. About 8.2% of families and 10.2% of the population were below the poverty line, including 14.2% of those under age 18 and 6.2% of those age 65 or over.
Conclusion
Derby is a small city located in the eastern part of Arapahoe County, Colorado. The city is situated in the Denver-Aurora-Lakewood metropolitan area and is part of the Denver-Aurora-Boulder Combined Statistical Area. The city has a population of just over 4,000 people as of the 2010 census. Derby’s economy is largely based on agriculture and light industry, and the city is home to several small businesses, corporate offices, and manufacturing companies. The racial makeup of the city is 79.2% White, 8.2% African American, 0.7% Native American, 1.2% Asian, 0.1% Pacific Islander, 7.2% from other races, and 3.5% from two or more races. The median income for a household in the city was $50,945, and the median income for a family was $60,945.
Common Questions
What is Per Capita Income in Derby?
Per Capita income in Derby is $25,668.
What is the Median Family Income in Derby?
Median Family Income in Derby is $92,718.
What is the Median Household income in Derby?
Median Household Income in Derby is $77,261.
What is Income or Wage Gap in Derby?
Income or Wage Gap in Derby is 12.4%.
Women in Derby earn 87.6 cents for every dollar earned by a man.
What is Inequality or Gini Index in Derby?
Inequality or Gini Index in Derby is 0.35.
What is the Total Population of Derby?
Total Population of Derby is 9,009.
What is the Total Male Population of Derby?
Total Male Population of Derby is 4,704.
What is the Total Female Population of Derby?
Total Female Population of Derby is 4,305.
What is the Ratio of Males per 100 Females in Derby?
There are 109.27 Males per 100 Females in Derby.
What is the Ratio of Females per 100 Males in Derby?
There are 91.52 Females per 100 Males in Derby.
What is the Median Population Age in Derby?
Median Population Age in Derby is 31.9 Years.
What is the Average Family Size in Derby
Average Family Size in Derby is 3.9 People.
What is the Average Household Size in Derby
Average Household Size in Derby is 3.5 People.
How Large is the Labor Force in Derby?
There are 4,456 People in the Labor Forcein in Derby.
What is the Percentage of People in the Labor Force in Derby?
65.9% of People are in the Labor Force in Derby.
What is the Unemployment Rate in Derby?
Unemployment Rate in Derby is 4.8%.