North La Junta, CO Map & Demographics
North La Junta Map
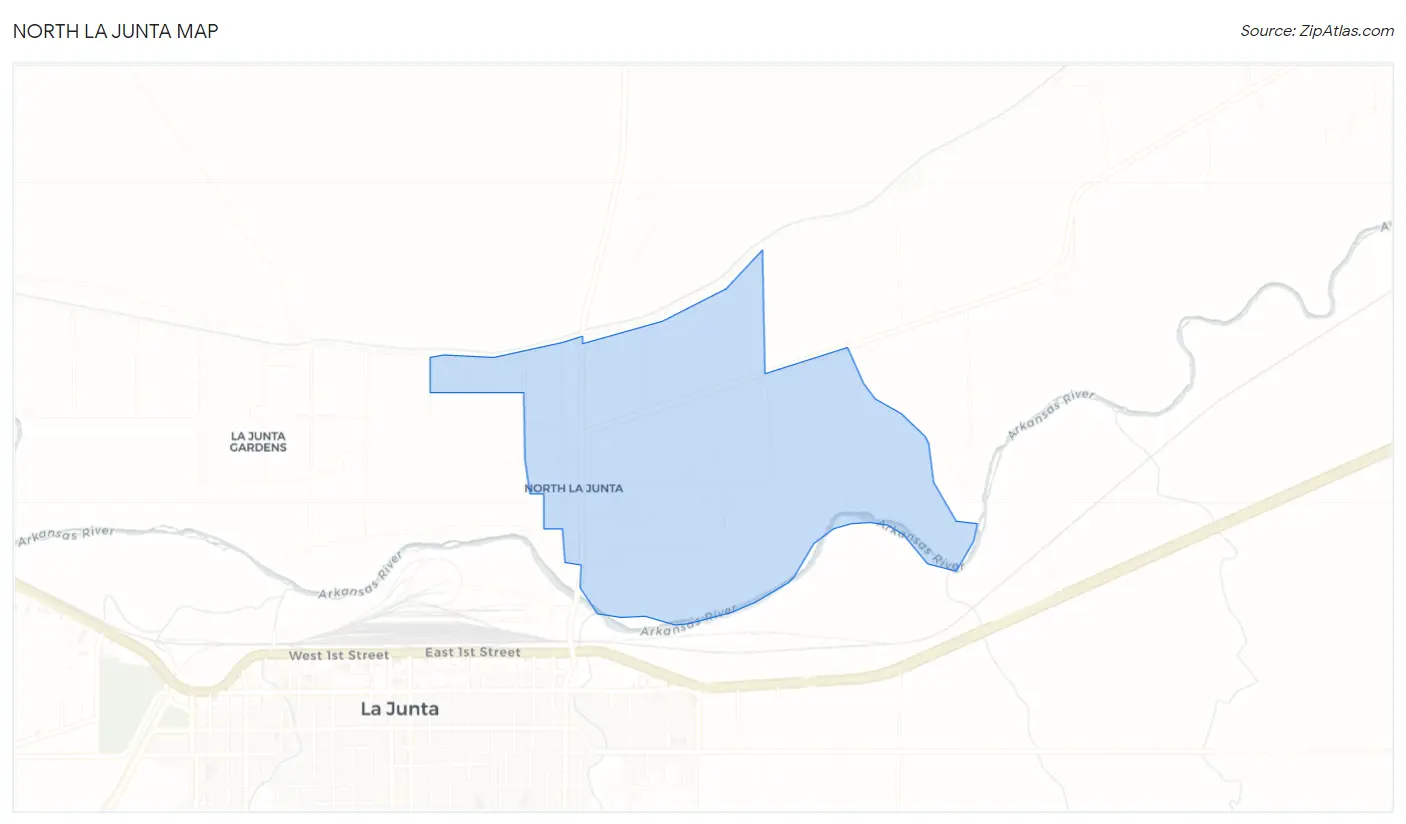
North La Junta Overview
$22,638
PER CAPITA INCOME
$58,519
AVG FAMILY INCOME
$51,042
AVG HOUSEHOLD INCOME
35.8%
WAGE / INCOME GAP [ % ]
64.2¢/ $1
WAGE / INCOME GAP [ $ ]
0.22
INEQUALITY / GINI INDEX
461
TOTAL POPULATION
180
MALE POPULATION
281
FEMALE POPULATION
64.06
MALES / 100 FEMALES
156.11
FEMALES / 100 MALES
40.5
MEDIAN AGE
2.5
AVG FAMILY SIZE
2.1
AVG HOUSEHOLD SIZE
261
LABOR FORCE [ PEOPLE ]
68.7%
PERCENT IN LABOR FORCE
2.7%
UNEMPLOYMENT RATE
Income in North La Junta
Income Overview in North La Junta
Per Capita Income in North La Junta is $22,638, while median incomes of families and households are $58,519 and $51,042 respectively.
| Characteristic | Number | Measure |
| Per Capita Income | 461 | $22,638 |
| Median Family Income | 156 | $58,519 |
| Mean Family Income | 156 | $56,836 |
| Median Household Income | 214 | $51,042 |
| Mean Household Income | 214 | $49,345 |
| Income Deficit | 156 | $0 |
| Wage / Income Gap (%) | 461 | 35.82% |
| Wage / Income Gap ($) | 461 | 64.18¢ per $1 |
| Gini / Inequality Index | 461 | 0.22 |
Earnings by Sex in North La Junta
Average Earnings in North La Junta are $24,560, $36,538 for men and $23,449 for women, a difference of 35.8%.

| Sex | Number | Average Earnings |
| Male | 104 (39.3%) | $36,538 |
| Female | 161 (60.8%) | $23,449 |
| Total | 265 (100.0%) | $24,560 |
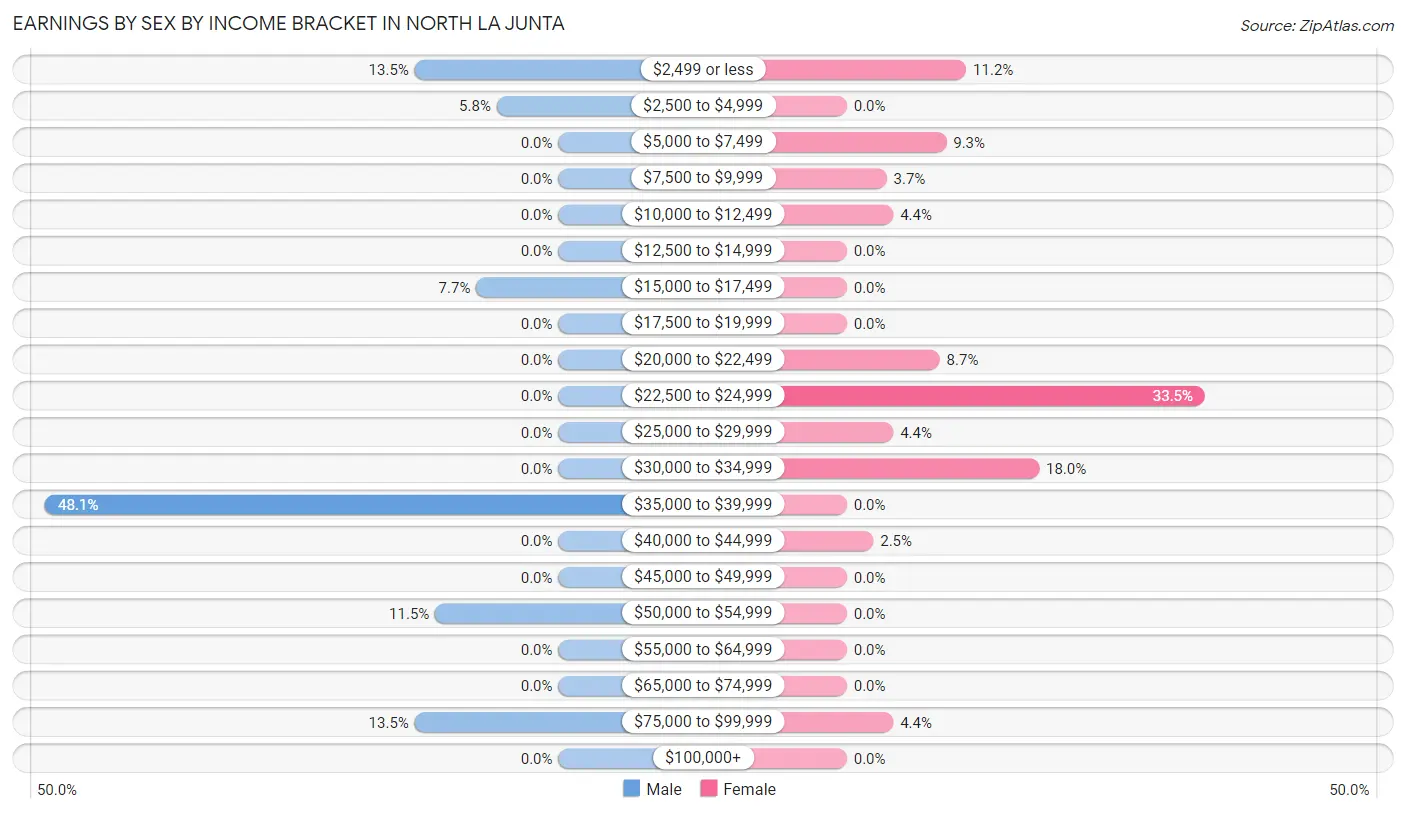
Earnings by Sex by Income Bracket in North La Junta
The most common earnings brackets in North La Junta are $35,000 to $39,999 for men (50 | 48.1%) and $22,500 to $24,999 for women (54 | 33.5%).
| Income | Male | Female |
| $2,499 or less | 14 (13.5%) | 18 (11.2%) |
| $2,500 to $4,999 | 6 (5.8%) | 0 (0.0%) |
| $5,000 to $7,499 | 0 (0.0%) | 15 (9.3%) |
| $7,500 to $9,999 | 0 (0.0%) | 6 (3.7%) |
| $10,000 to $12,499 | 0 (0.0%) | 7 (4.3%) |
| $12,500 to $14,999 | 0 (0.0%) | 0 (0.0%) |
| $15,000 to $17,499 | 8 (7.7%) | 0 (0.0%) |
| $17,500 to $19,999 | 0 (0.0%) | 0 (0.0%) |
| $20,000 to $22,499 | 0 (0.0%) | 14 (8.7%) |
| $22,500 to $24,999 | 0 (0.0%) | 54 (33.5%) |
| $25,000 to $29,999 | 0 (0.0%) | 7 (4.3%) |
| $30,000 to $34,999 | 0 (0.0%) | 29 (18.0%) |
| $35,000 to $39,999 | 50 (48.1%) | 0 (0.0%) |
| $40,000 to $44,999 | 0 (0.0%) | 4 (2.5%) |
| $45,000 to $49,999 | 0 (0.0%) | 0 (0.0%) |
| $50,000 to $54,999 | 12 (11.5%) | 0 (0.0%) |
| $55,000 to $64,999 | 0 (0.0%) | 0 (0.0%) |
| $65,000 to $74,999 | 0 (0.0%) | 0 (0.0%) |
| $75,000 to $99,999 | 14 (13.5%) | 7 (4.3%) |
| $100,000+ | 0 (0.0%) | 0 (0.0%) |
| Total | 104 (100.0%) | 161 (100.0%) |
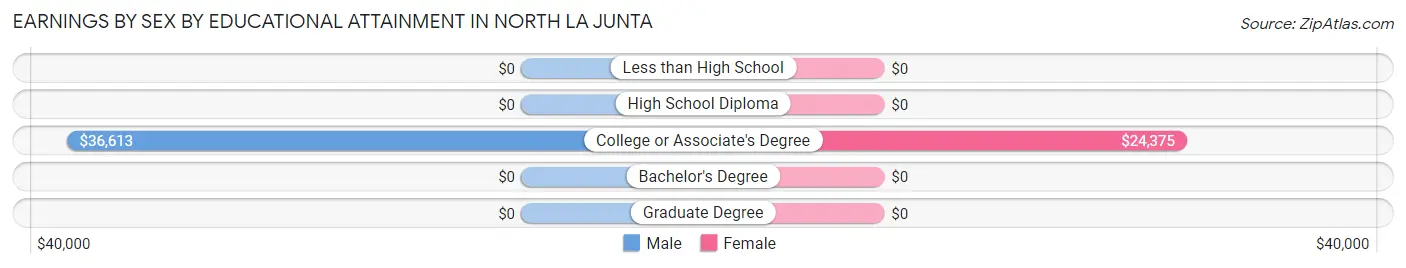
Earnings by Sex by Educational Attainment in North La Junta
Average earnings in North La Junta are $36,538 for men and $24,190 for women, a difference of 33.8%. Men with an educational attainment of college or associate's degree enjoy the highest average annual earnings of $36,613, while those with college or associate's degree education earn the least with $36,613. Women with an educational attainment of college or associate's degree earn the most with the average annual earnings of $24,375, while those with college or associate's degree education have the smallest earnings of $24,375.
| Educational Attainment | Male Income | Female Income |
| Less than High School | - | - |
| High School Diploma | - | - |
| College or Associate's Degree | $36,613 | $24,375 |
| Bachelor's Degree | - | - |
| Graduate Degree | - | - |
| Total | $36,538 | $24,190 |
Family Income in North La Junta
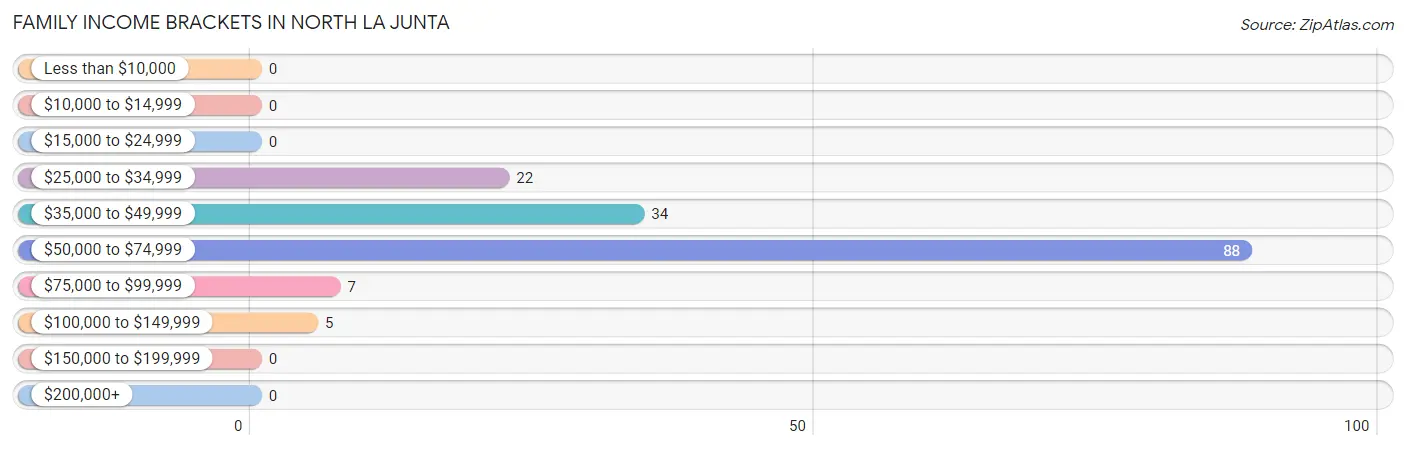
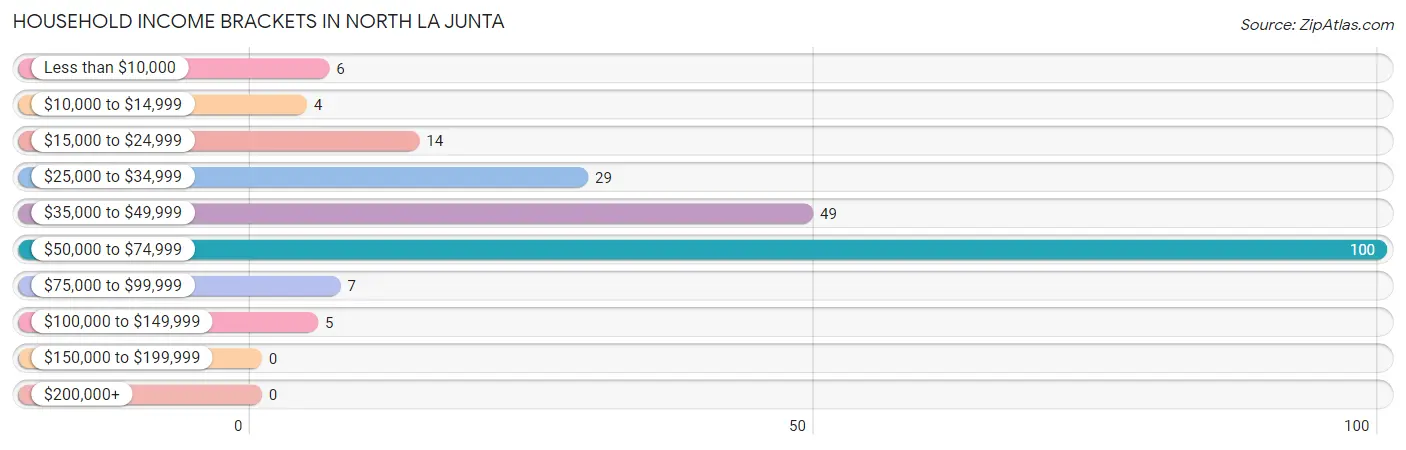
Family Income Brackets in North La Junta
According to the North La Junta family income data, there are 88 families falling into the $50,000 to $74,999 income range, which is the most common income bracket and makes up 56.4% of all families.
| Income Bracket | # Families | % Families |
| Less than $10,000 | 0 | 0.0% |
| $10,000 to $14,999 | 0 | 0.0% |
| $15,000 to $24,999 | 0 | 0.0% |
| $25,000 to $34,999 | 22 | 14.1% |
| $35,000 to $49,999 | 34 | 21.8% |
| $50,000 to $74,999 | 88 | 56.4% |
| $75,000 to $99,999 | 7 | 4.5% |
| $100,000 to $149,999 | 5 | 3.2% |
| $150,000 to $199,999 | 0 | 0.0% |
| $200,000+ | 0 | 0.0% |
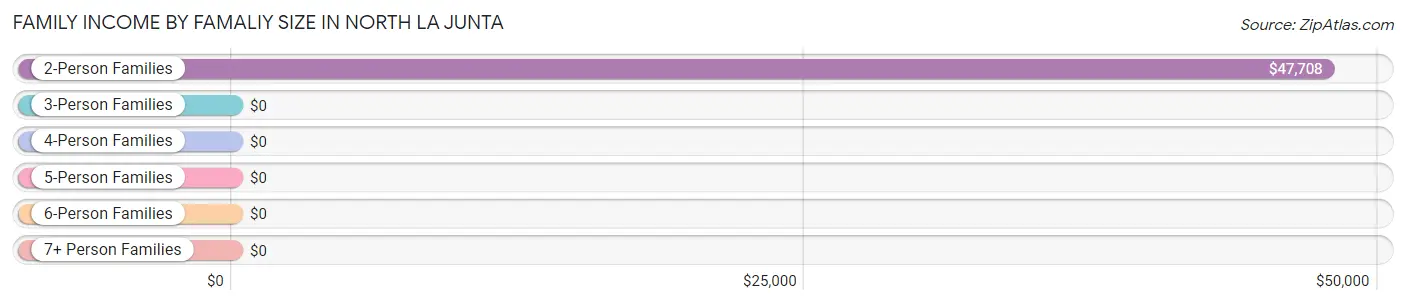
Family Income by Famaliy Size in North La Junta
2-person families (71 | 45.5%) account for the highest median family income in North La Junta with $47,708 per family, while 2-person families (71 | 45.5%) have the highest median income of $23,854 per family member.
| Income Bracket | # Families | Median Income |
| 2-Person Families | 71 (45.5%) | $47,708 |
| 3-Person Families | 26 (16.7%) | $0 |
| 4-Person Families | 54 (34.6%) | $0 |
| 5-Person Families | 0 (0.0%) | $0 |
| 6-Person Families | 0 (0.0%) | $0 |
| 7+ Person Families | 5 (3.2%) | $0 |
| Total | 156 (100.0%) | $58,519 |
Family Income by Number of Earners in North La Junta
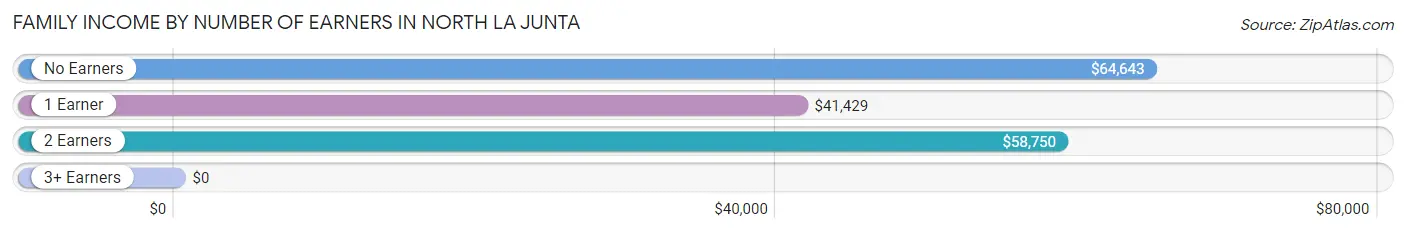
| Number of Earners | # Families | Median Income |
| No Earners | 34 (21.8%) | $64,643 |
| 1 Earner | 22 (14.1%) | $41,429 |
| 2 Earners | 100 (64.1%) | $58,750 |
| 3+ Earners | 0 (0.0%) | $0 |
| Total | 156 (100.0%) | $58,519 |
Household Income in North La Junta
Household Income Brackets in North La Junta
With 100 households falling in the category, the $50,000 to $74,999 income range is the most frequent in North La Junta, accounting for 46.7% of all households.
| Income Bracket | # Households | % Households |
| Less than $10,000 | 6 | 2.8% |
| $10,000 to $14,999 | 4 | 1.9% |
| $15,000 to $24,999 | 14 | 6.5% |
| $25,000 to $34,999 | 29 | 13.6% |
| $35,000 to $49,999 | 49 | 22.9% |
| $50,000 to $74,999 | 100 | 46.7% |
| $75,000 to $99,999 | 7 | 3.3% |
| $100,000 to $149,999 | 5 | 2.3% |
| $150,000 to $199,999 | 0 | 0.0% |
| $200,000+ | 0 | 0.0% |
Household Income by Householder Age in North La Junta
The median household income in North La Junta is $51,042, with the highest median household income of $58,866 found in the 25 to 44 years age bracket for the primary householder. A total of 95 households (44.4%) fall into this category.
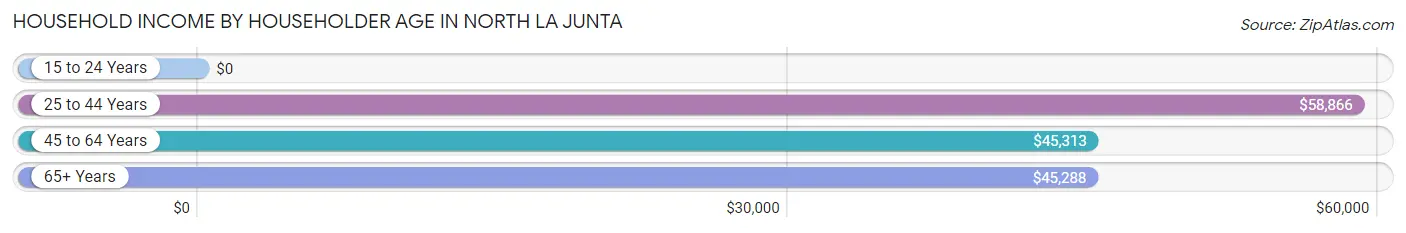
| Income Bracket | # Households | Median Income |
| 15 to 24 Years | 0 (0.0%) | $0 |
| 25 to 44 Years | 95 (44.4%) | $58,866 |
| 45 to 64 Years | 40 (18.7%) | $45,313 |
| 65+ Years | 79 (36.9%) | $45,288 |
| Total | 214 (100.0%) | $51,042 |
Poverty in North La Junta
Income Below Poverty by Sex and Age in North La Junta
With 3.3% poverty level for males and 3.9% for females among the residents of North La Junta, 75 year old and over males and 25 to 34 year old females are the most vulnerable to poverty, with 6 males (35.3%) and 7 females (23.3%) in their respective age groups living below the poverty level.
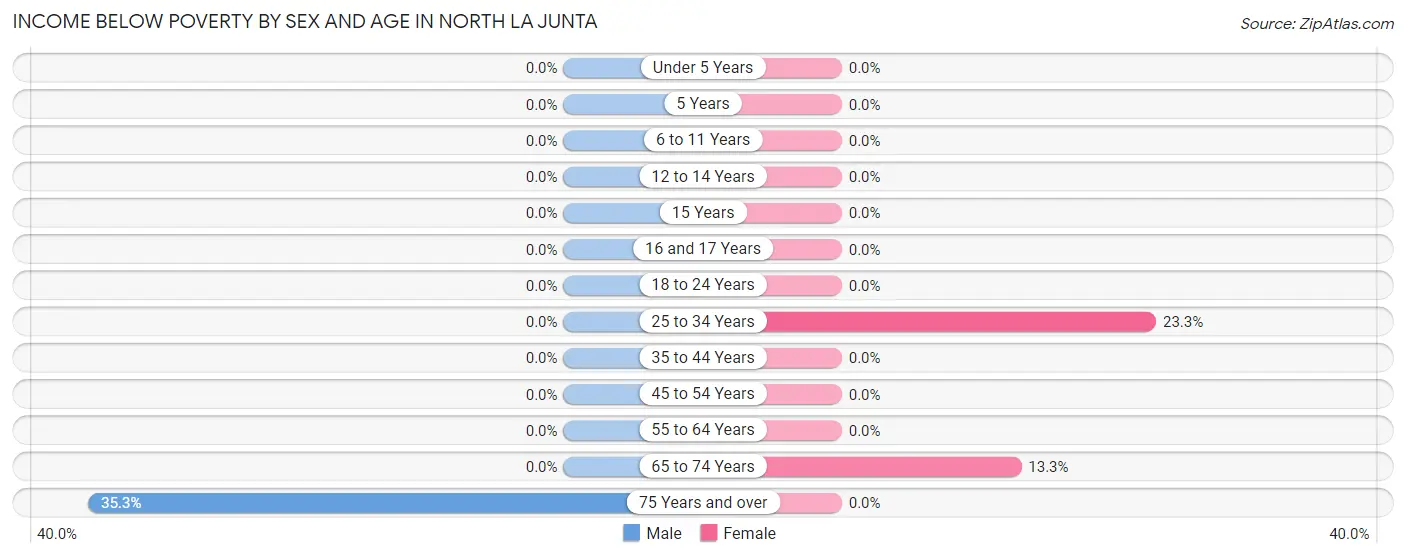
| Age Bracket | Male | Female |
| Under 5 Years | 0 (0.0%) | 0 (0.0%) |
| 5 Years | 0 (0.0%) | 0 (0.0%) |
| 6 to 11 Years | 0 (0.0%) | 0 (0.0%) |
| 12 to 14 Years | 0 (0.0%) | 0 (0.0%) |
| 15 Years | 0 (0.0%) | 0 (0.0%) |
| 16 and 17 Years | 0 (0.0%) | 0 (0.0%) |
| 18 to 24 Years | 0 (0.0%) | 0 (0.0%) |
| 25 to 34 Years | 0 (0.0%) | 7 (23.3%) |
| 35 to 44 Years | 0 (0.0%) | 0 (0.0%) |
| 45 to 54 Years | 0 (0.0%) | 0 (0.0%) |
| 55 to 64 Years | 0 (0.0%) | 0 (0.0%) |
| 65 to 74 Years | 0 (0.0%) | 4 (13.3%) |
| 75 Years and over | 6 (35.3%) | 0 (0.0%) |
| Total | 6 (3.3%) | 11 (3.9%) |
Income Above Poverty by Sex and Age in North La Junta
According to the poverty statistics in North La Junta, males aged 6 to 11 years and females aged under 5 years are the age groups that are most secure financially, with 100.0% of males and 100.0% of females in these age groups living above the poverty line.
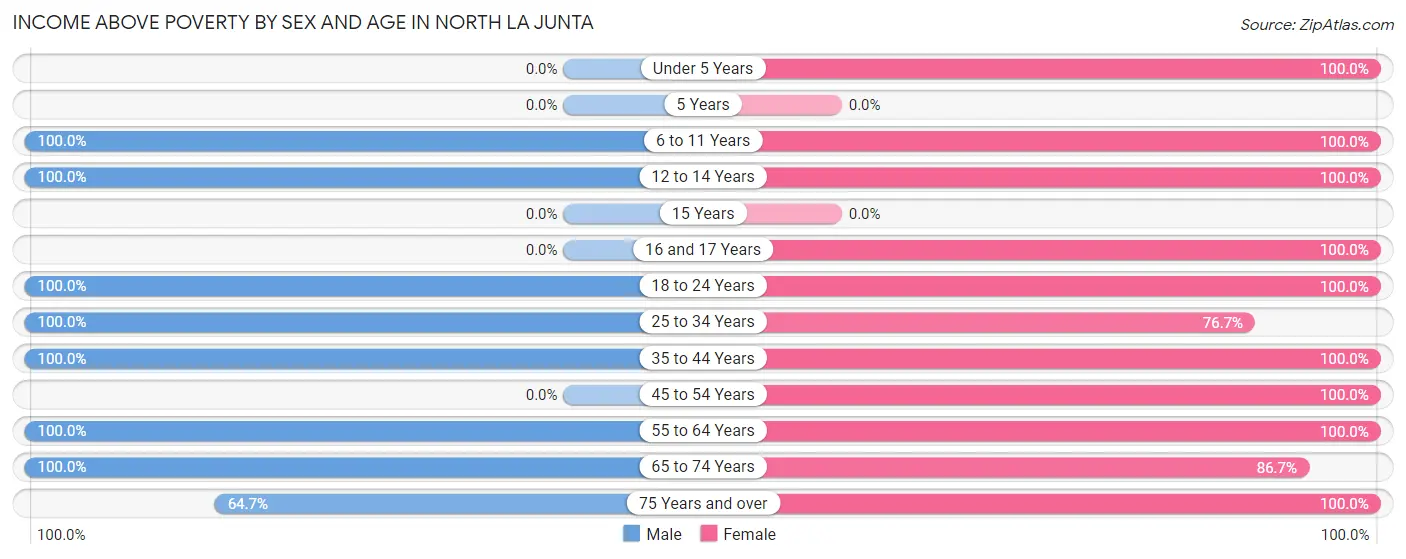
| Age Bracket | Male | Female |
| Under 5 Years | 0 (0.0%) | 35 (100.0%) |
| 5 Years | 0 (0.0%) | 0 (0.0%) |
| 6 to 11 Years | 7 (100.0%) | 7 (100.0%) |
| 12 to 14 Years | 25 (100.0%) | 7 (100.0%) |
| 15 Years | 0 (0.0%) | 0 (0.0%) |
| 16 and 17 Years | 0 (0.0%) | 36 (100.0%) |
| 18 to 24 Years | 7 (100.0%) | 14 (100.0%) |
| 25 to 34 Years | 17 (100.0%) | 23 (76.7%) |
| 35 to 44 Years | 45 (100.0%) | 61 (100.0%) |
| 45 to 54 Years | 0 (0.0%) | 15 (100.0%) |
| 55 to 64 Years | 21 (100.0%) | 28 (100.0%) |
| 65 to 74 Years | 41 (100.0%) | 26 (86.7%) |
| 75 Years and over | 11 (64.7%) | 18 (100.0%) |
| Total | 174 (96.7%) | 270 (96.1%) |
Income Below Poverty Among Married-Couple Families in North La Junta
| Children | Above Poverty | Below Poverty |
| No Children | 53 (100.0%) | 0 (0.0%) |
| 1 or 2 Children | 54 (100.0%) | 0 (0.0%) |
| 3 or 4 Children | 0 (0.0%) | 0 (0.0%) |
| 5 or more Children | 5 (100.0%) | 0 (0.0%) |
| Total | 112 (100.0%) | 0 (0.0%) |
Income Below Poverty Among Single-Parent Households in North La Junta
| Children | Single Father | Single Mother |
| No Children | 0 (0.0%) | 0 (0.0%) |
| 1 or 2 Children | 0 (0.0%) | 0 (0.0%) |
| 3 or 4 Children | 0 (0.0%) | 0 (0.0%) |
| 5 or more Children | 0 (0.0%) | 0 (0.0%) |
| Total | 0 (0.0%) | 0 (0.0%) |
Income Below Poverty Among Married-Couple vs Single-Parent Households in North La Junta
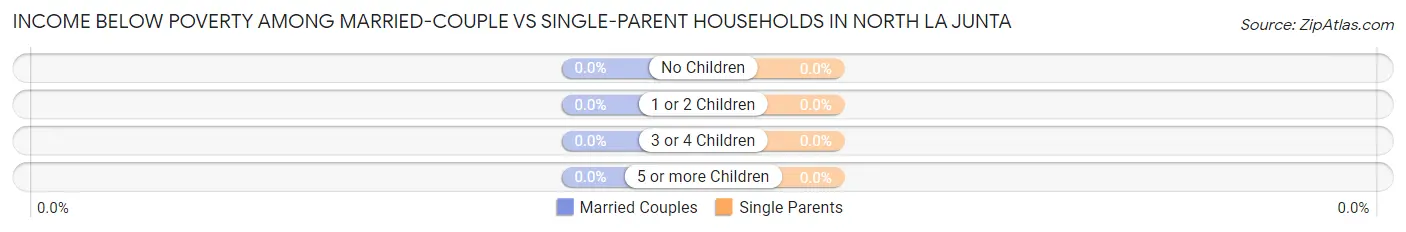
| Children | Married-Couple Families | Single-Parent Households |
| No Children | 0 (0.0%) | 0 (0.0%) |
| 1 or 2 Children | 0 (0.0%) | 0 (0.0%) |
| 3 or 4 Children | 0 (0.0%) | 0 (0.0%) |
| 5 or more Children | 0 (0.0%) | 0 (0.0%) |
| Total | 0 (0.0%) | 0 (0.0%) |
Race in North La Junta
The most populous races in North La Junta are White / Caucasian (301 | 65.3%), Hispanic or Latino (196 | 42.5%), and Some other Race (101 | 21.9%).
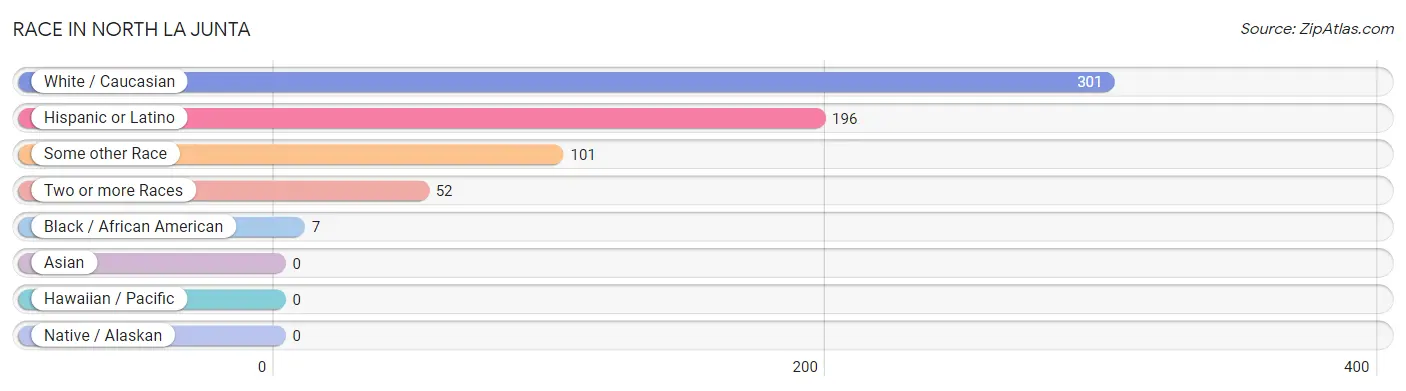
| Race | # Population | % Population |
| Asian | 0 | 0.0% |
| Black / African American | 7 | 1.5% |
| Hawaiian / Pacific | 0 | 0.0% |
| Hispanic or Latino | 196 | 42.5% |
| Native / Alaskan | 0 | 0.0% |
| White / Caucasian | 301 | 65.3% |
| Two or more Races | 52 | 11.3% |
| Some other Race | 101 | 21.9% |
| Total | 461 | 100.0% |
Ancestry in North La Junta
The most populous ancestries reported in North La Junta are Mexican (151 | 32.8%), German (75 | 16.3%), American (54 | 11.7%), Dutch (51 | 11.1%), and Irish (43 | 9.3%), together accounting for 81.1% of all North La Junta residents.
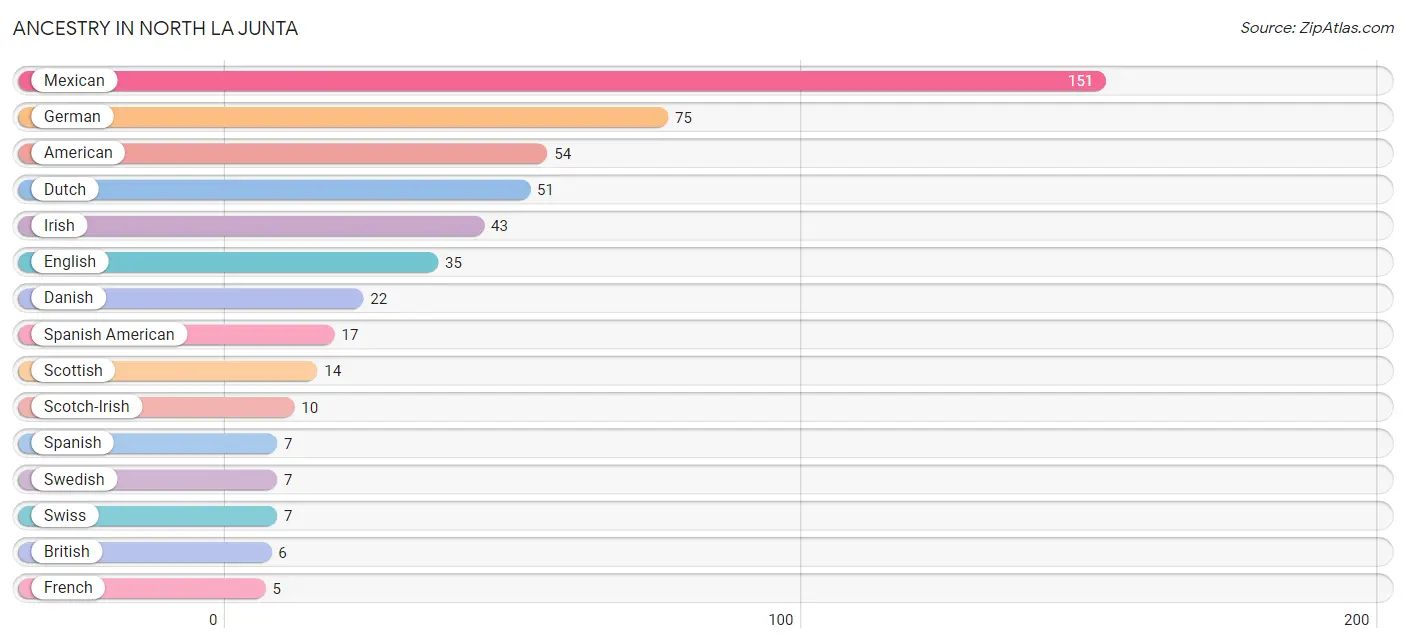
| Ancestry | # Population | % Population |
| American | 54 | 11.7% |
| British | 6 | 1.3% |
| Cherokee | 1 | 0.2% |
| Danish | 22 | 4.8% |
| Dutch | 51 | 11.1% |
| English | 35 | 7.6% |
| French | 5 | 1.1% |
| German | 75 | 16.3% |
| Irish | 43 | 9.3% |
| Italian | 2 | 0.4% |
| Mexican | 151 | 32.8% |
| Scotch-Irish | 10 | 2.2% |
| Scottish | 14 | 3.0% |
| Spanish | 7 | 1.5% |
| Spanish American | 17 | 3.7% |
| Swedish | 7 | 1.5% |
| Swiss | 7 | 1.5% | View All 17 Rows |
Immigrants in North La Junta
The most numerous immigrant groups reported in North La Junta came from Central America (8 | 1.7%), Latin America (8 | 1.7%), and Mexico (8 | 1.7%), together accounting for 5.2% of all North La Junta residents.
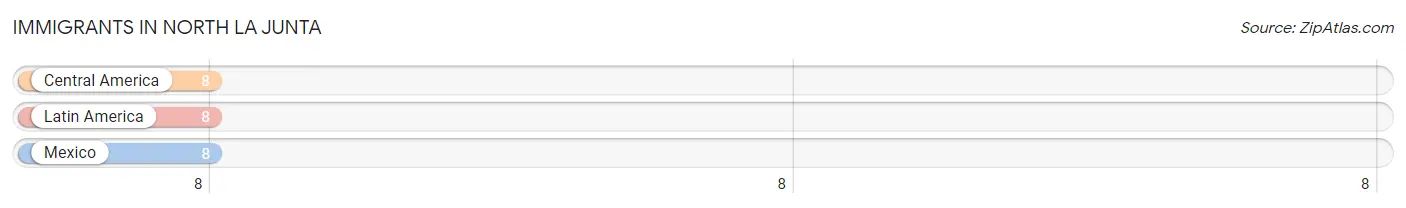
| Immigration Origin | # Population | % Population |
| Central America | 8 | 1.7% |
| Latin America | 8 | 1.7% |
| Mexico | 8 | 1.7% | View All 3 Rows |
Sex and Age in North La Junta
Sex and Age in North La Junta
The most populous age groups in North La Junta are 40 to 44 Years (31 | 17.2%) for men and 40 to 44 Years (61 | 21.7%) for women.
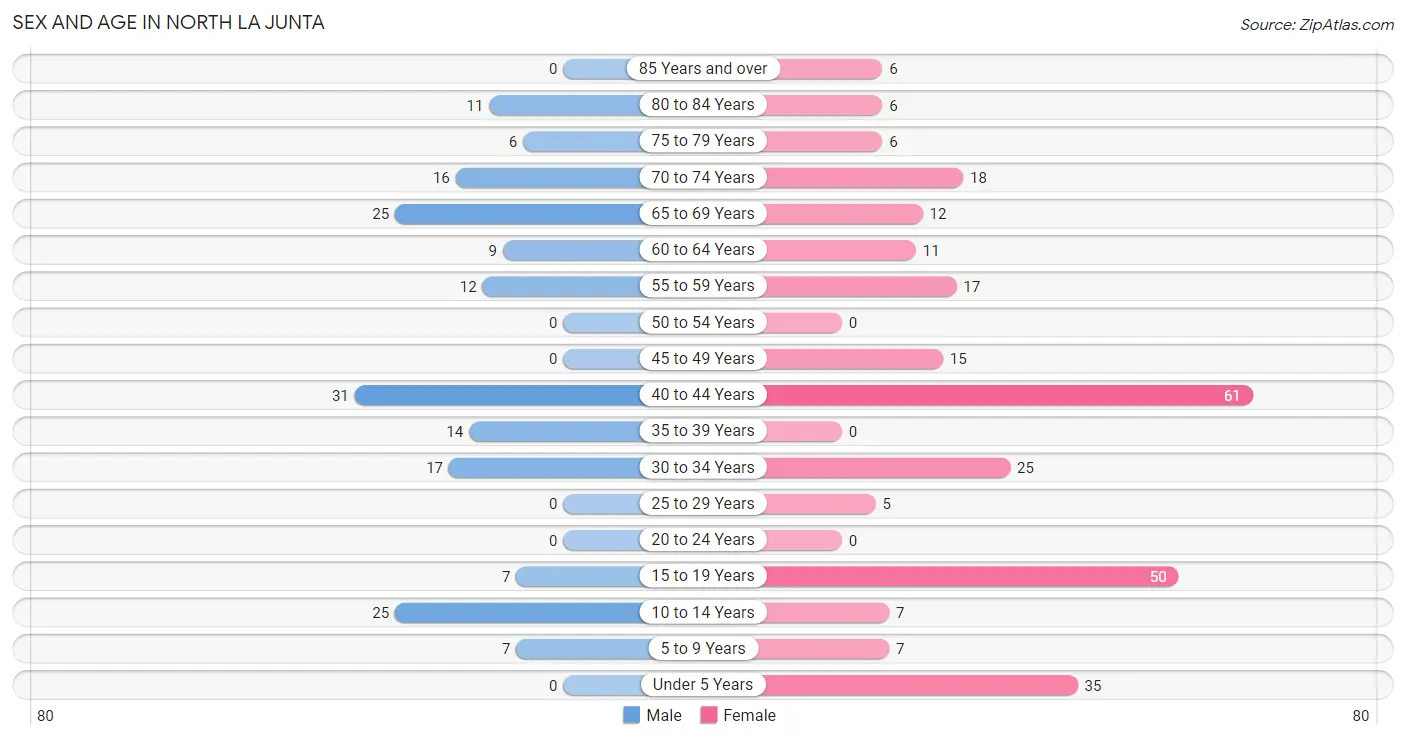
| Age Bracket | Male | Female |
| Under 5 Years | 0 (0.0%) | 35 (12.5%) |
| 5 to 9 Years | 7 (3.9%) | 7 (2.5%) |
| 10 to 14 Years | 25 (13.9%) | 7 (2.5%) |
| 15 to 19 Years | 7 (3.9%) | 50 (17.8%) |
| 20 to 24 Years | 0 (0.0%) | 0 (0.0%) |
| 25 to 29 Years | 0 (0.0%) | 5 (1.8%) |
| 30 to 34 Years | 17 (9.4%) | 25 (8.9%) |
| 35 to 39 Years | 14 (7.8%) | 0 (0.0%) |
| 40 to 44 Years | 31 (17.2%) | 61 (21.7%) |
| 45 to 49 Years | 0 (0.0%) | 15 (5.3%) |
| 50 to 54 Years | 0 (0.0%) | 0 (0.0%) |
| 55 to 59 Years | 12 (6.7%) | 17 (6.0%) |
| 60 to 64 Years | 9 (5.0%) | 11 (3.9%) |
| 65 to 69 Years | 25 (13.9%) | 12 (4.3%) |
| 70 to 74 Years | 16 (8.9%) | 18 (6.4%) |
| 75 to 79 Years | 6 (3.3%) | 6 (2.1%) |
| 80 to 84 Years | 11 (6.1%) | 6 (2.1%) |
| 85 Years and over | 0 (0.0%) | 6 (2.1%) |
| Total | 180 (100.0%) | 281 (100.0%) |
Families and Households in North La Junta
Median Family Size in North La Junta
The median family size in North La Junta is 2.49 persons per family, with single female/mother families (38 | 24.4%) accounting for the largest median family size of 2.79 persons per family. On the other hand, single male/father families (6 | 3.8%) represent the smallest median family size with 2.33 persons per family.
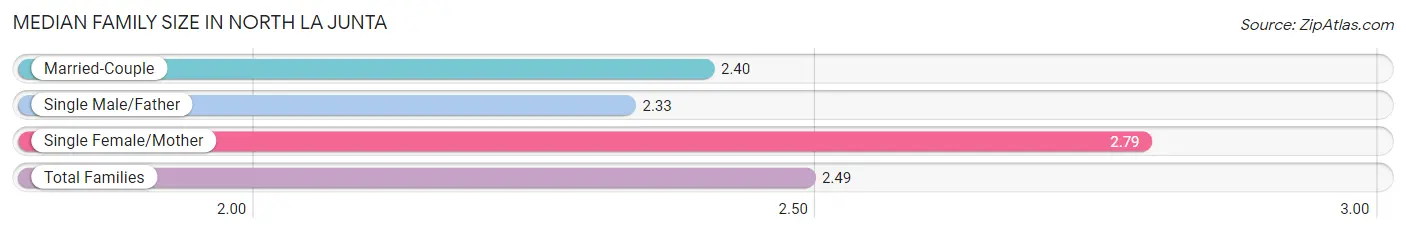
| Family Type | # Families | Family Size |
| Married-Couple | 112 (71.8%) | 2.40 |
| Single Male/Father | 6 (3.8%) | 2.33 |
| Single Female/Mother | 38 (24.4%) | 2.79 |
| Total Families | 156 (100.0%) | 2.49 |
Median Household Size in North La Junta
The median household size in North La Junta is 2.15 persons per household, with single female/mother households (38 | 17.8%) accounting for the largest median household size of 2.79 persons per household. non-family households (58 | 27.1%) represent the smallest median household size with 1.24 persons per household.
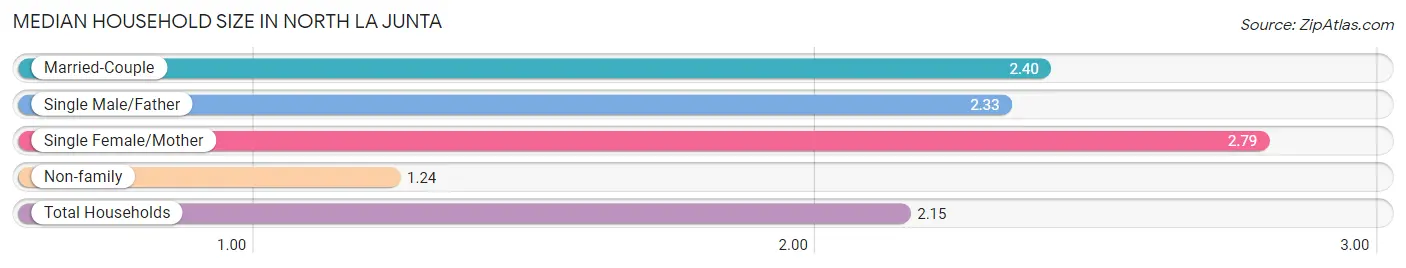
| Household Type | # Households | Household Size |
| Married-Couple | 112 (52.3%) | 2.40 |
| Single Male/Father | 6 (2.8%) | 2.33 |
| Single Female/Mother | 38 (17.8%) | 2.79 |
| Non-family | 58 (27.1%) | 1.24 |
| Total Households | 214 (100.0%) | 2.15 |
Household Size by Marriage Status in North La Junta
Out of a total of 214 households in North La Junta, 156 (72.9%) are family households, while 58 (27.1%) are nonfamily households. The most numerous type of family households are 2-person households, comprising 71, and the most common type of nonfamily households are 1-person households, comprising 51.
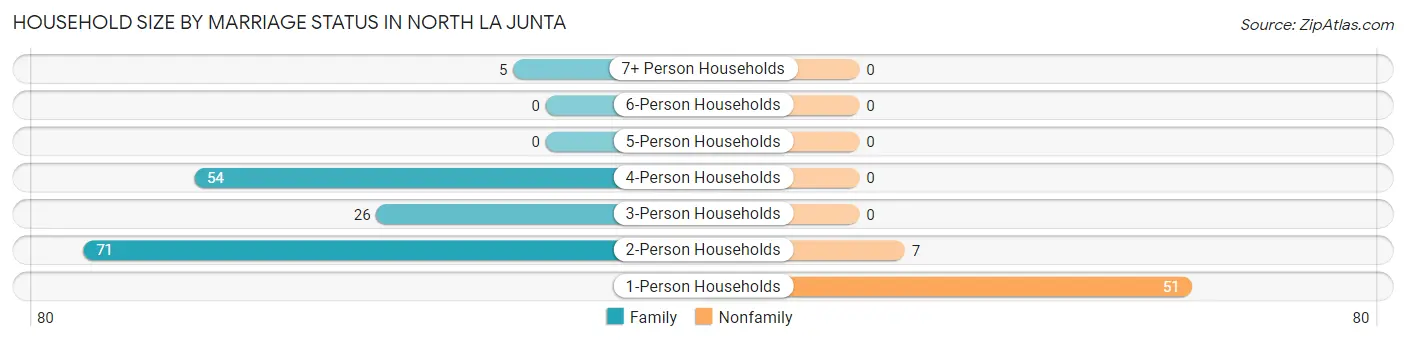
| Household Size | Family Households | Nonfamily Households |
| 1-Person Households | - | 51 (23.8%) |
| 2-Person Households | 71 (33.2%) | 7 (3.3%) |
| 3-Person Households | 26 (12.1%) | 0 (0.0%) |
| 4-Person Households | 54 (25.2%) | 0 (0.0%) |
| 5-Person Households | 0 (0.0%) | 0 (0.0%) |
| 6-Person Households | 0 (0.0%) | 0 (0.0%) |
| 7+ Person Households | 5 (2.3%) | 0 (0.0%) |
| Total | 156 (72.9%) | 58 (27.1%) |
Female Fertility in North La Junta
Fertility by Age in North La Junta
Average fertility rate in North La Junta is 32.0 births per 1,000 women. Women in the age bracket of 20 to 34 years have the highest fertility rate with 167.0 births per 1,000 women. Women in the age bracket of 20 to 34 years acount for 100.0% of all women with births.
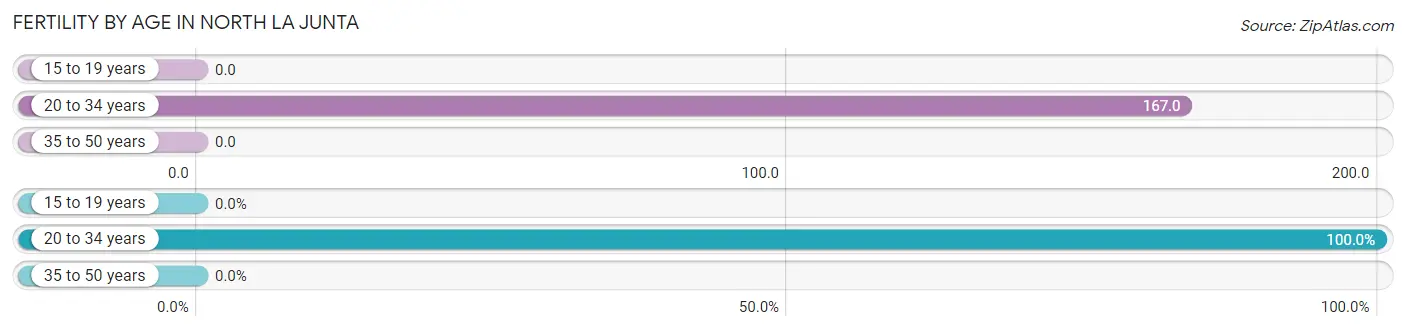
| Age Bracket | Women with Births | Births / 1,000 Women |
| 15 to 19 years | 0 (0.0%) | 0.0 |
| 20 to 34 years | 5 (100.0%) | 167.0 |
| 35 to 50 years | 0 (0.0%) | 0.0 |
| Total | 5 (100.0%) | 32.0 |
Fertility by Age by Marriage Status in North La Junta
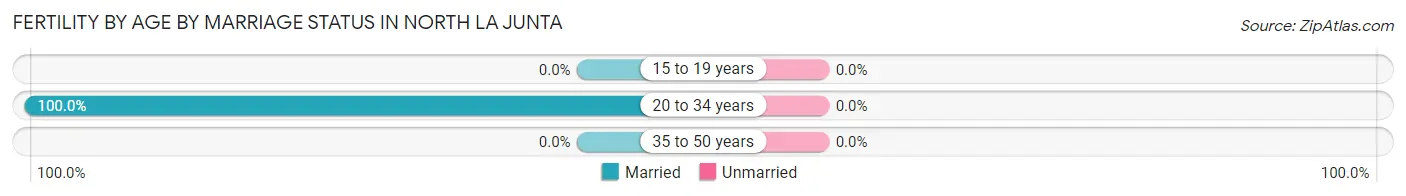
| Age Bracket | Married | Unmarried |
| 15 to 19 years | 0 (0.0%) | 0 (0.0%) |
| 20 to 34 years | 5 (100.0%) | 0 (0.0%) |
| 35 to 50 years | 0 (0.0%) | 0 (0.0%) |
| Total | 5 (100.0%) | 0 (0.0%) |
Fertility by Education in North La Junta
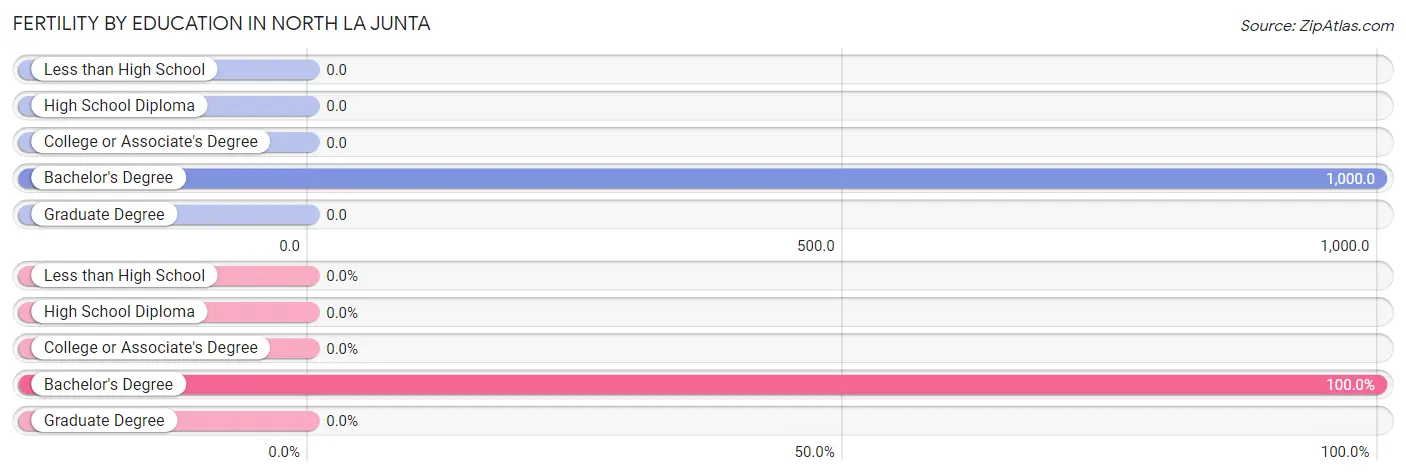
| Educational Attainment | Women with Births | Births / 1,000 Women |
| Less than High School | 0 (0.0%) | 0.0 |
| High School Diploma | 0 (0.0%) | 0.0 |
| College or Associate's Degree | 0 (0.0%) | 0.0 |
| Bachelor's Degree | 5 (100.0%) | 1,000.0 |
| Graduate Degree | 0 (0.0%) | 0.0 |
| Total | 5 (100.0%) | 32.0 |
Fertility by Education by Marriage Status in North La Junta
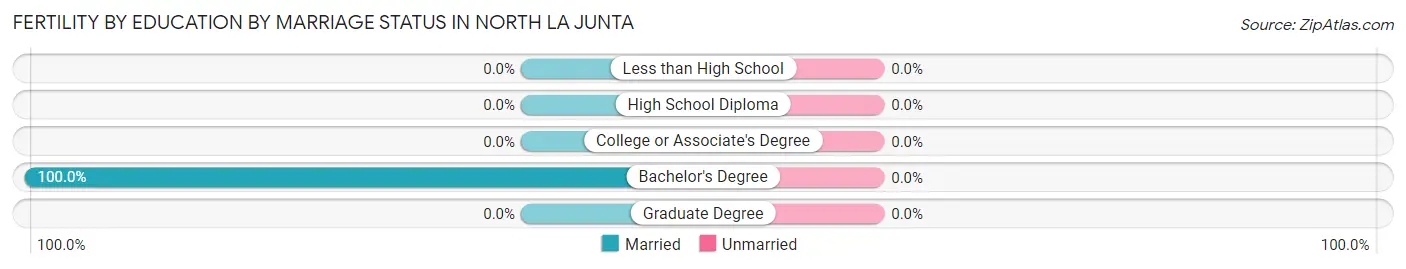
| Educational Attainment | Married | Unmarried |
| Less than High School | 0 (0.0%) | 0 (0.0%) |
| High School Diploma | 0 (0.0%) | 0 (0.0%) |
| College or Associate's Degree | 0 (0.0%) | 0 (0.0%) |
| Bachelor's Degree | 5 (100.0%) | 0 (0.0%) |
| Graduate Degree | 0 (0.0%) | 0 (0.0%) |
| Total | 5 (100.0%) | 0 (0.0%) |
Employment Characteristics in North La Junta
Employment by Class of Employer in North La Junta
Among the 254 employed individuals in North La Junta, private company employees (112 | 44.1%), federal government employees (54 | 21.3%), and local government employees (32 | 12.6%) make up the most common classes of employment.
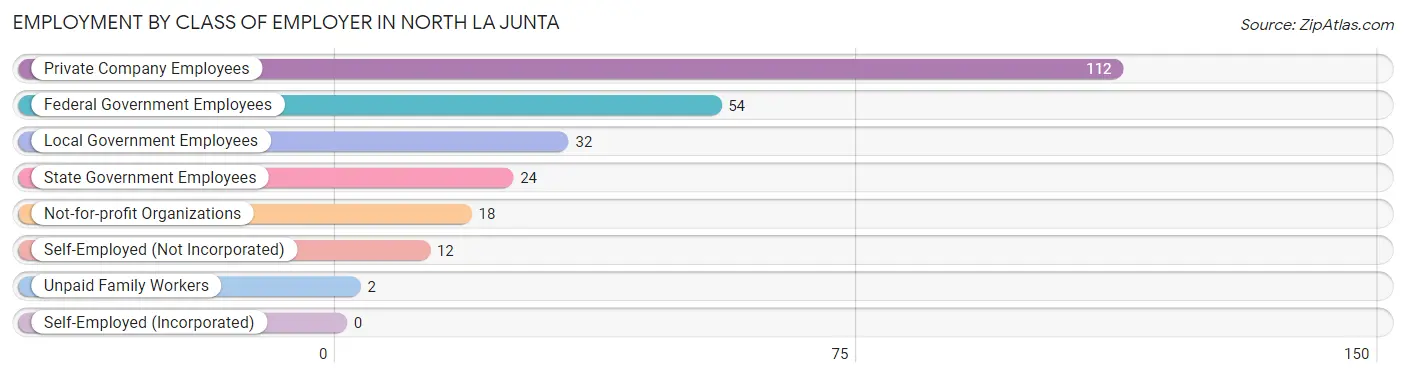
| Employer Class | # Employees | % Employees |
| Private Company Employees | 112 | 44.1% |
| Self-Employed (Incorporated) | 0 | 0.0% |
| Self-Employed (Not Incorporated) | 12 | 4.7% |
| Not-for-profit Organizations | 18 | 7.1% |
| Local Government Employees | 32 | 12.6% |
| State Government Employees | 24 | 9.5% |
| Federal Government Employees | 54 | 21.3% |
| Unpaid Family Workers | 2 | 0.8% |
| Total | 254 | 100.0% |
Employment Status by Age in North La Junta
According to the labor force statistics for North La Junta, out of the total population over 16 years of age (380), 68.7% or 261 individuals are in the labor force, with 2.7% or 7 of them unemployed. The age group with the highest labor force participation rate is 25 to 29 years, with 100.0% or 5 individuals in the labor force. Within the labor force, the 65 to 74 years age range has the highest percentage of unemployed individuals, with 30.4% or 7 of them being unemployed.
| Age Bracket | In Labor Force | Unemployed |
| 16 to 19 Years | 32 (56.1%) | 0 (0.0%) |
| 20 to 24 Years | 0 (0.0%) | 0 (0.0%) |
| 25 to 29 Years | 5 (100.0%) | 0 (0.0%) |
| 30 to 34 Years | 35 (83.3%) | 0 (0.0%) |
| 35 to 44 Years | 106 (100.0%) | 0 (0.0%) |
| 45 to 54 Years | 15 (100.0%) | 0 (0.0%) |
| 55 to 59 Years | 29 (100.0%) | 0 (0.0%) |
| 60 to 64 Years | 14 (70.0%) | 0 (0.0%) |
| 65 to 74 Years | 23 (32.4%) | 7 (30.4%) |
| 75 Years and over | 2 (5.7%) | 0 (0.0%) |
| Total | 261 (68.7%) | 7 (2.7%) |
Employment Status by Educational Attainment in North La Junta
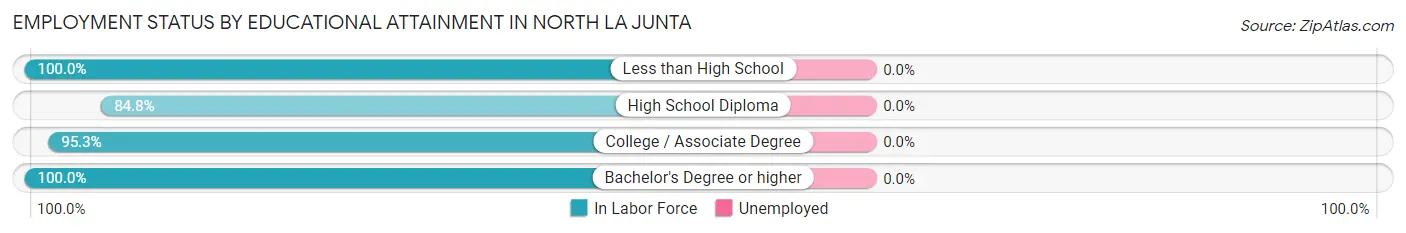
| Educational Attainment | In Labor Force | Unemployed |
| Less than High School | 7 (100.0%) | 0 (0.0%) |
| High School Diploma | 28 (84.8%) | 0 (0.0%) |
| College / Associate Degree | 164 (95.3%) | 0 (0.0%) |
| Bachelor's Degree or higher | 5 (100.0%) | 0 (0.0%) |
| Total | 204 (94.0%) | 0 (0.0%) |
Employment Occupations by Sex in North La Junta
Management, Business, Science and Arts Occupations
The most common Management, Business, Science and Arts occupations in North La Junta are Management (31 | 12.2%), Community & Social Service (13 | 5.1%), Education Instruction & Library (13 | 5.1%), and Health Diagnosing & Treating (7 | 2.8%).
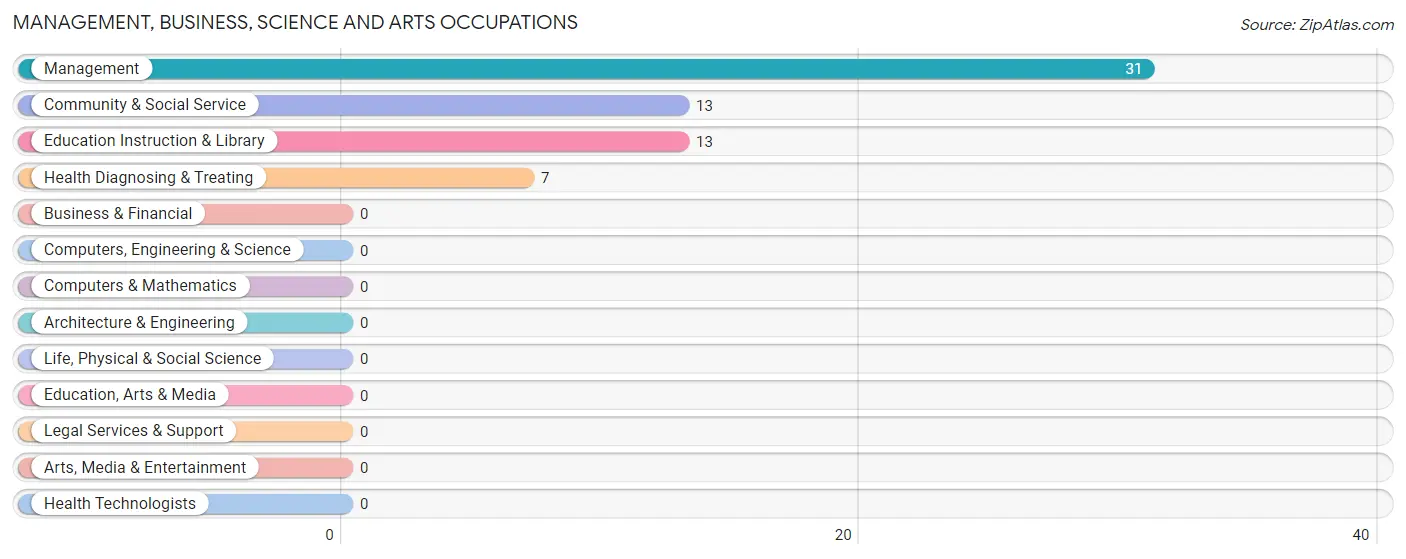
Management, Business, Science and Arts Occupations by Sex
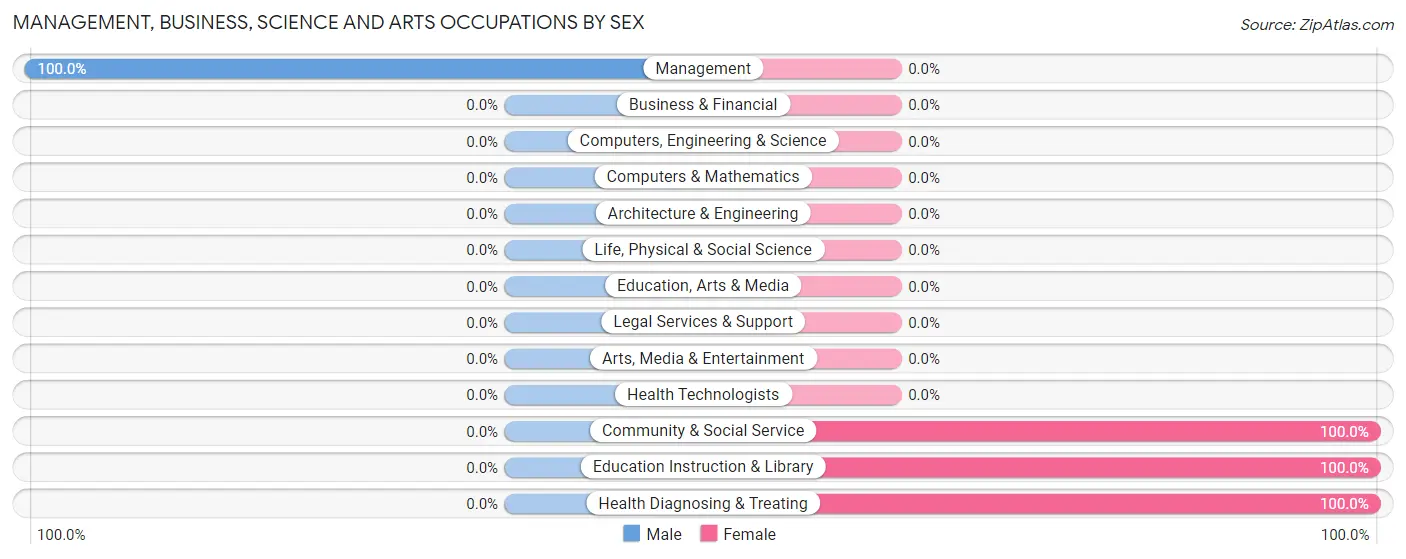
| Occupation | Male | Female |
| Management | 31 (100.0%) | 0 (0.0%) |
| Business & Financial | 0 (0.0%) | 0 (0.0%) |
| Computers, Engineering & Science | 0 (0.0%) | 0 (0.0%) |
| Computers & Mathematics | 0 (0.0%) | 0 (0.0%) |
| Architecture & Engineering | 0 (0.0%) | 0 (0.0%) |
| Life, Physical & Social Science | 0 (0.0%) | 0 (0.0%) |
| Community & Social Service | 0 (0.0%) | 13 (100.0%) |
| Education, Arts & Media | 0 (0.0%) | 0 (0.0%) |
| Legal Services & Support | 0 (0.0%) | 0 (0.0%) |
| Education Instruction & Library | 0 (0.0%) | 13 (100.0%) |
| Arts, Media & Entertainment | 0 (0.0%) | 0 (0.0%) |
| Health Diagnosing & Treating | 0 (0.0%) | 7 (100.0%) |
| Health Technologists | 0 (0.0%) | 0 (0.0%) |
| Total (Category) | 31 (60.8%) | 20 (39.2%) |
| Total (Overall) | 98 (38.6%) | 156 (61.4%) |
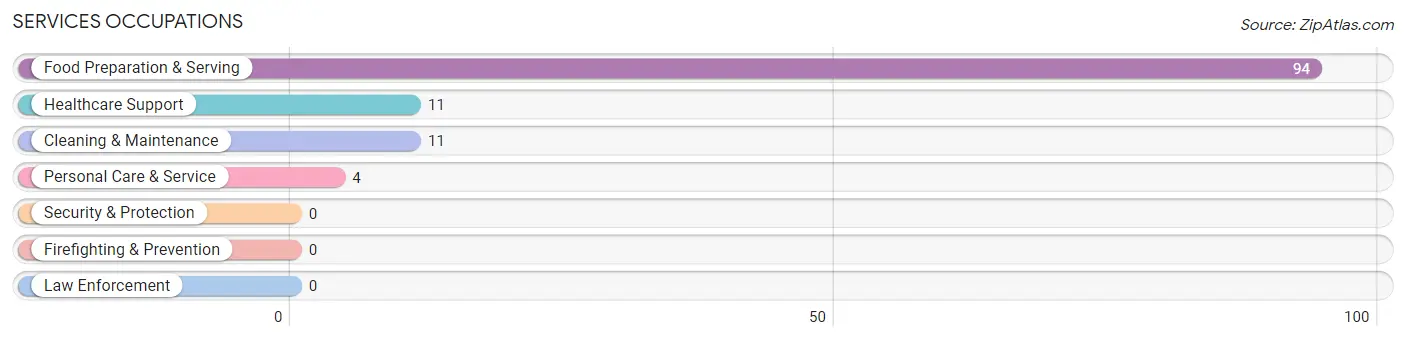
Services Occupations
The most common Services occupations in North La Junta are Food Preparation & Serving (94 | 37.0%), Healthcare Support (11 | 4.3%), Cleaning & Maintenance (11 | 4.3%), and Personal Care & Service (4 | 1.6%).
Services Occupations by Sex
Within the Services occupations in North La Junta, the most male-oriented occupations are Cleaning & Maintenance (100.0%), and Food Preparation & Serving (8.5%), while the most female-oriented occupations are Healthcare Support (100.0%), Personal Care & Service (100.0%), and Food Preparation & Serving (91.5%).
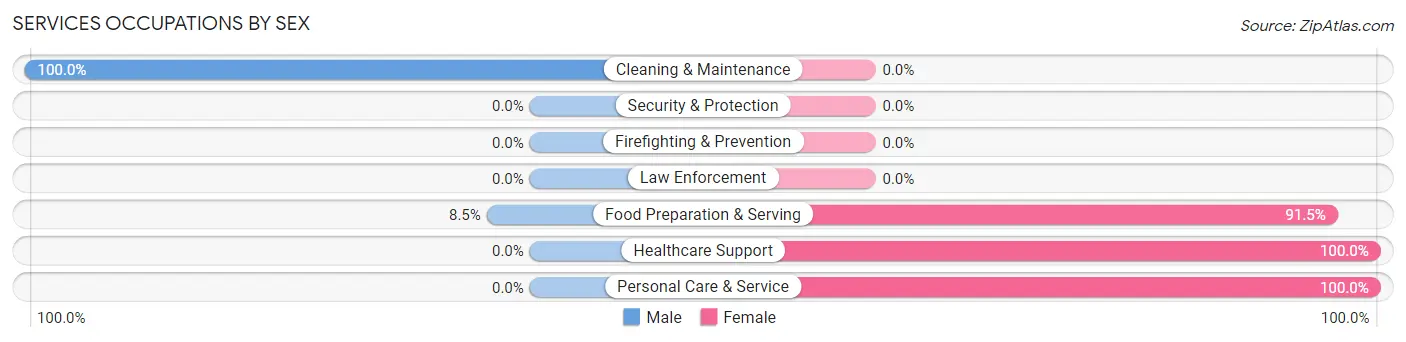
| Occupation | Male | Female |
| Healthcare Support | 0 (0.0%) | 11 (100.0%) |
| Security & Protection | 0 (0.0%) | 0 (0.0%) |
| Firefighting & Prevention | 0 (0.0%) | 0 (0.0%) |
| Law Enforcement | 0 (0.0%) | 0 (0.0%) |
| Food Preparation & Serving | 8 (8.5%) | 86 (91.5%) |
| Cleaning & Maintenance | 11 (100.0%) | 0 (0.0%) |
| Personal Care & Service | 0 (0.0%) | 4 (100.0%) |
| Total (Category) | 19 (15.8%) | 101 (84.2%) |
| Total (Overall) | 98 (38.6%) | 156 (61.4%) |
Sales and Office Occupations
The most common Sales and Office occupations in North La Junta are Office & Administration (18 | 7.1%), and Sales & Related (2 | 0.8%).
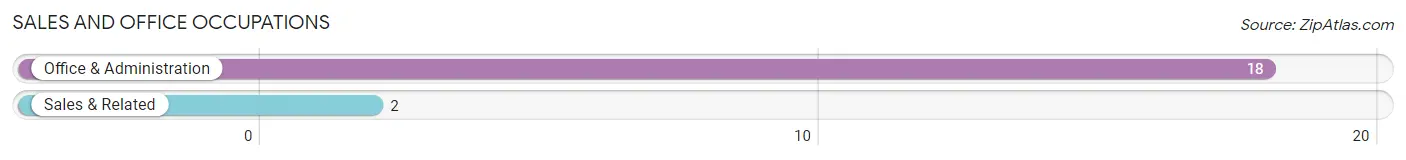
Sales and Office Occupations by Sex
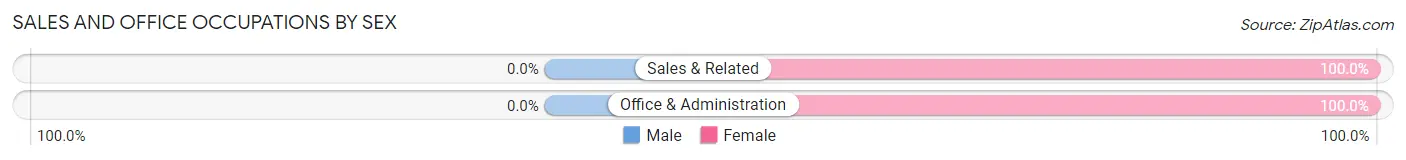
| Occupation | Male | Female |
| Sales & Related | 0 (0.0%) | 2 (100.0%) |
| Office & Administration | 0 (0.0%) | 18 (100.0%) |
| Total (Category) | 0 (0.0%) | 20 (100.0%) |
| Total (Overall) | 98 (38.6%) | 156 (61.4%) |
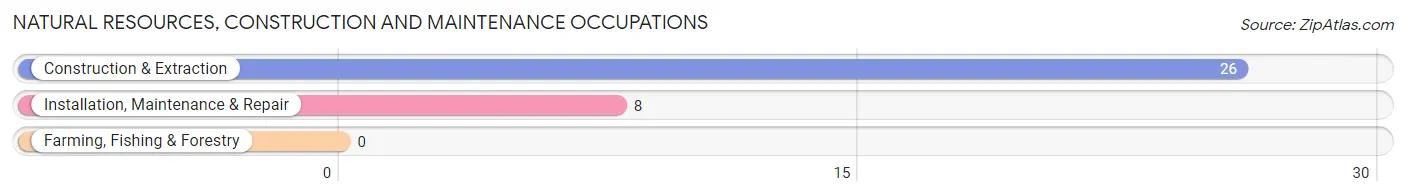
Natural Resources, Construction and Maintenance Occupations
The most common Natural Resources, Construction and Maintenance occupations in North La Junta are Construction & Extraction (26 | 10.2%), and Installation, Maintenance & Repair (8 | 3.2%).
Natural Resources, Construction and Maintenance Occupations by Sex
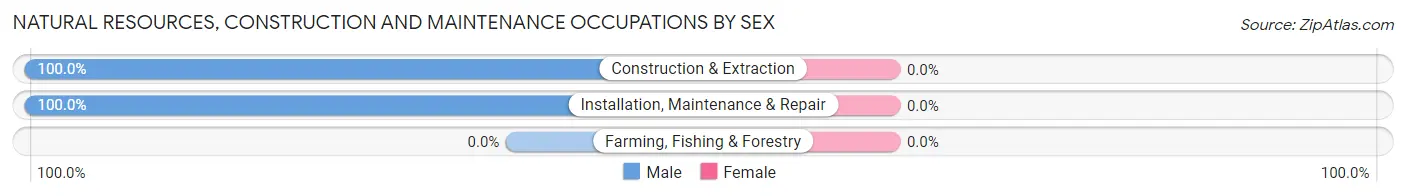
| Occupation | Male | Female |
| Farming, Fishing & Forestry | 0 (0.0%) | 0 (0.0%) |
| Construction & Extraction | 26 (100.0%) | 0 (0.0%) |
| Installation, Maintenance & Repair | 8 (100.0%) | 0 (0.0%) |
| Total (Category) | 34 (100.0%) | 0 (0.0%) |
| Total (Overall) | 98 (38.6%) | 156 (61.4%) |
Production, Transportation and Moving Occupations
The most common Production, Transportation and Moving occupations in North La Junta are Production (21 | 8.3%), and Transportation (8 | 3.2%).
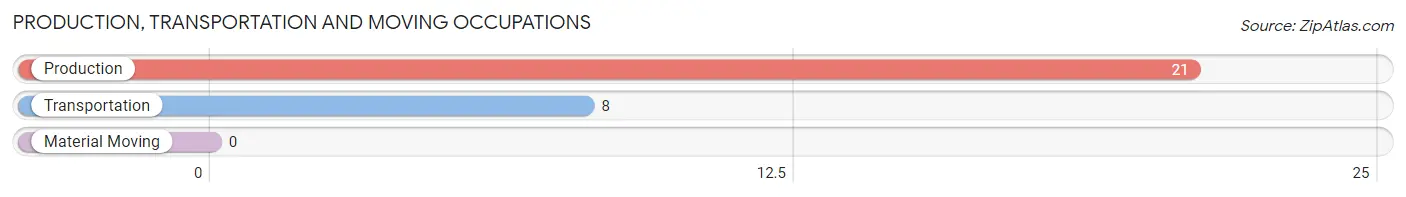
Production, Transportation and Moving Occupations by Sex
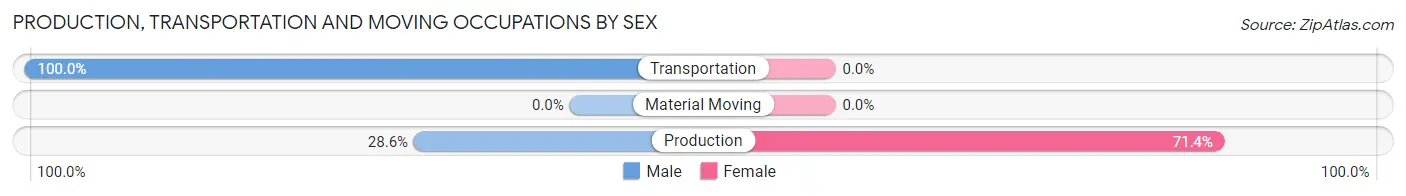
| Occupation | Male | Female |
| Production | 6 (28.6%) | 15 (71.4%) |
| Transportation | 8 (100.0%) | 0 (0.0%) |
| Material Moving | 0 (0.0%) | 0 (0.0%) |
| Total (Category) | 14 (48.3%) | 15 (51.7%) |
| Total (Overall) | 98 (38.6%) | 156 (61.4%) |
Employment Industries by Sex in North La Junta
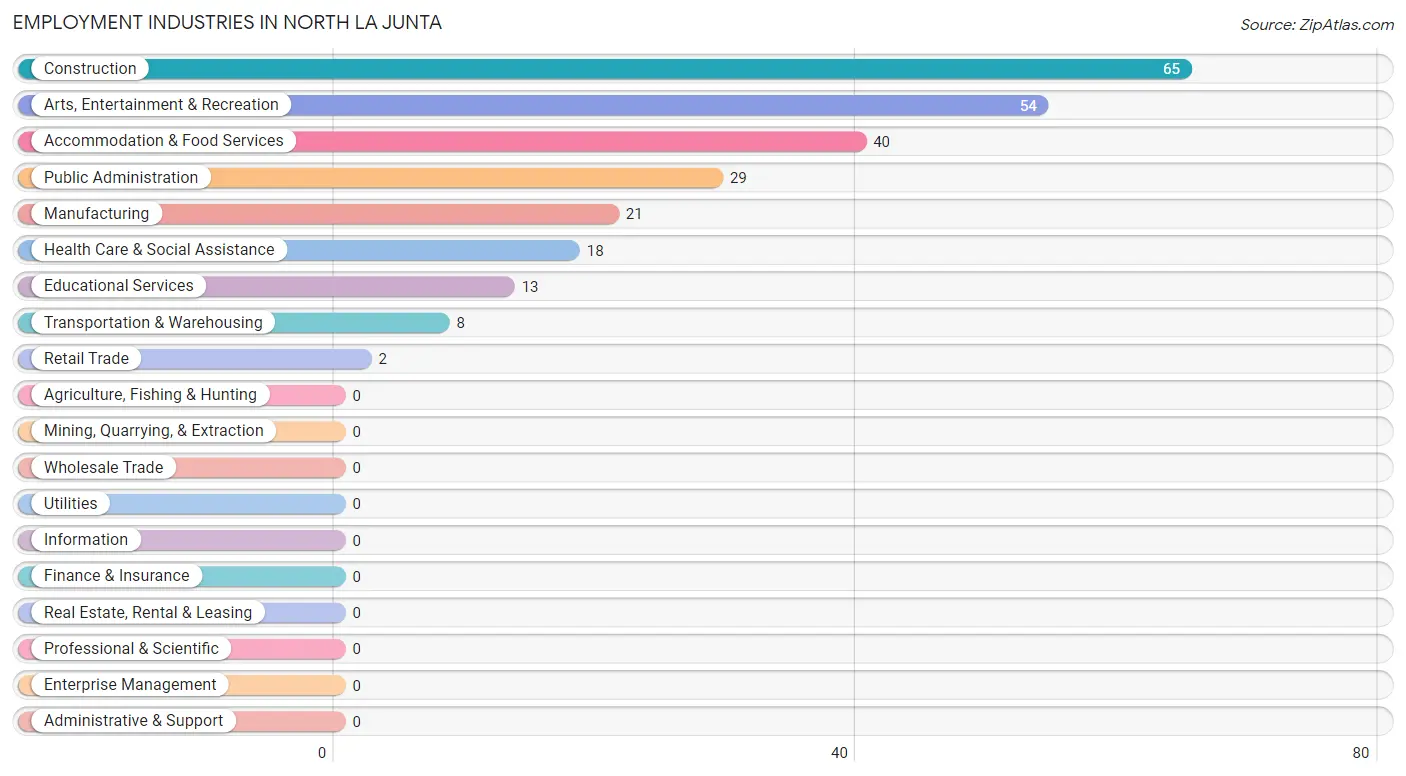
Employment Industries in North La Junta
The major employment industries in North La Junta include Construction (65 | 25.6%), Arts, Entertainment & Recreation (54 | 21.3%), Accommodation & Food Services (40 | 15.8%), Public Administration (29 | 11.4%), and Manufacturing (21 | 8.3%).
Employment Industries by Sex in North La Junta
The North La Junta industries that see more men than women are Construction (100.0%), Transportation & Warehousing (100.0%), and Public Administration (37.9%), whereas the industries that tend to have a higher number of women are Retail Trade (100.0%), Educational Services (100.0%), and Health Care & Social Assistance (100.0%).
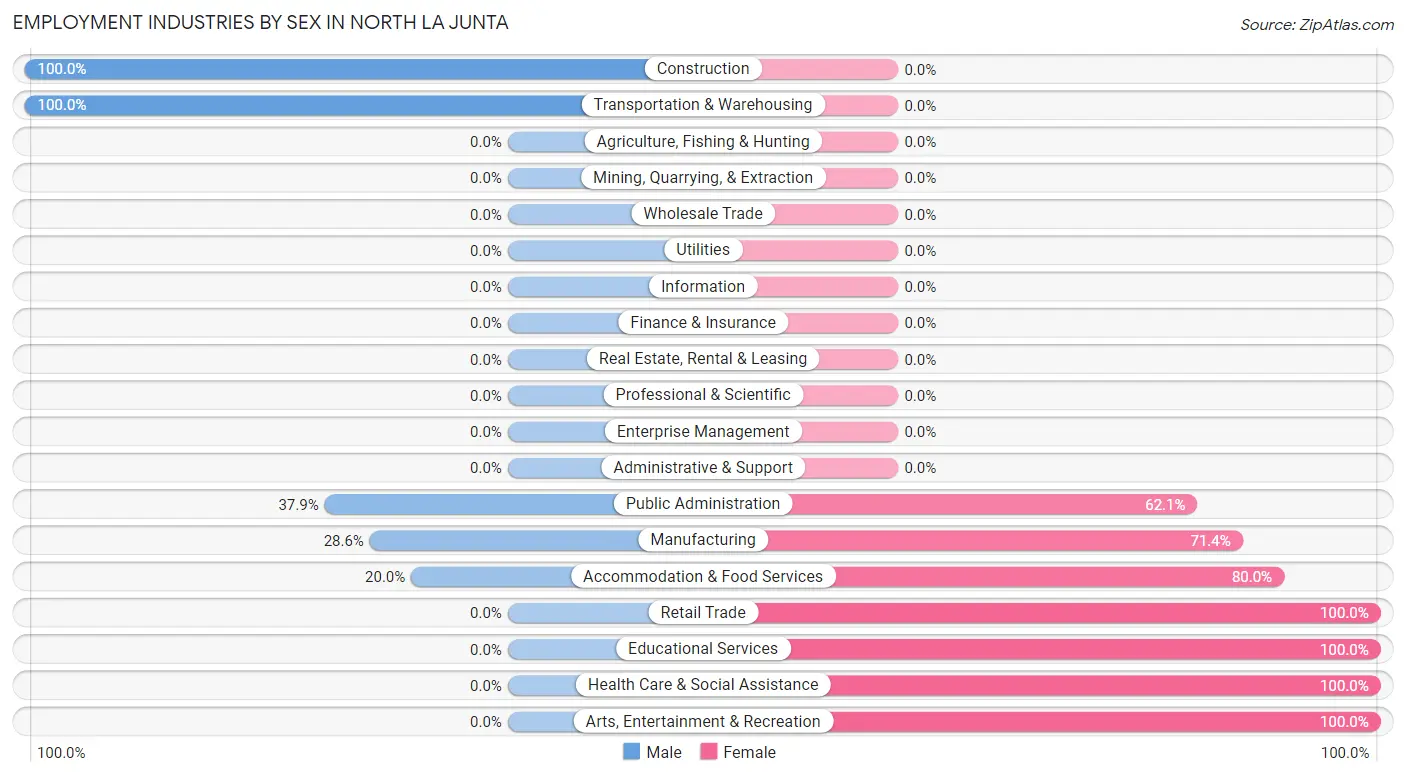
| Industry | Male | Female |
| Agriculture, Fishing & Hunting | 0 (0.0%) | 0 (0.0%) |
| Mining, Quarrying, & Extraction | 0 (0.0%) | 0 (0.0%) |
| Construction | 65 (100.0%) | 0 (0.0%) |
| Manufacturing | 6 (28.6%) | 15 (71.4%) |
| Wholesale Trade | 0 (0.0%) | 0 (0.0%) |
| Retail Trade | 0 (0.0%) | 2 (100.0%) |
| Transportation & Warehousing | 8 (100.0%) | 0 (0.0%) |
| Utilities | 0 (0.0%) | 0 (0.0%) |
| Information | 0 (0.0%) | 0 (0.0%) |
| Finance & Insurance | 0 (0.0%) | 0 (0.0%) |
| Real Estate, Rental & Leasing | 0 (0.0%) | 0 (0.0%) |
| Professional & Scientific | 0 (0.0%) | 0 (0.0%) |
| Enterprise Management | 0 (0.0%) | 0 (0.0%) |
| Administrative & Support | 0 (0.0%) | 0 (0.0%) |
| Educational Services | 0 (0.0%) | 13 (100.0%) |
| Health Care & Social Assistance | 0 (0.0%) | 18 (100.0%) |
| Arts, Entertainment & Recreation | 0 (0.0%) | 54 (100.0%) |
| Accommodation & Food Services | 8 (20.0%) | 32 (80.0%) |
| Public Administration | 11 (37.9%) | 18 (62.1%) |
| Total | 98 (38.6%) | 156 (61.4%) |
Education in North La Junta
School Enrollment in North La Junta
The most common levels of schooling among the 140 students in North La Junta are high school (54 | 38.6%), nursery / preschool (21 | 15.0%), and middle school (21 | 15.0%).
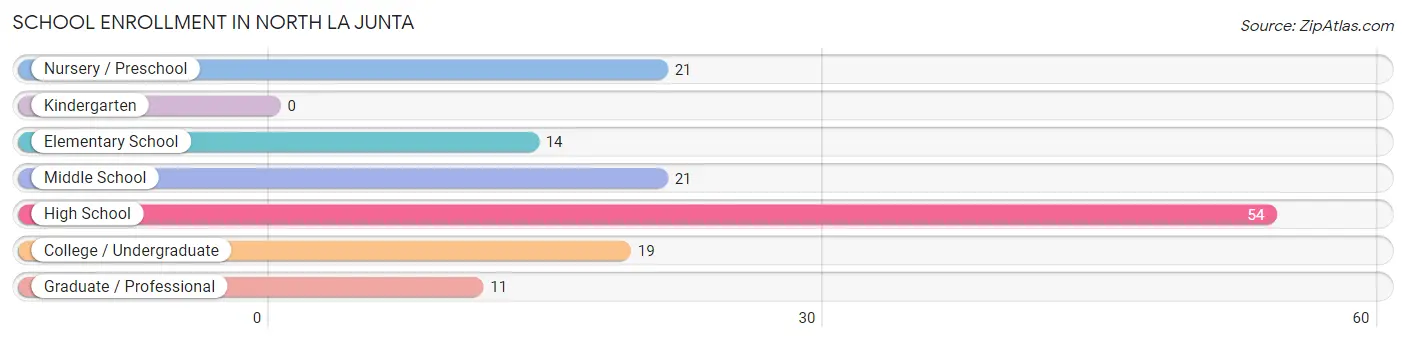
| School Level | # Students | % Students |
| Nursery / Preschool | 21 | 15.0% |
| Kindergarten | 0 | 0.0% |
| Elementary School | 14 | 10.0% |
| Middle School | 21 | 15.0% |
| High School | 54 | 38.6% |
| College / Undergraduate | 19 | 13.6% |
| Graduate / Professional | 11 | 7.9% |
| Total | 140 | 100.0% |
School Enrollment by Age by Funding Source in North La Junta
Out of a total of 140 students who are enrolled in schools in North La Junta, 7 (5.0%) attend a private institution, while the remaining 133 (95.0%) are enrolled in public schools. The age group of 18 to 19 year olds has the highest likelihood of being enrolled in private schools, with 7 (33.3% in the age bracket) enrolled. Conversely, the age group of 3 to 4 year olds has the lowest likelihood of being enrolled in a private school, with 21 (100.0% in the age bracket) attending a public institution.
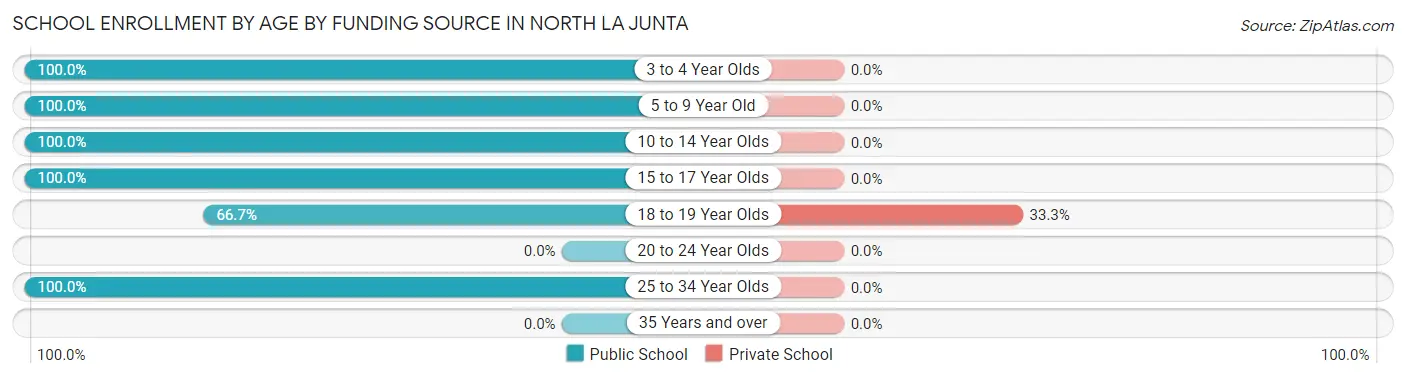
| Age Bracket | Public School | Private School |
| 3 to 4 Year Olds | 21 (100.0%) | 0 (0.0%) |
| 5 to 9 Year Old | 14 (100.0%) | 0 (0.0%) |
| 10 to 14 Year Olds | 32 (100.0%) | 0 (0.0%) |
| 15 to 17 Year Olds | 36 (100.0%) | 0 (0.0%) |
| 18 to 19 Year Olds | 14 (66.7%) | 7 (33.3%) |
| 20 to 24 Year Olds | 0 (0.0%) | 0 (0.0%) |
| 25 to 34 Year Olds | 16 (100.0%) | 0 (0.0%) |
| 35 Years and over | 0 (0.0%) | 0 (0.0%) |
| Total | 133 (95.0%) | 7 (5.0%) |
Educational Attainment by Field of Study in North La Junta
Business (18 | 45.0%), engineering (8 | 20.0%), communications (8 | 20.0%), and social sciences (6 | 15.0%) are the most common fields of study among 40 individuals in North La Junta who have obtained a bachelor's degree or higher.
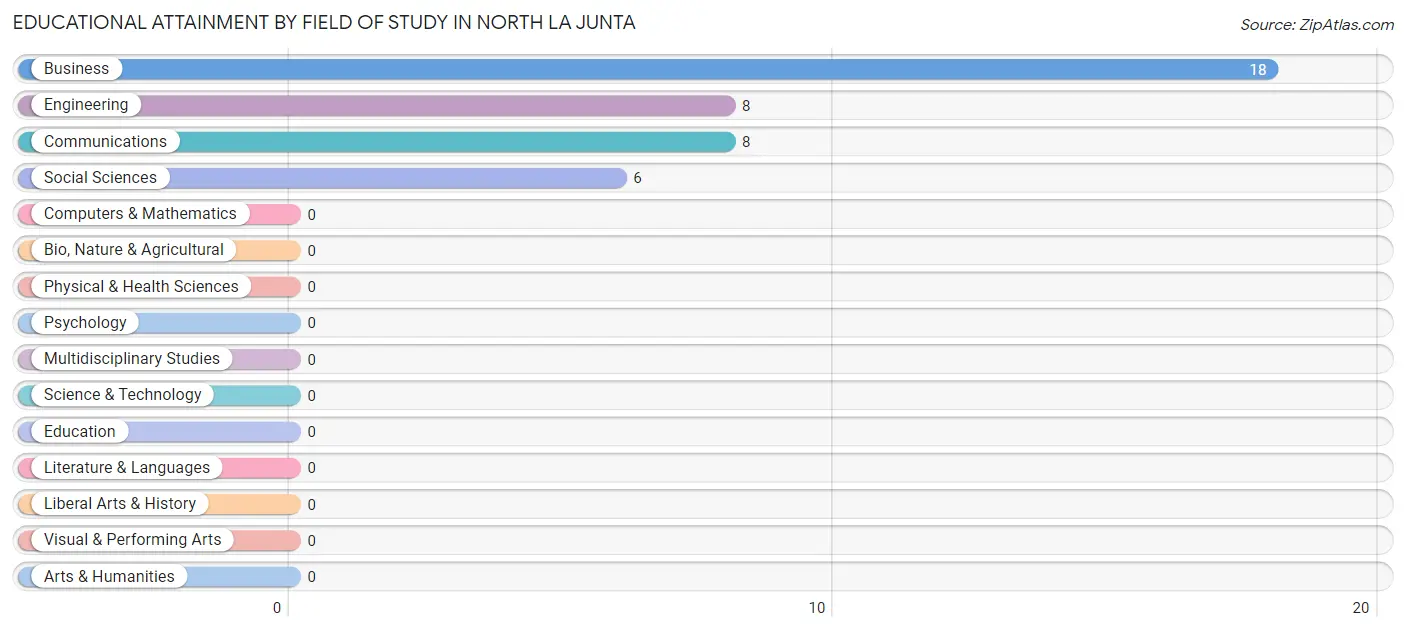
| Field of Study | # Graduates | % Graduates |
| Computers & Mathematics | 0 | 0.0% |
| Bio, Nature & Agricultural | 0 | 0.0% |
| Physical & Health Sciences | 0 | 0.0% |
| Psychology | 0 | 0.0% |
| Social Sciences | 6 | 15.0% |
| Engineering | 8 | 20.0% |
| Multidisciplinary Studies | 0 | 0.0% |
| Science & Technology | 0 | 0.0% |
| Business | 18 | 45.0% |
| Education | 0 | 0.0% |
| Literature & Languages | 0 | 0.0% |
| Liberal Arts & History | 0 | 0.0% |
| Visual & Performing Arts | 0 | 0.0% |
| Communications | 8 | 20.0% |
| Arts & Humanities | 0 | 0.0% |
| Total | 40 | 100.0% |
Transportation & Commute in North La Junta
Vehicle Availability by Sex in North La Junta
The most prevalent vehicle ownership categories in North La Junta are males with 3 vehicles (67, accounting for 68.4%) and females with 3 vehicles (68, making up 42.9%).
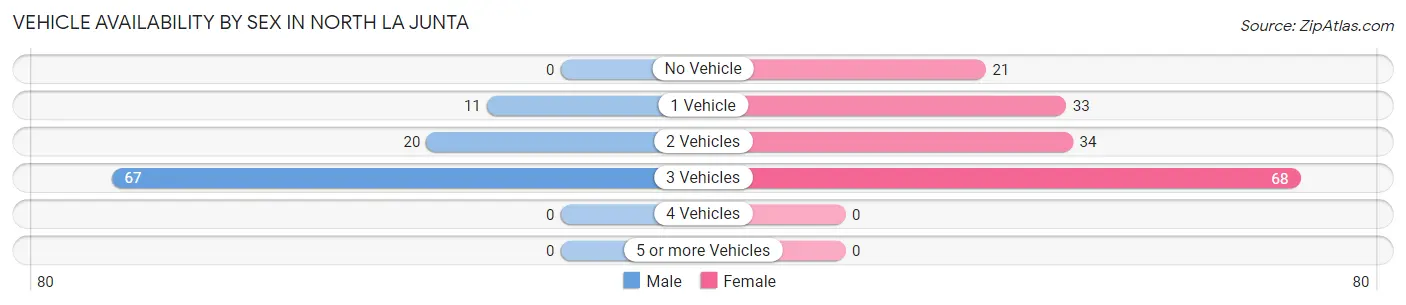
| Vehicles Available | Male | Female |
| No Vehicle | 0 (0.0%) | 21 (13.5%) |
| 1 Vehicle | 11 (11.2%) | 33 (21.1%) |
| 2 Vehicles | 20 (20.4%) | 34 (21.8%) |
| 3 Vehicles | 67 (68.4%) | 68 (43.6%) |
| 4 Vehicles | 0 (0.0%) | 0 (0.0%) |
| 5 or more Vehicles | 0 (0.0%) | 0 (0.0%) |
| Total | 98 (100.0%) | 156 (100.0%) |
Commute Time in North La Junta
The most frequently occuring commute durations in North La Junta are 5 to 9 minutes (127 commuters, 57.0%), 10 to 14 minutes (31 commuters, 13.9%), and 15 to 19 minutes (25 commuters, 11.2%).
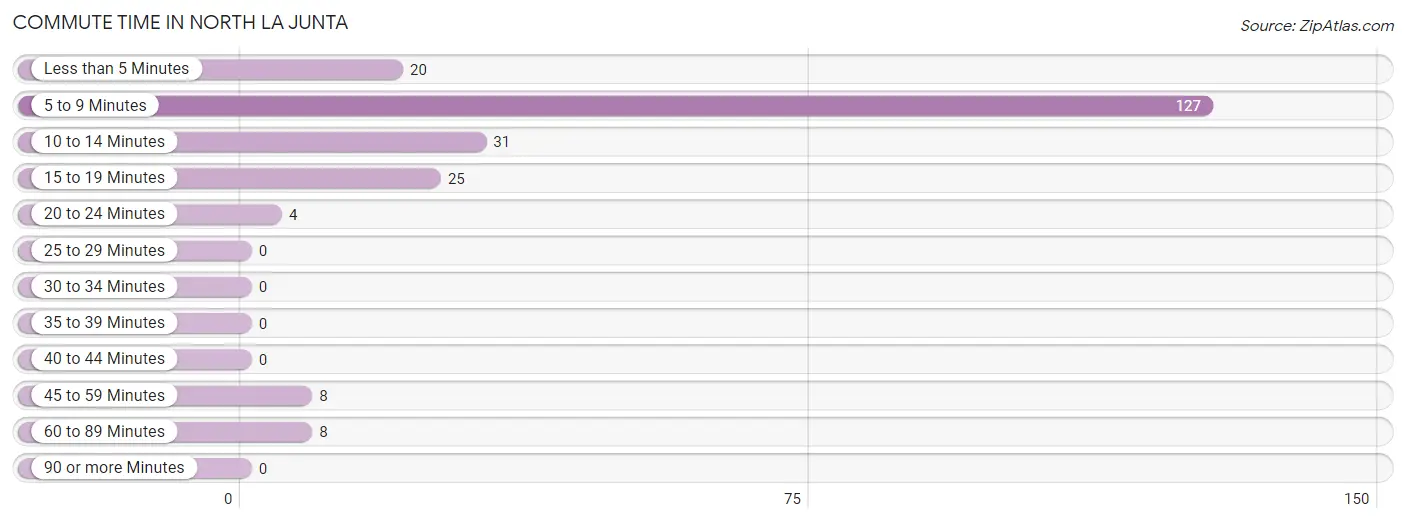
| Commute Time | # Commuters | % Commuters |
| Less than 5 Minutes | 20 | 9.0% |
| 5 to 9 Minutes | 127 | 57.0% |
| 10 to 14 Minutes | 31 | 13.9% |
| 15 to 19 Minutes | 25 | 11.2% |
| 20 to 24 Minutes | 4 | 1.8% |
| 25 to 29 Minutes | 0 | 0.0% |
| 30 to 34 Minutes | 0 | 0.0% |
| 35 to 39 Minutes | 0 | 0.0% |
| 40 to 44 Minutes | 0 | 0.0% |
| 45 to 59 Minutes | 8 | 3.6% |
| 60 to 89 Minutes | 8 | 3.6% |
| 90 or more Minutes | 0 | 0.0% |
Commute Time by Sex in North La Junta
The most common commute times in North La Junta are 5 to 9 minutes (33 commuters, 49.2%) for males and 5 to 9 minutes (94 commuters, 60.3%) for females.
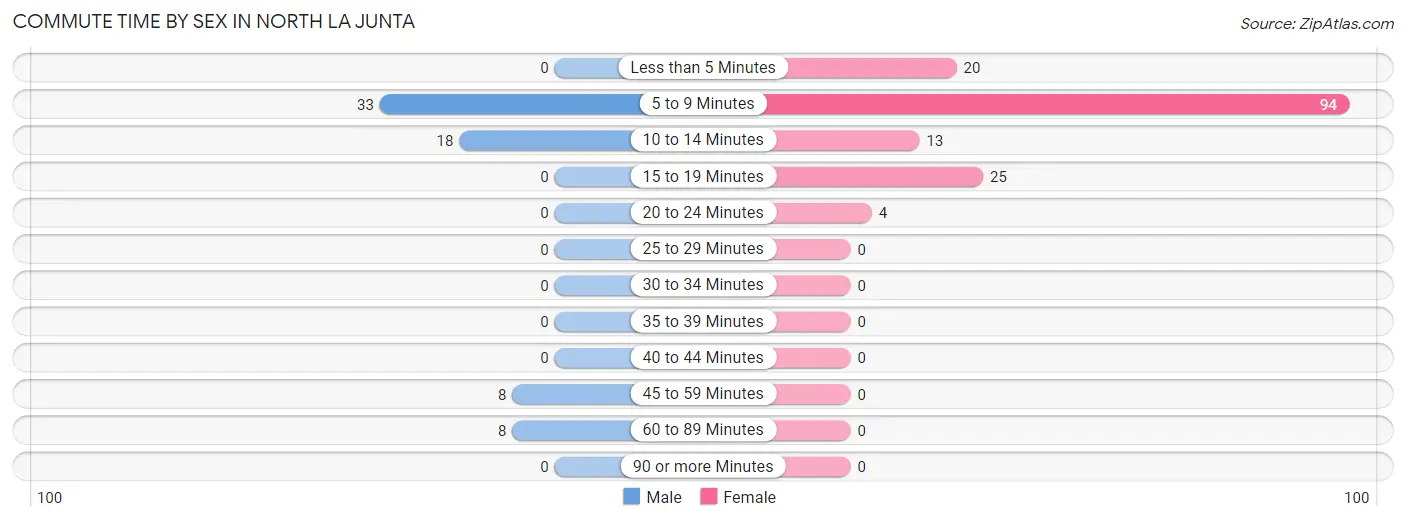
| Commute Time | Male | Female |
| Less than 5 Minutes | 0 (0.0%) | 20 (12.8%) |
| 5 to 9 Minutes | 33 (49.2%) | 94 (60.3%) |
| 10 to 14 Minutes | 18 (26.9%) | 13 (8.3%) |
| 15 to 19 Minutes | 0 (0.0%) | 25 (16.0%) |
| 20 to 24 Minutes | 0 (0.0%) | 4 (2.6%) |
| 25 to 29 Minutes | 0 (0.0%) | 0 (0.0%) |
| 30 to 34 Minutes | 0 (0.0%) | 0 (0.0%) |
| 35 to 39 Minutes | 0 (0.0%) | 0 (0.0%) |
| 40 to 44 Minutes | 0 (0.0%) | 0 (0.0%) |
| 45 to 59 Minutes | 8 (11.9%) | 0 (0.0%) |
| 60 to 89 Minutes | 8 (11.9%) | 0 (0.0%) |
| 90 or more Minutes | 0 (0.0%) | 0 (0.0%) |
Time of Departure to Work by Sex in North La Junta
The most frequent times of departure to work in North La Junta are 7:30 AM to 7:59 AM (20, 29.8%) for males and 9:00 AM to 9:59 AM (60, 38.5%) for females.
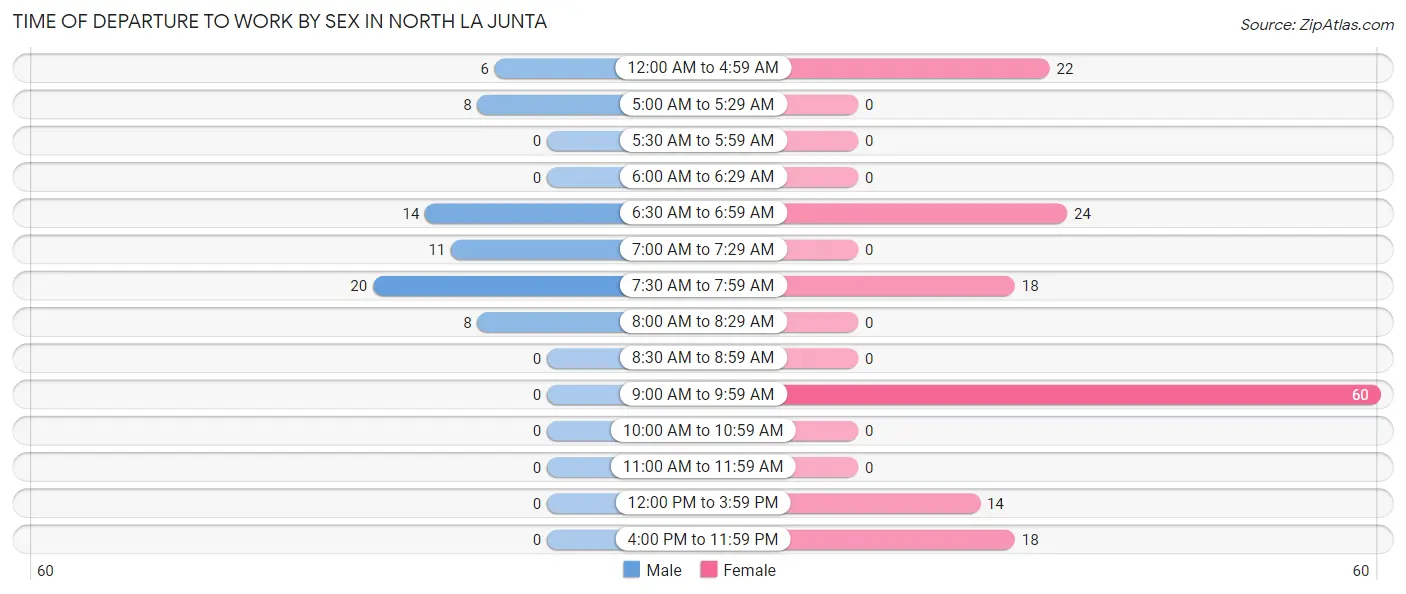
| Time of Departure | Male | Female |
| 12:00 AM to 4:59 AM | 6 (9.0%) | 22 (14.1%) |
| 5:00 AM to 5:29 AM | 8 (11.9%) | 0 (0.0%) |
| 5:30 AM to 5:59 AM | 0 (0.0%) | 0 (0.0%) |
| 6:00 AM to 6:29 AM | 0 (0.0%) | 0 (0.0%) |
| 6:30 AM to 6:59 AM | 14 (20.9%) | 24 (15.4%) |
| 7:00 AM to 7:29 AM | 11 (16.4%) | 0 (0.0%) |
| 7:30 AM to 7:59 AM | 20 (29.8%) | 18 (11.5%) |
| 8:00 AM to 8:29 AM | 8 (11.9%) | 0 (0.0%) |
| 8:30 AM to 8:59 AM | 0 (0.0%) | 0 (0.0%) |
| 9:00 AM to 9:59 AM | 0 (0.0%) | 60 (38.5%) |
| 10:00 AM to 10:59 AM | 0 (0.0%) | 0 (0.0%) |
| 11:00 AM to 11:59 AM | 0 (0.0%) | 0 (0.0%) |
| 12:00 PM to 3:59 PM | 0 (0.0%) | 14 (9.0%) |
| 4:00 PM to 11:59 PM | 0 (0.0%) | 18 (11.5%) |
| Total | 67 (100.0%) | 156 (100.0%) |
Housing Occupancy in North La Junta
Occupancy by Ownership in North La Junta
Of the total 214 dwellings in North La Junta, owner-occupied units account for 104 (48.6%), while renter-occupied units make up 110 (51.4%).
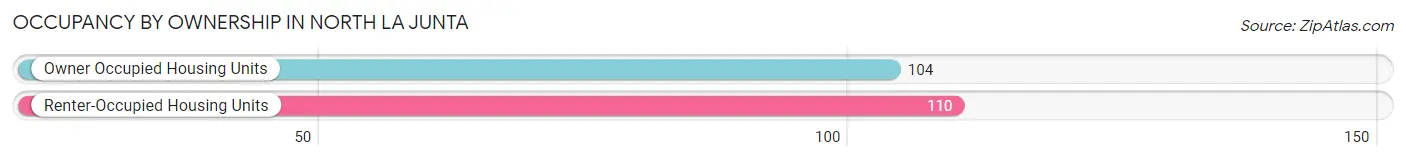
| Occupancy | # Housing Units | % Housing Units |
| Owner Occupied Housing Units | 104 | 48.6% |
| Renter-Occupied Housing Units | 110 | 51.4% |
| Total Occupied Housing Units | 214 | 100.0% |
Occupancy by Household Size in North La Junta
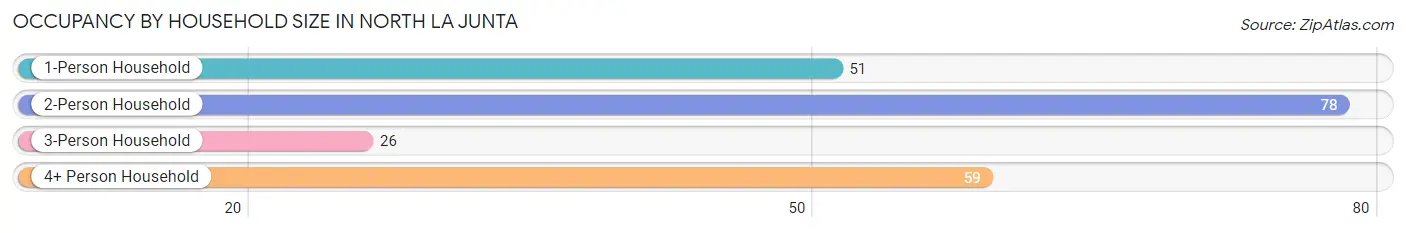
| Household Size | # Housing Units | % Housing Units |
| 1-Person Household | 51 | 23.8% |
| 2-Person Household | 78 | 36.4% |
| 3-Person Household | 26 | 12.1% |
| 4+ Person Household | 59 | 27.6% |
| Total Housing Units | 214 | 100.0% |
Occupancy by Ownership by Household Size in North La Junta
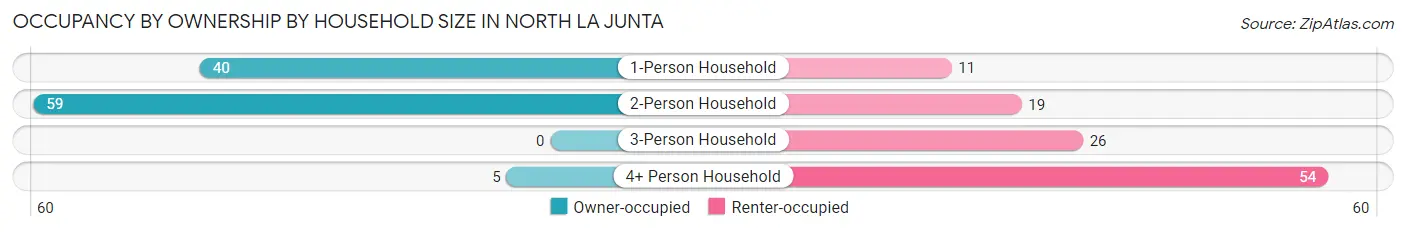
| Household Size | Owner-occupied | Renter-occupied |
| 1-Person Household | 40 (78.4%) | 11 (21.6%) |
| 2-Person Household | 59 (75.6%) | 19 (24.4%) |
| 3-Person Household | 0 (0.0%) | 26 (100.0%) |
| 4+ Person Household | 5 (8.5%) | 54 (91.5%) |
| Total Housing Units | 104 (48.6%) | 110 (51.4%) |
Occupancy by Educational Attainment in North La Junta
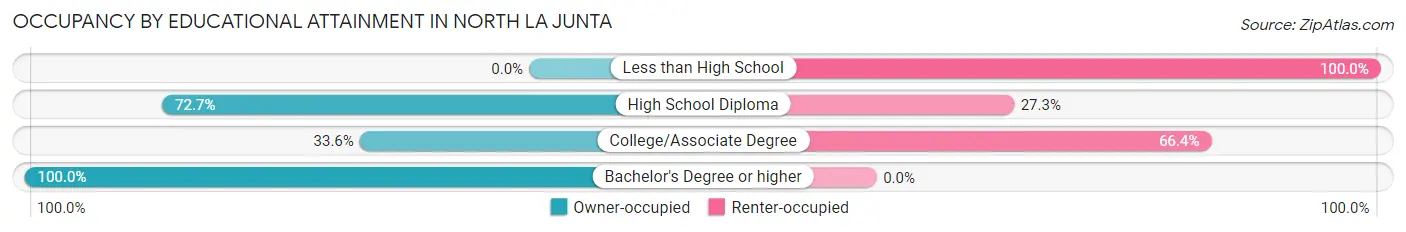
| Household Size | Owner-occupied | Renter-occupied |
| Less than High School | 0 (0.0%) | 7 (100.0%) |
| High School Diploma | 32 (72.7%) | 12 (27.3%) |
| College/Associate Degree | 46 (33.6%) | 91 (66.4%) |
| Bachelor's Degree or higher | 26 (100.0%) | 0 (0.0%) |
Occupancy by Age of Householder in North La Junta
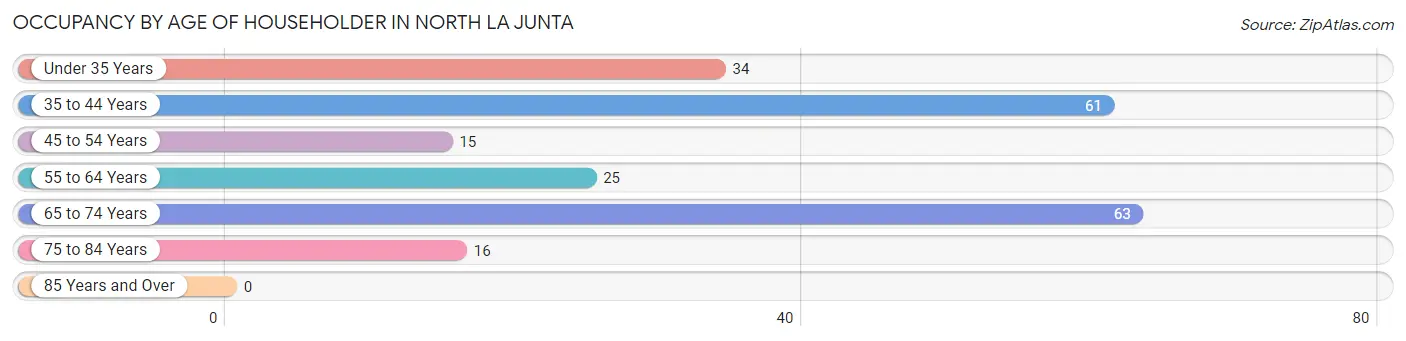
| Age Bracket | # Households | % Households |
| Under 35 Years | 34 | 15.9% |
| 35 to 44 Years | 61 | 28.5% |
| 45 to 54 Years | 15 | 7.0% |
| 55 to 64 Years | 25 | 11.7% |
| 65 to 74 Years | 63 | 29.4% |
| 75 to 84 Years | 16 | 7.5% |
| 85 Years and Over | 0 | 0.0% |
| Total | 214 | 100.0% |
Housing Finances in North La Junta
Median Income by Occupancy in North La Junta
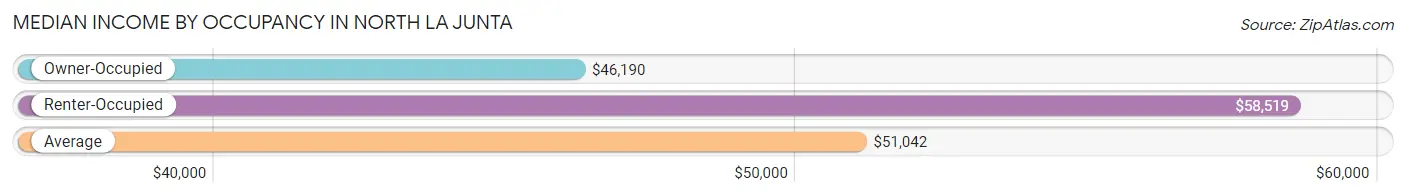
| Occupancy Type | # Households | Median Income |
| Owner-Occupied | 104 (48.6%) | $46,190 |
| Renter-Occupied | 110 (51.4%) | $58,519 |
| Average | 214 (100.0%) | $51,042 |
Occupancy by Householder Income Bracket in North La Junta
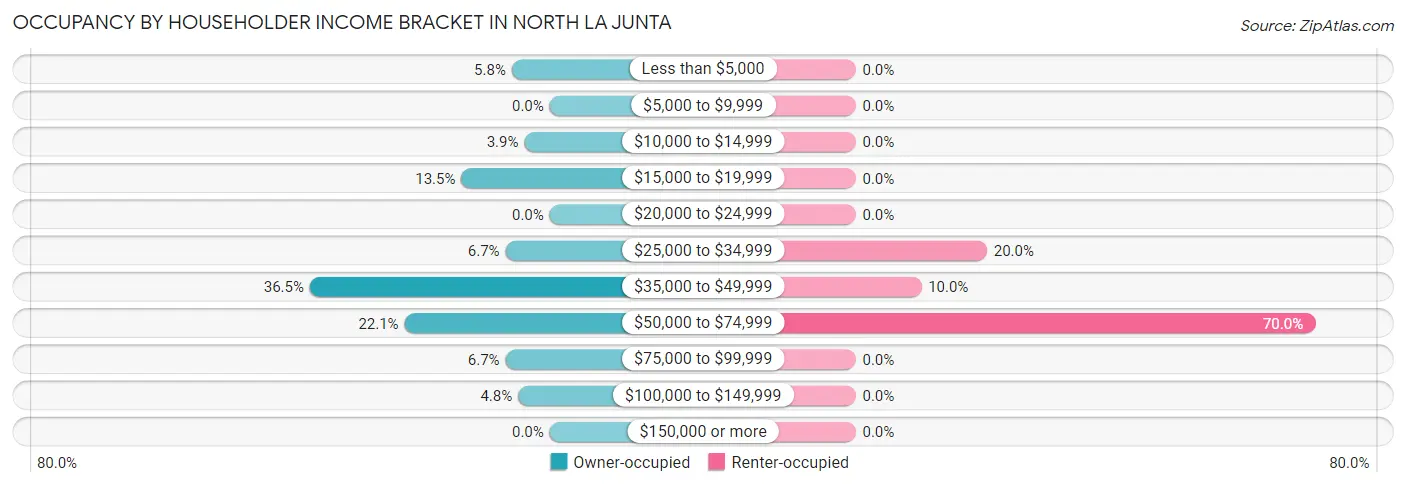
| Income Bracket | Owner-occupied | Renter-occupied |
| Less than $5,000 | 6 (5.8%) | 0 (0.0%) |
| $5,000 to $9,999 | 0 (0.0%) | 0 (0.0%) |
| $10,000 to $14,999 | 4 (3.8%) | 0 (0.0%) |
| $15,000 to $19,999 | 14 (13.5%) | 0 (0.0%) |
| $20,000 to $24,999 | 0 (0.0%) | 0 (0.0%) |
| $25,000 to $34,999 | 7 (6.7%) | 22 (20.0%) |
| $35,000 to $49,999 | 38 (36.5%) | 11 (10.0%) |
| $50,000 to $74,999 | 23 (22.1%) | 77 (70.0%) |
| $75,000 to $99,999 | 7 (6.7%) | 0 (0.0%) |
| $100,000 to $149,999 | 5 (4.8%) | 0 (0.0%) |
| $150,000 or more | 0 (0.0%) | 0 (0.0%) |
| Total | 104 (100.0%) | 110 (100.0%) |
Monthly Housing Cost Tiers in North La Junta
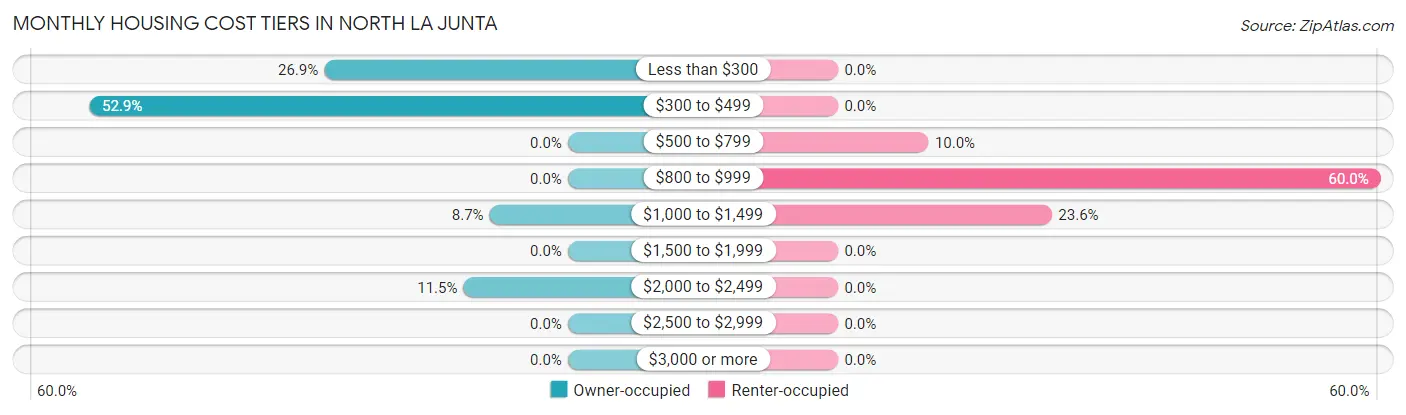
| Monthly Cost | Owner-occupied | Renter-occupied |
| Less than $300 | 28 (26.9%) | 0 (0.0%) |
| $300 to $499 | 55 (52.9%) | 0 (0.0%) |
| $500 to $799 | 0 (0.0%) | 11 (10.0%) |
| $800 to $999 | 0 (0.0%) | 66 (60.0%) |
| $1,000 to $1,499 | 9 (8.6%) | 26 (23.6%) |
| $1,500 to $1,999 | 0 (0.0%) | 0 (0.0%) |
| $2,000 to $2,499 | 12 (11.5%) | 0 (0.0%) |
| $2,500 to $2,999 | 0 (0.0%) | 0 (0.0%) |
| $3,000 or more | 0 (0.0%) | 0 (0.0%) |
| Total | 104 (100.0%) | 110 (100.0%) |
Physical Housing Characteristics in North La Junta
Housing Structures in North La Junta
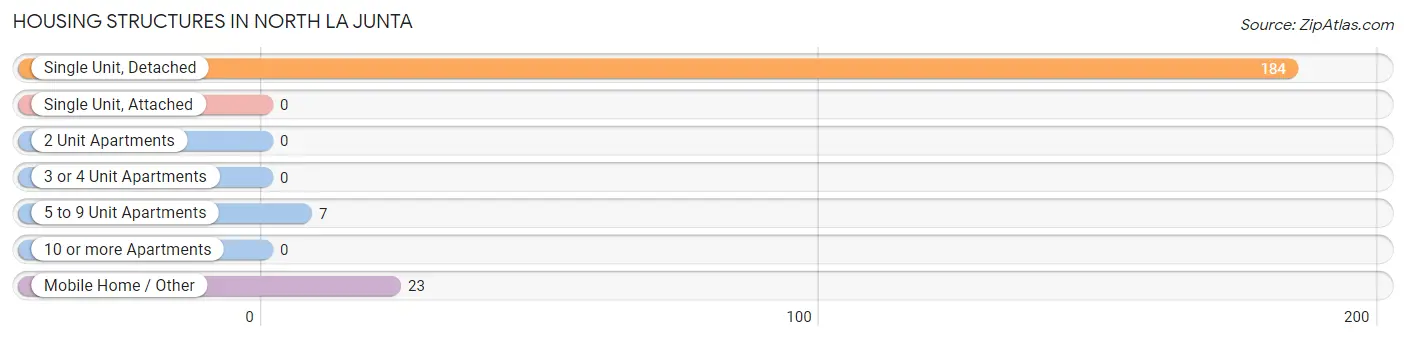
| Structure Type | # Housing Units | % Housing Units |
| Single Unit, Detached | 184 | 86.0% |
| Single Unit, Attached | 0 | 0.0% |
| 2 Unit Apartments | 0 | 0.0% |
| 3 or 4 Unit Apartments | 0 | 0.0% |
| 5 to 9 Unit Apartments | 7 | 3.3% |
| 10 or more Apartments | 0 | 0.0% |
| Mobile Home / Other | 23 | 10.7% |
| Total | 214 | 100.0% |
Housing Structures by Occupancy in North La Junta
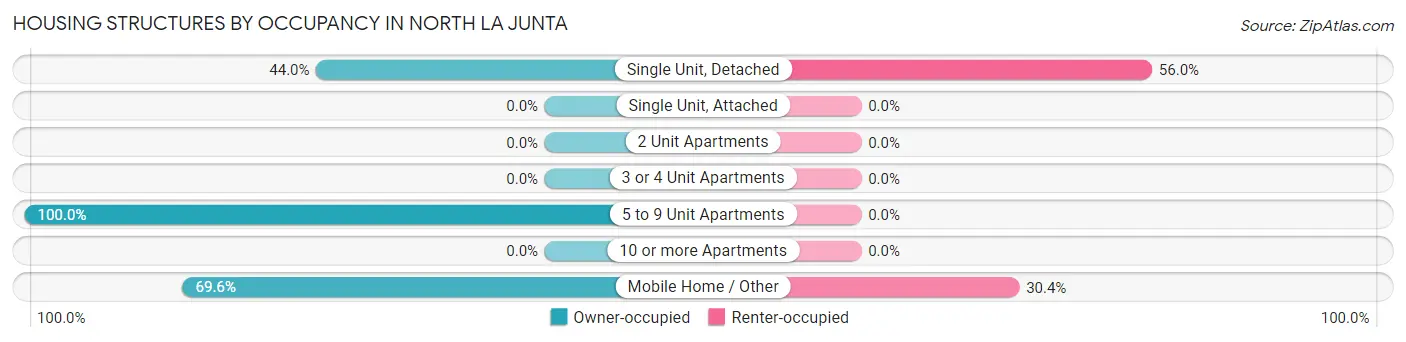
| Structure Type | Owner-occupied | Renter-occupied |
| Single Unit, Detached | 81 (44.0%) | 103 (56.0%) |
| Single Unit, Attached | 0 (0.0%) | 0 (0.0%) |
| 2 Unit Apartments | 0 (0.0%) | 0 (0.0%) |
| 3 or 4 Unit Apartments | 0 (0.0%) | 0 (0.0%) |
| 5 to 9 Unit Apartments | 7 (100.0%) | 0 (0.0%) |
| 10 or more Apartments | 0 (0.0%) | 0 (0.0%) |
| Mobile Home / Other | 16 (69.6%) | 7 (30.4%) |
| Total | 104 (48.6%) | 110 (51.4%) |
Housing Structures by Number of Rooms in North La Junta
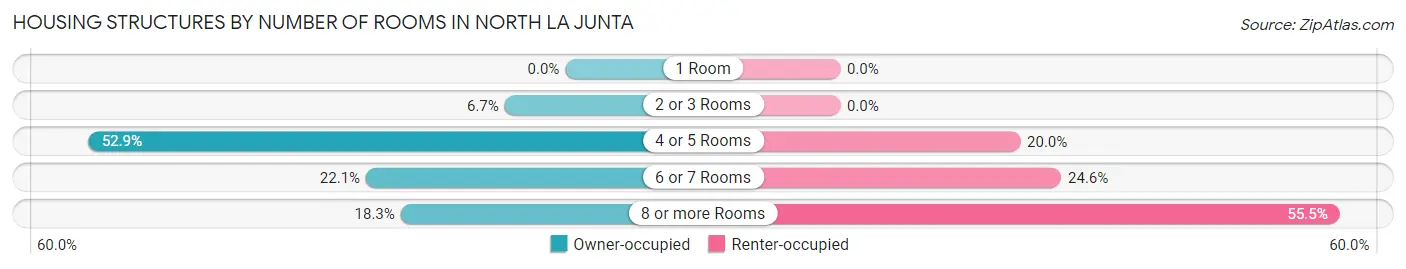
| Number of Rooms | Owner-occupied | Renter-occupied |
| 1 Room | 0 (0.0%) | 0 (0.0%) |
| 2 or 3 Rooms | 7 (6.7%) | 0 (0.0%) |
| 4 or 5 Rooms | 55 (52.9%) | 22 (20.0%) |
| 6 or 7 Rooms | 23 (22.1%) | 27 (24.5%) |
| 8 or more Rooms | 19 (18.3%) | 61 (55.4%) |
| Total | 104 (100.0%) | 110 (100.0%) |
Housing Structure by Heating Type in North La Junta
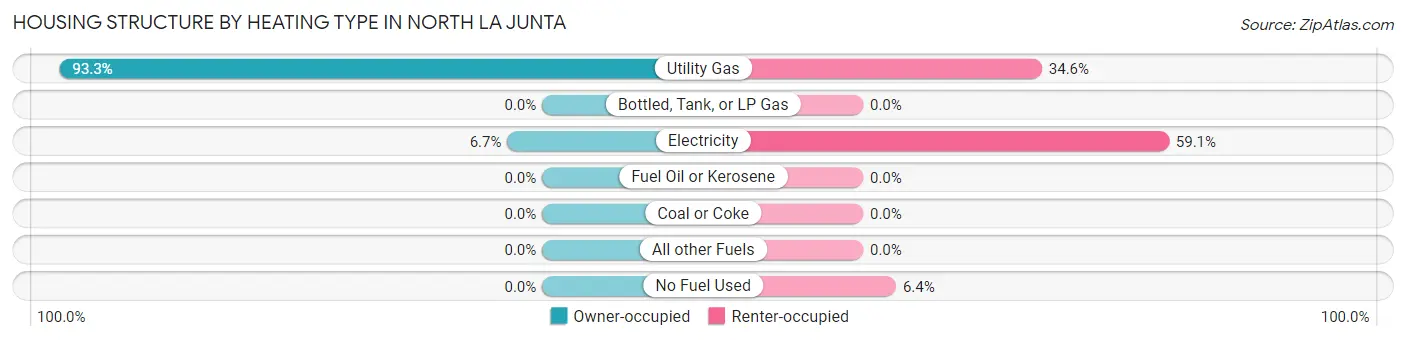
| Heating Type | Owner-occupied | Renter-occupied |
| Utility Gas | 97 (93.3%) | 38 (34.5%) |
| Bottled, Tank, or LP Gas | 0 (0.0%) | 0 (0.0%) |
| Electricity | 7 (6.7%) | 65 (59.1%) |
| Fuel Oil or Kerosene | 0 (0.0%) | 0 (0.0%) |
| Coal or Coke | 0 (0.0%) | 0 (0.0%) |
| All other Fuels | 0 (0.0%) | 0 (0.0%) |
| No Fuel Used | 0 (0.0%) | 7 (6.4%) |
| Total | 104 (100.0%) | 110 (100.0%) |
Household Vehicle Usage in North La Junta
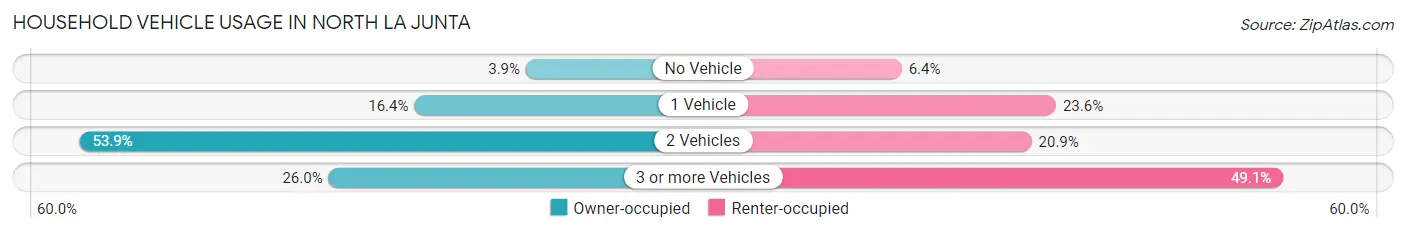
| Vehicles per Household | Owner-occupied | Renter-occupied |
| No Vehicle | 4 (3.8%) | 7 (6.4%) |
| 1 Vehicle | 17 (16.4%) | 26 (23.6%) |
| 2 Vehicles | 56 (53.8%) | 23 (20.9%) |
| 3 or more Vehicles | 27 (26.0%) | 54 (49.1%) |
| Total | 104 (100.0%) | 110 (100.0%) |
Real Estate & Mortgages in North La Junta
Real Estate and Mortgage Overview in North La Junta
| Characteristic | Without Mortgage | With Mortgage |
| Housing Units | 83 | 21 |
| Median Property Value | $66,300 | $265,000 |
| Median Household Income | $46,641 | $0 |
| Monthly Housing Costs | $410 | $0 |
| Real Estate Taxes | $233 | $0 |
Property Value by Mortgage Status in North La Junta
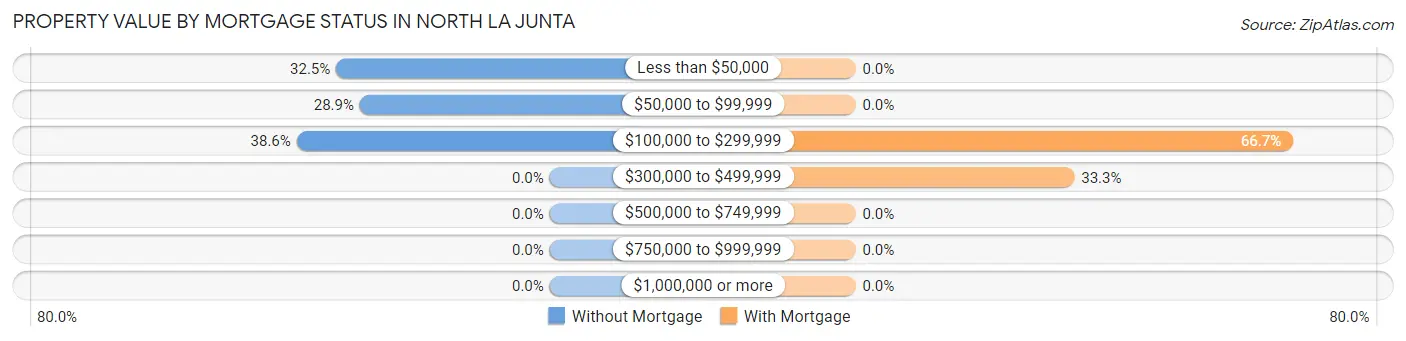
| Property Value | Without Mortgage | With Mortgage |
| Less than $50,000 | 27 (32.5%) | 0 (0.0%) |
| $50,000 to $99,999 | 24 (28.9%) | 0 (0.0%) |
| $100,000 to $299,999 | 32 (38.6%) | 14 (66.7%) |
| $300,000 to $499,999 | 0 (0.0%) | 7 (33.3%) |
| $500,000 to $749,999 | 0 (0.0%) | 0 (0.0%) |
| $750,000 to $999,999 | 0 (0.0%) | 0 (0.0%) |
| $1,000,000 or more | 0 (0.0%) | 0 (0.0%) |
| Total | 83 (100.0%) | 21 (100.0%) |
Household Income by Mortgage Status in North La Junta
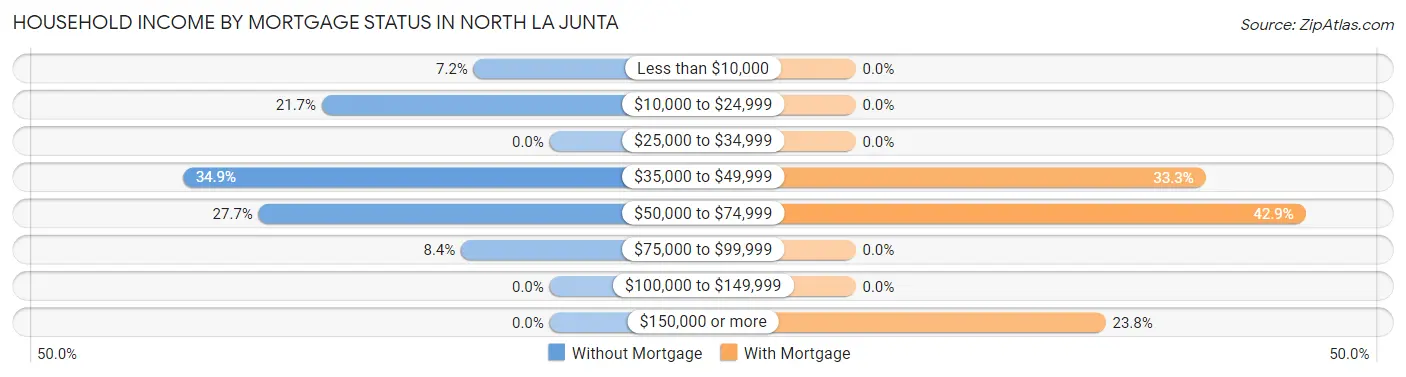
| Household Income | Without Mortgage | With Mortgage |
| Less than $10,000 | 6 (7.2%) | 0 (0.0%) |
| $10,000 to $24,999 | 18 (21.7%) | 0 (0.0%) |
| $25,000 to $34,999 | 0 (0.0%) | 0 (0.0%) |
| $35,000 to $49,999 | 29 (34.9%) | 7 (33.3%) |
| $50,000 to $74,999 | 23 (27.7%) | 9 (42.9%) |
| $75,000 to $99,999 | 7 (8.4%) | 0 (0.0%) |
| $100,000 to $149,999 | 0 (0.0%) | 0 (0.0%) |
| $150,000 or more | 0 (0.0%) | 5 (23.8%) |
| Total | 83 (100.0%) | 21 (100.0%) |
Property Value to Household Income Ratio in North La Junta
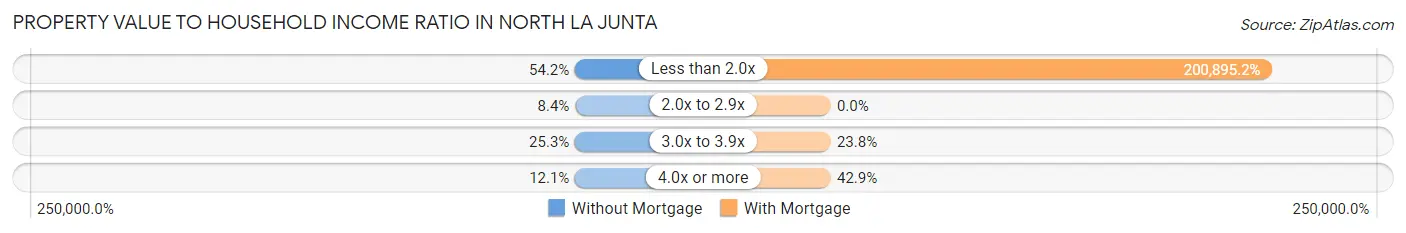
| Value-to-Income Ratio | Without Mortgage | With Mortgage |
| Less than 2.0x | 45 (54.2%) | 42,188 (200,895.2%) |
| 2.0x to 2.9x | 7 (8.4%) | 0 (0.0%) |
| 3.0x to 3.9x | 21 (25.3%) | 5 (23.8%) |
| 4.0x or more | 10 (12.0%) | 9 (42.9%) |
| Total | 83 (100.0%) | 21 (100.0%) |
Real Estate Taxes by Mortgage Status in North La Junta
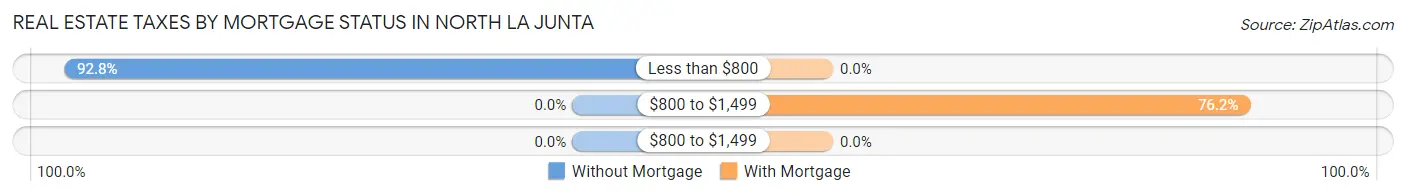
| Property Taxes | Without Mortgage | With Mortgage |
| Less than $800 | 77 (92.8%) | 0 (0.0%) |
| $800 to $1,499 | 0 (0.0%) | 16 (76.2%) |
| $800 to $1,499 | 0 (0.0%) | 0 (0.0%) |
| Total | 83 (100.0%) | 21 (100.0%) |
Health & Disability in North La Junta
Health Insurance Coverage by Age in North La Junta

| Age Bracket | With Coverage | Without Coverage |
| Under 6 Years | 35 (100.0%) | 0 (0.0%) |
| 6 to 18 Years | 89 (86.4%) | 14 (13.6%) |
| 19 to 25 Years | 0 (0.0%) | 0 (0.0%) |
| 26 to 34 Years | 40 (85.1%) | 7 (14.9%) |
| 35 to 44 Years | 106 (100.0%) | 0 (0.0%) |
| 45 to 54 Years | 15 (100.0%) | 0 (0.0%) |
| 55 to 64 Years | 49 (100.0%) | 0 (0.0%) |
| 65 to 74 Years | 71 (100.0%) | 0 (0.0%) |
| 75 Years and older | 35 (100.0%) | 0 (0.0%) |
| Total | 440 (95.4%) | 21 (4.6%) |
Health Insurance Coverage by Citizenship Status in North La Junta
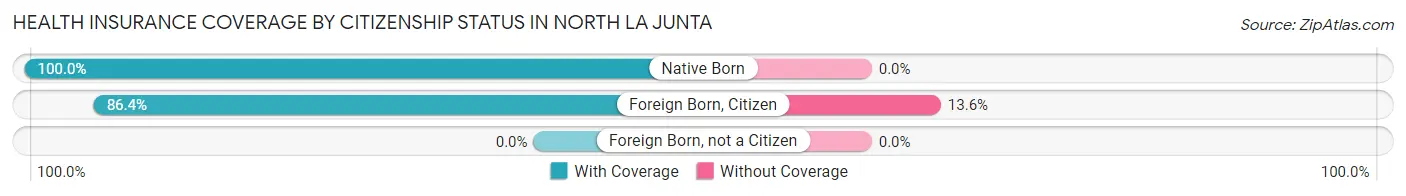
| Citizenship Status | With Coverage | Without Coverage |
| Native Born | 35 (100.0%) | 0 (0.0%) |
| Foreign Born, Citizen | 89 (86.4%) | 14 (13.6%) |
| Foreign Born, not a Citizen | 0 (0.0%) | 0 (0.0%) |
Health Insurance Coverage by Household Income in North La Junta
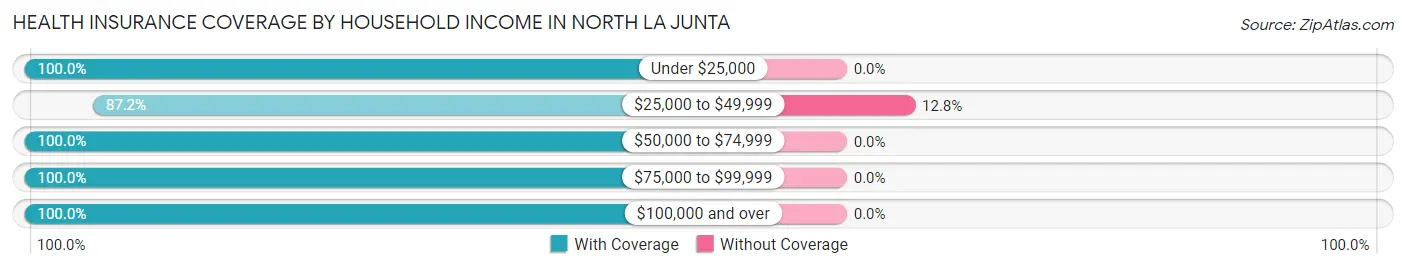
| Household Income | With Coverage | Without Coverage |
| Under $25,000 | 24 (100.0%) | 0 (0.0%) |
| $25,000 to $49,999 | 143 (87.2%) | 21 (12.8%) |
| $50,000 to $74,999 | 192 (100.0%) | 0 (0.0%) |
| $75,000 to $99,999 | 13 (100.0%) | 0 (0.0%) |
| $100,000 and over | 68 (100.0%) | 0 (0.0%) |
Public vs Private Health Insurance Coverage by Age in North La Junta
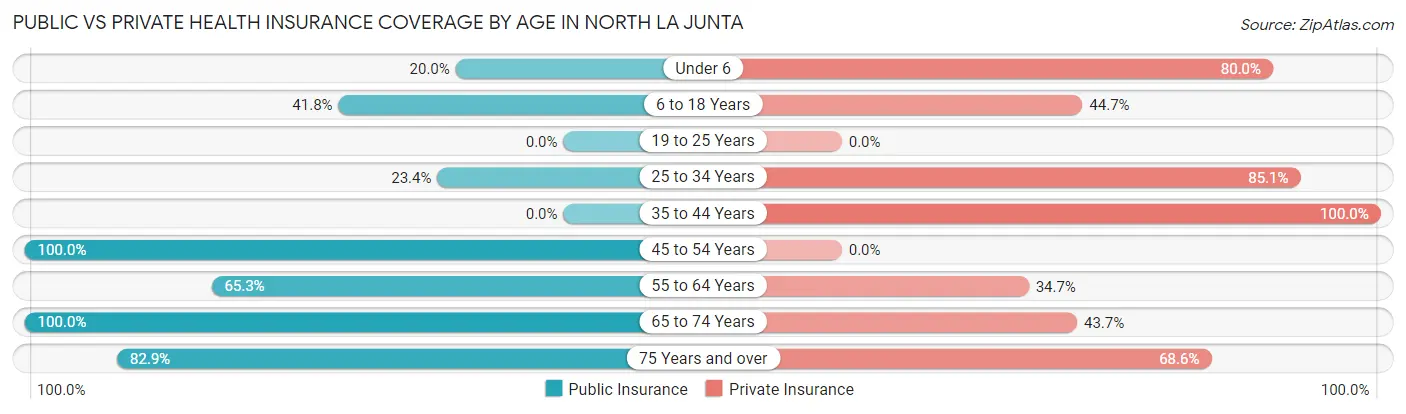
| Age Bracket | Public Insurance | Private Insurance |
| Under 6 | 7 (20.0%) | 28 (80.0%) |
| 6 to 18 Years | 43 (41.7%) | 46 (44.7%) |
| 19 to 25 Years | 0 (0.0%) | 0 (0.0%) |
| 25 to 34 Years | 11 (23.4%) | 40 (85.1%) |
| 35 to 44 Years | 0 (0.0%) | 106 (100.0%) |
| 45 to 54 Years | 15 (100.0%) | 0 (0.0%) |
| 55 to 64 Years | 32 (65.3%) | 17 (34.7%) |
| 65 to 74 Years | 71 (100.0%) | 31 (43.7%) |
| 75 Years and over | 29 (82.9%) | 24 (68.6%) |
| Total | 208 (45.1%) | 292 (63.3%) |
Disability Status by Sex by Age in North La Junta
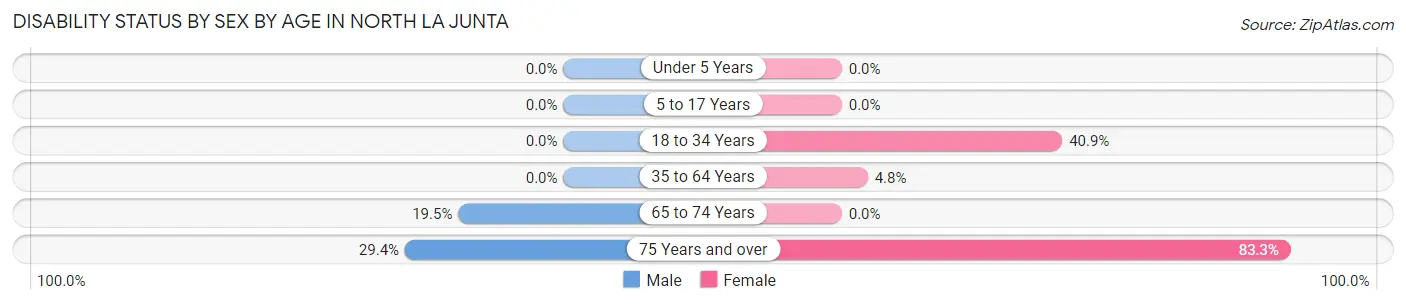
| Age Bracket | Male | Female |
| Under 5 Years | 0 (0.0%) | 0 (0.0%) |
| 5 to 17 Years | 0 (0.0%) | 0 (0.0%) |
| 18 to 34 Years | 0 (0.0%) | 18 (40.9%) |
| 35 to 64 Years | 0 (0.0%) | 5 (4.8%) |
| 65 to 74 Years | 8 (19.5%) | 0 (0.0%) |
| 75 Years and over | 5 (29.4%) | 15 (83.3%) |
Disability Class by Sex by Age in North La Junta
Disability Class: Hearing Difficulty
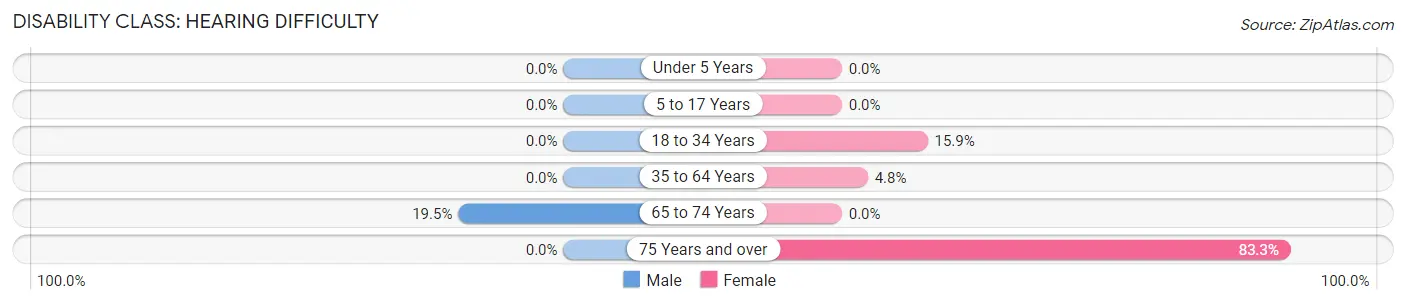
| Age Bracket | Male | Female |
| Under 5 Years | 0 (0.0%) | 0 (0.0%) |
| 5 to 17 Years | 0 (0.0%) | 0 (0.0%) |
| 18 to 34 Years | 0 (0.0%) | 7 (15.9%) |
| 35 to 64 Years | 0 (0.0%) | 5 (4.8%) |
| 65 to 74 Years | 8 (19.5%) | 0 (0.0%) |
| 75 Years and over | 0 (0.0%) | 15 (83.3%) |
Disability Class: Vision Difficulty
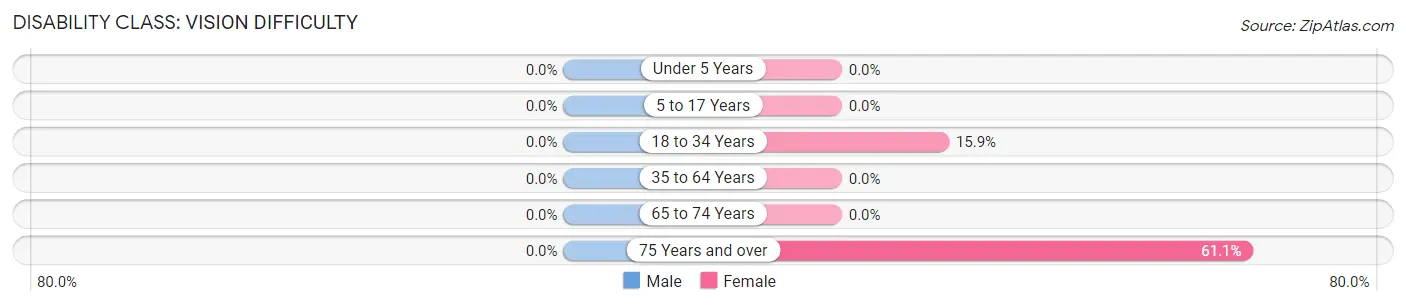
| Age Bracket | Male | Female |
| Under 5 Years | 0 (0.0%) | 0 (0.0%) |
| 5 to 17 Years | 0 (0.0%) | 0 (0.0%) |
| 18 to 34 Years | 0 (0.0%) | 7 (15.9%) |
| 35 to 64 Years | 0 (0.0%) | 0 (0.0%) |
| 65 to 74 Years | 0 (0.0%) | 0 (0.0%) |
| 75 Years and over | 0 (0.0%) | 11 (61.1%) |
Disability Class: Cognitive Difficulty
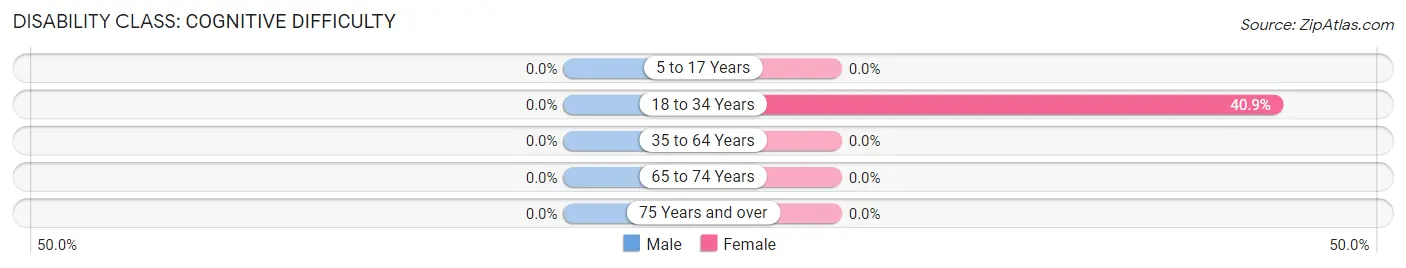
| Age Bracket | Male | Female |
| 5 to 17 Years | 0 (0.0%) | 0 (0.0%) |
| 18 to 34 Years | 0 (0.0%) | 18 (40.9%) |
| 35 to 64 Years | 0 (0.0%) | 0 (0.0%) |
| 65 to 74 Years | 0 (0.0%) | 0 (0.0%) |
| 75 Years and over | 0 (0.0%) | 0 (0.0%) |
Disability Class: Ambulatory Difficulty
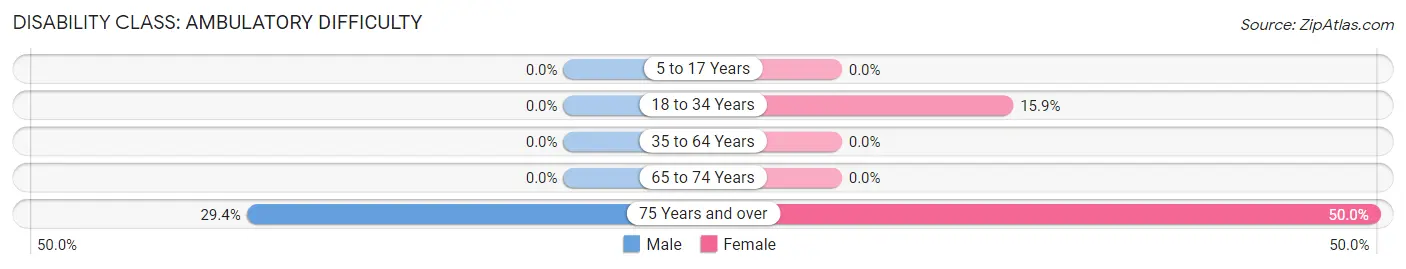
| Age Bracket | Male | Female |
| 5 to 17 Years | 0 (0.0%) | 0 (0.0%) |
| 18 to 34 Years | 0 (0.0%) | 7 (15.9%) |
| 35 to 64 Years | 0 (0.0%) | 0 (0.0%) |
| 65 to 74 Years | 0 (0.0%) | 0 (0.0%) |
| 75 Years and over | 5 (29.4%) | 9 (50.0%) |
Disability Class: Self-Care Difficulty
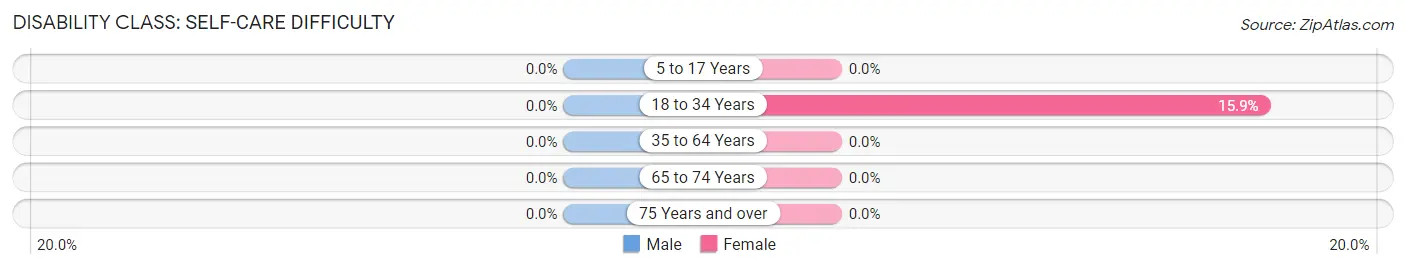
| Age Bracket | Male | Female |
| 5 to 17 Years | 0 (0.0%) | 0 (0.0%) |
| 18 to 34 Years | 0 (0.0%) | 7 (15.9%) |
| 35 to 64 Years | 0 (0.0%) | 0 (0.0%) |
| 65 to 74 Years | 0 (0.0%) | 0 (0.0%) |
| 75 Years and over | 0 (0.0%) | 0 (0.0%) |
Technology Access in North La Junta
Computing Device Access in North La Junta
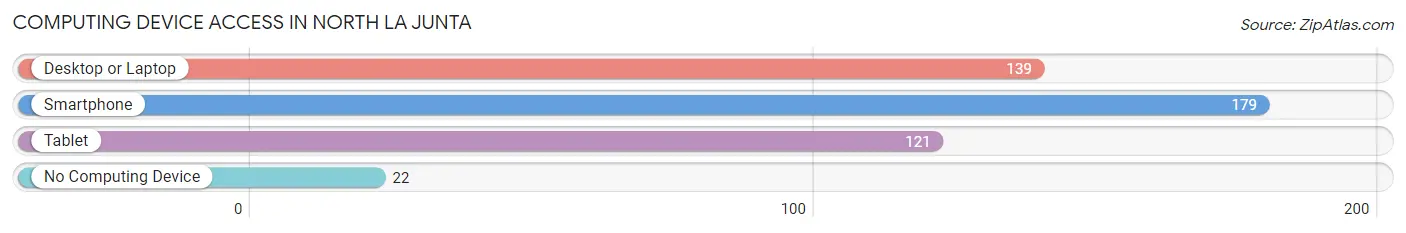
| Device Type | # Households | % Households |
| Desktop or Laptop | 139 | 64.9% |
| Smartphone | 179 | 83.6% |
| Tablet | 121 | 56.5% |
| No Computing Device | 22 | 10.3% |
| Total | 214 | 100.0% |
Internet Access in North La Junta
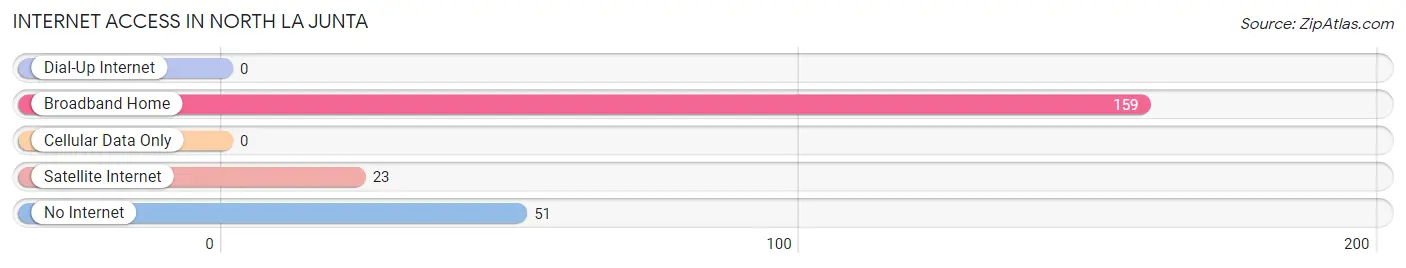
| Internet Type | # Households | % Households |
| Dial-Up Internet | 0 | 0.0% |
| Broadband Home | 159 | 74.3% |
| Cellular Data Only | 0 | 0.0% |
| Satellite Internet | 23 | 10.7% |
| No Internet | 51 | 23.8% |
| Total | 214 | 100.0% |
North La Junta Summary
La Junta is a city located in Otero County, Colorado, United States. It is situated along the Arkansas River in the southeastern corner of the state. The population was 7,077 at the 2010 census. La Junta is the county seat and the most populous city of Otero County.
History
La Junta was founded in 1875 by the Denver and Rio Grande Railroad. The city was named after the Spanish word for "the junction," referring to the junction of the Arkansas River and the Santa Fe Trail. The city was incorporated in 1881.
In the late 19th century, La Junta was a major stop on the Santa Fe Trail. The city was also a major hub for the Denver and Rio Grande Railroad. The railroad brought many settlers to the area, and the city grew rapidly.
Geography
La Junta is located in southeastern Colorado at the junction of the Arkansas River and the Santa Fe Trail. The city is situated at an elevation of 4,092 feet (1,249 m).
The city covers an area of 4.2 square miles (10.8 km2), of which 4.1 square miles (10.6 km2) is land and 0.1 square miles (0.2 km2) is water.
Economy
La Junta's economy is largely based on agriculture and tourism. The city is home to several large agricultural operations, including a sugar beet processing plant, a grain elevator, and a feedlot.
The city is also a popular tourist destination, with several attractions, including the La Junta Historical Museum, the Otero County Museum, and the La Junta Municipal Golf Course.
Demographics
As of the 2010 census, there were 7,077 people, 2,845 households, and 1,845 families residing in the city. The population density was 1,717.3 people per square mile (662.3/km2). There were 3,093 housing units at an average density of 745.3 per square mile (287.7/km2).
The racial makeup of the city was 75.2% White, 0.9% African American, 1.2% Native American, 0.7% Asian, 0.1% Pacific Islander, 19.2% from other races, and 3.0% from two or more races. Hispanic or Latino of any race were 41.2% of the population.
The median income for a household in the city was $30,938, and the median income for a family was $37,917. Males had a median income of $30,938 versus $21,917 for females. The per capita income for the city was $15,945. About 16.2% of families and 20.2% of the population were below the poverty line, including 28.2% of those under age 18 and 11.2% of those age 65 or over.
Common Questions
What is Per Capita Income in North La Junta?
Per Capita income in North La Junta is $22,638.
What is the Median Family Income in North La Junta?
Median Family Income in North La Junta is $58,519.
What is the Median Household income in North La Junta?
Median Household Income in North La Junta is $51,042.
What is Income or Wage Gap in North La Junta?
Income or Wage Gap in North La Junta is 35.8%.
Women in North La Junta earn 64.2 cents for every dollar earned by a man.
What is Inequality or Gini Index in North La Junta?
Inequality or Gini Index in North La Junta is 0.22.
What is the Total Population of North La Junta?
Total Population of North La Junta is 461.
What is the Total Male Population of North La Junta?
Total Male Population of North La Junta is 180.
What is the Total Female Population of North La Junta?
Total Female Population of North La Junta is 281.
What is the Ratio of Males per 100 Females in North La Junta?
There are 64.06 Males per 100 Females in North La Junta.
What is the Ratio of Females per 100 Males in North La Junta?
There are 156.11 Females per 100 Males in North La Junta.
What is the Median Population Age in North La Junta?
Median Population Age in North La Junta is 40.5 Years.
What is the Average Family Size in North La Junta
Average Family Size in North La Junta is 2.5 People.
What is the Average Household Size in North La Junta
Average Household Size in North La Junta is 2.1 People.
How Large is the Labor Force in North La Junta?
There are 261 People in the Labor Forcein in North La Junta.
What is the Percentage of People in the Labor Force in North La Junta?
68.7% of People are in the Labor Force in North La Junta.
What is the Unemployment Rate in North La Junta?
Unemployment Rate in North La Junta is 2.7%.