Zip Codes with the Highest Percentage of Population Employed in Food Preparation & Serving in Colorado
RELATED REPORTS & OPTIONS
Food Preparation & Serving
Colorado
Compare Zip Codes
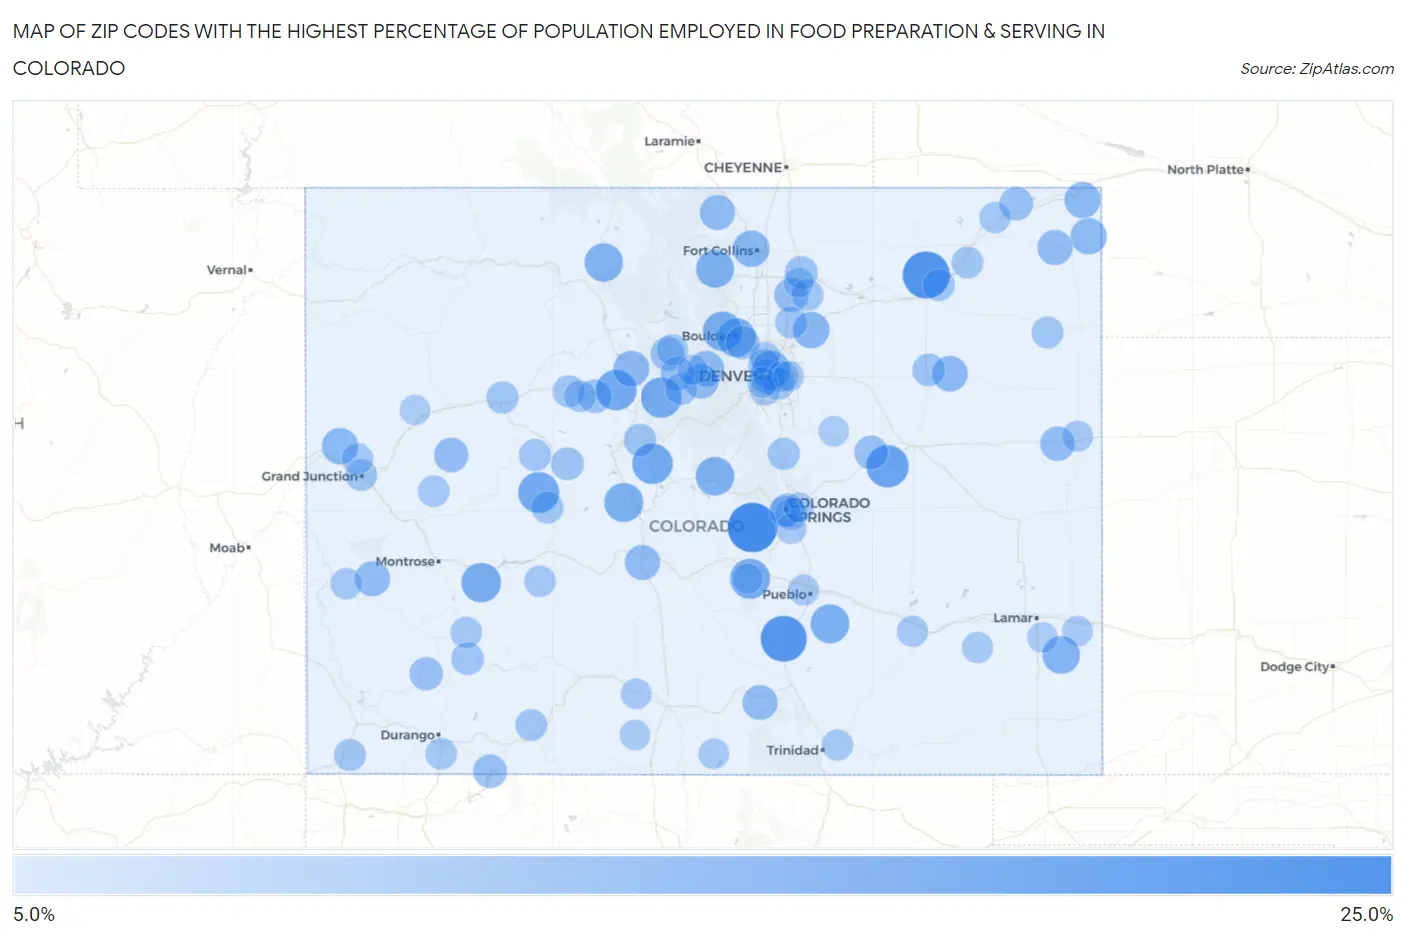
Map of Zip Codes with the Highest Percentage of Population Employed in Food Preparation & Serving in Colorado
5.0%
25.0%
Zip Codes with the Highest Percentage of Population Employed in Food Preparation & Serving in Colorado
| Zip Code | % Employed | vs State | vs National | |
| 1. | 80860 | 23.9% | 5.2%(+18.7)#1 | 5.3%(+18.6)#349 |
| 2. | 80750 | 21.6% | 5.2%(+16.4)#2 | 5.3%(+16.3)#434 |
| 3. | 81019 | 20.7% | 5.2%(+15.5)#3 | 5.3%(+15.4)#468 |
| 4. | 80830 | 17.4% | 5.2%(+12.2)#4 | 5.3%(+12.1)#714 |
| 5. | 81225 | 16.2% | 5.2%(+11.0)#5 | 5.3%(+10.9)#839 |
| 6. | 81657 | 15.9% | 5.2%(+10.8)#6 | 5.3%(+10.7)#870 |
| 7. | 80435 | 15.9% | 5.2%(+10.7)#7 | 5.3%(+10.6)#875 |
| 8. | 80440 | 15.9% | 5.2%(+10.7)#8 | 5.3%(+10.6)#879 |
| 9. | 81221 | 15.3% | 5.2%(+10.1)#9 | 5.3%(+9.97)#950 |
| 10. | 81220 | 15.0% | 5.2%(+9.82)#10 | 5.3%(+9.71)#982 |
| 11. | 80302 | 14.8% | 5.2%(+9.58)#11 | 5.3%(+9.47)#1,016 |
| 12. | 81211 | 14.5% | 5.2%(+9.34)#12 | 5.3%(+9.23)#1,056 |
| 13. | 80310 | 14.3% | 5.2%(+9.14)#13 | 5.3%(+9.03)#1,091 |
| 14. | 81022 | 14.3% | 5.2%(+9.10)#14 | 5.3%(+9.00)#1,095 |
| 15. | 80827 | 14.1% | 5.2%(+8.90)#15 | 5.3%(+8.80)#1,144 |
| 16. | 80216 | 13.9% | 5.2%(+8.74)#16 | 5.3%(+8.63)#1,181 |
| 17. | 80430 | 13.9% | 5.2%(+8.71)#17 | 5.3%(+8.60)#1,187 |
| 18. | 80532 | 13.6% | 5.2%(+8.42)#18 | 5.3%(+8.32)#1,254 |
| 19. | 81041 | 13.2% | 5.2%(+8.04)#19 | 5.3%(+7.93)#1,337 |
| 20. | 80642 | 12.3% | 5.2%(+7.10)#20 | 5.3%(+6.99)#1,570 |
| 21. | 80521 | 12.3% | 5.2%(+7.09)#21 | 5.3%(+6.99)#1,574 |
| 22. | 80721 | 12.2% | 5.2%(+7.00)#22 | 5.3%(+6.89)#1,607 |
| 23. | 81524 | 12.1% | 5.2%(+6.94)#23 | 5.3%(+6.84)#1,621 |
| 24. | 80737 | 12.0% | 5.2%(+6.82)#24 | 5.3%(+6.72)#1,661 |
| 25. | 80498 | 11.8% | 5.2%(+6.59)#25 | 5.3%(+6.49)#1,743 |
| 26. | 80740 | 11.5% | 5.2%(+6.36)#26 | 5.3%(+6.25)#1,837 |
| 27. | 80427 | 11.5% | 5.2%(+6.30)#27 | 5.3%(+6.19)#1,851 |
| 28. | 80536 | 11.2% | 5.2%(+5.97)#28 | 5.3%(+5.87)#1,982 |
| 29. | 81424 | 11.1% | 5.2%(+5.96)#29 | 5.3%(+5.86)#1,984 |
| 30. | 81242 | 11.1% | 5.2%(+5.95)#30 | 5.3%(+5.84)#1,988 |
| 31. | 80746 | 11.1% | 5.2%(+5.93)#31 | 5.3%(+5.83)#2,007 |
| 32. | 81055 | 11.1% | 5.2%(+5.87)#32 | 5.3%(+5.76)#2,035 |
| 33. | 80290 | 10.9% | 5.2%(+5.77)#33 | 5.3%(+5.66)#2,082 |
| 34. | 80452 | 10.8% | 5.2%(+5.63)#34 | 5.3%(+5.53)#2,149 |
| 35. | 80805 | 10.6% | 5.2%(+5.37)#35 | 5.3%(+5.27)#2,300 |
| 36. | 81624 | 10.5% | 5.2%(+5.34)#36 | 5.3%(+5.24)#2,312 |
| 37. | 80623 | 10.3% | 5.2%(+5.08)#37 | 5.3%(+4.97)#2,446 |
| 38. | 81121 | 10.0% | 5.2%(+4.82)#38 | 5.3%(+4.71)#2,637 |
| 39. | 80835 | 9.9% | 5.2%(+4.74)#39 | 5.3%(+4.63)#2,694 |
| 40. | 80442 | 9.8% | 5.2%(+4.64)#40 | 5.3%(+4.54)#2,779 |
| 41. | 80726 | 9.8% | 5.2%(+4.64)#41 | 5.3%(+4.54)#2,780 |
| 42. | 80438 | 9.8% | 5.2%(+4.60)#42 | 5.3%(+4.49)#2,813 |
| 43. | 80303 | 9.7% | 5.2%(+4.56)#43 | 5.3%(+4.46)#2,845 |
| 44. | 81620 | 9.7% | 5.2%(+4.53)#44 | 5.3%(+4.43)#2,873 |
| 45. | 81332 | 9.6% | 5.2%(+4.41)#45 | 5.3%(+4.31)#2,979 |
| 46. | 80903 | 9.3% | 5.2%(+4.16)#46 | 5.3%(+4.05)#3,205 |
| 47. | 80631 | 9.2% | 5.2%(+3.99)#47 | 5.3%(+3.88)#3,355 |
| 48. | 81611 | 9.2% | 5.2%(+3.97)#48 | 5.3%(+3.86)#3,368 |
| 49. | 80757 | 9.1% | 5.2%(+3.91)#49 | 5.3%(+3.80)#3,435 |
| 50. | 80420 | 8.9% | 5.2%(+3.68)#50 | 5.3%(+3.58)#3,651 |
| 51. | 81433 | 8.8% | 5.2%(+3.63)#51 | 5.3%(+3.52)#3,723 |
| 52. | 81601 | 8.6% | 5.2%(+3.45)#52 | 5.3%(+3.34)#3,925 |
| 53. | 80444 | 8.6% | 5.2%(+3.44)#53 | 5.3%(+3.34)#3,934 |
| 54. | 81654 | 8.6% | 5.2%(+3.39)#54 | 5.3%(+3.28)#4,007 |
| 55. | 80621 | 8.6% | 5.2%(+3.39)#55 | 5.3%(+3.28)#4,009 |
| 56. | 80733 | 8.6% | 5.2%(+3.38)#56 | 5.3%(+3.27)#4,017 |
| 57. | 80118 | 8.6% | 5.2%(+3.38)#57 | 5.3%(+3.27)#4,018 |
| 58. | 80910 | 8.6% | 5.2%(+3.38)#58 | 5.3%(+3.27)#4,019 |
| 59. | 81631 | 8.5% | 5.2%(+3.33)#59 | 5.3%(+3.23)#4,057 |
| 60. | 81224 | 8.4% | 5.2%(+3.22)#60 | 5.3%(+3.11)#4,177 |
| 61. | 80727 | 8.3% | 5.2%(+3.15)#61 | 5.3%(+3.05)#4,260 |
| 62. | 80645 | 8.3% | 5.2%(+3.12)#62 | 5.3%(+3.02)#4,319 |
| 63. | 81501 | 8.3% | 5.2%(+3.10)#63 | 5.3%(+3.00)#4,336 |
| 64. | 81334 | 8.3% | 5.2%(+3.10)#64 | 5.3%(+2.99)#4,340 |
| 65. | 80722 | 8.2% | 5.2%(+3.04)#65 | 5.3%(+2.94)#4,402 |
| 66. | 81147 | 8.2% | 5.2%(+3.03)#66 | 5.3%(+2.93)#4,414 |
| 67. | 80221 | 8.1% | 5.2%(+2.92)#67 | 5.3%(+2.81)#4,572 |
| 68. | 80482 | 8.1% | 5.2%(+2.92)#68 | 5.3%(+2.81)#4,574 |
| 69. | 81632 | 8.1% | 5.2%(+2.91)#69 | 5.3%(+2.80)#4,588 |
| 70. | 80247 | 8.1% | 5.2%(+2.90)#70 | 5.3%(+2.80)#4,595 |
| 71. | 81413 | 8.0% | 5.2%(+2.86)#71 | 5.3%(+2.76)#4,661 |
| 72. | 80905 | 8.0% | 5.2%(+2.84)#72 | 5.3%(+2.73)#4,703 |
| 73. | 81230 | 8.0% | 5.2%(+2.79)#73 | 5.3%(+2.69)#4,766 |
| 74. | 81303 | 7.9% | 5.2%(+2.73)#74 | 5.3%(+2.62)#4,871 |
| 75. | 81505 | 7.9% | 5.2%(+2.72)#75 | 5.3%(+2.62)#4,886 |
| 76. | 81427 | 7.9% | 5.2%(+2.71)#76 | 5.3%(+2.60)#4,900 |
| 77. | 80736 | 7.9% | 5.2%(+2.70)#77 | 5.3%(+2.60)#4,910 |
| 78. | 81422 | 7.8% | 5.2%(+2.63)#78 | 5.3%(+2.53)#5,025 |
| 79. | 81054 | 7.7% | 5.2%(+2.51)#79 | 5.3%(+2.41)#5,211 |
| 80. | 80260 | 7.7% | 5.2%(+2.50)#80 | 5.3%(+2.40)#5,236 |
| 81. | 81082 | 7.7% | 5.2%(+2.48)#81 | 5.3%(+2.38)#5,272 |
| 82. | 81067 | 7.7% | 5.2%(+2.48)#82 | 5.3%(+2.38)#5,275 |
| 83. | 80807 | 7.6% | 5.2%(+2.45)#83 | 5.3%(+2.34)#5,328 |
| 84. | 80010 | 7.6% | 5.2%(+2.43)#84 | 5.3%(+2.32)#5,362 |
| 85. | 80110 | 7.4% | 5.2%(+2.24)#85 | 5.3%(+2.13)#5,711 |
| 86. | 81003 | 7.4% | 5.2%(+2.22)#86 | 5.3%(+2.12)#5,741 |
| 87. | 81144 | 7.3% | 5.2%(+2.12)#87 | 5.3%(+2.01)#5,921 |
| 88. | 80913 | 7.3% | 5.2%(+2.10)#88 | 5.3%(+1.99)#5,967 |
| 89. | 80219 | 7.3% | 5.2%(+2.09)#89 | 5.3%(+1.99)#5,971 |
| 90. | 81047 | 7.2% | 5.2%(+2.04)#90 | 5.3%(+1.93)#6,094 |
| 91. | 81152 | 7.2% | 5.2%(+2.01)#91 | 5.3%(+1.90)#6,155 |
| 92. | 81052 | 7.2% | 5.2%(+2.01)#92 | 5.3%(+1.90)#6,163 |
| 93. | 80011 | 7.2% | 5.2%(+1.99)#93 | 5.3%(+1.88)#6,191 |
| 94. | 80117 | 7.1% | 5.2%(+1.96)#94 | 5.3%(+1.86)#6,239 |
| 95. | 81635 | 7.0% | 5.2%(+1.87)#95 | 5.3%(+1.76)#6,439 |
| 96. | 81140 | 7.0% | 5.2%(+1.85)#96 | 5.3%(+1.75)#6,475 |
| 97. | 81244 | 7.0% | 5.2%(+1.82)#97 | 5.3%(+1.71)#6,564 |
| 98. | 80436 | 7.0% | 5.2%(+1.80)#98 | 5.3%(+1.69)#6,621 |
| 99. | 80915 | 7.0% | 5.2%(+1.79)#99 | 5.3%(+1.68)#6,638 |
| 100. | 80620 | 7.0% | 5.2%(+1.78)#100 | 5.3%(+1.68)#6,656 |
Common Questions
What are the Top 10 Zip Codes with the Highest Percentage of Population Employed in Food Preparation & Serving in Colorado?
Top 10 Zip Codes with the Highest Percentage of Population Employed in Food Preparation & Serving in Colorado are:
What zip code has the Highest Percentage of Population Employed in Food Preparation & Serving in Colorado?
80860 has the Highest Percentage of Population Employed in Food Preparation & Serving in Colorado with 23.9%.
What is the Percentage of Population Employed in Food Preparation & Serving in the State of Colorado?
Percentage of Population Employed in Food Preparation & Serving in Colorado is 5.2%.
What is the Percentage of Population Employed in Food Preparation & Serving in the United States?
Percentage of Population Employed in Food Preparation & Serving in the United States is 5.3%.