Alma, CO Map & Demographics
Alma Map
Alma Overview
$28,637
PER CAPITA INCOME
$38,676
AVG FAMILY INCOME
$50,795
AVG HOUSEHOLD INCOME
0.49
INEQUALITY / GINI INDEX
396
TOTAL POPULATION
216
MALE POPULATION
180
FEMALE POPULATION
120.00
MALES / 100 FEMALES
83.33
FEMALES / 100 MALES
39.5
MEDIAN AGE
2.4
AVG FAMILY SIZE
3.0
AVG HOUSEHOLD SIZE
250
LABOR FORCE [ PEOPLE ]
71.8%
PERCENT IN LABOR FORCE
5.6%
UNEMPLOYMENT RATE
Alma Zip Codes
Alma Area Codes
Income in Alma
Income Overview in Alma
Per Capita Income in Alma is $28,637, while median incomes of families and households are $38,676 and $50,795 respectively.
| Characteristic | Number | Measure |
| Per Capita Income | 396 | $28,637 |
| Median Family Income | 94 | $38,676 |
| Mean Family Income | 94 | $58,405 |
| Median Household Income | 130 | $50,795 |
| Mean Household Income | 130 | $83,207 |
| Income Deficit | 94 | $0 |
| Wage / Income Gap (%) | 396 | 0.00% |
| Wage / Income Gap ($) | 396 | 100.00¢ per $1 |
| Gini / Inequality Index | 396 | 0.49 |
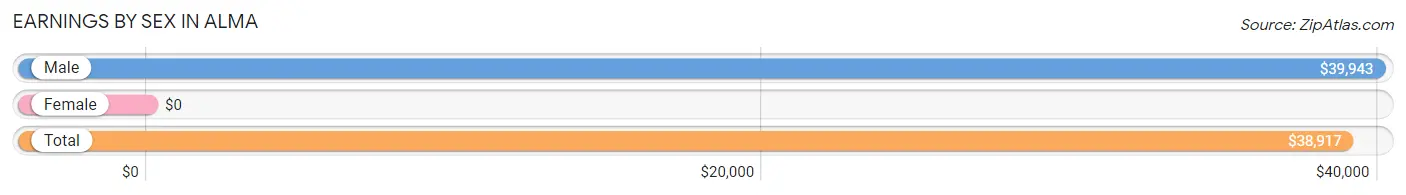
Earnings by Sex in Alma
| Sex | Number | Average Earnings |
| Male | 143 (53.6%) | $39,943 |
| Female | 124 (46.4%) | $0 |
| Total | 267 (100.0%) | $38,917 |
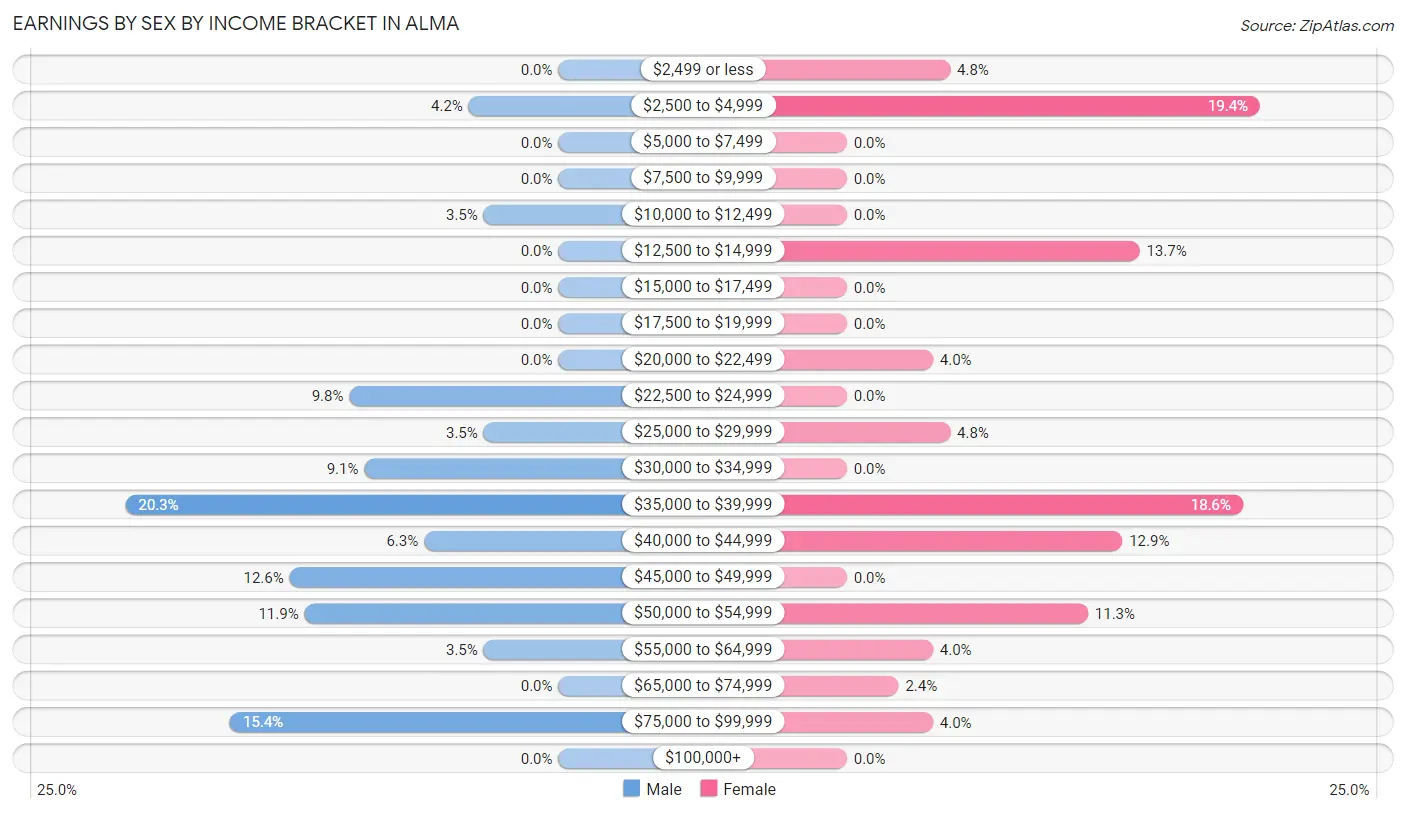
Earnings by Sex by Income Bracket in Alma
The most common earnings brackets in Alma are $35,000 to $39,999 for men (29 | 20.3%) and $2,500 to $4,999 for women (24 | 19.4%).
| Income | Male | Female |
| $2,499 or less | 0 (0.0%) | 6 (4.8%) |
| $2,500 to $4,999 | 6 (4.2%) | 24 (19.4%) |
| $5,000 to $7,499 | 0 (0.0%) | 0 (0.0%) |
| $7,500 to $9,999 | 0 (0.0%) | 0 (0.0%) |
| $10,000 to $12,499 | 5 (3.5%) | 0 (0.0%) |
| $12,500 to $14,999 | 0 (0.0%) | 17 (13.7%) |
| $15,000 to $17,499 | 0 (0.0%) | 0 (0.0%) |
| $17,500 to $19,999 | 0 (0.0%) | 0 (0.0%) |
| $20,000 to $22,499 | 0 (0.0%) | 5 (4.0%) |
| $22,500 to $24,999 | 14 (9.8%) | 0 (0.0%) |
| $25,000 to $29,999 | 5 (3.5%) | 6 (4.8%) |
| $30,000 to $34,999 | 13 (9.1%) | 0 (0.0%) |
| $35,000 to $39,999 | 29 (20.3%) | 23 (18.5%) |
| $40,000 to $44,999 | 9 (6.3%) | 16 (12.9%) |
| $45,000 to $49,999 | 18 (12.6%) | 0 (0.0%) |
| $50,000 to $54,999 | 17 (11.9%) | 14 (11.3%) |
| $55,000 to $64,999 | 5 (3.5%) | 5 (4.0%) |
| $65,000 to $74,999 | 0 (0.0%) | 3 (2.4%) |
| $75,000 to $99,999 | 22 (15.4%) | 5 (4.0%) |
| $100,000+ | 0 (0.0%) | 0 (0.0%) |
| Total | 143 (100.0%) | 124 (100.0%) |
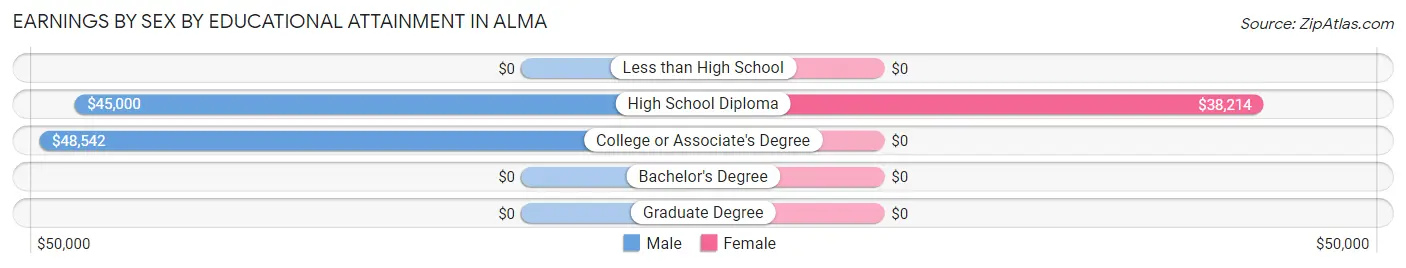
Earnings by Sex by Educational Attainment in Alma
| Educational Attainment | Male Income | Female Income |
| Less than High School | - | - |
| High School Diploma | $45,000 | $38,214 |
| College or Associate's Degree | $48,542 | $0 |
| Bachelor's Degree | - | - |
| Graduate Degree | - | - |
| Total | $39,716 | $0 |
Family Income in Alma
Family Income Brackets in Alma
According to the Alma family income data, there are 26 families falling into the $35,000 to $49,999 income range, which is the most common income bracket and makes up 27.7% of all families.
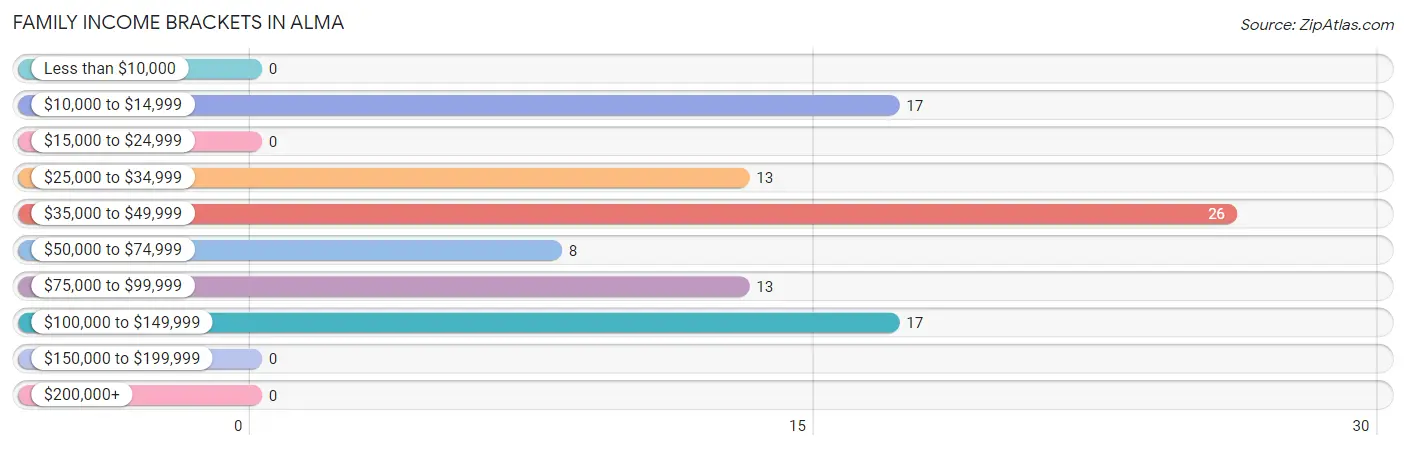
| Income Bracket | # Families | % Families |
| Less than $10,000 | 0 | 0.0% |
| $10,000 to $14,999 | 17 | 18.1% |
| $15,000 to $24,999 | 0 | 0.0% |
| $25,000 to $34,999 | 13 | 13.8% |
| $35,000 to $49,999 | 26 | 27.7% |
| $50,000 to $74,999 | 8 | 8.5% |
| $75,000 to $99,999 | 13 | 13.8% |
| $100,000 to $149,999 | 17 | 18.1% |
| $150,000 to $199,999 | 0 | 0.0% |
| $200,000+ | 0 | 0.0% |
Family Income by Famaliy Size in Alma
2-person families (72 | 76.6%) account for the highest median family income in Alma with $38,971 per family, while 2-person families (72 | 76.6%) have the highest median income of $19,486 per family member.
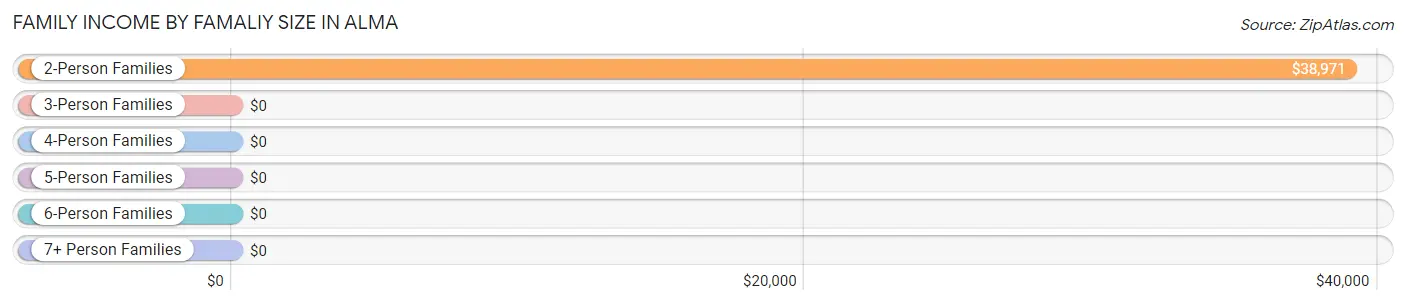
| Income Bracket | # Families | Median Income |
| 2-Person Families | 72 (76.6%) | $38,971 |
| 3-Person Families | 17 (18.1%) | $0 |
| 4-Person Families | 5 (5.3%) | $0 |
| 5-Person Families | 0 (0.0%) | $0 |
| 6-Person Families | 0 (0.0%) | $0 |
| 7+ Person Families | 0 (0.0%) | $0 |
| Total | 94 (100.0%) | $38,676 |
Family Income by Number of Earners in Alma
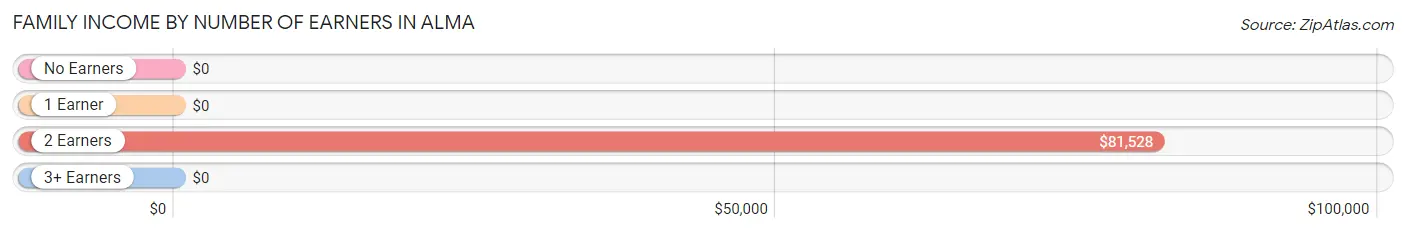
| Number of Earners | # Families | Median Income |
| No Earners | 17 (18.1%) | $0 |
| 1 Earner | 41 (43.6%) | $0 |
| 2 Earners | 31 (33.0%) | $81,528 |
| 3+ Earners | 5 (5.3%) | $0 |
| Total | 94 (100.0%) | $38,676 |
Household Income in Alma
Household Income Brackets in Alma
With 25 households falling in the category, the $50,000 to $74,999 income range is the most frequent in Alma, accounting for 19.2% of all households.
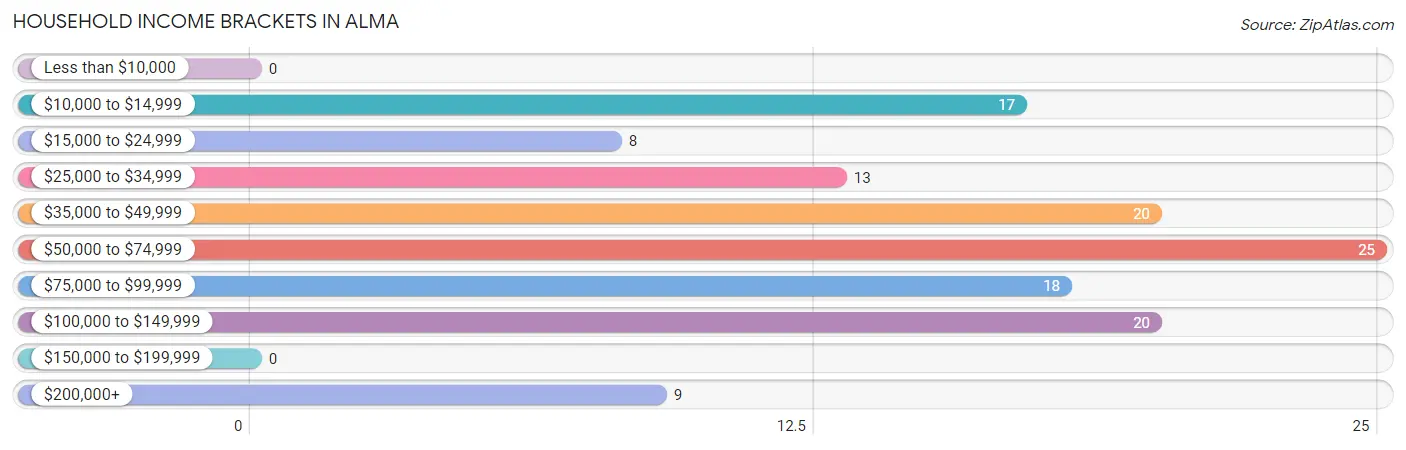
| Income Bracket | # Households | % Households |
| Less than $10,000 | 0 | 0.0% |
| $10,000 to $14,999 | 17 | 13.1% |
| $15,000 to $24,999 | 8 | 6.2% |
| $25,000 to $34,999 | 13 | 10.0% |
| $35,000 to $49,999 | 20 | 15.4% |
| $50,000 to $74,999 | 25 | 19.2% |
| $75,000 to $99,999 | 18 | 13.8% |
| $100,000 to $149,999 | 20 | 15.4% |
| $150,000 to $199,999 | 0 | 0.0% |
| $200,000+ | 9 | 6.9% |
Household Income by Householder Age in Alma
The median household income in Alma is $50,795, with the highest median household income of $51,023 found in the 45 to 64 years age bracket for the primary householder. A total of 64 households (49.2%) fall into this category. Meanwhile, the 15 to 24 years age bracket for the primary householder has the lowest median household income of $0, with 14 households (10.8%) in this group.
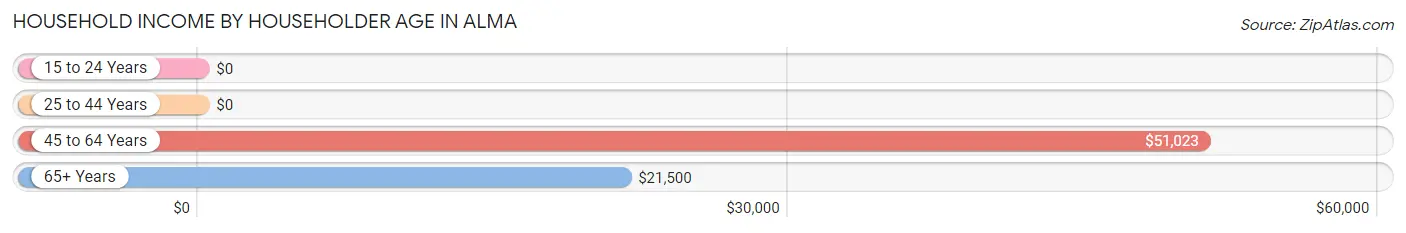
| Income Bracket | # Households | Median Income |
| 15 to 24 Years | 14 (10.8%) | $0 |
| 25 to 44 Years | 40 (30.8%) | $0 |
| 45 to 64 Years | 64 (49.2%) | $51,023 |
| 65+ Years | 12 (9.2%) | $21,500 |
| Total | 130 (100.0%) | $50,795 |
Poverty in Alma
Income Below Poverty by Sex and Age in Alma
With 13.0% poverty level for males and 26.7% for females among the residents of Alma, 55 to 64 year old males and 55 to 64 year old females are the most vulnerable to poverty, with 22 males (59.5%) and 17 females (100.0%) in their respective age groups living below the poverty level.
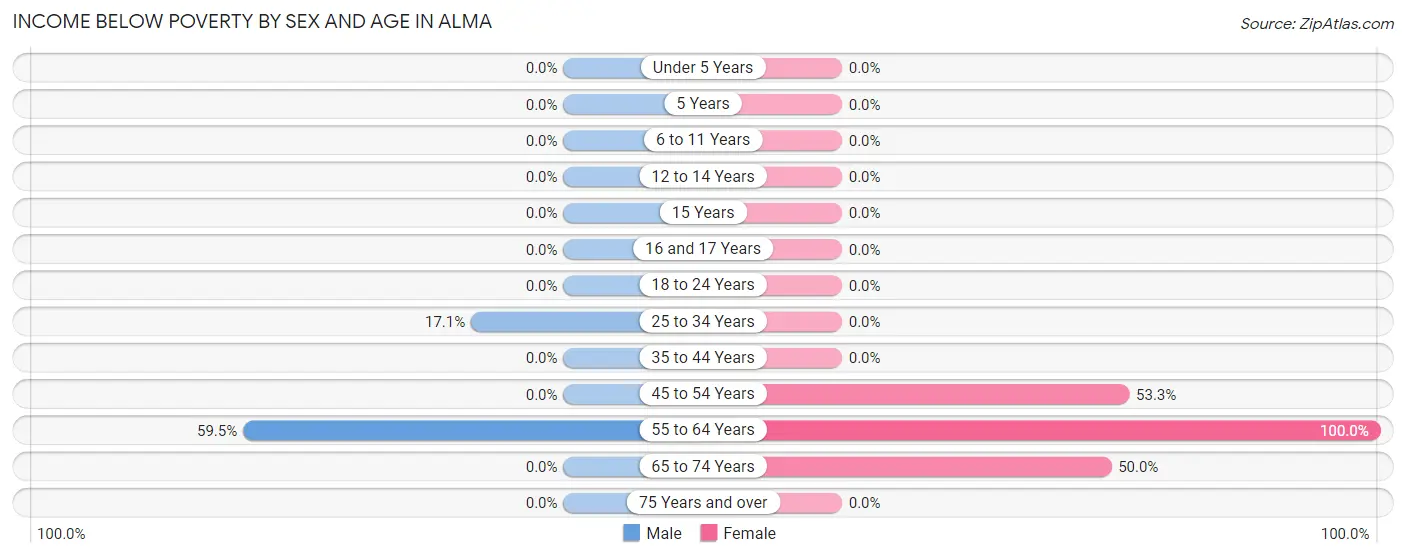
| Age Bracket | Male | Female |
| Under 5 Years | 0 (0.0%) | 0 (0.0%) |
| 5 Years | 0 (0.0%) | 0 (0.0%) |
| 6 to 11 Years | 0 (0.0%) | 0 (0.0%) |
| 12 to 14 Years | 0 (0.0%) | 0 (0.0%) |
| 15 Years | 0 (0.0%) | 0 (0.0%) |
| 16 and 17 Years | 0 (0.0%) | 0 (0.0%) |
| 18 to 24 Years | 0 (0.0%) | 0 (0.0%) |
| 25 to 34 Years | 6 (17.1%) | 0 (0.0%) |
| 35 to 44 Years | 0 (0.0%) | 0 (0.0%) |
| 45 to 54 Years | 0 (0.0%) | 24 (53.3%) |
| 55 to 64 Years | 22 (59.5%) | 17 (100.0%) |
| 65 to 74 Years | 0 (0.0%) | 7 (50.0%) |
| 75 Years and over | 0 (0.0%) | 0 (0.0%) |
| Total | 28 (13.0%) | 48 (26.7%) |
Income Above Poverty by Sex and Age in Alma
According to the poverty statistics in Alma, males aged 12 to 14 years and females aged 12 to 14 years are the age groups that are most secure financially, with 100.0% of males and 100.0% of females in these age groups living above the poverty line.
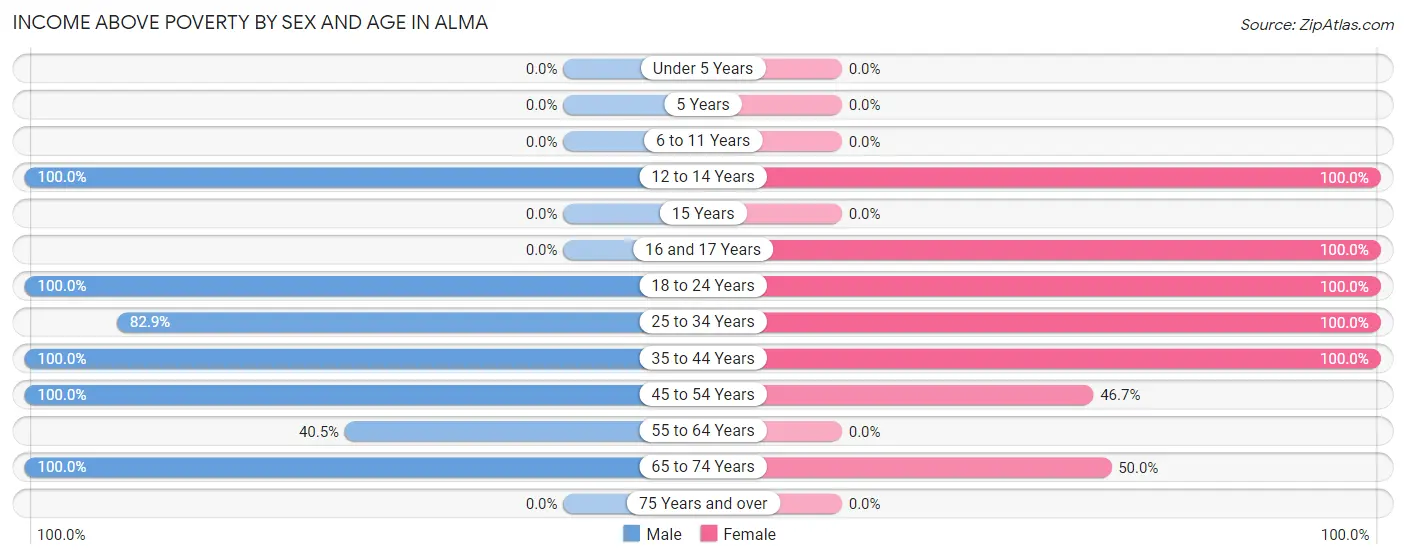
| Age Bracket | Male | Female |
| Under 5 Years | 0 (0.0%) | 0 (0.0%) |
| 5 Years | 0 (0.0%) | 0 (0.0%) |
| 6 to 11 Years | 0 (0.0%) | 0 (0.0%) |
| 12 to 14 Years | 31 (100.0%) | 17 (100.0%) |
| 15 Years | 0 (0.0%) | 0 (0.0%) |
| 16 and 17 Years | 0 (0.0%) | 14 (100.0%) |
| 18 to 24 Years | 32 (100.0%) | 46 (100.0%) |
| 25 to 34 Years | 29 (82.9%) | 13 (100.0%) |
| 35 to 44 Years | 35 (100.0%) | 14 (100.0%) |
| 45 to 54 Years | 41 (100.0%) | 21 (46.7%) |
| 55 to 64 Years | 15 (40.5%) | 0 (0.0%) |
| 65 to 74 Years | 5 (100.0%) | 7 (50.0%) |
| 75 Years and over | 0 (0.0%) | 0 (0.0%) |
| Total | 188 (87.0%) | 132 (73.3%) |
Income Below Poverty Among Married-Couple Families in Alma
The poverty statistics for married-couple families in Alma show that 26.2% or 17 of the total 65 families live below the poverty line. Families with no children have the highest poverty rate of 39.5%, comprising of 17 families. On the other hand, families with 1 or 2 children have the lowest poverty rate of 0.0%, which includes 0 families.
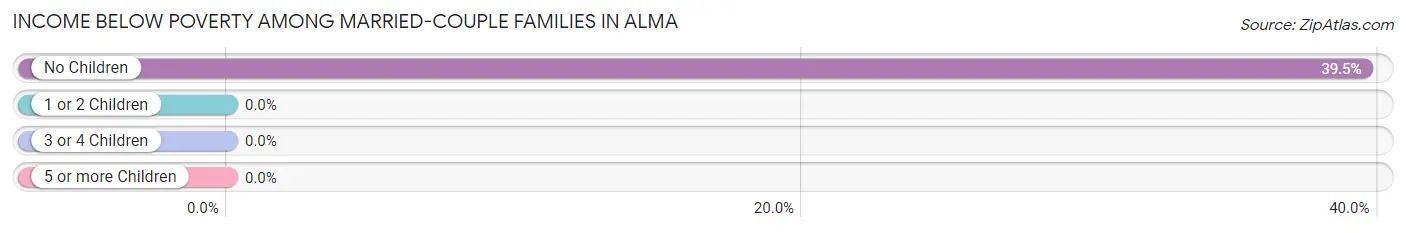
| Children | Above Poverty | Below Poverty |
| No Children | 26 (60.5%) | 17 (39.5%) |
| 1 or 2 Children | 22 (100.0%) | 0 (0.0%) |
| 3 or 4 Children | 0 (0.0%) | 0 (0.0%) |
| 5 or more Children | 0 (0.0%) | 0 (0.0%) |
| Total | 48 (73.9%) | 17 (26.2%) |
Income Below Poverty Among Single-Parent Households in Alma
| Children | Single Father | Single Mother |
| No Children | 0 (0.0%) | 0 (0.0%) |
| 1 or 2 Children | 0 (0.0%) | 0 (0.0%) |
| 3 or 4 Children | 0 (0.0%) | 0 (0.0%) |
| 5 or more Children | 0 (0.0%) | 0 (0.0%) |
| Total | 0 (0.0%) | 0 (0.0%) |
Income Below Poverty Among Married-Couple vs Single-Parent Households in Alma
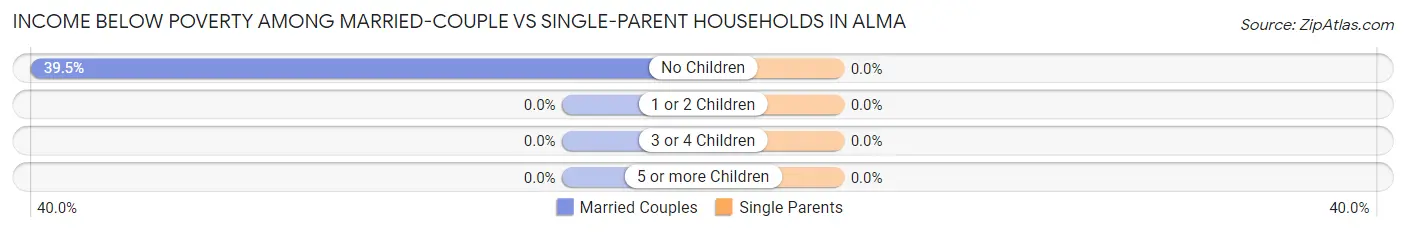
| Children | Married-Couple Families | Single-Parent Households |
| No Children | 17 (39.5%) | 0 (0.0%) |
| 1 or 2 Children | 0 (0.0%) | 0 (0.0%) |
| 3 or 4 Children | 0 (0.0%) | 0 (0.0%) |
| 5 or more Children | 0 (0.0%) | 0 (0.0%) |
| Total | 17 (26.2%) | 0 (0.0%) |
Race in Alma
The most populous races in Alma are White / Caucasian (365 | 92.2%), Hispanic or Latino (31 | 7.8%), and Two or more Races (31 | 7.8%).
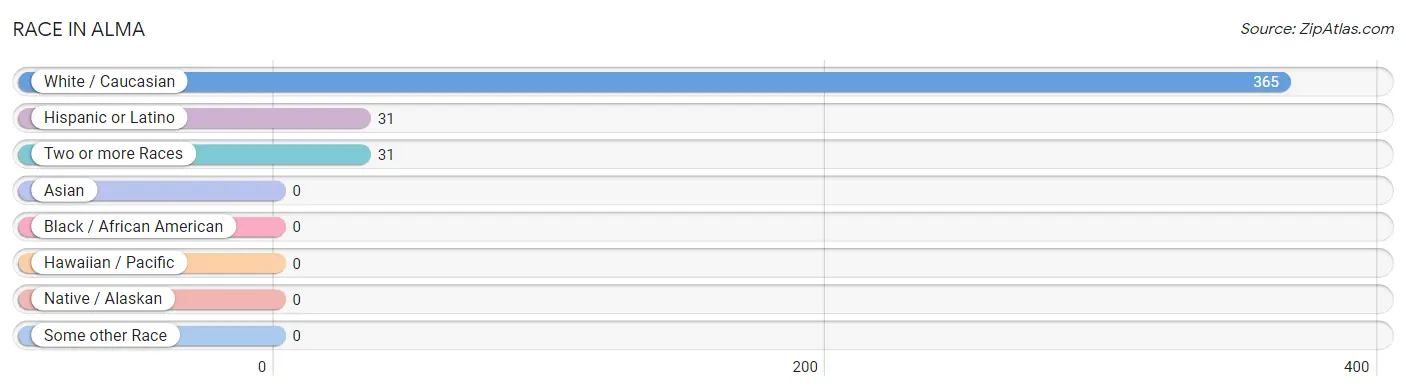
| Race | # Population | % Population |
| Asian | 0 | 0.0% |
| Black / African American | 0 | 0.0% |
| Hawaiian / Pacific | 0 | 0.0% |
| Hispanic or Latino | 31 | 7.8% |
| Native / Alaskan | 0 | 0.0% |
| White / Caucasian | 365 | 92.2% |
| Two or more Races | 31 | 7.8% |
| Some other Race | 0 | 0.0% |
| Total | 396 | 100.0% |
Ancestry in Alma
The most populous ancestries reported in Alma are Irish (76 | 19.2%), Scotch-Irish (33 | 8.3%), German (32 | 8.1%), Eastern European (31 | 7.8%), and European (27 | 6.8%), together accounting for 50.2% of all Alma residents.
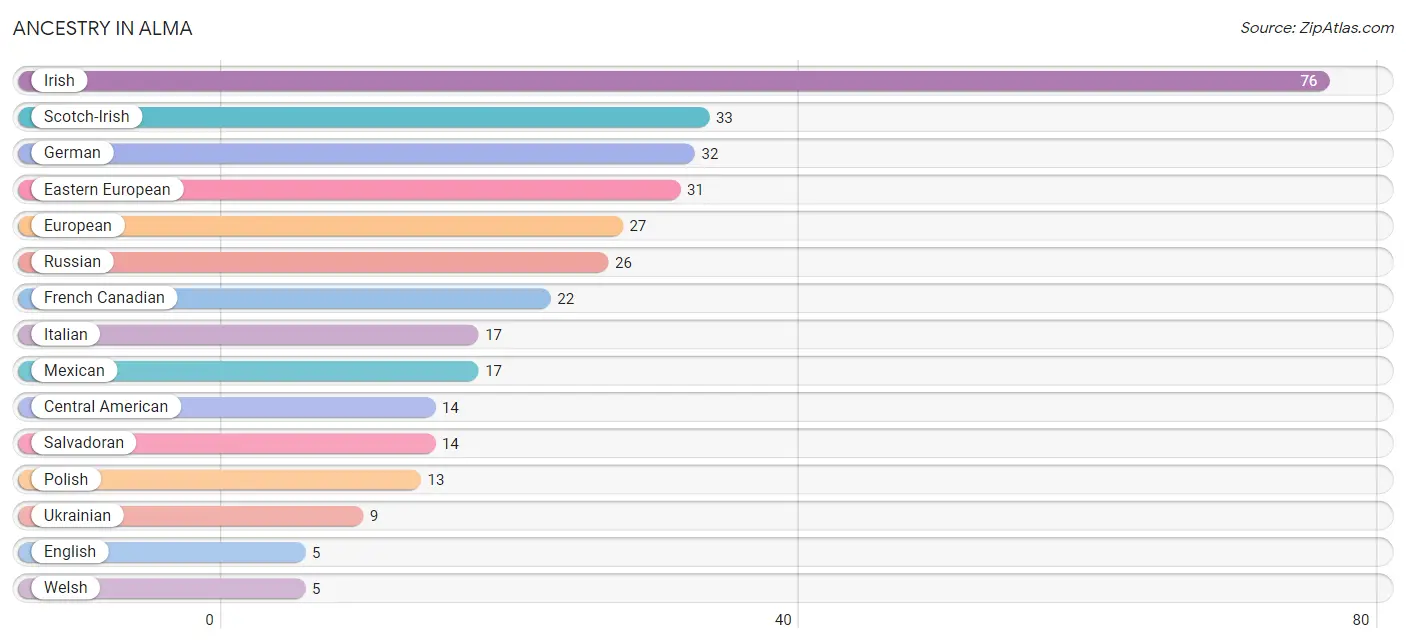
| Ancestry | # Population | % Population |
| Central American | 14 | 3.5% |
| Eastern European | 31 | 7.8% |
| English | 5 | 1.3% |
| European | 27 | 6.8% |
| French | 4 | 1.0% |
| French Canadian | 22 | 5.6% |
| German | 32 | 8.1% |
| Irish | 76 | 19.2% |
| Italian | 17 | 4.3% |
| Mexican | 17 | 4.3% |
| Polish | 13 | 3.3% |
| Russian | 26 | 6.6% |
| Salvadoran | 14 | 3.5% |
| Scotch-Irish | 33 | 8.3% |
| Ukrainian | 9 | 2.3% |
| Welsh | 5 | 1.3% | View All 16 Rows |
Immigrants in Alma
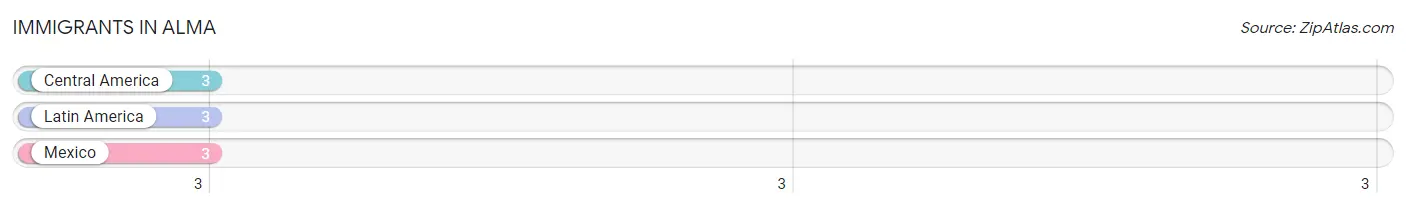
The most numerous immigrant groups reported in Alma came from Central America (3 | 0.8%), Latin America (3 | 0.8%), and Mexico (3 | 0.8%), together accounting for 2.3% of all Alma residents.
| Immigration Origin | # Population | % Population |
| Central America | 3 | 0.8% |
| Latin America | 3 | 0.8% |
| Mexico | 3 | 0.8% | View All 3 Rows |
Sex and Age in Alma
Sex and Age in Alma
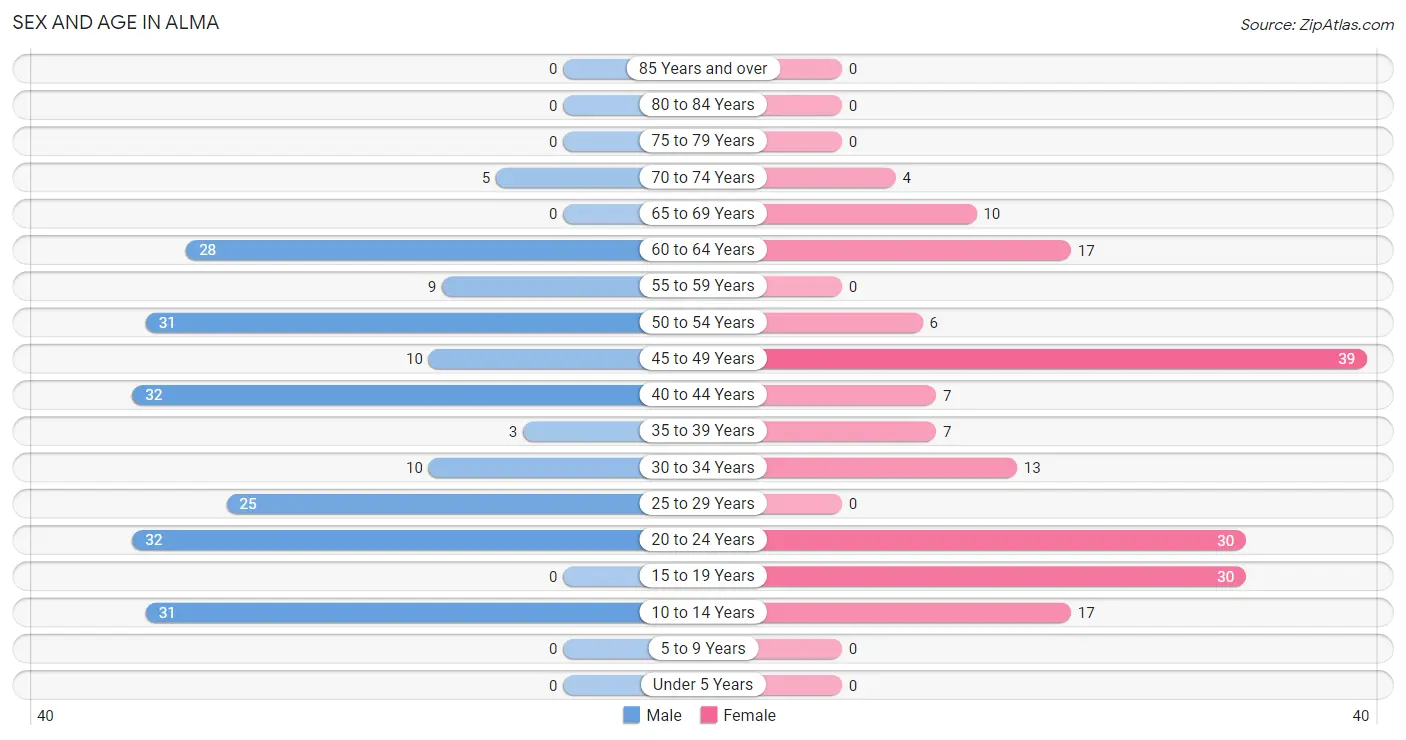
The most populous age groups in Alma are 20 to 24 Years (32 | 14.8%) for men and 45 to 49 Years (39 | 21.7%) for women.
| Age Bracket | Male | Female |
| Under 5 Years | 0 (0.0%) | 0 (0.0%) |
| 5 to 9 Years | 0 (0.0%) | 0 (0.0%) |
| 10 to 14 Years | 31 (14.3%) | 17 (9.4%) |
| 15 to 19 Years | 0 (0.0%) | 30 (16.7%) |
| 20 to 24 Years | 32 (14.8%) | 30 (16.7%) |
| 25 to 29 Years | 25 (11.6%) | 0 (0.0%) |
| 30 to 34 Years | 10 (4.6%) | 13 (7.2%) |
| 35 to 39 Years | 3 (1.4%) | 7 (3.9%) |
| 40 to 44 Years | 32 (14.8%) | 7 (3.9%) |
| 45 to 49 Years | 10 (4.6%) | 39 (21.7%) |
| 50 to 54 Years | 31 (14.3%) | 6 (3.3%) |
| 55 to 59 Years | 9 (4.2%) | 0 (0.0%) |
| 60 to 64 Years | 28 (13.0%) | 17 (9.4%) |
| 65 to 69 Years | 0 (0.0%) | 10 (5.6%) |
| 70 to 74 Years | 5 (2.3%) | 4 (2.2%) |
| 75 to 79 Years | 0 (0.0%) | 0 (0.0%) |
| 80 to 84 Years | 0 (0.0%) | 0 (0.0%) |
| 85 Years and over | 0 (0.0%) | 0 (0.0%) |
| Total | 216 (100.0%) | 180 (100.0%) |
Families and Households in Alma
Median Family Size in Alma
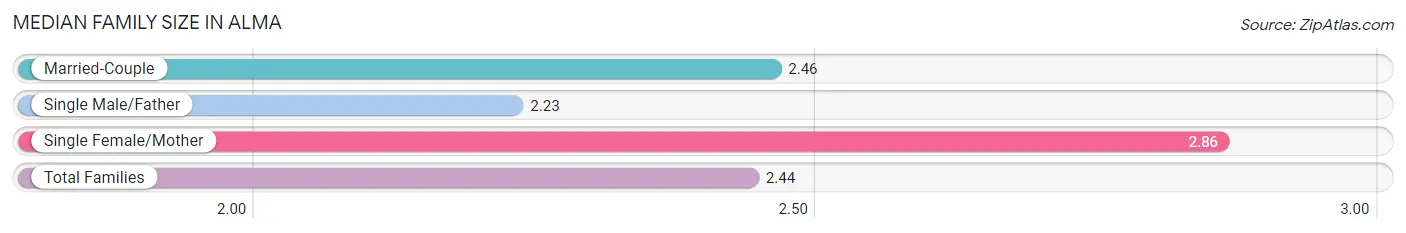
The median family size in Alma is 2.44 persons per family, with single female/mother families (7 | 7.4%) accounting for the largest median family size of 2.86 persons per family. On the other hand, single male/father families (22 | 23.4%) represent the smallest median family size with 2.23 persons per family.
| Family Type | # Families | Family Size |
| Married-Couple | 65 (69.2%) | 2.46 |
| Single Male/Father | 22 (23.4%) | 2.23 |
| Single Female/Mother | 7 (7.4%) | 2.86 |
| Total Families | 94 (100.0%) | 2.44 |
Median Household Size in Alma
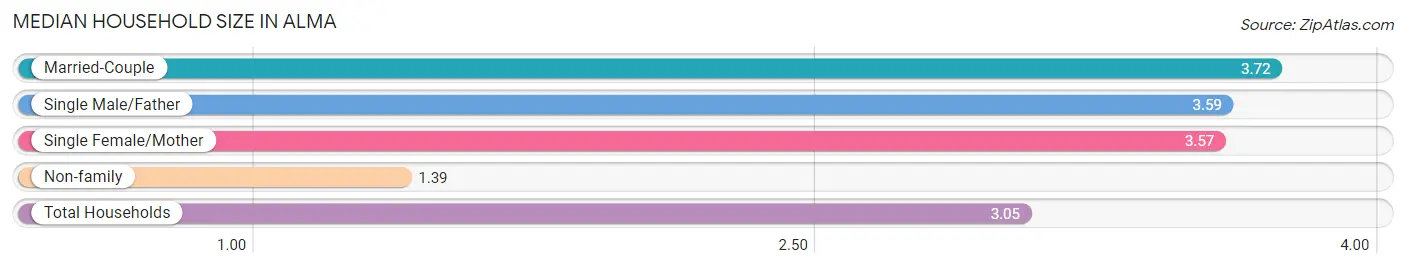
The median household size in Alma is 3.05 persons per household, with married-couple households (65 | 50.0%) accounting for the largest median household size of 3.72 persons per household. non-family households (36 | 27.7%) represent the smallest median household size with 1.39 persons per household.
| Household Type | # Households | Household Size |
| Married-Couple | 65 (50.0%) | 3.72 |
| Single Male/Father | 22 (16.9%) | 3.59 |
| Single Female/Mother | 7 (5.4%) | 3.57 |
| Non-family | 36 (27.7%) | 1.39 |
| Total Households | 130 (100.0%) | 3.05 |
Household Size by Marriage Status in Alma
Out of a total of 130 households in Alma, 94 (72.3%) are family households, while 36 (27.7%) are nonfamily households. The most numerous type of family households are 3-person households, comprising 42, and the most common type of nonfamily households are 1-person households, comprising 22.
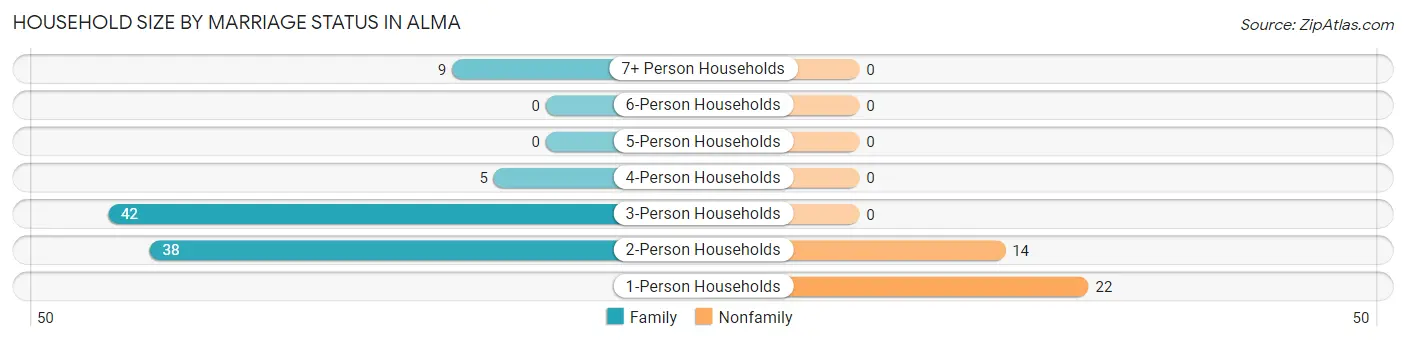
| Household Size | Family Households | Nonfamily Households |
| 1-Person Households | - | 22 (16.9%) |
| 2-Person Households | 38 (29.2%) | 14 (10.8%) |
| 3-Person Households | 42 (32.3%) | 0 (0.0%) |
| 4-Person Households | 5 (3.8%) | 0 (0.0%) |
| 5-Person Households | 0 (0.0%) | 0 (0.0%) |
| 6-Person Households | 0 (0.0%) | 0 (0.0%) |
| 7+ Person Households | 9 (6.9%) | 0 (0.0%) |
| Total | 94 (72.3%) | 36 (27.7%) |
Female Fertility in Alma
Fertility by Age in Alma
| Age Bracket | Women with Births | Births / 1,000 Women |
| 15 to 19 years | 0 (0.0%) | 0.0 |
| 20 to 34 years | 0 (0.0%) | 0.0 |
| 35 to 50 years | 0 (0.0%) | 0.0 |
| Total | 0 (0.0%) | 0.0 |
Fertility by Age by Marriage Status in Alma
| Age Bracket | Married | Unmarried |
| 15 to 19 years | 0 (0.0%) | 0 (0.0%) |
| 20 to 34 years | 0 (0.0%) | 0 (0.0%) |
| 35 to 50 years | 0 (0.0%) | 0 (0.0%) |
| Total | 0 (0.0%) | 0 (0.0%) |
Fertility by Education in Alma
| Educational Attainment | Women with Births | Births / 1,000 Women |
| Less than High School | 0 (0.0%) | 0.0 |
| High School Diploma | 0 (0.0%) | 0.0 |
| College or Associate's Degree | 0 (0.0%) | 0.0 |
| Bachelor's Degree | 0 (0.0%) | 0.0 |
| Graduate Degree | 0 (0.0%) | 0.0 |
| Total | 0 (0.0%) | 0.0 |
Fertility by Education by Marriage Status in Alma
| Educational Attainment | Married | Unmarried |
| Less than High School | 0 (0.0%) | 0 (0.0%) |
| High School Diploma | 0 (0.0%) | 0 (0.0%) |
| College or Associate's Degree | 0 (0.0%) | 0 (0.0%) |
| Bachelor's Degree | 0 (0.0%) | 0 (0.0%) |
| Graduate Degree | 0 (0.0%) | 0 (0.0%) |
| Total | 0 (0.0%) | 0 (0.0%) |
Employment Characteristics in Alma
Employment by Class of Employer in Alma
Among the 236 employed individuals in Alma, private company employees (172 | 72.9%), self-employed (not incorporated) (25 | 10.6%), and local government employees (19 | 8.1%) make up the most common classes of employment.
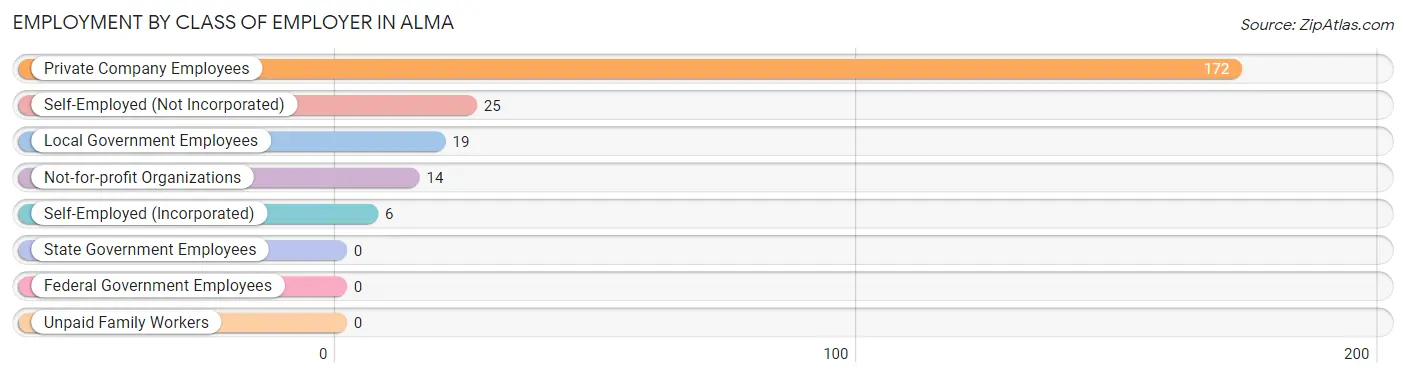
| Employer Class | # Employees | % Employees |
| Private Company Employees | 172 | 72.9% |
| Self-Employed (Incorporated) | 6 | 2.5% |
| Self-Employed (Not Incorporated) | 25 | 10.6% |
| Not-for-profit Organizations | 14 | 5.9% |
| Local Government Employees | 19 | 8.1% |
| State Government Employees | 0 | 0.0% |
| Federal Government Employees | 0 | 0.0% |
| Unpaid Family Workers | 0 | 0.0% |
| Total | 236 | 100.0% |
Employment Status by Age in Alma
According to the labor force statistics for Alma, out of the total population over 16 years of age (348), 71.8% or 250 individuals are in the labor force, with 5.6% or 14 of them unemployed. The age group with the highest labor force participation rate is 20 to 24 years, with 100.0% or 62 individuals in the labor force. Within the labor force, the 20 to 24 years age range has the highest percentage of unemployed individuals, with 22.6% or 14 of them being unemployed.
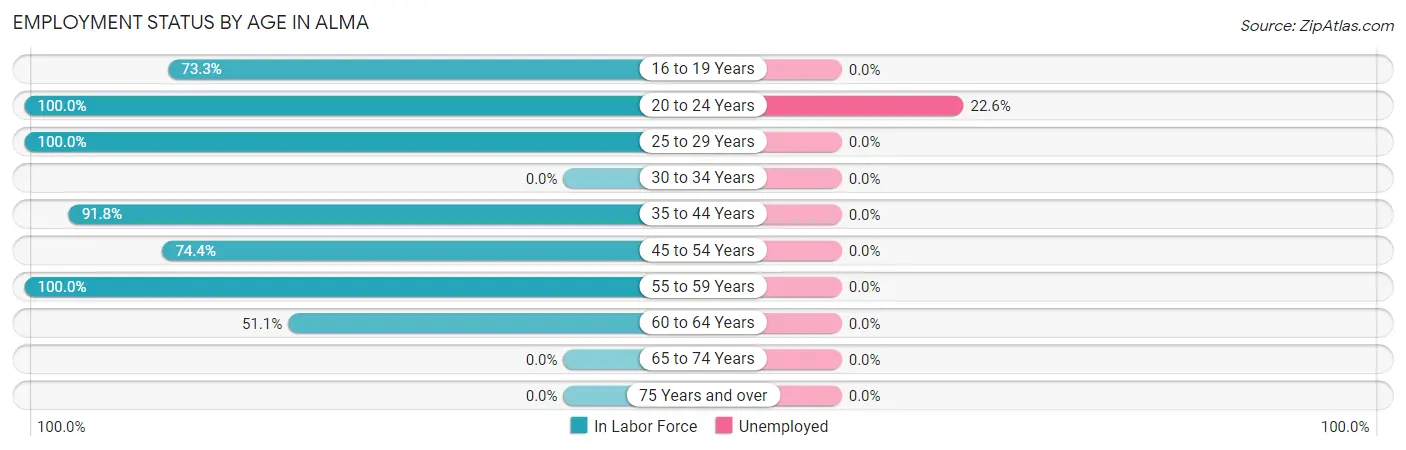
| Age Bracket | In Labor Force | Unemployed |
| 16 to 19 Years | 22 (73.3%) | 0 (0.0%) |
| 20 to 24 Years | 62 (100.0%) | 14 (22.6%) |
| 25 to 29 Years | 25 (100.0%) | 0 (0.0%) |
| 30 to 34 Years | 0 (0.0%) | 0 (0.0%) |
| 35 to 44 Years | 45 (91.8%) | 0 (0.0%) |
| 45 to 54 Years | 64 (74.4%) | 0 (0.0%) |
| 55 to 59 Years | 9 (100.0%) | 0 (0.0%) |
| 60 to 64 Years | 23 (51.1%) | 0 (0.0%) |
| 65 to 74 Years | 0 (0.0%) | 0 (0.0%) |
| 75 Years and over | 0 (0.0%) | 0 (0.0%) |
| Total | 250 (71.8%) | 14 (5.6%) |
Employment Status by Educational Attainment in Alma
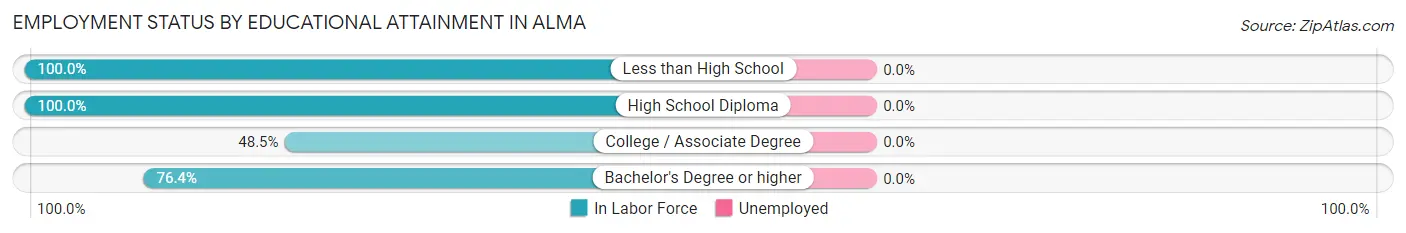
| Educational Attainment | In Labor Force | Unemployed |
| Less than High School | 3 (100.0%) | 0 (0.0%) |
| High School Diploma | 48 (100.0%) | 0 (0.0%) |
| College / Associate Degree | 47 (48.5%) | 0 (0.0%) |
| Bachelor's Degree or higher | 68 (76.4%) | 0 (0.0%) |
| Total | 166 (70.0%) | 0 (0.0%) |
Employment Occupations by Sex in Alma
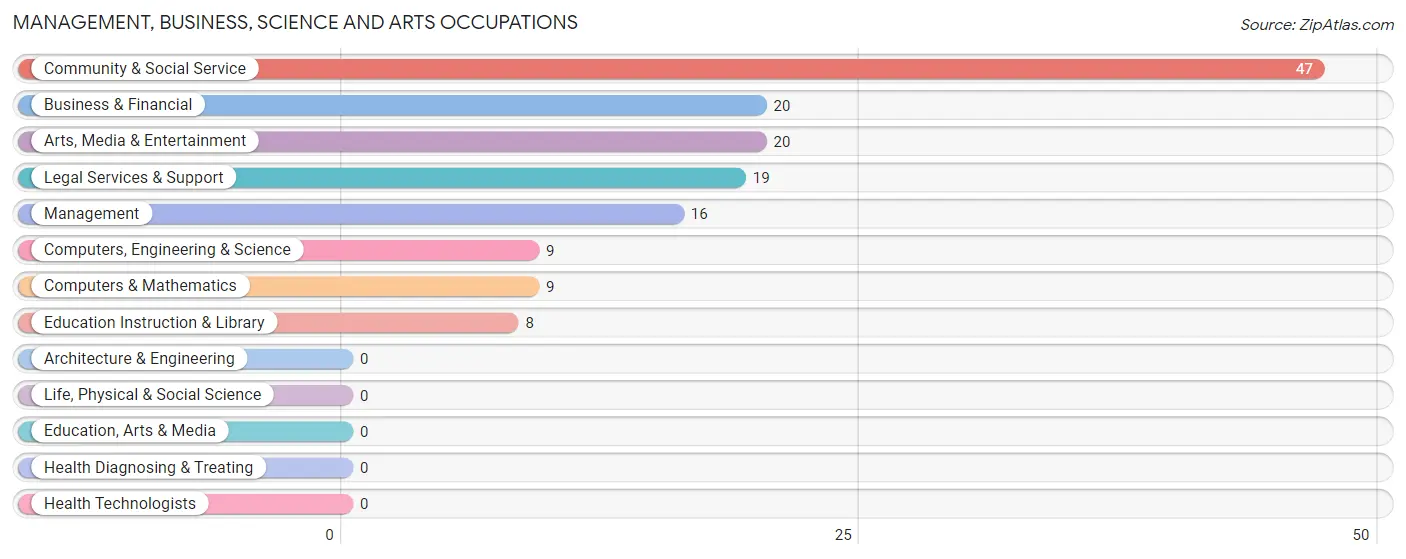
Management, Business, Science and Arts Occupations
The most common Management, Business, Science and Arts occupations in Alma are Community & Social Service (47 | 19.9%), Business & Financial (20 | 8.5%), Arts, Media & Entertainment (20 | 8.5%), Legal Services & Support (19 | 8.1%), and Management (16 | 6.8%).
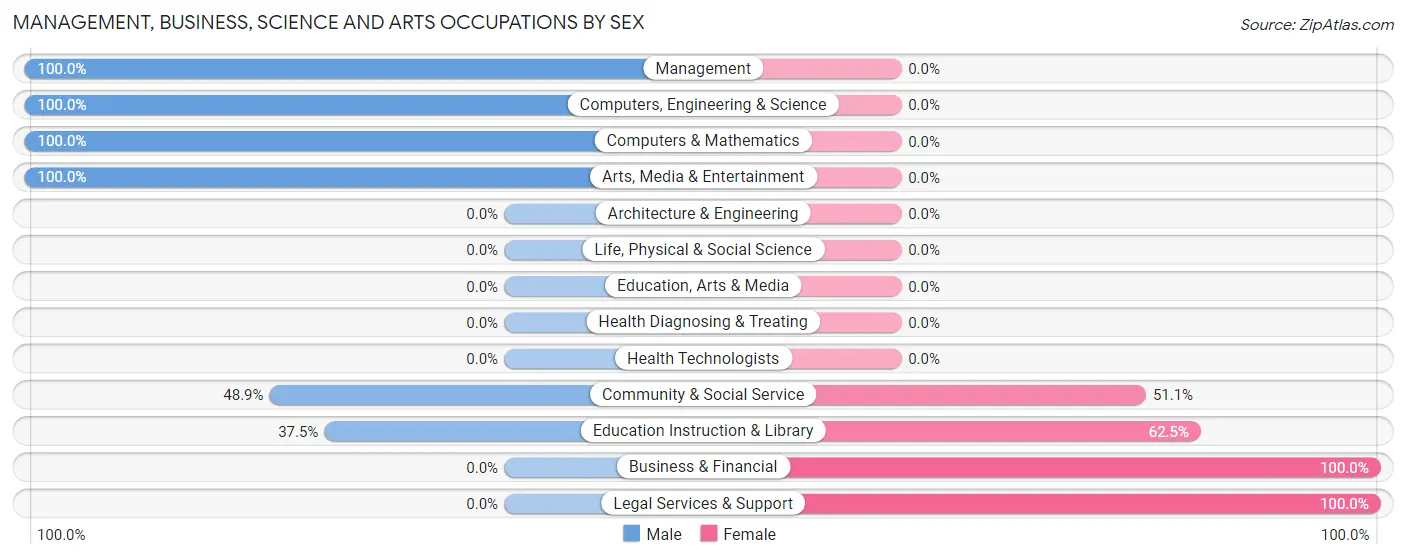
Management, Business, Science and Arts Occupations by Sex
Within the Management, Business, Science and Arts occupations in Alma, the most male-oriented occupations are Management (100.0%), Computers, Engineering & Science (100.0%), and Computers & Mathematics (100.0%), while the most female-oriented occupations are Business & Financial (100.0%), Legal Services & Support (100.0%), and Education Instruction & Library (62.5%).
| Occupation | Male | Female |
| Management | 16 (100.0%) | 0 (0.0%) |
| Business & Financial | 0 (0.0%) | 20 (100.0%) |
| Computers, Engineering & Science | 9 (100.0%) | 0 (0.0%) |
| Computers & Mathematics | 9 (100.0%) | 0 (0.0%) |
| Architecture & Engineering | 0 (0.0%) | 0 (0.0%) |
| Life, Physical & Social Science | 0 (0.0%) | 0 (0.0%) |
| Community & Social Service | 23 (48.9%) | 24 (51.1%) |
| Education, Arts & Media | 0 (0.0%) | 0 (0.0%) |
| Legal Services & Support | 0 (0.0%) | 19 (100.0%) |
| Education Instruction & Library | 3 (37.5%) | 5 (62.5%) |
| Arts, Media & Entertainment | 20 (100.0%) | 0 (0.0%) |
| Health Diagnosing & Treating | 0 (0.0%) | 0 (0.0%) |
| Health Technologists | 0 (0.0%) | 0 (0.0%) |
| Total (Category) | 48 (52.2%) | 44 (47.8%) |
| Total (Overall) | 112 (47.5%) | 124 (52.5%) |
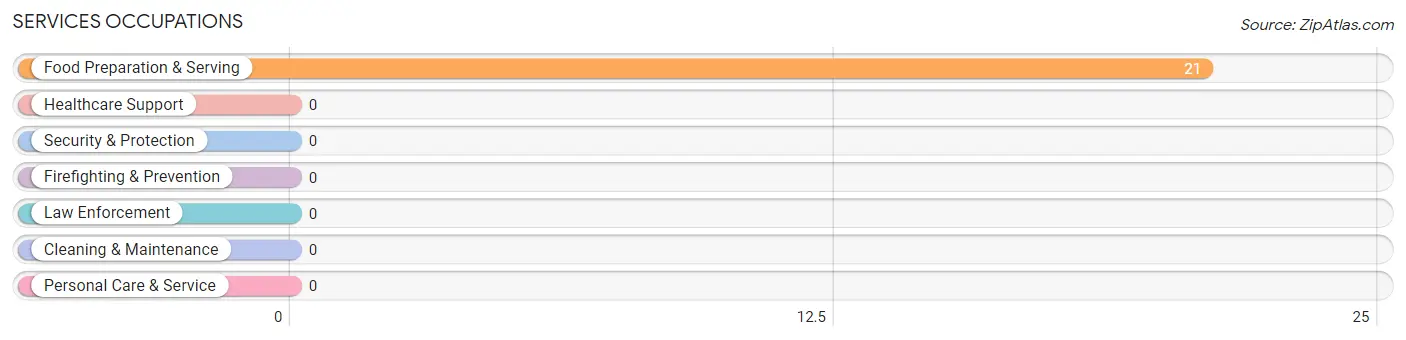
Services Occupations
The most common Services occupations in Alma are , and Food Preparation & Serving (21 | 8.9%).
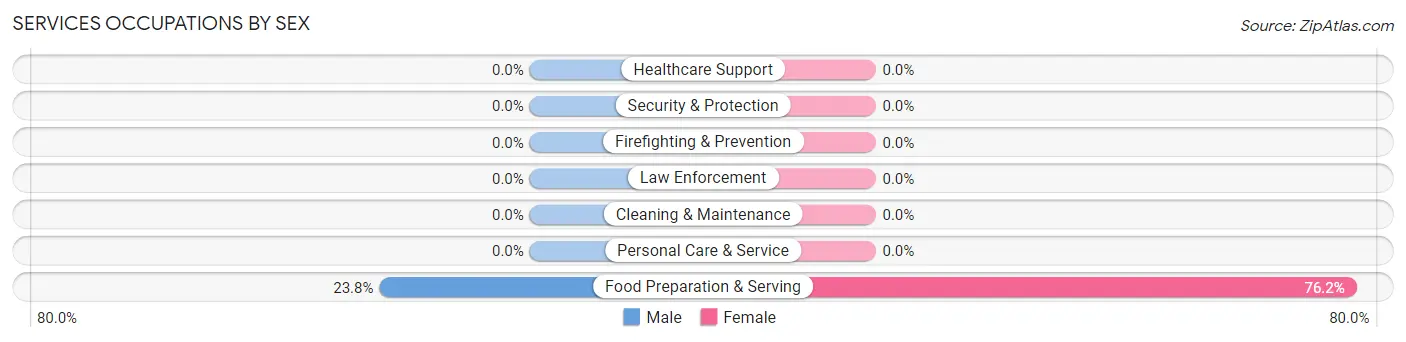
Services Occupations by Sex
| Occupation | Male | Female |
| Healthcare Support | 0 (0.0%) | 0 (0.0%) |
| Security & Protection | 0 (0.0%) | 0 (0.0%) |
| Firefighting & Prevention | 0 (0.0%) | 0 (0.0%) |
| Law Enforcement | 0 (0.0%) | 0 (0.0%) |
| Food Preparation & Serving | 5 (23.8%) | 16 (76.2%) |
| Cleaning & Maintenance | 0 (0.0%) | 0 (0.0%) |
| Personal Care & Service | 0 (0.0%) | 0 (0.0%) |
| Total (Category) | 5 (23.8%) | 16 (76.2%) |
| Total (Overall) | 112 (47.5%) | 124 (52.5%) |
Sales and Office Occupations
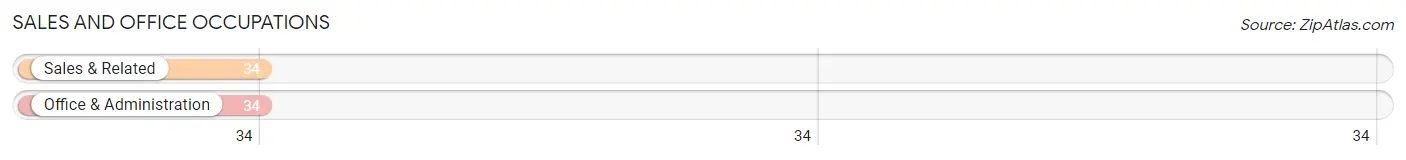
The most common Sales and Office occupations in Alma are Sales & Related (34 | 14.4%), and Office & Administration (34 | 14.4%).
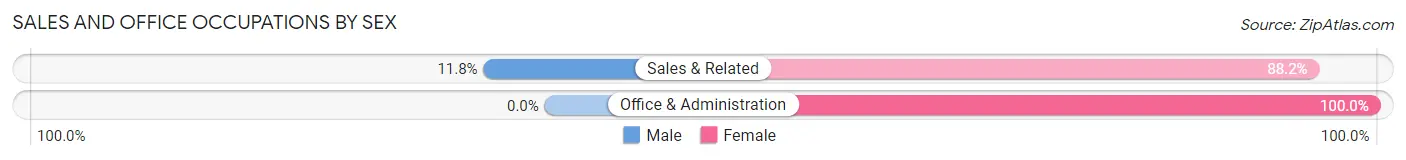
Sales and Office Occupations by Sex
| Occupation | Male | Female |
| Sales & Related | 4 (11.8%) | 30 (88.2%) |
| Office & Administration | 0 (0.0%) | 34 (100.0%) |
| Total (Category) | 4 (5.9%) | 64 (94.1%) |
| Total (Overall) | 112 (47.5%) | 124 (52.5%) |
Natural Resources, Construction and Maintenance Occupations
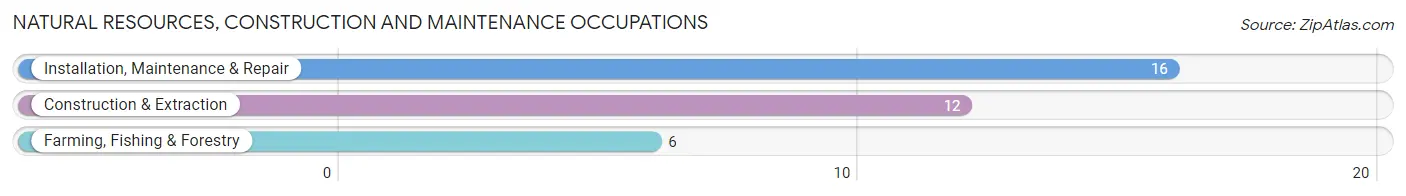
The most common Natural Resources, Construction and Maintenance occupations in Alma are Installation, Maintenance & Repair (16 | 6.8%), Construction & Extraction (12 | 5.1%), and Farming, Fishing & Forestry (6 | 2.5%).
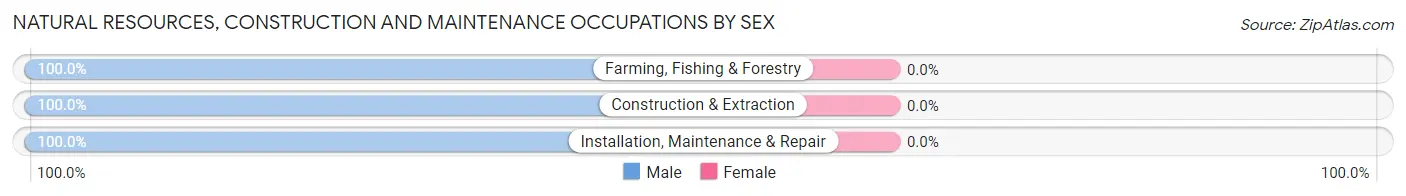
Natural Resources, Construction and Maintenance Occupations by Sex
| Occupation | Male | Female |
| Farming, Fishing & Forestry | 6 (100.0%) | 0 (0.0%) |
| Construction & Extraction | 12 (100.0%) | 0 (0.0%) |
| Installation, Maintenance & Repair | 16 (100.0%) | 0 (0.0%) |
| Total (Category) | 34 (100.0%) | 0 (0.0%) |
| Total (Overall) | 112 (47.5%) | 124 (52.5%) |
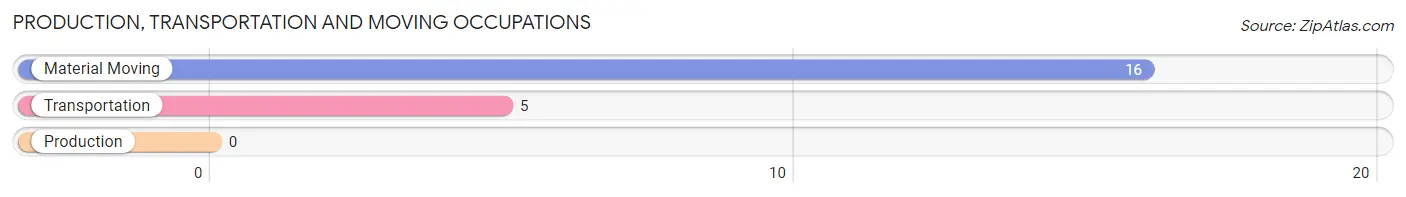
Production, Transportation and Moving Occupations
The most common Production, Transportation and Moving occupations in Alma are Material Moving (16 | 6.8%), and Transportation (5 | 2.1%).
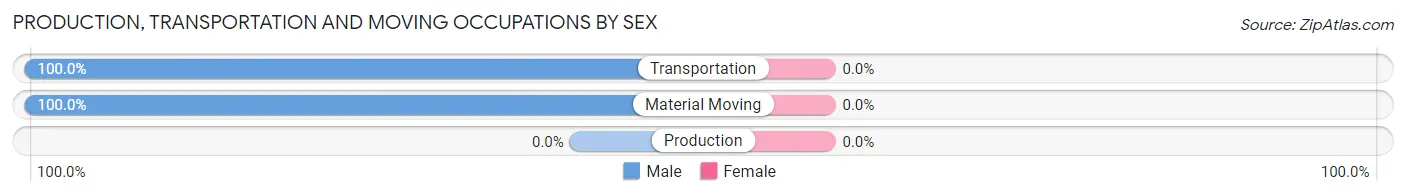
Production, Transportation and Moving Occupations by Sex
| Occupation | Male | Female |
| Production | 0 (0.0%) | 0 (0.0%) |
| Transportation | 5 (100.0%) | 0 (0.0%) |
| Material Moving | 16 (100.0%) | 0 (0.0%) |
| Total (Category) | 21 (100.0%) | 0 (0.0%) |
| Total (Overall) | 112 (47.5%) | 124 (52.5%) |
Employment Industries by Sex in Alma
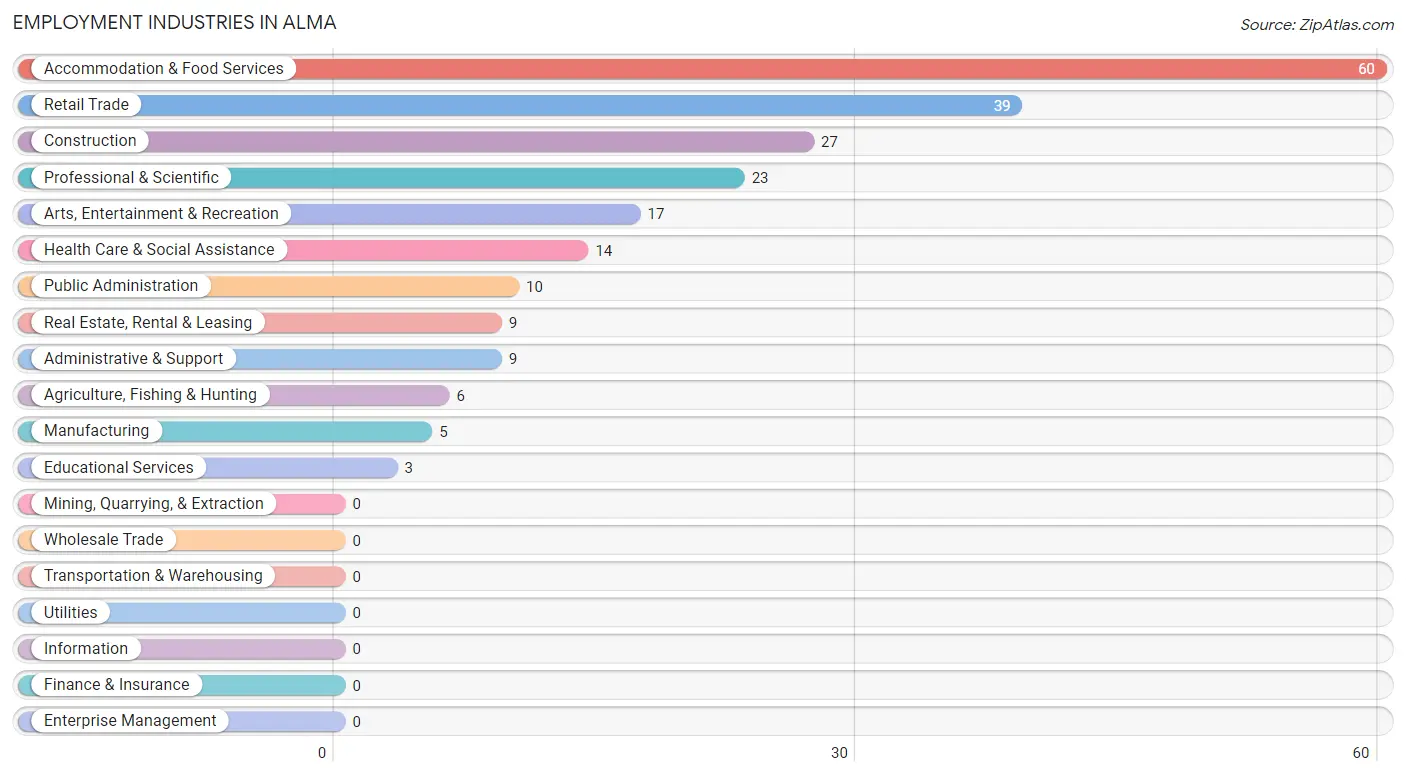
Employment Industries in Alma
The major employment industries in Alma include Accommodation & Food Services (60 | 25.4%), Retail Trade (39 | 16.5%), Construction (27 | 11.4%), Professional & Scientific (23 | 9.8%), and Arts, Entertainment & Recreation (17 | 7.2%).
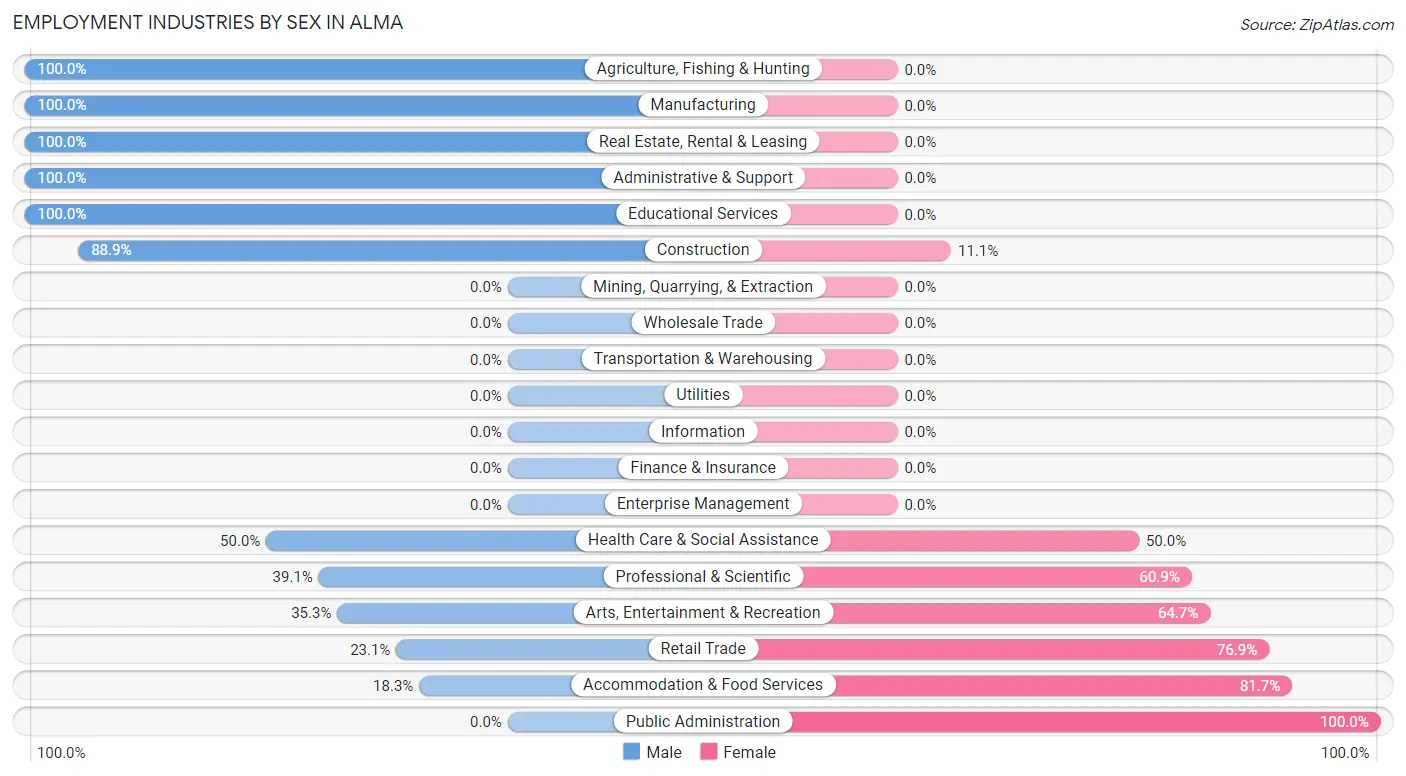
Employment Industries by Sex in Alma
The Alma industries that see more men than women are Agriculture, Fishing & Hunting (100.0%), Manufacturing (100.0%), and Real Estate, Rental & Leasing (100.0%), whereas the industries that tend to have a higher number of women are Public Administration (100.0%), Accommodation & Food Services (81.7%), and Retail Trade (76.9%).
| Industry | Male | Female |
| Agriculture, Fishing & Hunting | 6 (100.0%) | 0 (0.0%) |
| Mining, Quarrying, & Extraction | 0 (0.0%) | 0 (0.0%) |
| Construction | 24 (88.9%) | 3 (11.1%) |
| Manufacturing | 5 (100.0%) | 0 (0.0%) |
| Wholesale Trade | 0 (0.0%) | 0 (0.0%) |
| Retail Trade | 9 (23.1%) | 30 (76.9%) |
| Transportation & Warehousing | 0 (0.0%) | 0 (0.0%) |
| Utilities | 0 (0.0%) | 0 (0.0%) |
| Information | 0 (0.0%) | 0 (0.0%) |
| Finance & Insurance | 0 (0.0%) | 0 (0.0%) |
| Real Estate, Rental & Leasing | 9 (100.0%) | 0 (0.0%) |
| Professional & Scientific | 9 (39.1%) | 14 (60.9%) |
| Enterprise Management | 0 (0.0%) | 0 (0.0%) |
| Administrative & Support | 9 (100.0%) | 0 (0.0%) |
| Educational Services | 3 (100.0%) | 0 (0.0%) |
| Health Care & Social Assistance | 7 (50.0%) | 7 (50.0%) |
| Arts, Entertainment & Recreation | 6 (35.3%) | 11 (64.7%) |
| Accommodation & Food Services | 11 (18.3%) | 49 (81.7%) |
| Public Administration | 0 (0.0%) | 10 (100.0%) |
| Total | 112 (47.5%) | 124 (52.5%) |
Education in Alma
School Enrollment in Alma
The most common levels of schooling among the 64 students in Alma are middle school (43 | 67.2%), high school (11 | 17.2%), and college / undergraduate (10 | 15.6%).
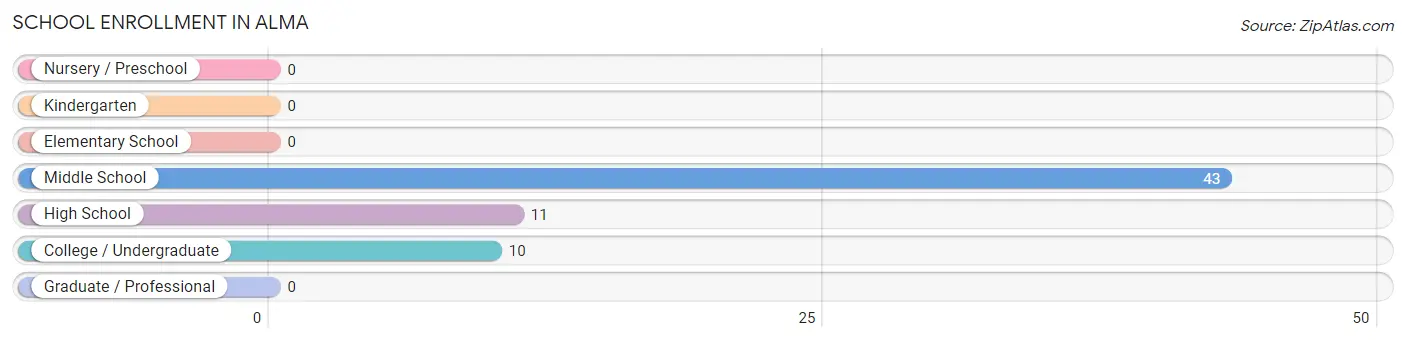
| School Level | # Students | % Students |
| Nursery / Preschool | 0 | 0.0% |
| Kindergarten | 0 | 0.0% |
| Elementary School | 0 | 0.0% |
| Middle School | 43 | 67.2% |
| High School | 11 | 17.2% |
| College / Undergraduate | 10 | 15.6% |
| Graduate / Professional | 0 | 0.0% |
| Total | 64 | 100.0% |
School Enrollment by Age by Funding Source in Alma
Out of a total of 64 students who are enrolled in schools in Alma, 22 (34.4%) attend a private institution, while the remaining 42 (65.6%) are enrolled in public schools. The age group of 10 to 14 year olds has the highest likelihood of being enrolled in private schools, with 22 (45.8% in the age bracket) enrolled. Conversely, the age group of 15 to 17 year olds has the lowest likelihood of being enrolled in a private school, with 6 (100.0% in the age bracket) attending a public institution.
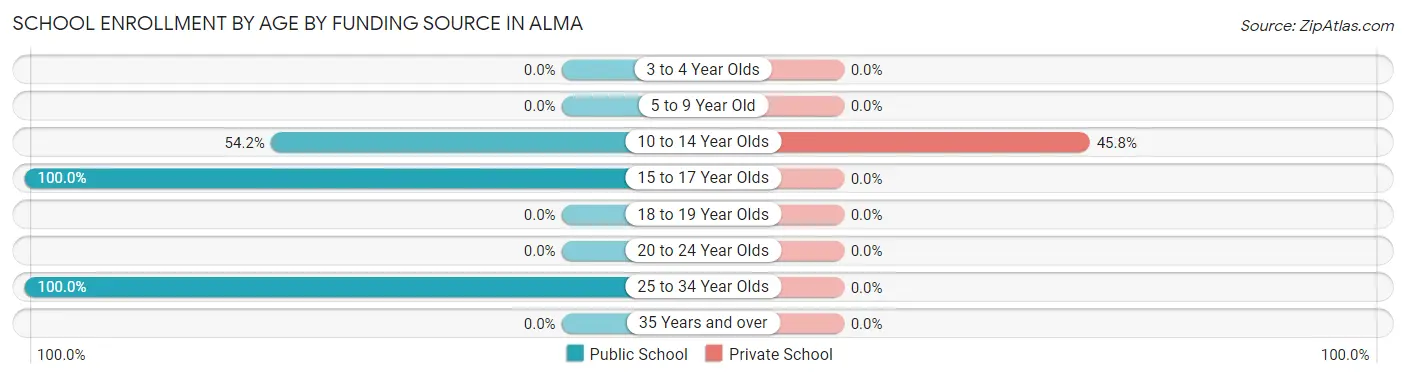
| Age Bracket | Public School | Private School |
| 3 to 4 Year Olds | 0 (0.0%) | 0 (0.0%) |
| 5 to 9 Year Old | 0 (0.0%) | 0 (0.0%) |
| 10 to 14 Year Olds | 26 (54.2%) | 22 (45.8%) |
| 15 to 17 Year Olds | 6 (100.0%) | 0 (0.0%) |
| 18 to 19 Year Olds | 0 (0.0%) | 0 (0.0%) |
| 20 to 24 Year Olds | 0 (0.0%) | 0 (0.0%) |
| 25 to 34 Year Olds | 10 (100.0%) | 0 (0.0%) |
| 35 Years and over | 0 (0.0%) | 0 (0.0%) |
| Total | 42 (65.6%) | 22 (34.4%) |
Educational Attainment by Field of Study in Alma
Literature & languages (45 | 40.9%), business (21 | 19.1%), social sciences (11 | 10.0%), computers & mathematics (9 | 8.2%), and science & technology (7 | 6.4%) are the most common fields of study among 110 individuals in Alma who have obtained a bachelor's degree or higher.
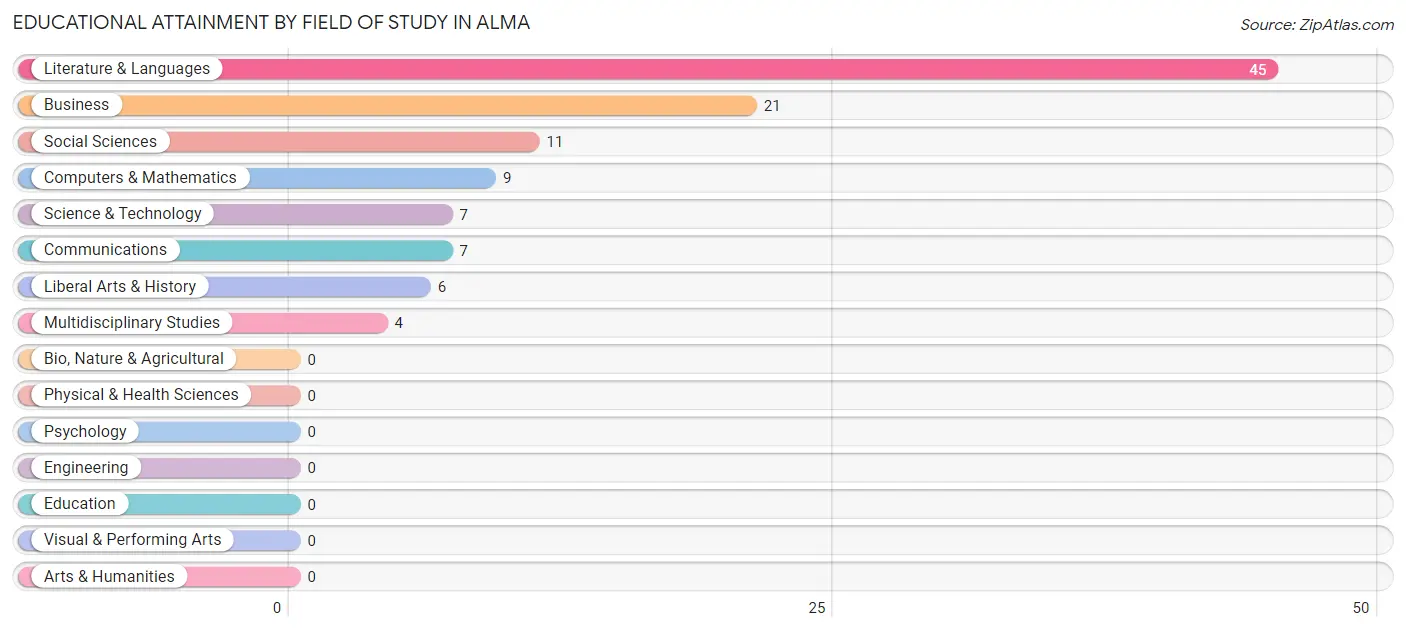
| Field of Study | # Graduates | % Graduates |
| Computers & Mathematics | 9 | 8.2% |
| Bio, Nature & Agricultural | 0 | 0.0% |
| Physical & Health Sciences | 0 | 0.0% |
| Psychology | 0 | 0.0% |
| Social Sciences | 11 | 10.0% |
| Engineering | 0 | 0.0% |
| Multidisciplinary Studies | 4 | 3.6% |
| Science & Technology | 7 | 6.4% |
| Business | 21 | 19.1% |
| Education | 0 | 0.0% |
| Literature & Languages | 45 | 40.9% |
| Liberal Arts & History | 6 | 5.4% |
| Visual & Performing Arts | 0 | 0.0% |
| Communications | 7 | 6.4% |
| Arts & Humanities | 0 | 0.0% |
| Total | 110 | 100.0% |
Transportation & Commute in Alma
Vehicle Availability by Sex in Alma
The most prevalent vehicle ownership categories in Alma are males with 5 or more vehicles (52, accounting for 46.4%) and females with 5 or more vehicles (38, making up 41.9%).
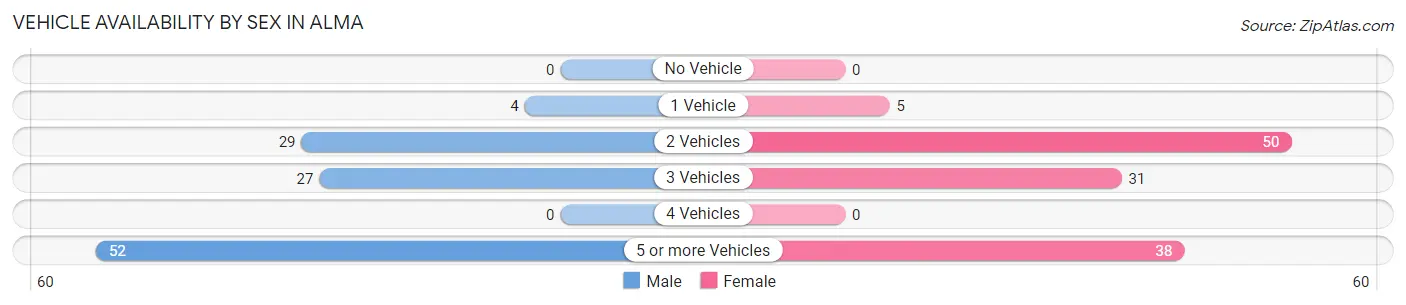
| Vehicles Available | Male | Female |
| No Vehicle | 0 (0.0%) | 0 (0.0%) |
| 1 Vehicle | 4 (3.6%) | 5 (4.0%) |
| 2 Vehicles | 29 (25.9%) | 50 (40.3%) |
| 3 Vehicles | 27 (24.1%) | 31 (25.0%) |
| 4 Vehicles | 0 (0.0%) | 0 (0.0%) |
| 5 or more Vehicles | 52 (46.4%) | 38 (30.6%) |
| Total | 112 (100.0%) | 124 (100.0%) |
Commute Time in Alma
The most frequently occuring commute durations in Alma are 10 to 14 minutes (50 commuters, 27.3%), 45 to 59 minutes (30 commuters, 16.4%), and 90 or more minutes (24 commuters, 13.1%).
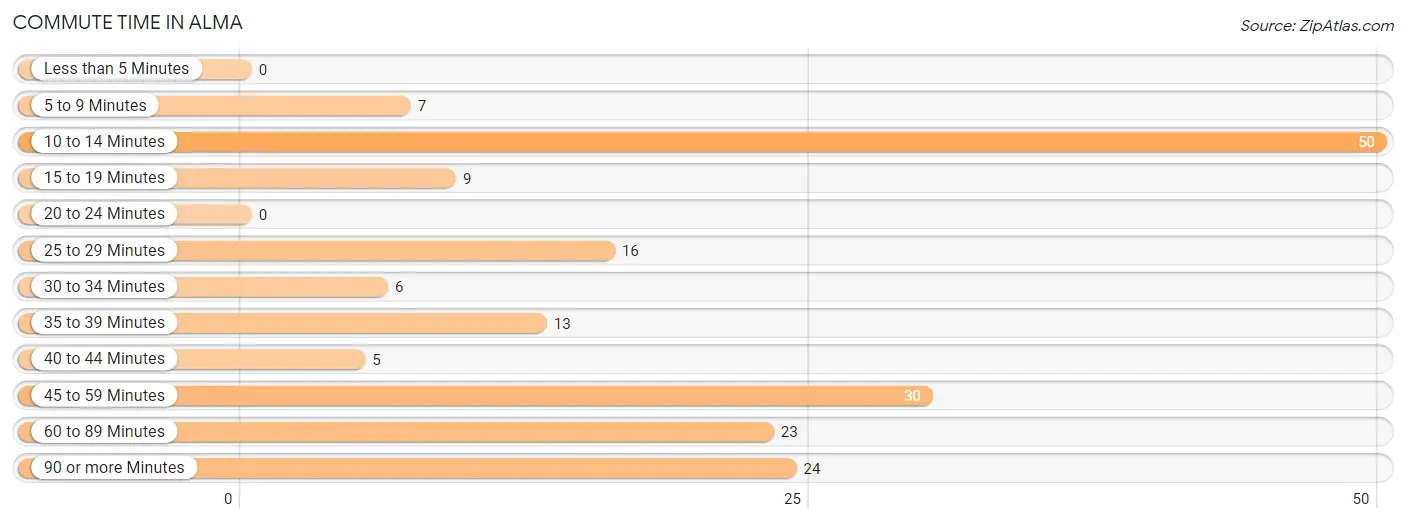
| Commute Time | # Commuters | % Commuters |
| Less than 5 Minutes | 0 | 0.0% |
| 5 to 9 Minutes | 7 | 3.8% |
| 10 to 14 Minutes | 50 | 27.3% |
| 15 to 19 Minutes | 9 | 4.9% |
| 20 to 24 Minutes | 0 | 0.0% |
| 25 to 29 Minutes | 16 | 8.7% |
| 30 to 34 Minutes | 6 | 3.3% |
| 35 to 39 Minutes | 13 | 7.1% |
| 40 to 44 Minutes | 5 | 2.7% |
| 45 to 59 Minutes | 30 | 16.4% |
| 60 to 89 Minutes | 23 | 12.6% |
| 90 or more Minutes | 24 | 13.1% |
Commute Time by Sex in Alma
The most common commute times in Alma are 90 or more minutes (24 commuters, 31.2%) for males and 10 to 14 minutes (47 commuters, 44.3%) for females.
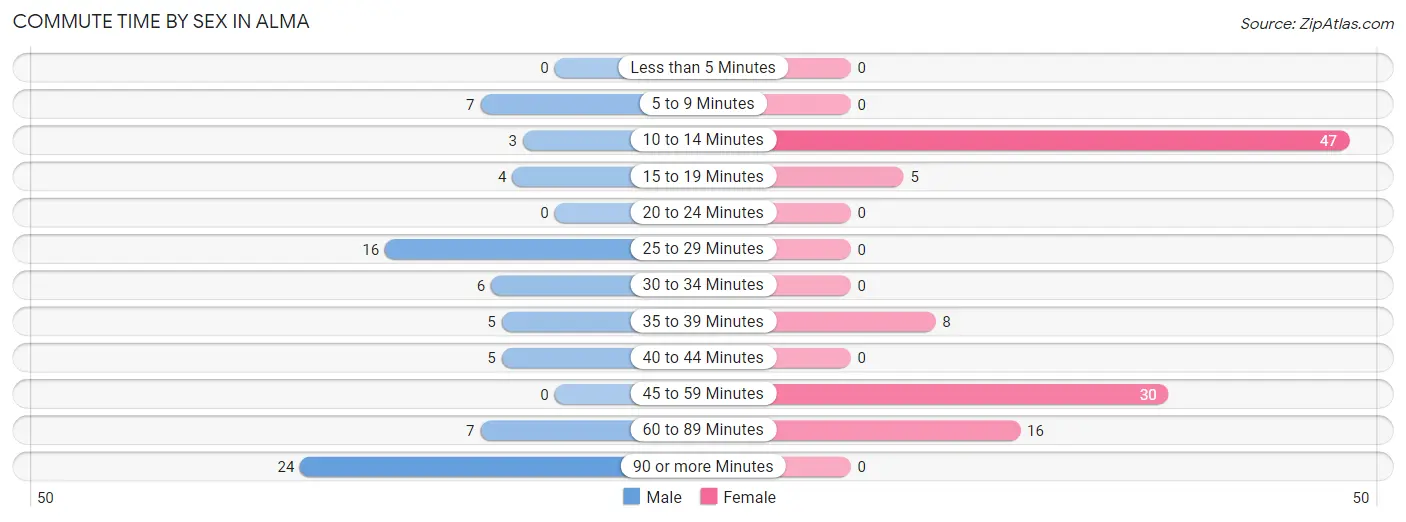
| Commute Time | Male | Female |
| Less than 5 Minutes | 0 (0.0%) | 0 (0.0%) |
| 5 to 9 Minutes | 7 (9.1%) | 0 (0.0%) |
| 10 to 14 Minutes | 3 (3.9%) | 47 (44.3%) |
| 15 to 19 Minutes | 4 (5.2%) | 5 (4.7%) |
| 20 to 24 Minutes | 0 (0.0%) | 0 (0.0%) |
| 25 to 29 Minutes | 16 (20.8%) | 0 (0.0%) |
| 30 to 34 Minutes | 6 (7.8%) | 0 (0.0%) |
| 35 to 39 Minutes | 5 (6.5%) | 8 (7.5%) |
| 40 to 44 Minutes | 5 (6.5%) | 0 (0.0%) |
| 45 to 59 Minutes | 0 (0.0%) | 30 (28.3%) |
| 60 to 89 Minutes | 7 (9.1%) | 16 (15.1%) |
| 90 or more Minutes | 24 (31.2%) | 0 (0.0%) |
Time of Departure to Work by Sex in Alma
The most frequent times of departure to work in Alma are 7:00 AM to 7:29 AM (21, 27.3%) for males and 12:00 PM to 3:59 PM (33, 31.1%) for females.
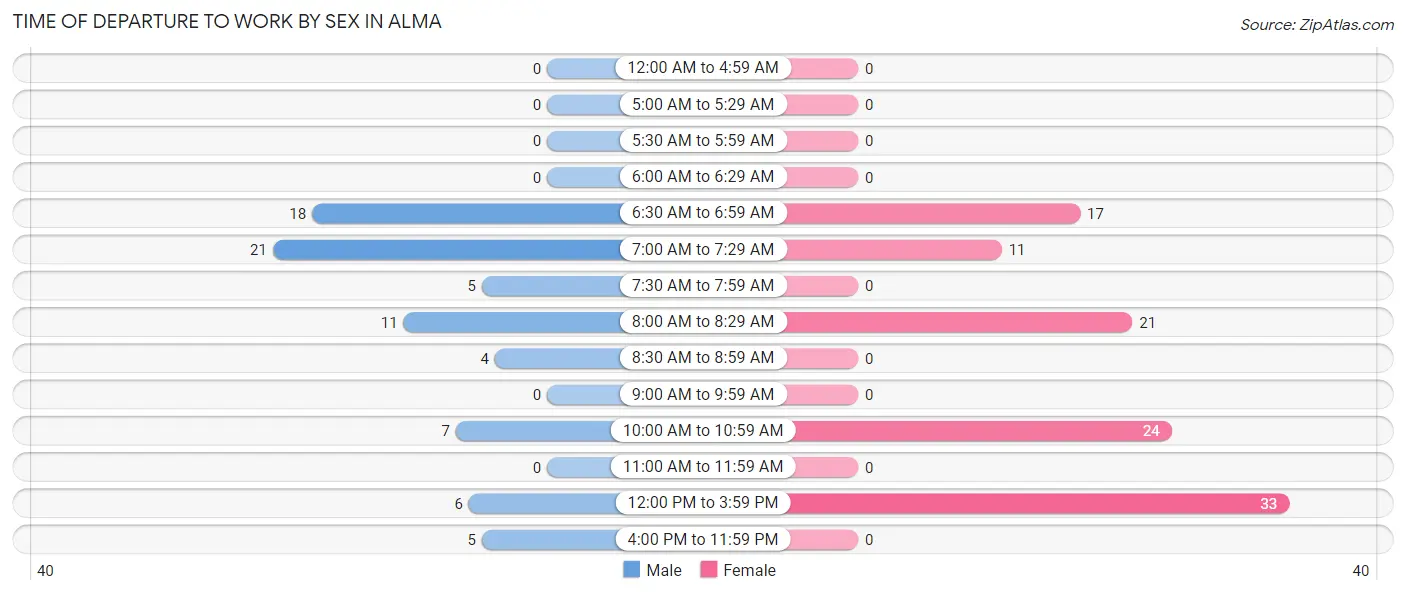
| Time of Departure | Male | Female |
| 12:00 AM to 4:59 AM | 0 (0.0%) | 0 (0.0%) |
| 5:00 AM to 5:29 AM | 0 (0.0%) | 0 (0.0%) |
| 5:30 AM to 5:59 AM | 0 (0.0%) | 0 (0.0%) |
| 6:00 AM to 6:29 AM | 0 (0.0%) | 0 (0.0%) |
| 6:30 AM to 6:59 AM | 18 (23.4%) | 17 (16.0%) |
| 7:00 AM to 7:29 AM | 21 (27.3%) | 11 (10.4%) |
| 7:30 AM to 7:59 AM | 5 (6.5%) | 0 (0.0%) |
| 8:00 AM to 8:29 AM | 11 (14.3%) | 21 (19.8%) |
| 8:30 AM to 8:59 AM | 4 (5.2%) | 0 (0.0%) |
| 9:00 AM to 9:59 AM | 0 (0.0%) | 0 (0.0%) |
| 10:00 AM to 10:59 AM | 7 (9.1%) | 24 (22.6%) |
| 11:00 AM to 11:59 AM | 0 (0.0%) | 0 (0.0%) |
| 12:00 PM to 3:59 PM | 6 (7.8%) | 33 (31.1%) |
| 4:00 PM to 11:59 PM | 5 (6.5%) | 0 (0.0%) |
| Total | 77 (100.0%) | 106 (100.0%) |
Housing Occupancy in Alma
Occupancy by Ownership in Alma
Of the total 130 dwellings in Alma, owner-occupied units account for 87 (66.9%), while renter-occupied units make up 43 (33.1%).
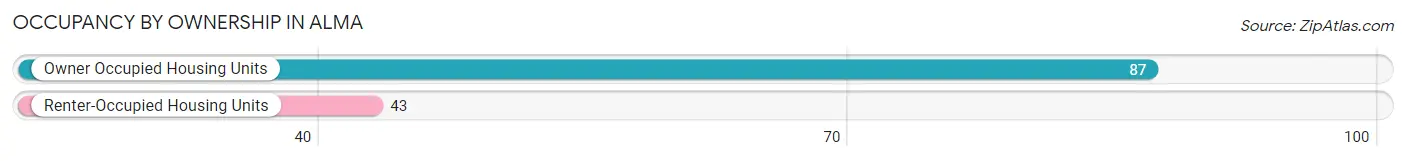
| Occupancy | # Housing Units | % Housing Units |
| Owner Occupied Housing Units | 87 | 66.9% |
| Renter-Occupied Housing Units | 43 | 33.1% |
| Total Occupied Housing Units | 130 | 100.0% |
Occupancy by Household Size in Alma
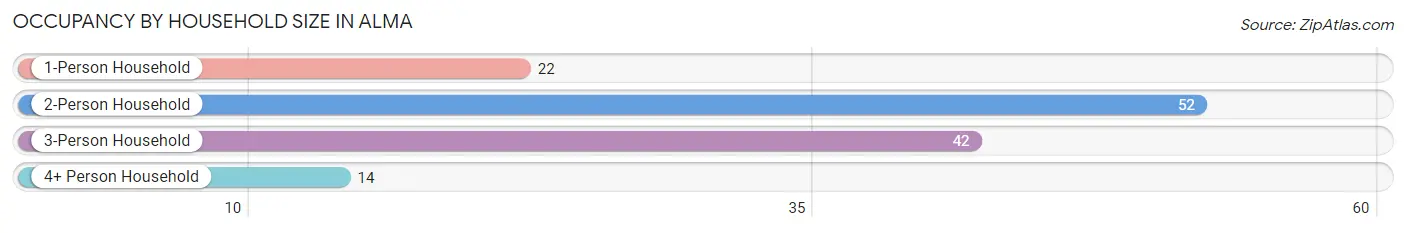
| Household Size | # Housing Units | % Housing Units |
| 1-Person Household | 22 | 16.9% |
| 2-Person Household | 52 | 40.0% |
| 3-Person Household | 42 | 32.3% |
| 4+ Person Household | 14 | 10.8% |
| Total Housing Units | 130 | 100.0% |
Occupancy by Ownership by Household Size in Alma
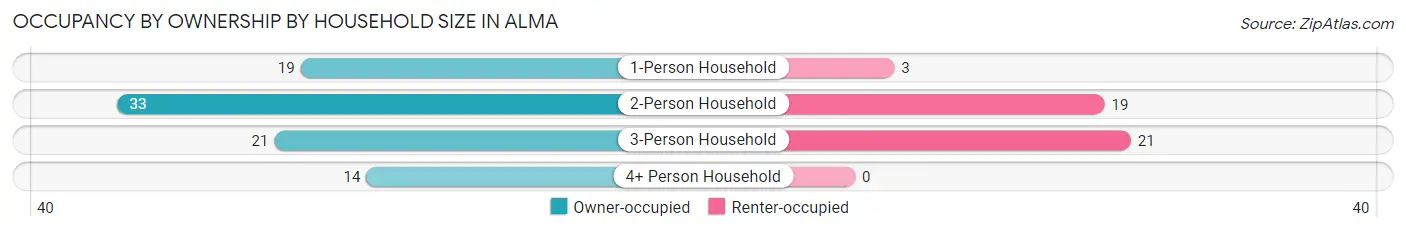
| Household Size | Owner-occupied | Renter-occupied |
| 1-Person Household | 19 (86.4%) | 3 (13.6%) |
| 2-Person Household | 33 (63.5%) | 19 (36.5%) |
| 3-Person Household | 21 (50.0%) | 21 (50.0%) |
| 4+ Person Household | 14 (100.0%) | 0 (0.0%) |
| Total Housing Units | 87 (66.9%) | 43 (33.1%) |
Occupancy by Educational Attainment in Alma
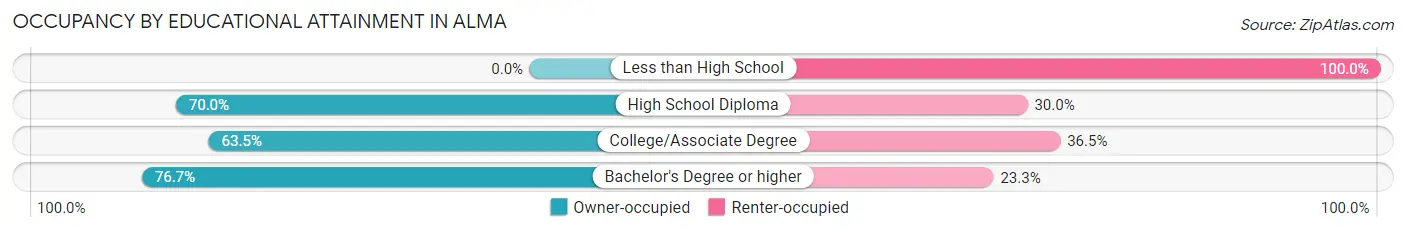
| Household Size | Owner-occupied | Renter-occupied |
| Less than High School | 0 (0.0%) | 3 (100.0%) |
| High School Diploma | 7 (70.0%) | 3 (30.0%) |
| College/Associate Degree | 47 (63.5%) | 27 (36.5%) |
| Bachelor's Degree or higher | 33 (76.7%) | 10 (23.3%) |
Occupancy by Age of Householder in Alma
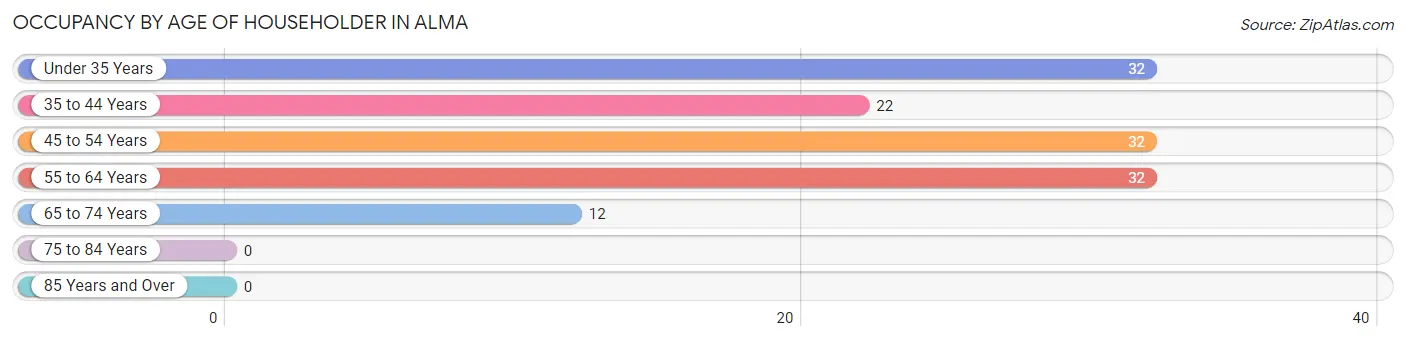
| Age Bracket | # Households | % Households |
| Under 35 Years | 32 | 24.6% |
| 35 to 44 Years | 22 | 16.9% |
| 45 to 54 Years | 32 | 24.6% |
| 55 to 64 Years | 32 | 24.6% |
| 65 to 74 Years | 12 | 9.2% |
| 75 to 84 Years | 0 | 0.0% |
| 85 Years and Over | 0 | 0.0% |
| Total | 130 | 100.0% |
Housing Finances in Alma
Median Income by Occupancy in Alma
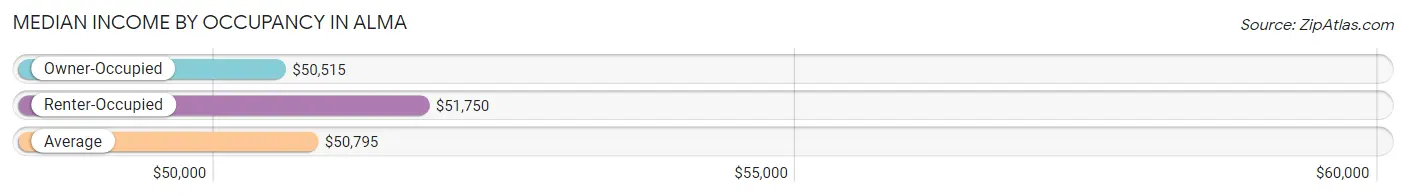
| Occupancy Type | # Households | Median Income |
| Owner-Occupied | 87 (66.9%) | $50,515 |
| Renter-Occupied | 43 (33.1%) | $51,750 |
| Average | 130 (100.0%) | $50,795 |
Occupancy by Householder Income Bracket in Alma
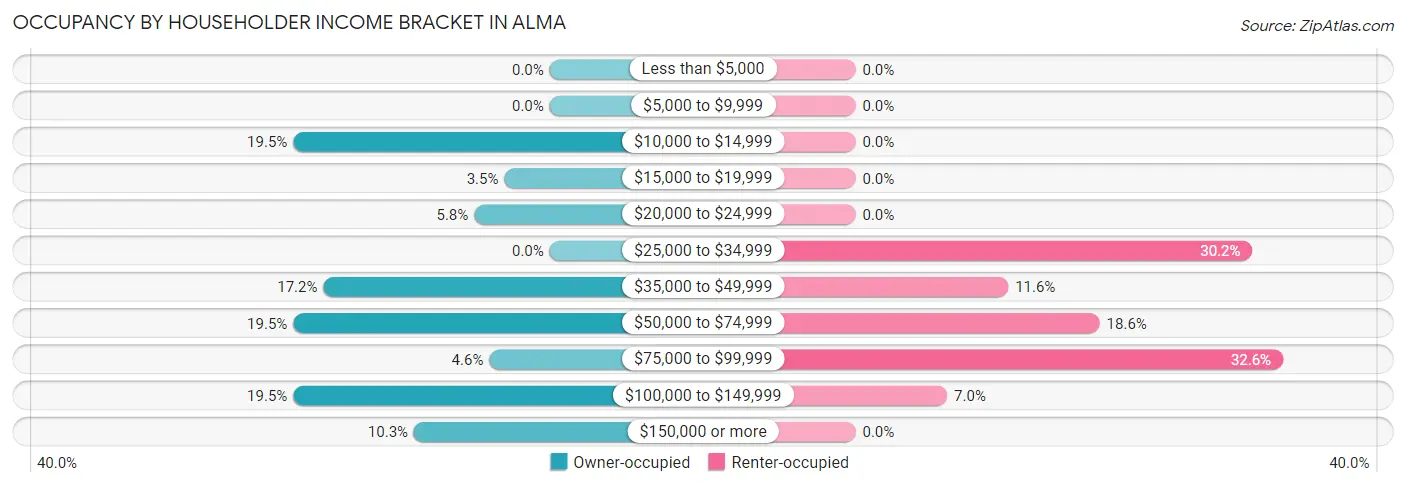
| Income Bracket | Owner-occupied | Renter-occupied |
| Less than $5,000 | 0 (0.0%) | 0 (0.0%) |
| $5,000 to $9,999 | 0 (0.0%) | 0 (0.0%) |
| $10,000 to $14,999 | 17 (19.5%) | 0 (0.0%) |
| $15,000 to $19,999 | 3 (3.5%) | 0 (0.0%) |
| $20,000 to $24,999 | 5 (5.8%) | 0 (0.0%) |
| $25,000 to $34,999 | 0 (0.0%) | 13 (30.2%) |
| $35,000 to $49,999 | 15 (17.2%) | 5 (11.6%) |
| $50,000 to $74,999 | 17 (19.5%) | 8 (18.6%) |
| $75,000 to $99,999 | 4 (4.6%) | 14 (32.6%) |
| $100,000 to $149,999 | 17 (19.5%) | 3 (7.0%) |
| $150,000 or more | 9 (10.3%) | 0 (0.0%) |
| Total | 87 (100.0%) | 43 (100.0%) |
Monthly Housing Cost Tiers in Alma
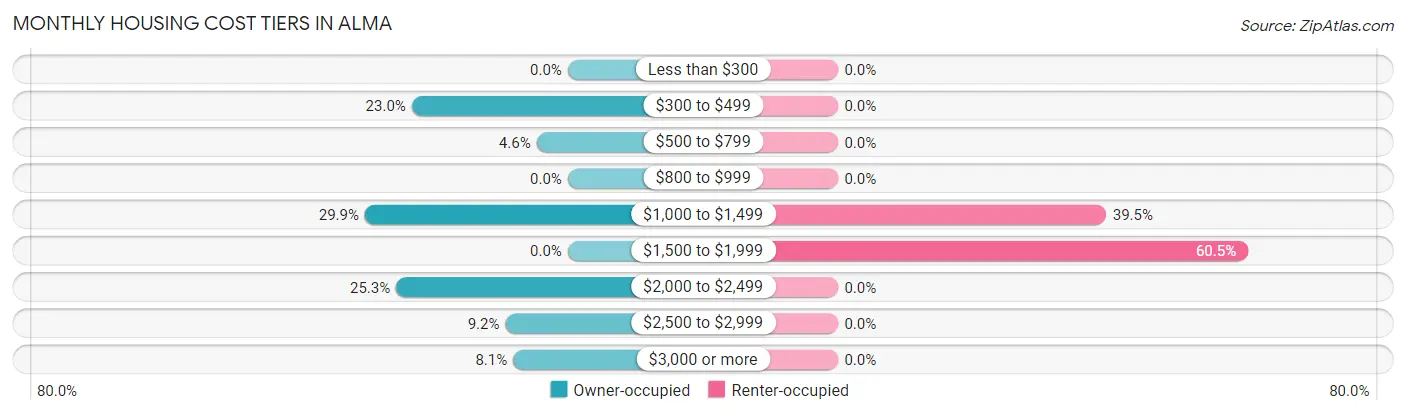
| Monthly Cost | Owner-occupied | Renter-occupied |
| Less than $300 | 0 (0.0%) | 0 (0.0%) |
| $300 to $499 | 20 (23.0%) | 0 (0.0%) |
| $500 to $799 | 4 (4.6%) | 0 (0.0%) |
| $800 to $999 | 0 (0.0%) | 0 (0.0%) |
| $1,000 to $1,499 | 26 (29.9%) | 17 (39.5%) |
| $1,500 to $1,999 | 0 (0.0%) | 26 (60.5%) |
| $2,000 to $2,499 | 22 (25.3%) | 0 (0.0%) |
| $2,500 to $2,999 | 8 (9.2%) | 0 (0.0%) |
| $3,000 or more | 7 (8.1%) | 0 (0.0%) |
| Total | 87 (100.0%) | 43 (100.0%) |
Physical Housing Characteristics in Alma
Housing Structures in Alma
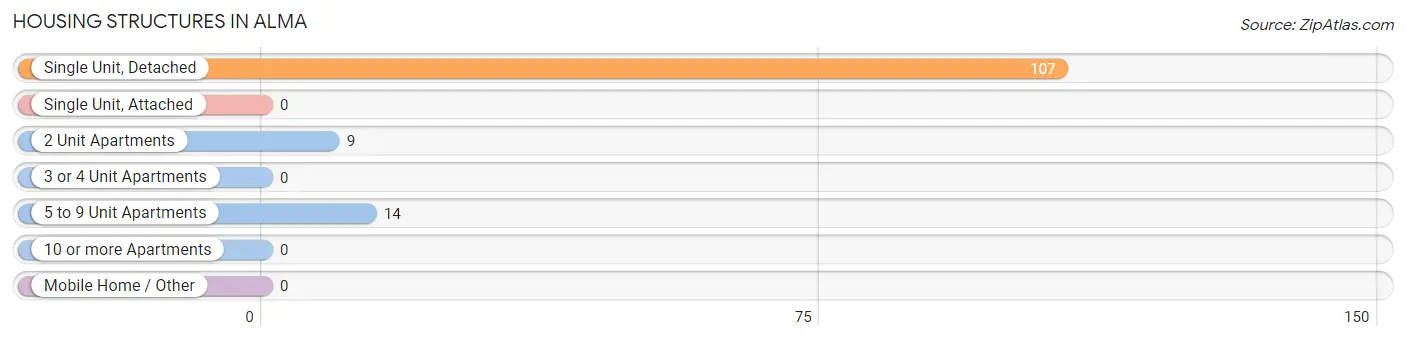
| Structure Type | # Housing Units | % Housing Units |
| Single Unit, Detached | 107 | 82.3% |
| Single Unit, Attached | 0 | 0.0% |
| 2 Unit Apartments | 9 | 6.9% |
| 3 or 4 Unit Apartments | 0 | 0.0% |
| 5 to 9 Unit Apartments | 14 | 10.8% |
| 10 or more Apartments | 0 | 0.0% |
| Mobile Home / Other | 0 | 0.0% |
| Total | 130 | 100.0% |
Housing Structures by Occupancy in Alma
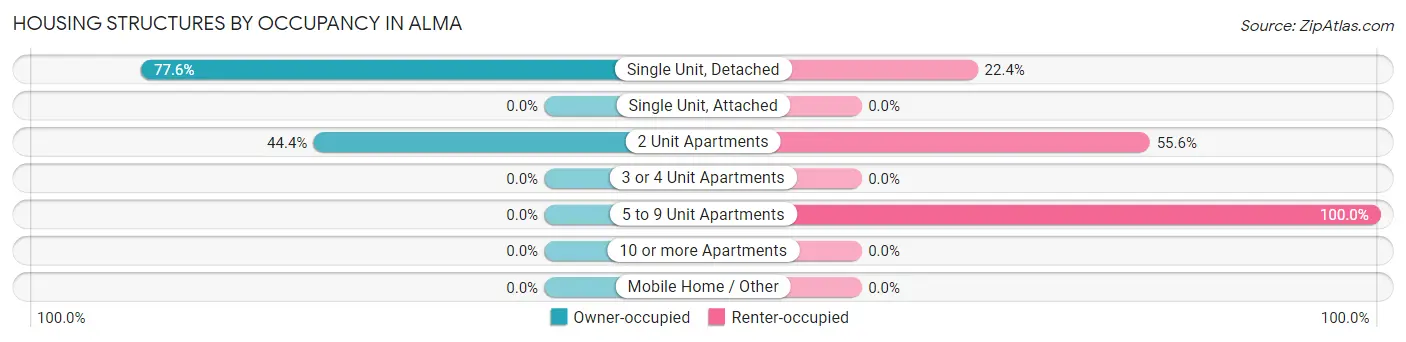
| Structure Type | Owner-occupied | Renter-occupied |
| Single Unit, Detached | 83 (77.6%) | 24 (22.4%) |
| Single Unit, Attached | 0 (0.0%) | 0 (0.0%) |
| 2 Unit Apartments | 4 (44.4%) | 5 (55.6%) |
| 3 or 4 Unit Apartments | 0 (0.0%) | 0 (0.0%) |
| 5 to 9 Unit Apartments | 0 (0.0%) | 14 (100.0%) |
| 10 or more Apartments | 0 (0.0%) | 0 (0.0%) |
| Mobile Home / Other | 0 (0.0%) | 0 (0.0%) |
| Total | 87 (66.9%) | 43 (33.1%) |
Housing Structures by Number of Rooms in Alma
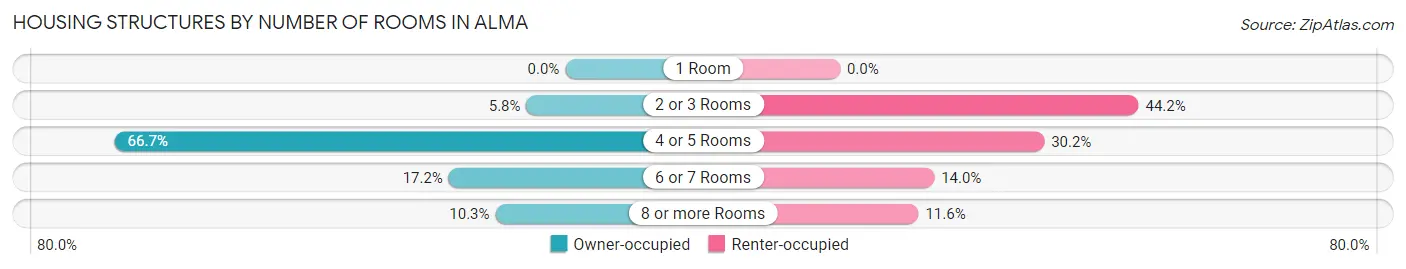
| Number of Rooms | Owner-occupied | Renter-occupied |
| 1 Room | 0 (0.0%) | 0 (0.0%) |
| 2 or 3 Rooms | 5 (5.8%) | 19 (44.2%) |
| 4 or 5 Rooms | 58 (66.7%) | 13 (30.2%) |
| 6 or 7 Rooms | 15 (17.2%) | 6 (14.0%) |
| 8 or more Rooms | 9 (10.3%) | 5 (11.6%) |
| Total | 87 (100.0%) | 43 (100.0%) |
Housing Structure by Heating Type in Alma
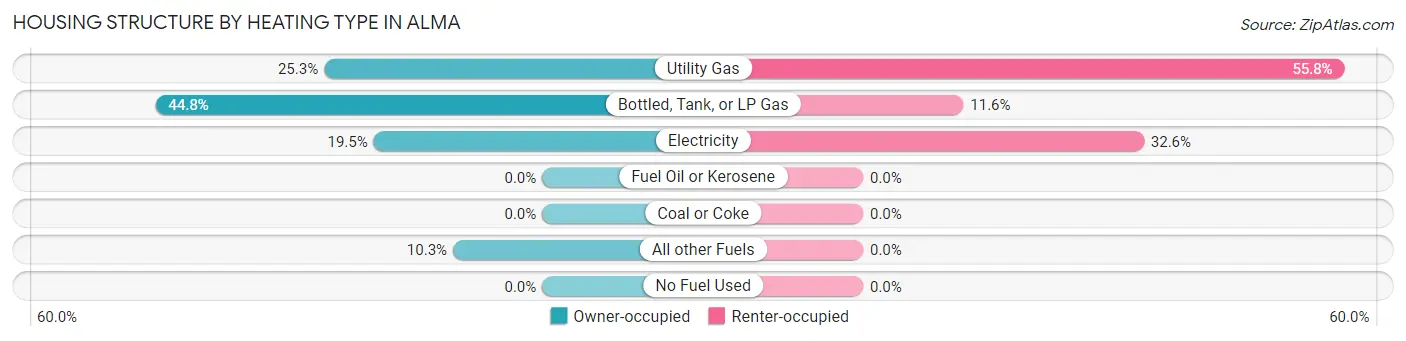
| Heating Type | Owner-occupied | Renter-occupied |
| Utility Gas | 22 (25.3%) | 24 (55.8%) |
| Bottled, Tank, or LP Gas | 39 (44.8%) | 5 (11.6%) |
| Electricity | 17 (19.5%) | 14 (32.6%) |
| Fuel Oil or Kerosene | 0 (0.0%) | 0 (0.0%) |
| Coal or Coke | 0 (0.0%) | 0 (0.0%) |
| All other Fuels | 9 (10.3%) | 0 (0.0%) |
| No Fuel Used | 0 (0.0%) | 0 (0.0%) |
| Total | 87 (100.0%) | 43 (100.0%) |
Household Vehicle Usage in Alma
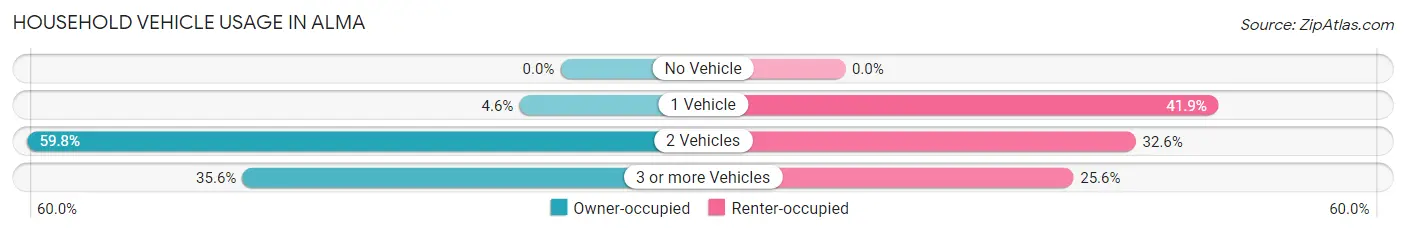
| Vehicles per Household | Owner-occupied | Renter-occupied |
| No Vehicle | 0 (0.0%) | 0 (0.0%) |
| 1 Vehicle | 4 (4.6%) | 18 (41.9%) |
| 2 Vehicles | 52 (59.8%) | 14 (32.6%) |
| 3 or more Vehicles | 31 (35.6%) | 11 (25.6%) |
| Total | 87 (100.0%) | 43 (100.0%) |
Real Estate & Mortgages in Alma
Real Estate and Mortgage Overview in Alma
| Characteristic | Without Mortgage | With Mortgage |
| Housing Units | 33 | 54 |
| Median Property Value | - | - |
| Median Household Income | - | - |
| Monthly Housing Costs | - | - |
| Real Estate Taxes | $965 | $0 |
Property Value by Mortgage Status in Alma
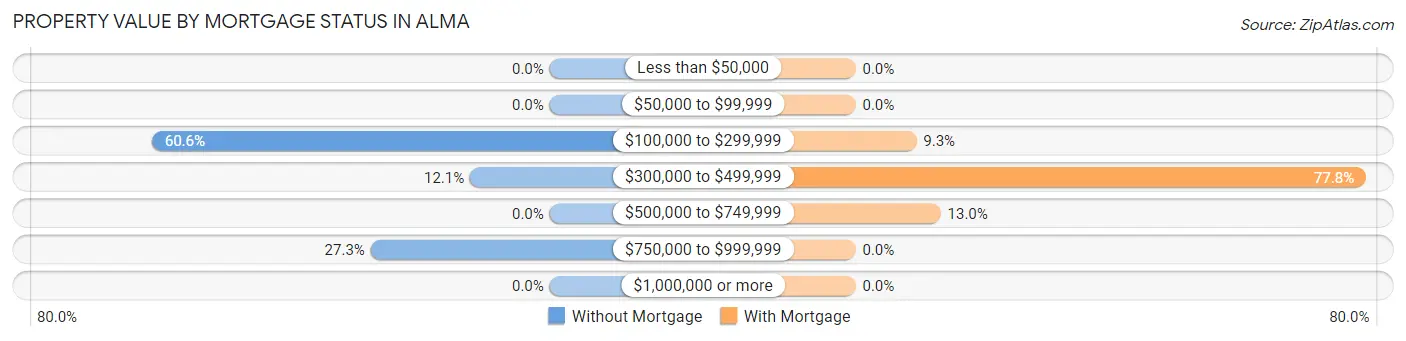
| Property Value | Without Mortgage | With Mortgage |
| Less than $50,000 | 0 (0.0%) | 0 (0.0%) |
| $50,000 to $99,999 | 0 (0.0%) | 0 (0.0%) |
| $100,000 to $299,999 | 20 (60.6%) | 5 (9.3%) |
| $300,000 to $499,999 | 4 (12.1%) | 42 (77.8%) |
| $500,000 to $749,999 | 0 (0.0%) | 7 (13.0%) |
| $750,000 to $999,999 | 9 (27.3%) | 0 (0.0%) |
| $1,000,000 or more | 0 (0.0%) | 0 (0.0%) |
| Total | 33 (100.0%) | 54 (100.0%) |
Household Income by Mortgage Status in Alma
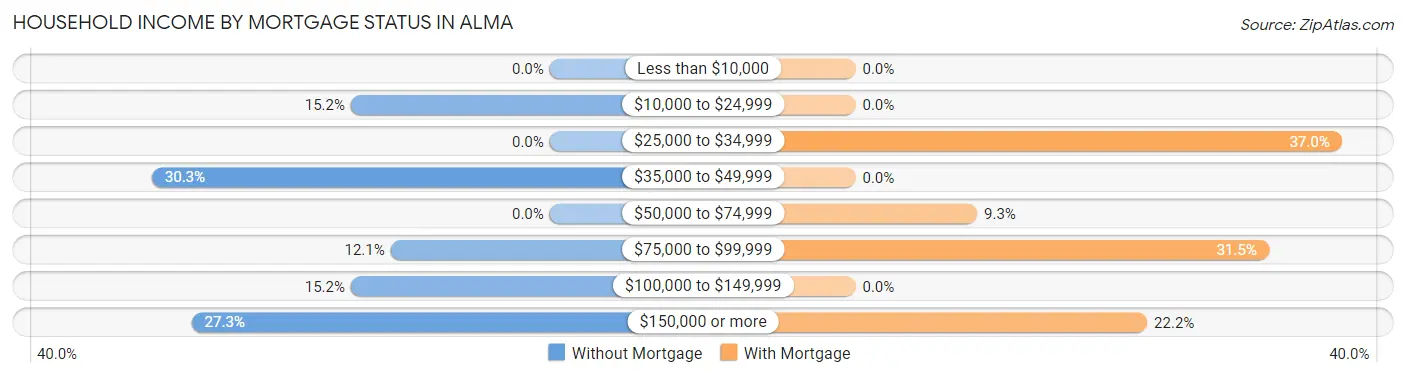
| Household Income | Without Mortgage | With Mortgage |
| Less than $10,000 | 0 (0.0%) | 0 (0.0%) |
| $10,000 to $24,999 | 5 (15.1%) | 0 (0.0%) |
| $25,000 to $34,999 | 0 (0.0%) | 20 (37.0%) |
| $35,000 to $49,999 | 10 (30.3%) | 0 (0.0%) |
| $50,000 to $74,999 | 0 (0.0%) | 5 (9.3%) |
| $75,000 to $99,999 | 4 (12.1%) | 17 (31.5%) |
| $100,000 to $149,999 | 5 (15.1%) | 0 (0.0%) |
| $150,000 or more | 9 (27.3%) | 12 (22.2%) |
| Total | 33 (100.0%) | 54 (100.0%) |
Property Value to Household Income Ratio in Alma
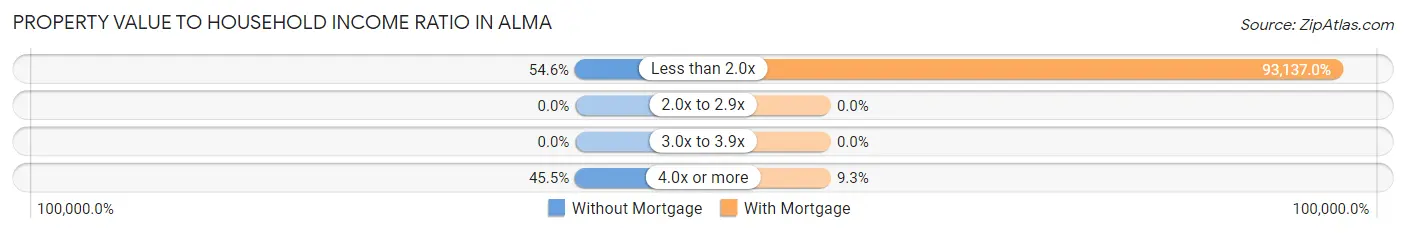
| Value-to-Income Ratio | Without Mortgage | With Mortgage |
| Less than 2.0x | 18 (54.5%) | 50,294 (93,137.0%) |
| 2.0x to 2.9x | 0 (0.0%) | 0 (0.0%) |
| 3.0x to 3.9x | 0 (0.0%) | 0 (0.0%) |
| 4.0x or more | 15 (45.5%) | 5 (9.3%) |
| Total | 33 (100.0%) | 54 (100.0%) |
Real Estate Taxes by Mortgage Status in Alma
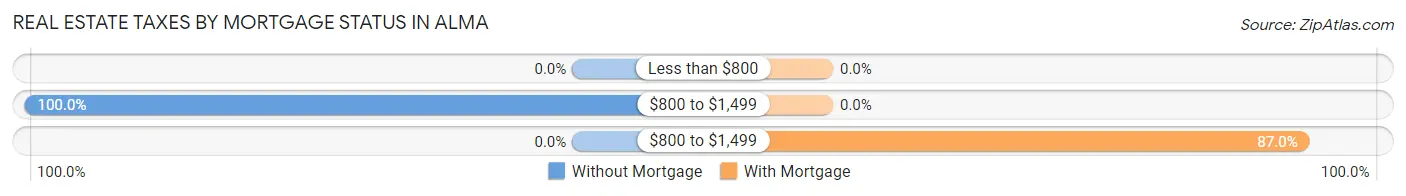
| Property Taxes | Without Mortgage | With Mortgage |
| Less than $800 | 0 (0.0%) | 0 (0.0%) |
| $800 to $1,499 | 33 (100.0%) | 0 (0.0%) |
| $800 to $1,499 | 0 (0.0%) | 47 (87.0%) |
| Total | 33 (100.0%) | 54 (100.0%) |
Health & Disability in Alma
Health Insurance Coverage by Age in Alma
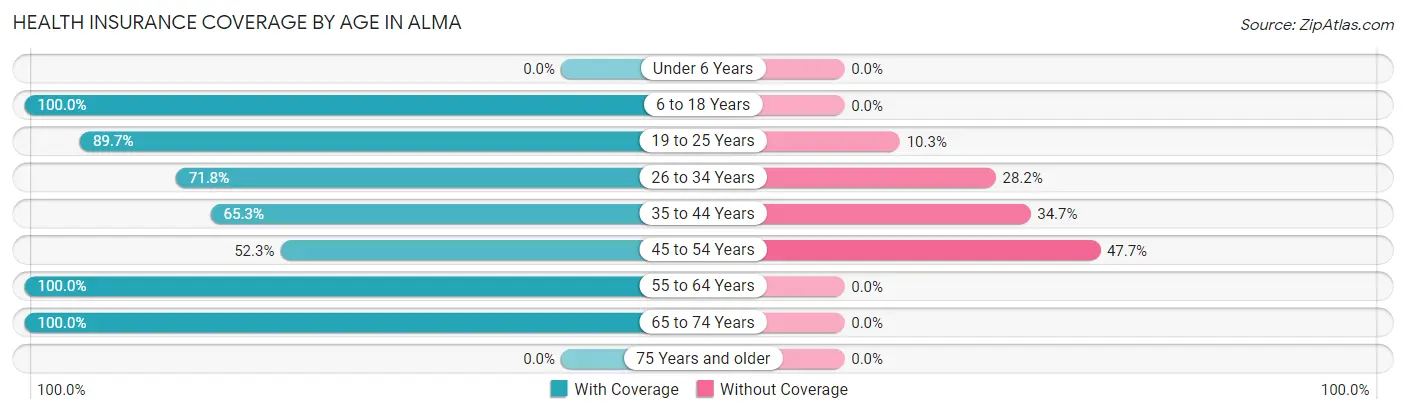
| Age Bracket | With Coverage | Without Coverage |
| Under 6 Years | 0 (0.0%) | 0 (0.0%) |
| 6 to 18 Years | 62 (100.0%) | 0 (0.0%) |
| 19 to 25 Years | 78 (89.7%) | 9 (10.3%) |
| 26 to 34 Years | 28 (71.8%) | 11 (28.2%) |
| 35 to 44 Years | 32 (65.3%) | 17 (34.7%) |
| 45 to 54 Years | 45 (52.3%) | 41 (47.7%) |
| 55 to 64 Years | 54 (100.0%) | 0 (0.0%) |
| 65 to 74 Years | 19 (100.0%) | 0 (0.0%) |
| 75 Years and older | 0 (0.0%) | 0 (0.0%) |
| Total | 318 (80.3%) | 78 (19.7%) |
Health Insurance Coverage by Citizenship Status in Alma
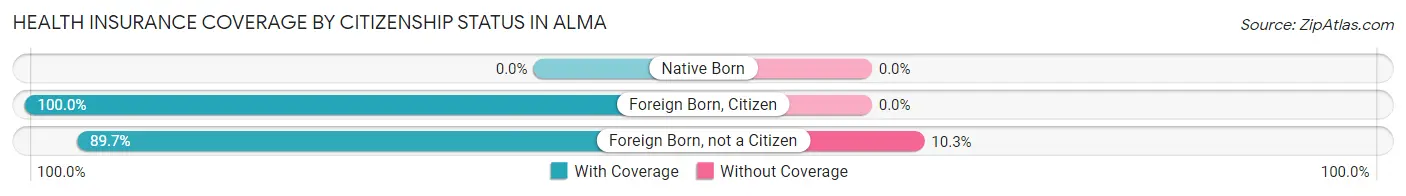
| Citizenship Status | With Coverage | Without Coverage |
| Native Born | 0 (0.0%) | 0 (0.0%) |
| Foreign Born, Citizen | 62 (100.0%) | 0 (0.0%) |
| Foreign Born, not a Citizen | 78 (89.7%) | 9 (10.3%) |
Health Insurance Coverage by Household Income in Alma
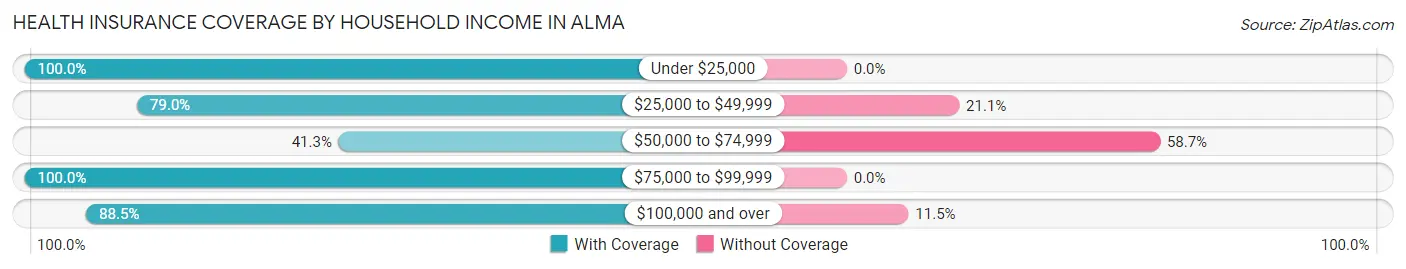
| Household Income | With Coverage | Without Coverage |
| Under $25,000 | 47 (100.0%) | 0 (0.0%) |
| $25,000 to $49,999 | 60 (78.9%) | 16 (21.0%) |
| $50,000 to $74,999 | 31 (41.3%) | 44 (58.7%) |
| $75,000 to $99,999 | 42 (100.0%) | 0 (0.0%) |
| $100,000 and over | 138 (88.5%) | 18 (11.5%) |
Public vs Private Health Insurance Coverage by Age in Alma
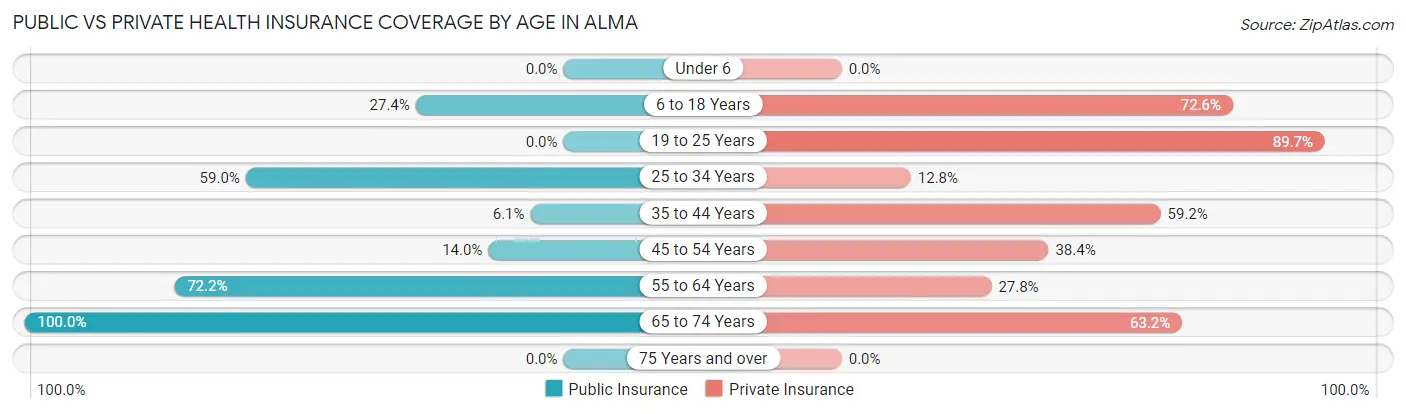
| Age Bracket | Public Insurance | Private Insurance |
| Under 6 | 0 (0.0%) | 0 (0.0%) |
| 6 to 18 Years | 17 (27.4%) | 45 (72.6%) |
| 19 to 25 Years | 0 (0.0%) | 78 (89.7%) |
| 25 to 34 Years | 23 (59.0%) | 5 (12.8%) |
| 35 to 44 Years | 3 (6.1%) | 29 (59.2%) |
| 45 to 54 Years | 12 (14.0%) | 33 (38.4%) |
| 55 to 64 Years | 39 (72.2%) | 15 (27.8%) |
| 65 to 74 Years | 19 (100.0%) | 12 (63.2%) |
| 75 Years and over | 0 (0.0%) | 0 (0.0%) |
| Total | 113 (28.5%) | 217 (54.8%) |
Disability Status by Sex by Age in Alma
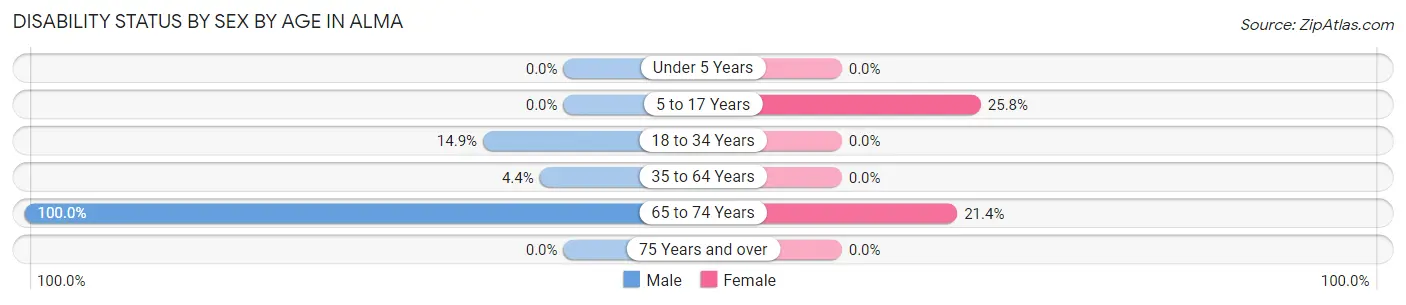
| Age Bracket | Male | Female |
| Under 5 Years | 0 (0.0%) | 0 (0.0%) |
| 5 to 17 Years | 0 (0.0%) | 8 (25.8%) |
| 18 to 34 Years | 10 (14.9%) | 0 (0.0%) |
| 35 to 64 Years | 5 (4.4%) | 0 (0.0%) |
| 65 to 74 Years | 5 (100.0%) | 3 (21.4%) |
| 75 Years and over | 0 (0.0%) | 0 (0.0%) |
Disability Class by Sex by Age in Alma
Disability Class: Hearing Difficulty
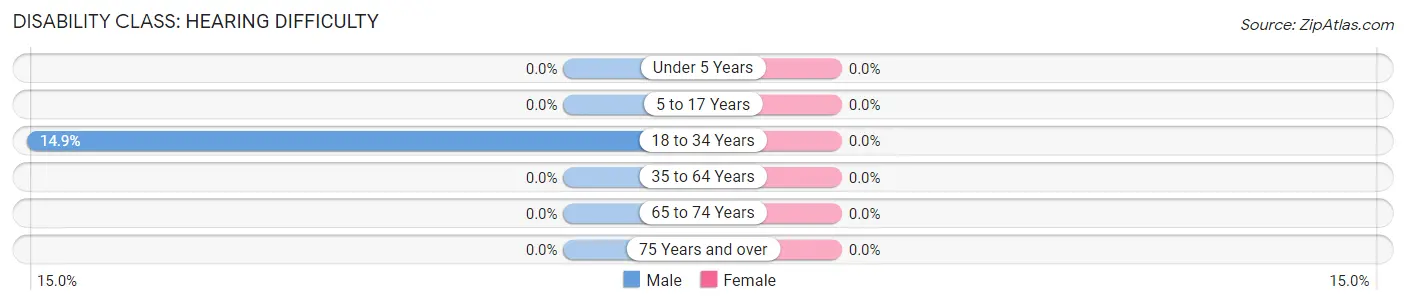
| Age Bracket | Male | Female |
| Under 5 Years | 0 (0.0%) | 0 (0.0%) |
| 5 to 17 Years | 0 (0.0%) | 0 (0.0%) |
| 18 to 34 Years | 10 (14.9%) | 0 (0.0%) |
| 35 to 64 Years | 0 (0.0%) | 0 (0.0%) |
| 65 to 74 Years | 0 (0.0%) | 0 (0.0%) |
| 75 Years and over | 0 (0.0%) | 0 (0.0%) |
Disability Class: Vision Difficulty
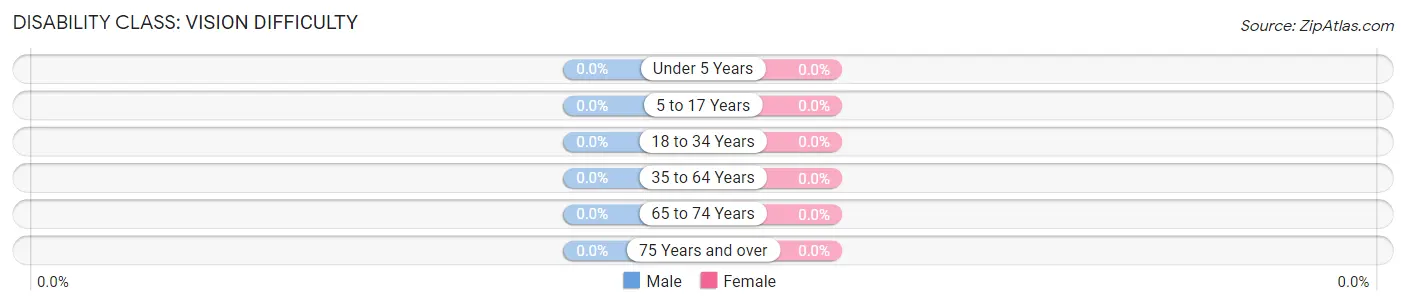
| Age Bracket | Male | Female |
| Under 5 Years | 0 (0.0%) | 0 (0.0%) |
| 5 to 17 Years | 0 (0.0%) | 0 (0.0%) |
| 18 to 34 Years | 0 (0.0%) | 0 (0.0%) |
| 35 to 64 Years | 0 (0.0%) | 0 (0.0%) |
| 65 to 74 Years | 0 (0.0%) | 0 (0.0%) |
| 75 Years and over | 0 (0.0%) | 0 (0.0%) |
Disability Class: Cognitive Difficulty
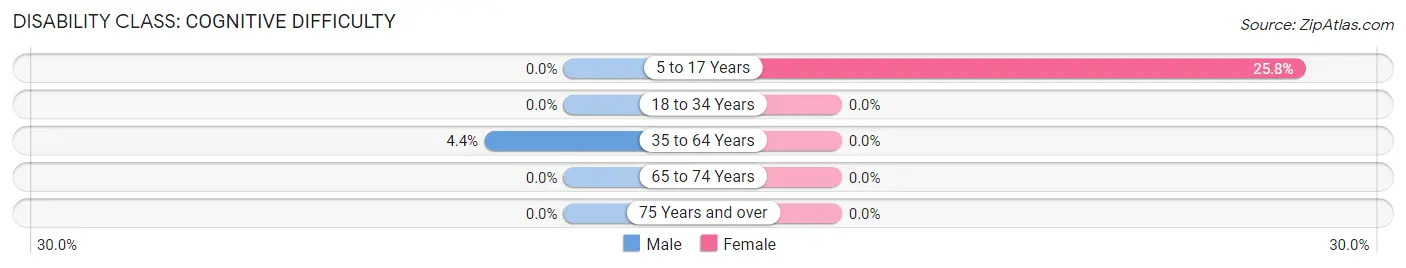
| Age Bracket | Male | Female |
| 5 to 17 Years | 0 (0.0%) | 8 (25.8%) |
| 18 to 34 Years | 0 (0.0%) | 0 (0.0%) |
| 35 to 64 Years | 5 (4.4%) | 0 (0.0%) |
| 65 to 74 Years | 0 (0.0%) | 0 (0.0%) |
| 75 Years and over | 0 (0.0%) | 0 (0.0%) |
Disability Class: Ambulatory Difficulty
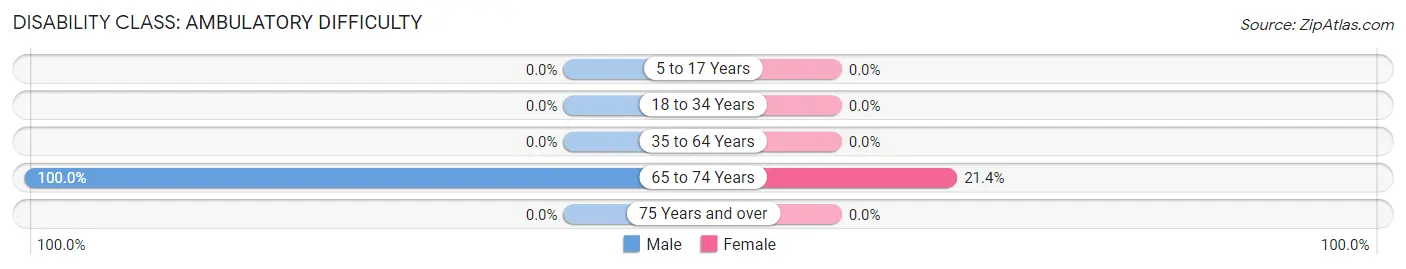
| Age Bracket | Male | Female |
| 5 to 17 Years | 0 (0.0%) | 0 (0.0%) |
| 18 to 34 Years | 0 (0.0%) | 0 (0.0%) |
| 35 to 64 Years | 0 (0.0%) | 0 (0.0%) |
| 65 to 74 Years | 5 (100.0%) | 3 (21.4%) |
| 75 Years and over | 0 (0.0%) | 0 (0.0%) |
Disability Class: Self-Care Difficulty
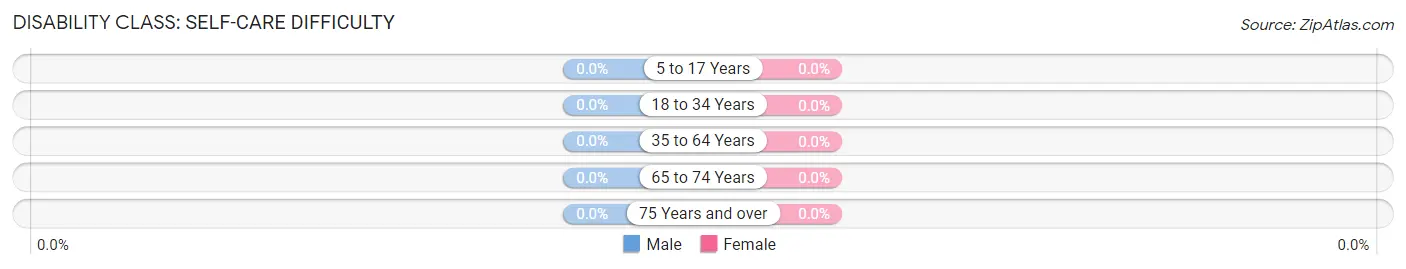
| Age Bracket | Male | Female |
| 5 to 17 Years | 0 (0.0%) | 0 (0.0%) |
| 18 to 34 Years | 0 (0.0%) | 0 (0.0%) |
| 35 to 64 Years | 0 (0.0%) | 0 (0.0%) |
| 65 to 74 Years | 0 (0.0%) | 0 (0.0%) |
| 75 Years and over | 0 (0.0%) | 0 (0.0%) |
Technology Access in Alma
Computing Device Access in Alma
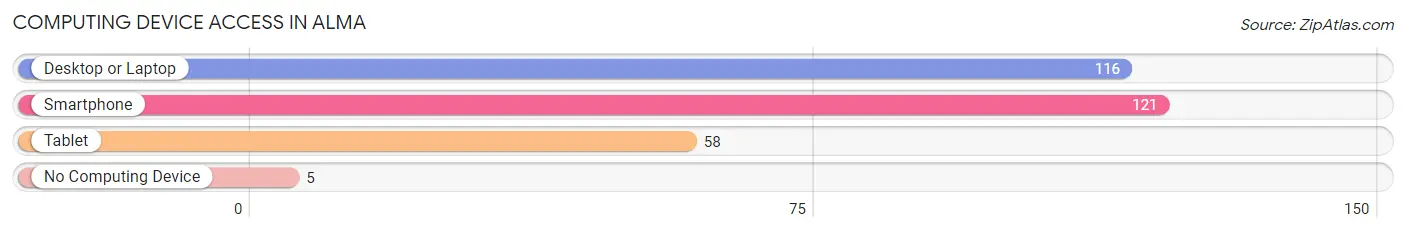
| Device Type | # Households | % Households |
| Desktop or Laptop | 116 | 89.2% |
| Smartphone | 121 | 93.1% |
| Tablet | 58 | 44.6% |
| No Computing Device | 5 | 3.8% |
| Total | 130 | 100.0% |
Internet Access in Alma
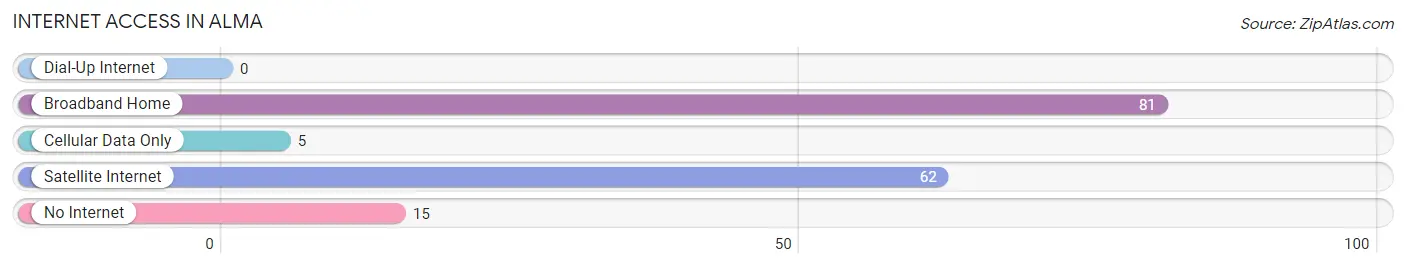
| Internet Type | # Households | % Households |
| Dial-Up Internet | 0 | 0.0% |
| Broadband Home | 81 | 62.3% |
| Cellular Data Only | 5 | 3.8% |
| Satellite Internet | 62 | 47.7% |
| No Internet | 15 | 11.5% |
| Total | 130 | 100.0% |
Alma Summary
Alma, Colorado is a small town located in Park County, Colorado, United States. It is situated in the South Park basin, at an elevation of 9,908 feet (3,021 m). The town is located approximately 12 miles (19 km) south of Fairplay, Colorado, and is the highest incorporated municipality in the United States. As of the 2010 census, the population of Alma was 270.
History
The town of Alma was founded in 1873 by prospectors who were searching for gold in the area. The town was named after the daughter of one of the prospectors, and was incorporated in 1881. The town quickly grew to become a bustling mining town, with a population of over 1,000 people.
The town was home to several mines, including the Alma Consolidated Mine, which was the largest gold mine in the area. The mine operated until the early 1900s, when it was closed due to a lack of ore.
The town of Alma was also home to several other businesses, including a hotel, a general store, a saloon, and a post office. The town also had a school, which was built in 1883.
Geography
Alma is located in the South Park basin, at an elevation of 9,908 feet (3,021 m). The town is located approximately 12 miles (19 km) south of Fairplay, Colorado. The town is surrounded by mountains, including the Mosquito Range to the east, the Tenmile Range to the west, and the Front Range to the north.
The town is located in a semi-arid climate, with hot summers and cold winters. The average annual temperature is 37.2°F (2.9°C), and the average annual precipitation is 16.3 inches (414 mm).
Economy
The economy of Alma is largely based on tourism. The town is a popular destination for outdoor activities, such as hiking, fishing, and camping. The town is also home to several restaurants, bars, and shops.
The town is also home to several businesses, including a gas station, a grocery store, and a hardware store. The town is also home to several bed and breakfasts, as well as a few small motels.
Demographics
As of the 2010 census, the population of Alma was 270. The racial makeup of the town was 97.4% White, 0.7% Native American, 0.4% Asian, 0.4% from other races, and 1.1% from two or more races. Hispanic or Latino of any race were 1.5% of the population.
The median income for a household in the town was $45,833, and the median income for a family was $50,000. The per capita income for the town was $20,945. About 8.3% of families and 10.3% of the population were below the poverty line, including 11.1% of those under age 18 and none of those age 65 or over.
Common Questions
What is Per Capita Income in Alma?
Per Capita income in Alma is $28,637.
What is the Median Family Income in Alma?
Median Family Income in Alma is $38,676.
What is the Median Household income in Alma?
Median Household Income in Alma is $50,795.
What is Inequality or Gini Index in Alma?
Inequality or Gini Index in Alma is 0.49.
What is the Total Population of Alma?
Total Population of Alma is 396.
What is the Total Male Population of Alma?
Total Male Population of Alma is 216.
What is the Total Female Population of Alma?
Total Female Population of Alma is 180.
What is the Ratio of Males per 100 Females in Alma?
There are 120.00 Males per 100 Females in Alma.
What is the Ratio of Females per 100 Males in Alma?
There are 83.33 Females per 100 Males in Alma.
What is the Median Population Age in Alma?
Median Population Age in Alma is 39.5 Years.
What is the Average Family Size in Alma
Average Family Size in Alma is 2.4 People.
What is the Average Household Size in Alma
Average Household Size in Alma is 3.0 People.
How Large is the Labor Force in Alma?
There are 250 People in the Labor Forcein in Alma.
What is the Percentage of People in the Labor Force in Alma?
71.8% of People are in the Labor Force in Alma.
What is the Unemployment Rate in Alma?
Unemployment Rate in Alma is 5.6%.