Parachute, CO Map & Demographics
Parachute Map
Parachute Overview
$21,344
PER CAPITA INCOME
$56,205
AVG FAMILY INCOME
$55,089
AVG HOUSEHOLD INCOME
36.1%
WAGE / INCOME GAP [ % ]
63.9¢/ $1
WAGE / INCOME GAP [ $ ]
$14,502
FAMILY INCOME DEFICIT
0.35
INEQUALITY / GINI INDEX
1,555
TOTAL POPULATION
918
MALE POPULATION
637
FEMALE POPULATION
144.11
MALES / 100 FEMALES
69.39
FEMALES / 100 MALES
25.7
MEDIAN AGE
3.2
AVG FAMILY SIZE
2.9
AVG HOUSEHOLD SIZE
843
LABOR FORCE [ PEOPLE ]
72.0%
PERCENT IN LABOR FORCE
19.3%
UNEMPLOYMENT RATE
Parachute Zip Codes
Parachute Area Codes
Income in Parachute
Income Overview in Parachute
Per Capita Income in Parachute is $21,344, while median incomes of families and households are $56,205 and $55,089 respectively.
| Characteristic | Number | Measure |
| Per Capita Income | 1,555 | $21,344 |
| Median Family Income | 389 | $56,205 |
| Mean Family Income | 389 | $66,389 |
| Median Household Income | 524 | $55,089 |
| Mean Household Income | 524 | $62,451 |
| Income Deficit | 389 | $14,502 |
| Wage / Income Gap (%) | 1,555 | 36.05% |
| Wage / Income Gap ($) | 1,555 | 63.95¢ per $1 |
| Gini / Inequality Index | 1,555 | 0.35 |
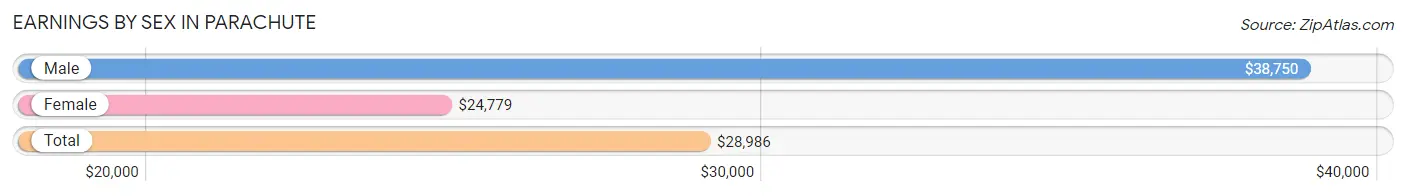
Earnings by Sex in Parachute
Average Earnings in Parachute are $28,986, $38,750 for men and $24,779 for women, a difference of 36.0%.
| Sex | Number | Average Earnings |
| Male | 446 (56.5%) | $38,750 |
| Female | 343 (43.5%) | $24,779 |
| Total | 789 (100.0%) | $28,986 |
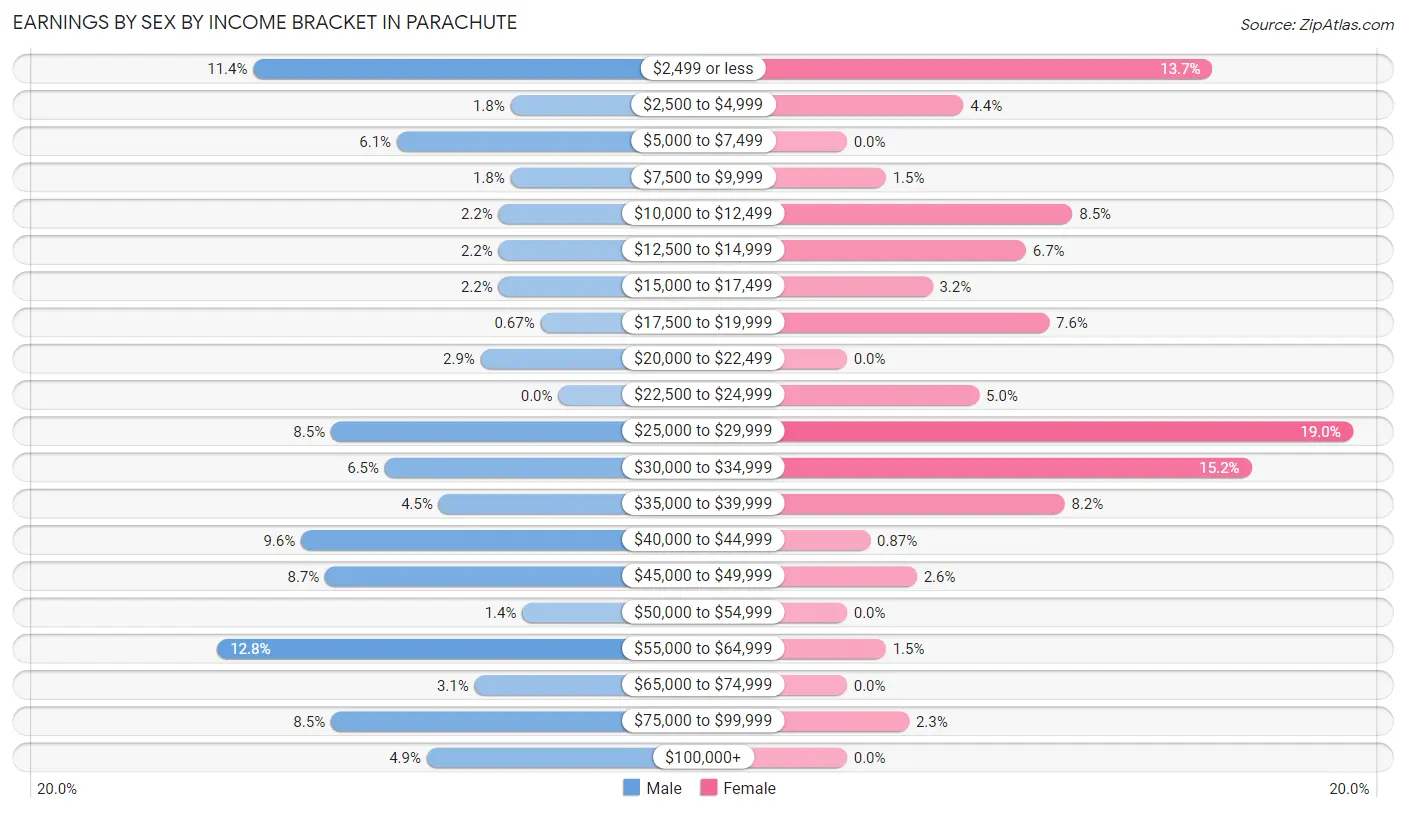
Earnings by Sex by Income Bracket in Parachute
The most common earnings brackets in Parachute are $55,000 to $64,999 for men (57 | 12.8%) and $25,000 to $29,999 for women (65 | 19.0%).
| Income | Male | Female |
| $2,499 or less | 51 (11.4%) | 47 (13.7%) |
| $2,500 to $4,999 | 8 (1.8%) | 15 (4.4%) |
| $5,000 to $7,499 | 27 (6.0%) | 0 (0.0%) |
| $7,500 to $9,999 | 8 (1.8%) | 5 (1.5%) |
| $10,000 to $12,499 | 10 (2.2%) | 29 (8.5%) |
| $12,500 to $14,999 | 10 (2.2%) | 23 (6.7%) |
| $15,000 to $17,499 | 10 (2.2%) | 11 (3.2%) |
| $17,500 to $19,999 | 3 (0.7%) | 26 (7.6%) |
| $20,000 to $22,499 | 13 (2.9%) | 0 (0.0%) |
| $22,500 to $24,999 | 0 (0.0%) | 17 (5.0%) |
| $25,000 to $29,999 | 38 (8.5%) | 65 (19.0%) |
| $30,000 to $34,999 | 29 (6.5%) | 52 (15.2%) |
| $35,000 to $39,999 | 20 (4.5%) | 28 (8.2%) |
| $40,000 to $44,999 | 43 (9.6%) | 3 (0.9%) |
| $45,000 to $49,999 | 39 (8.7%) | 9 (2.6%) |
| $50,000 to $54,999 | 6 (1.3%) | 0 (0.0%) |
| $55,000 to $64,999 | 57 (12.8%) | 5 (1.5%) |
| $65,000 to $74,999 | 14 (3.1%) | 0 (0.0%) |
| $75,000 to $99,999 | 38 (8.5%) | 8 (2.3%) |
| $100,000+ | 22 (4.9%) | 0 (0.0%) |
| Total | 446 (100.0%) | 343 (100.0%) |
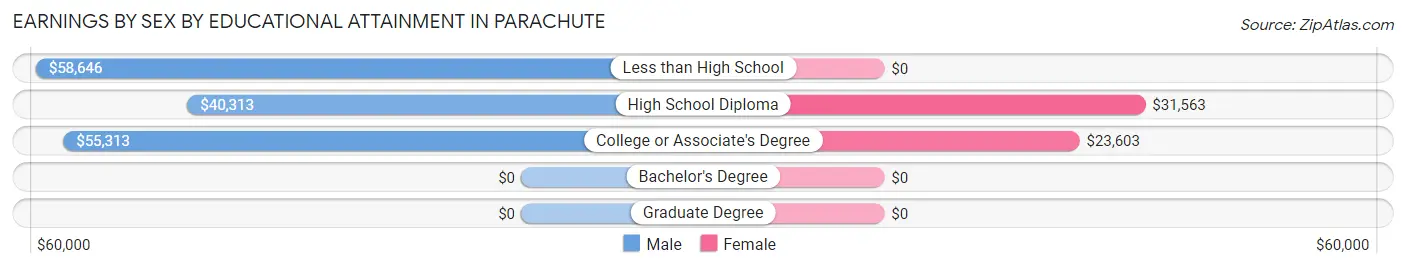
Earnings by Sex by Educational Attainment in Parachute
Average earnings in Parachute are $46,635 for men and $25,109 for women, a difference of 46.2%. Men with an educational attainment of less than high school enjoy the highest average annual earnings of $58,646, while those with high school diploma education earn the least with $40,313. Women with an educational attainment of high school diploma earn the most with the average annual earnings of $31,563, while those with college or associate's degree education have the smallest earnings of $23,603.
| Educational Attainment | Male Income | Female Income |
| Less than High School | $58,646 | $0 |
| High School Diploma | $40,313 | $31,563 |
| College or Associate's Degree | $55,313 | $23,603 |
| Bachelor's Degree | - | - |
| Graduate Degree | - | - |
| Total | $46,635 | $25,109 |
Family Income in Parachute
Family Income Brackets in Parachute
According to the Parachute family income data, there are 80 families falling into the $35,000 to $49,999 income range, which is the most common income bracket and makes up 20.6% of all families.
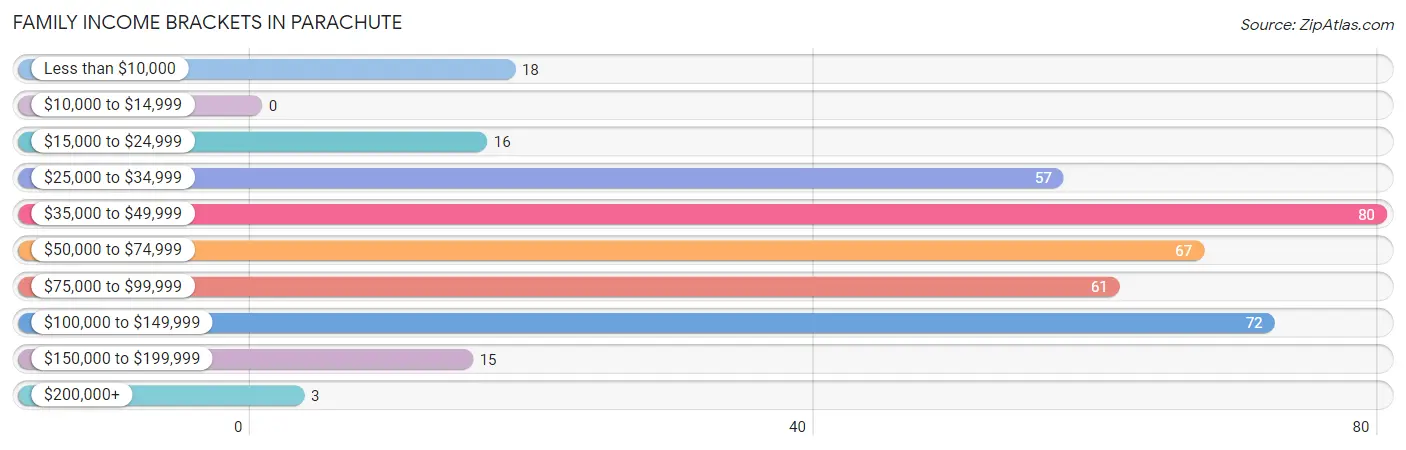
| Income Bracket | # Families | % Families |
| Less than $10,000 | 18 | 4.6% |
| $10,000 to $14,999 | 0 | 0.0% |
| $15,000 to $24,999 | 16 | 4.1% |
| $25,000 to $34,999 | 57 | 14.7% |
| $35,000 to $49,999 | 80 | 20.6% |
| $50,000 to $74,999 | 67 | 17.2% |
| $75,000 to $99,999 | 61 | 15.7% |
| $100,000 to $149,999 | 72 | 18.5% |
| $150,000 to $199,999 | 15 | 3.9% |
| $200,000+ | 3 | 0.8% |
Family Income by Famaliy Size in Parachute
2-person families (173 | 44.5%) account for the highest median family income in Parachute with $94,063 per family, while 2-person families (173 | 44.5%) have the highest median income of $47,032 per family member.
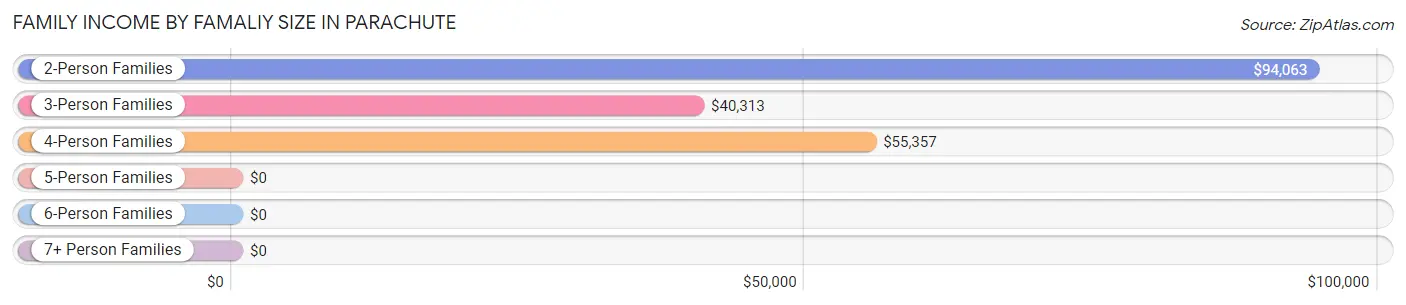
| Income Bracket | # Families | Median Income |
| 2-Person Families | 173 (44.5%) | $94,063 |
| 3-Person Families | 87 (22.4%) | $40,313 |
| 4-Person Families | 102 (26.2%) | $55,357 |
| 5-Person Families | 24 (6.2%) | $0 |
| 6-Person Families | 3 (0.8%) | $0 |
| 7+ Person Families | 0 (0.0%) | $0 |
| Total | 389 (100.0%) | $56,205 |
Family Income by Number of Earners in Parachute
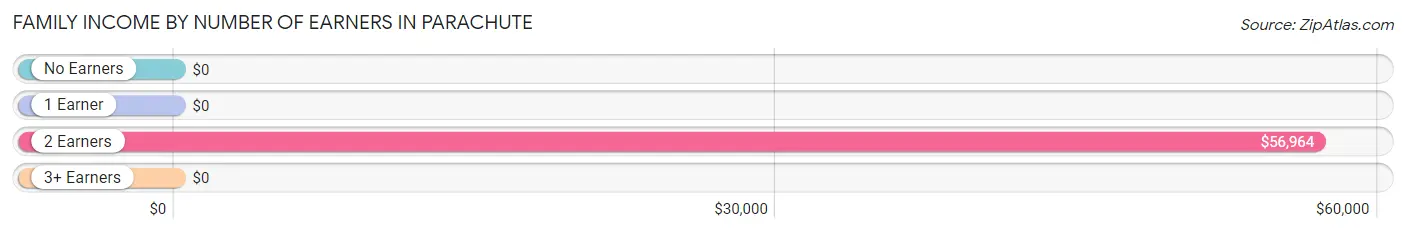
| Number of Earners | # Families | Median Income |
| No Earners | 25 (6.4%) | $0 |
| 1 Earner | 162 (41.6%) | $0 |
| 2 Earners | 176 (45.2%) | $56,964 |
| 3+ Earners | 26 (6.7%) | $0 |
| Total | 389 (100.0%) | $56,205 |
Household Income in Parachute
Household Income Brackets in Parachute
With 116 households falling in the category, the $35,000 to $49,999 income range is the most frequent in Parachute, accounting for 22.1% of all households. In contrast, only 3 households (0.6%) fall into the $200,000+ income bracket, making it the least populous group.
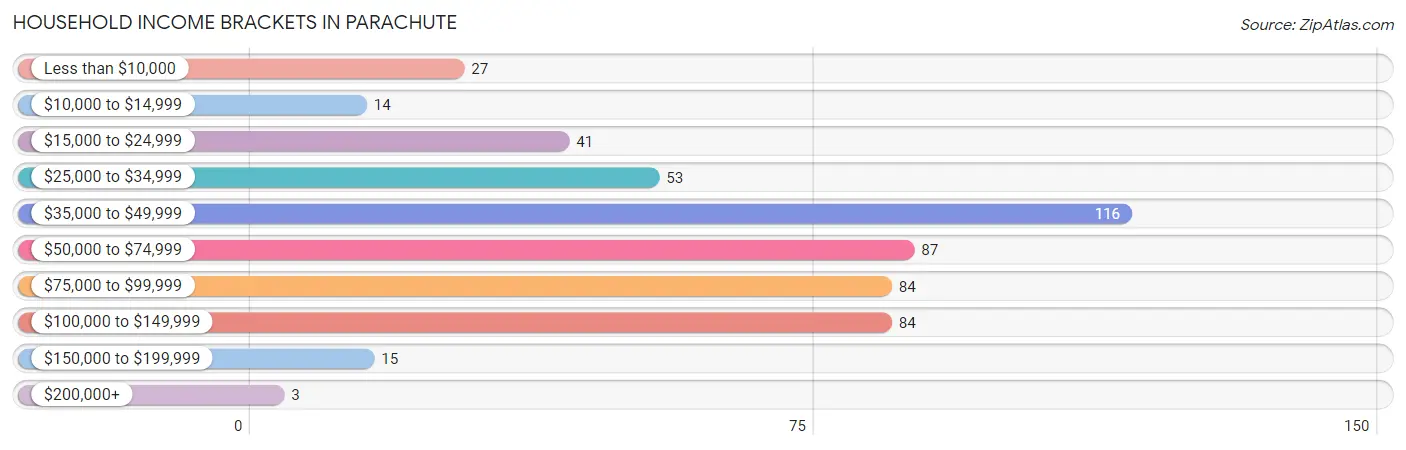
| Income Bracket | # Households | % Households |
| Less than $10,000 | 27 | 5.2% |
| $10,000 to $14,999 | 14 | 2.7% |
| $15,000 to $24,999 | 41 | 7.8% |
| $25,000 to $34,999 | 53 | 10.1% |
| $35,000 to $49,999 | 116 | 22.1% |
| $50,000 to $74,999 | 87 | 16.6% |
| $75,000 to $99,999 | 84 | 16.0% |
| $100,000 to $149,999 | 84 | 16.0% |
| $150,000 to $199,999 | 15 | 2.9% |
| $200,000+ | 3 | 0.6% |
Household Income by Householder Age in Parachute
The median household income in Parachute is $55,089, with the highest median household income of $55,402 found in the 25 to 44 years age bracket for the primary householder. A total of 229 households (43.7%) fall into this category. Meanwhile, the 65+ years age bracket for the primary householder has the lowest median household income of $0, with 101 households (19.3%) in this group.
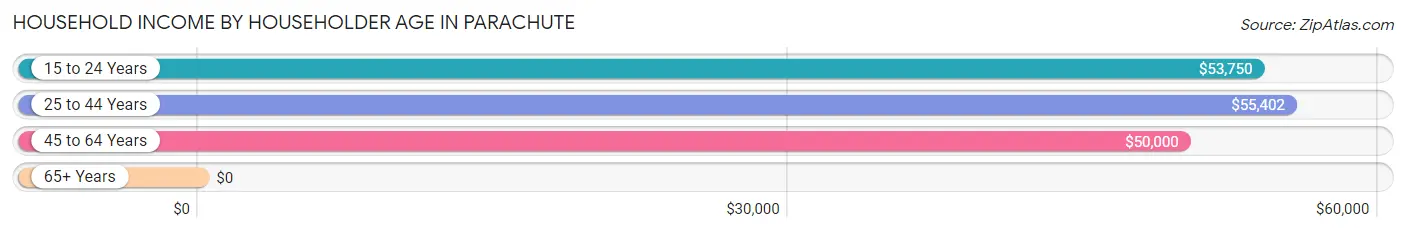
| Income Bracket | # Households | Median Income |
| 15 to 24 Years | 48 (9.2%) | $53,750 |
| 25 to 44 Years | 229 (43.7%) | $55,402 |
| 45 to 64 Years | 146 (27.9%) | $50,000 |
| 65+ Years | 101 (19.3%) | $0 |
| Total | 524 (100.0%) | $55,089 |
Poverty in Parachute
Income Below Poverty by Sex and Age in Parachute
With 21.2% poverty level for males and 25.8% for females among the residents of Parachute, 5 year old males and 12 to 14 year old females are the most vulnerable to poverty, with 3 males (100.0%) and 23 females (62.2%) in their respective age groups living below the poverty level.
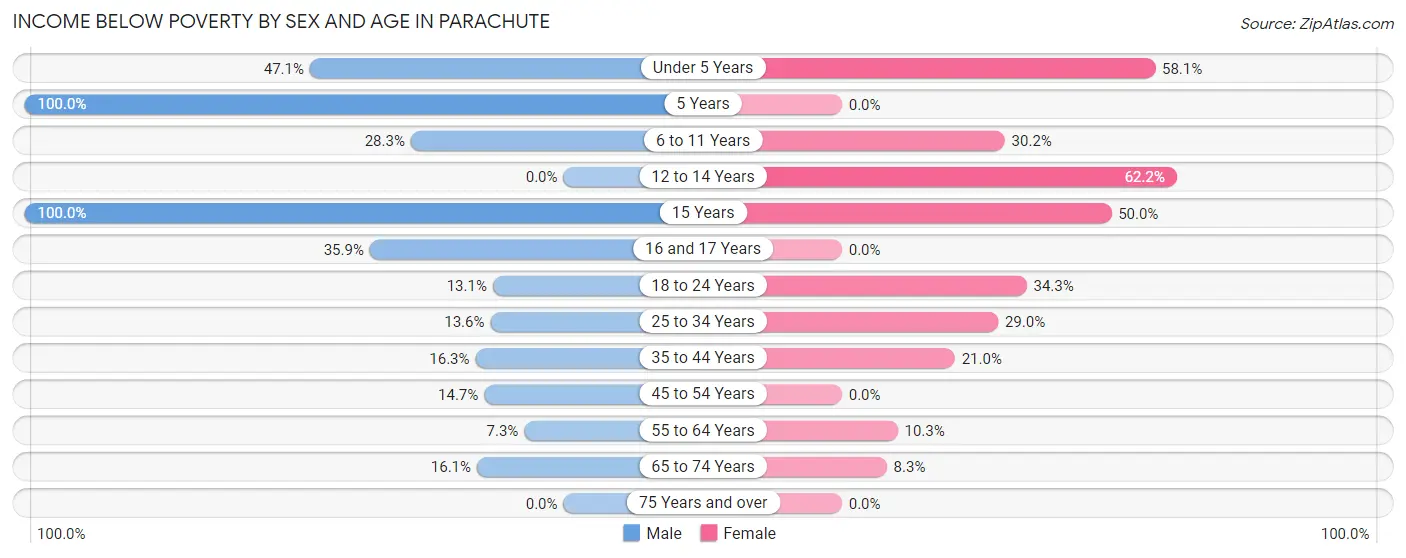
| Age Bracket | Male | Female |
| Under 5 Years | 32 (47.1%) | 25 (58.1%) |
| 5 Years | 3 (100.0%) | 0 (0.0%) |
| 6 to 11 Years | 34 (28.3%) | 13 (30.2%) |
| 12 to 14 Years | 0 (0.0%) | 23 (62.2%) |
| 15 Years | 18 (100.0%) | 18 (50.0%) |
| 16 and 17 Years | 23 (35.9%) | 0 (0.0%) |
| 18 to 24 Years | 27 (13.1%) | 24 (34.3%) |
| 25 to 34 Years | 16 (13.6%) | 20 (29.0%) |
| 35 to 44 Years | 8 (16.3%) | 35 (21.0%) |
| 45 to 54 Years | 15 (14.7%) | 0 (0.0%) |
| 55 to 64 Years | 4 (7.3%) | 3 (10.3%) |
| 65 to 74 Years | 13 (16.1%) | 2 (8.3%) |
| 75 Years and over | 0 (0.0%) | 0 (0.0%) |
| Total | 193 (21.2%) | 163 (25.8%) |
Income Above Poverty by Sex and Age in Parachute
According to the poverty statistics in Parachute, males aged 12 to 14 years and females aged 5 years are the age groups that are most secure financially, with 100.0% of males and 100.0% of females in these age groups living above the poverty line.
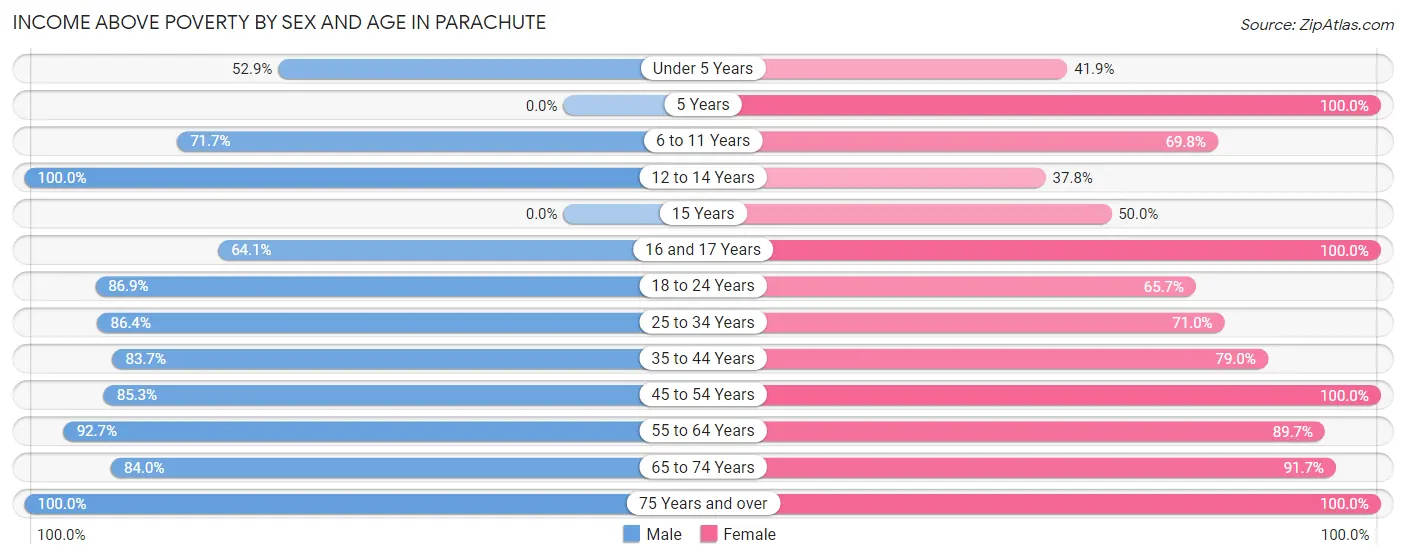
| Age Bracket | Male | Female |
| Under 5 Years | 36 (52.9%) | 18 (41.9%) |
| 5 Years | 0 (0.0%) | 3 (100.0%) |
| 6 to 11 Years | 86 (71.7%) | 30 (69.8%) |
| 12 to 14 Years | 13 (100.0%) | 14 (37.8%) |
| 15 Years | 0 (0.0%) | 18 (50.0%) |
| 16 and 17 Years | 41 (64.1%) | 26 (100.0%) |
| 18 to 24 Years | 179 (86.9%) | 46 (65.7%) |
| 25 to 34 Years | 102 (86.4%) | 49 (71.0%) |
| 35 to 44 Years | 41 (83.7%) | 132 (79.0%) |
| 45 to 54 Years | 87 (85.3%) | 63 (100.0%) |
| 55 to 64 Years | 51 (92.7%) | 26 (89.7%) |
| 65 to 74 Years | 68 (84.0%) | 22 (91.7%) |
| 75 Years and over | 12 (100.0%) | 22 (100.0%) |
| Total | 716 (78.8%) | 469 (74.2%) |
Income Below Poverty Among Married-Couple Families in Parachute
The poverty statistics for married-couple families in Parachute show that 4.6% or 12 of the total 262 families live below the poverty line. Families with 3 or 4 children have the highest poverty rate of 100.0%, comprising of 2 families. On the other hand, families with no children have the lowest poverty rate of 1.4%, which includes 2 families.
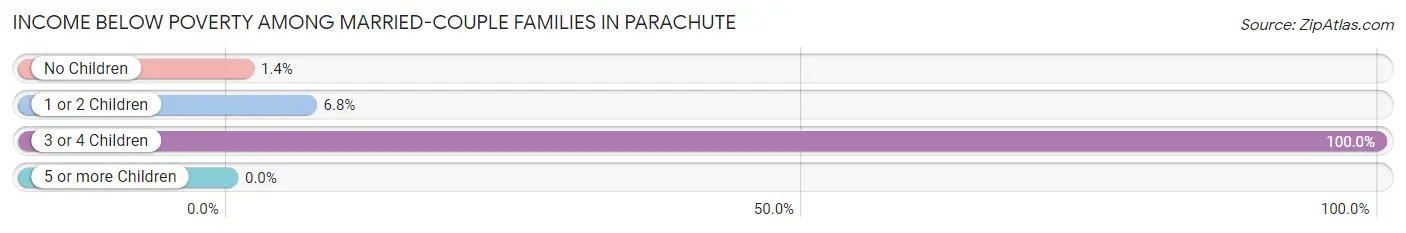
| Children | Above Poverty | Below Poverty |
| No Children | 141 (98.6%) | 2 (1.4%) |
| 1 or 2 Children | 109 (93.2%) | 8 (6.8%) |
| 3 or 4 Children | 0 (0.0%) | 2 (100.0%) |
| 5 or more Children | 0 (0.0%) | 0 (0.0%) |
| Total | 250 (95.4%) | 12 (4.6%) |
Income Below Poverty Among Single-Parent Households in Parachute
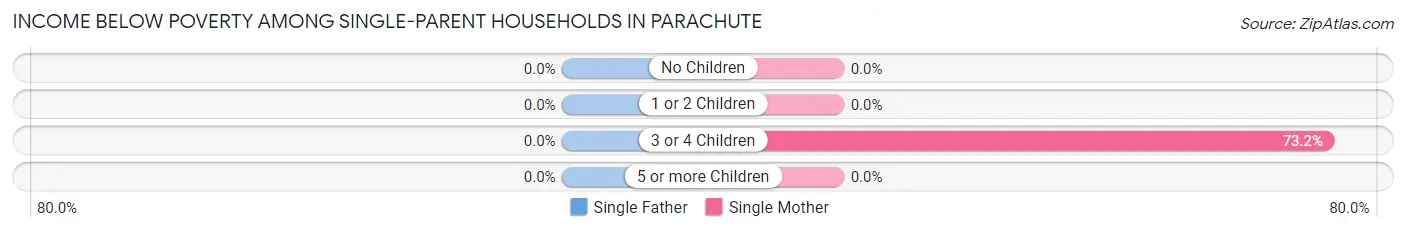
| Children | Single Father | Single Mother |
| No Children | 0 (0.0%) | 0 (0.0%) |
| 1 or 2 Children | 0 (0.0%) | 0 (0.0%) |
| 3 or 4 Children | 0 (0.0%) | 30 (73.2%) |
| 5 or more Children | 0 (0.0%) | 0 (0.0%) |
| Total | 0 (0.0%) | 30 (30.6%) |
Income Below Poverty Among Married-Couple vs Single-Parent Households in Parachute
The poverty data for Parachute shows that 12 of the married-couple family households (4.6%) and 30 of the single-parent households (23.6%) are living below the poverty level. Within the married-couple family households, those with 3 or 4 children have the highest poverty rate, with 2 households (100.0%) falling below the poverty line. Among the single-parent households, those with 3 or 4 children have the highest poverty rate, with 30 household (73.2%) living below poverty.
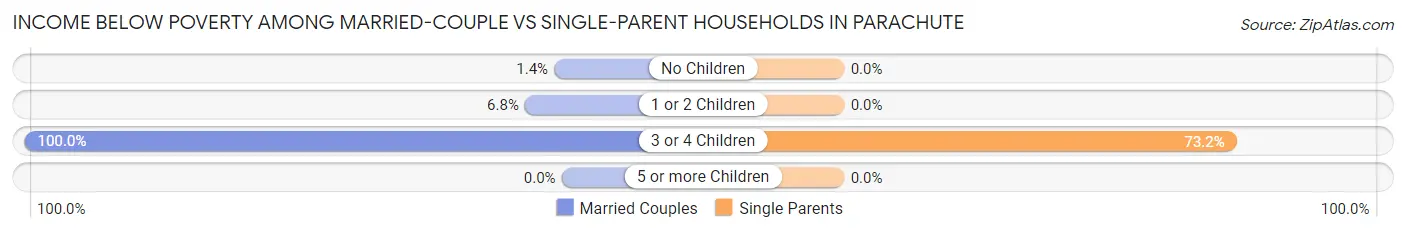
| Children | Married-Couple Families | Single-Parent Households |
| No Children | 2 (1.4%) | 0 (0.0%) |
| 1 or 2 Children | 8 (6.8%) | 0 (0.0%) |
| 3 or 4 Children | 2 (100.0%) | 30 (73.2%) |
| 5 or more Children | 0 (0.0%) | 0 (0.0%) |
| Total | 12 (4.6%) | 30 (23.6%) |
Race in Parachute
The most populous races in Parachute are White / Caucasian (1,334 | 85.8%), Hispanic or Latino (193 | 12.4%), and Two or more Races (67 | 4.3%).
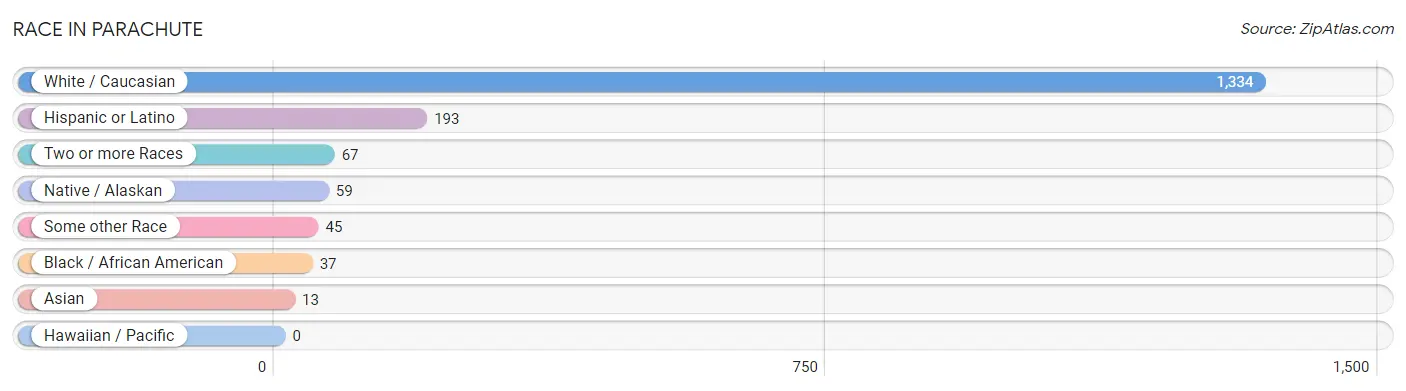
| Race | # Population | % Population |
| Asian | 13 | 0.8% |
| Black / African American | 37 | 2.4% |
| Hawaiian / Pacific | 0 | 0.0% |
| Hispanic or Latino | 193 | 12.4% |
| Native / Alaskan | 59 | 3.8% |
| White / Caucasian | 1,334 | 85.8% |
| Two or more Races | 67 | 4.3% |
| Some other Race | 45 | 2.9% |
| Total | 1,555 | 100.0% |
Ancestry in Parachute
The most populous ancestries reported in Parachute are Irish (279 | 17.9%), German (239 | 15.4%), Mexican (150 | 9.7%), Italian (136 | 8.7%), and English (86 | 5.5%), together accounting for 57.2% of all Parachute residents.
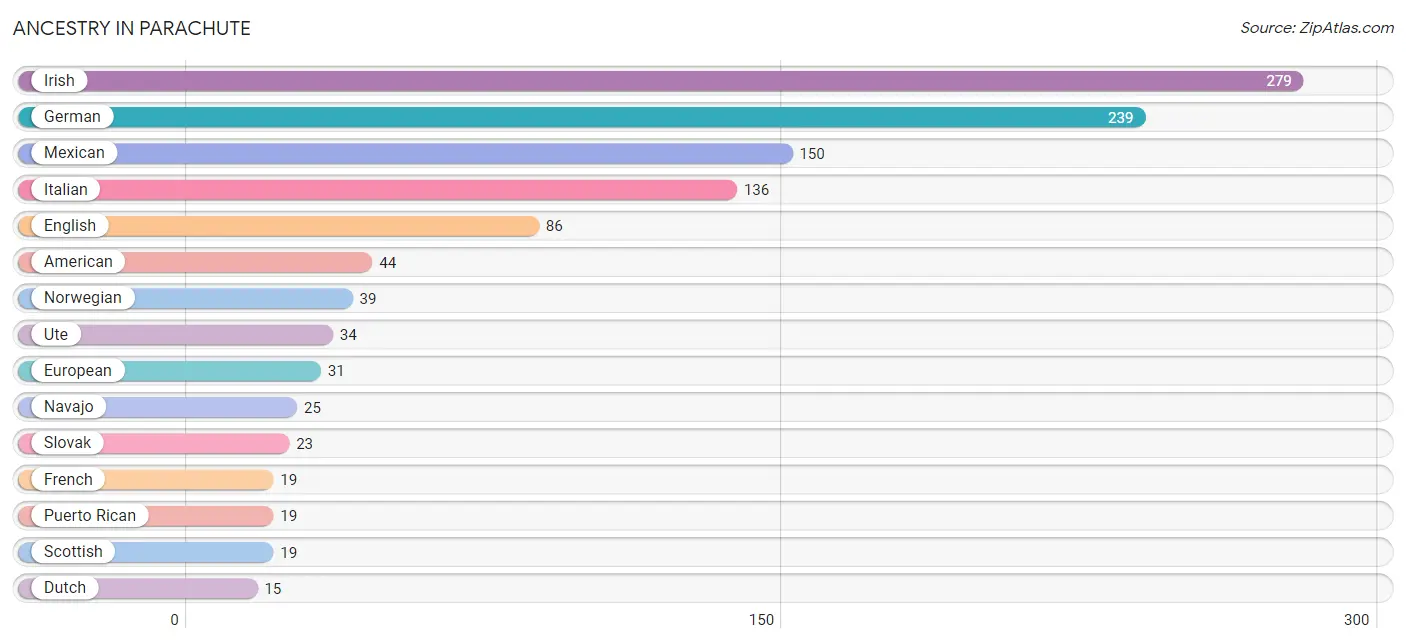
| Ancestry | # Population | % Population |
| American | 44 | 2.8% |
| Czech | 2 | 0.1% |
| Czechoslovakian | 6 | 0.4% |
| Dutch | 15 | 1.0% |
| English | 86 | 5.5% |
| European | 31 | 2.0% |
| Finnish | 4 | 0.3% |
| French | 19 | 1.2% |
| German | 239 | 15.4% |
| Indian (Asian) | 5 | 0.3% |
| Irish | 279 | 17.9% |
| Iroquois | 11 | 0.7% |
| Italian | 136 | 8.7% |
| Korean | 8 | 0.5% |
| Mexican | 150 | 9.7% |
| Native Hawaiian | 6 | 0.4% |
| Navajo | 25 | 1.6% |
| Norwegian | 39 | 2.5% |
| Pennsylvania German | 2 | 0.1% |
| Polish | 8 | 0.5% |
| Puerto Rican | 19 | 1.2% |
| Russian | 8 | 0.5% |
| Scandinavian | 12 | 0.8% |
| Scotch-Irish | 2 | 0.1% |
| Scottish | 19 | 1.2% |
| Slovak | 23 | 1.5% |
| Swedish | 13 | 0.8% |
| Ute | 34 | 2.2% | View All 28 Rows |
Immigrants in Parachute
The most numerous immigrant groups reported in Parachute came from Central America (24 | 1.5%), Latin America (24 | 1.5%), Mexico (24 | 1.5%), Asia (9 | 0.6%), and China (5 | 0.3%), together accounting for 5.5% of all Parachute residents.
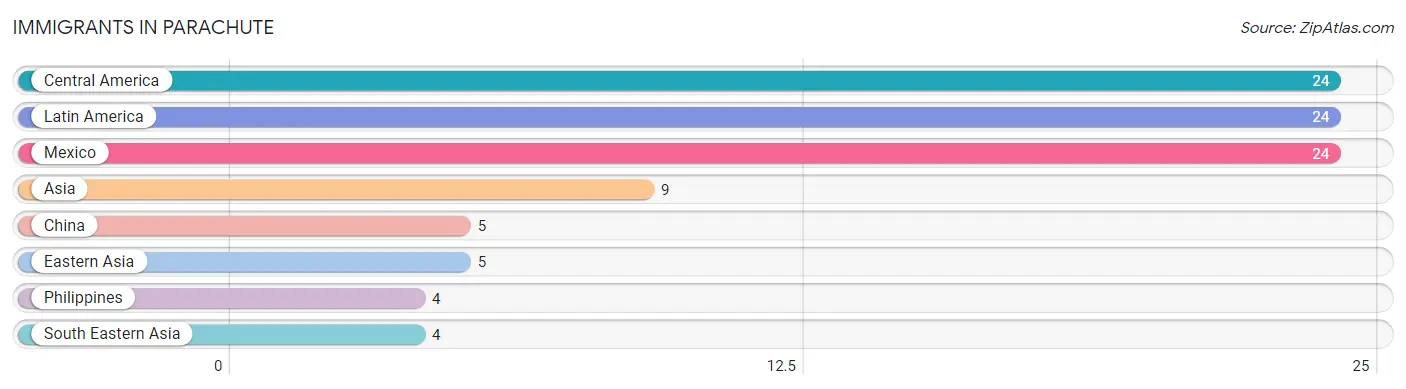
| Immigration Origin | # Population | % Population |
| Asia | 9 | 0.6% |
| Central America | 24 | 1.5% |
| China | 5 | 0.3% |
| Eastern Asia | 5 | 0.3% |
| Latin America | 24 | 1.5% |
| Mexico | 24 | 1.5% |
| Philippines | 4 | 0.3% |
| South Eastern Asia | 4 | 0.3% | View All 8 Rows |
Sex and Age in Parachute
Sex and Age in Parachute
The most populous age groups in Parachute are 15 to 19 Years (222 | 24.2%) for men and 15 to 19 Years (89 | 14.0%) for women.
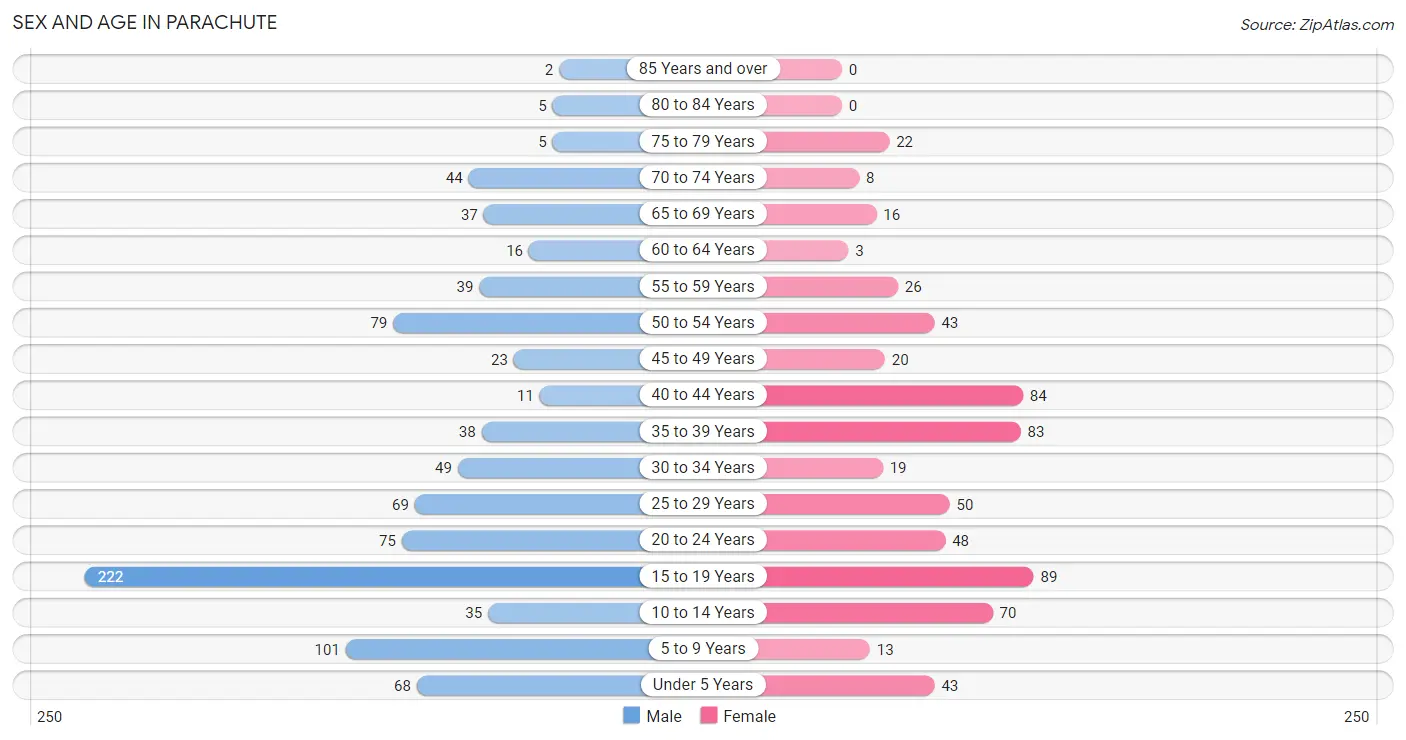
| Age Bracket | Male | Female |
| Under 5 Years | 68 (7.4%) | 43 (6.8%) |
| 5 to 9 Years | 101 (11.0%) | 13 (2.0%) |
| 10 to 14 Years | 35 (3.8%) | 70 (11.0%) |
| 15 to 19 Years | 222 (24.2%) | 89 (14.0%) |
| 20 to 24 Years | 75 (8.2%) | 48 (7.5%) |
| 25 to 29 Years | 69 (7.5%) | 50 (7.9%) |
| 30 to 34 Years | 49 (5.3%) | 19 (3.0%) |
| 35 to 39 Years | 38 (4.1%) | 83 (13.0%) |
| 40 to 44 Years | 11 (1.2%) | 84 (13.2%) |
| 45 to 49 Years | 23 (2.5%) | 20 (3.1%) |
| 50 to 54 Years | 79 (8.6%) | 43 (6.8%) |
| 55 to 59 Years | 39 (4.3%) | 26 (4.1%) |
| 60 to 64 Years | 16 (1.7%) | 3 (0.5%) |
| 65 to 69 Years | 37 (4.0%) | 16 (2.5%) |
| 70 to 74 Years | 44 (4.8%) | 8 (1.3%) |
| 75 to 79 Years | 5 (0.5%) | 22 (3.5%) |
| 80 to 84 Years | 5 (0.5%) | 0 (0.0%) |
| 85 Years and over | 2 (0.2%) | 0 (0.0%) |
| Total | 918 (100.0%) | 637 (100.0%) |
Families and Households in Parachute
Median Family Size in Parachute
The median family size in Parachute is 3.23 persons per family, with single female/mother families (98 | 25.2%) accounting for the largest median family size of 4.98 persons per family. On the other hand, single male/father families (29 | 7.5%) represent the smallest median family size with 2.34 persons per family.
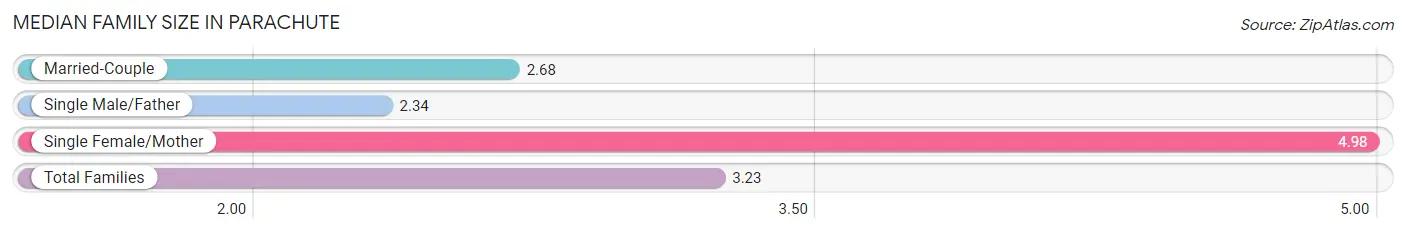
| Family Type | # Families | Family Size |
| Married-Couple | 262 (67.3%) | 2.68 |
| Single Male/Father | 29 (7.5%) | 2.34 |
| Single Female/Mother | 98 (25.2%) | 4.98 |
| Total Families | 389 (100.0%) | 3.23 |
Median Household Size in Parachute
The median household size in Parachute is 2.92 persons per household, with single female/mother households (98 | 18.7%) accounting for the largest median household size of 5.26 persons per household. non-family households (135 | 25.8%) represent the smallest median household size with 1.55 persons per household.
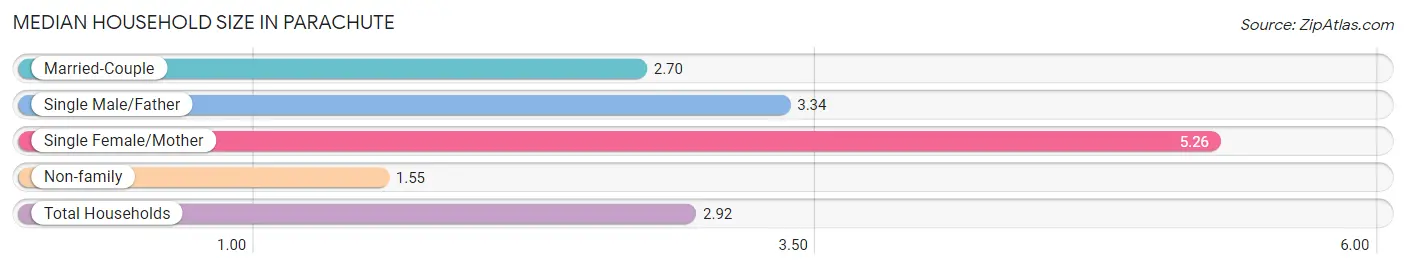
| Household Type | # Households | Household Size |
| Married-Couple | 262 (50.0%) | 2.70 |
| Single Male/Father | 29 (5.5%) | 3.34 |
| Single Female/Mother | 98 (18.7%) | 5.26 |
| Non-family | 135 (25.8%) | 1.55 |
| Total Households | 524 (100.0%) | 2.92 |
Household Size by Marriage Status in Parachute
Out of a total of 524 households in Parachute, 389 (74.2%) are family households, while 135 (25.8%) are nonfamily households. The most numerous type of family households are 2-person households, comprising 146, and the most common type of nonfamily households are 1-person households, comprising 88.
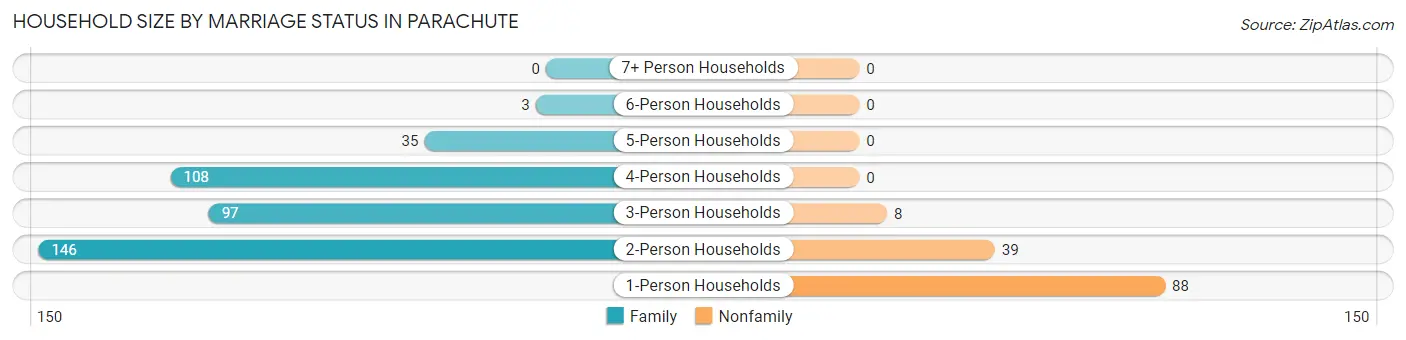
| Household Size | Family Households | Nonfamily Households |
| 1-Person Households | - | 88 (16.8%) |
| 2-Person Households | 146 (27.9%) | 39 (7.4%) |
| 3-Person Households | 97 (18.5%) | 8 (1.5%) |
| 4-Person Households | 108 (20.6%) | 0 (0.0%) |
| 5-Person Households | 35 (6.7%) | 0 (0.0%) |
| 6-Person Households | 3 (0.6%) | 0 (0.0%) |
| 7+ Person Households | 0 (0.0%) | 0 (0.0%) |
| Total | 389 (74.2%) | 135 (25.8%) |
Female Fertility in Parachute
Fertility by Age in Parachute
Average fertility rate in Parachute is 25.0 births per 1,000 women. Women in the age bracket of 20 to 34 years have the highest fertility rate with 85.0 births per 1,000 women. Women in the age bracket of 20 to 34 years acount for 100.0% of all women with births.
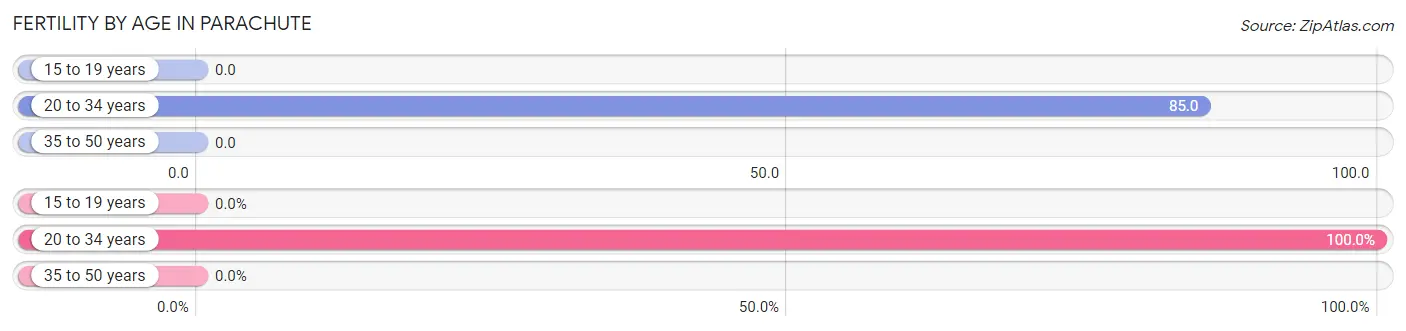
| Age Bracket | Women with Births | Births / 1,000 Women |
| 15 to 19 years | 0 (0.0%) | 0.0 |
| 20 to 34 years | 10 (100.0%) | 85.0 |
| 35 to 50 years | 0 (0.0%) | 0.0 |
| Total | 10 (100.0%) | 25.0 |
Fertility by Age by Marriage Status in Parachute
10.0% of women with births (10) in Parachute are married. The highest percentage of unmarried women with births falls into 20 to 34 years age bracket with 90.0% of them unmarried at the time of birth, while the lowest percentage of unmarried women with births belong to 20 to 34 years age bracket with 90.0% of them unmarried.
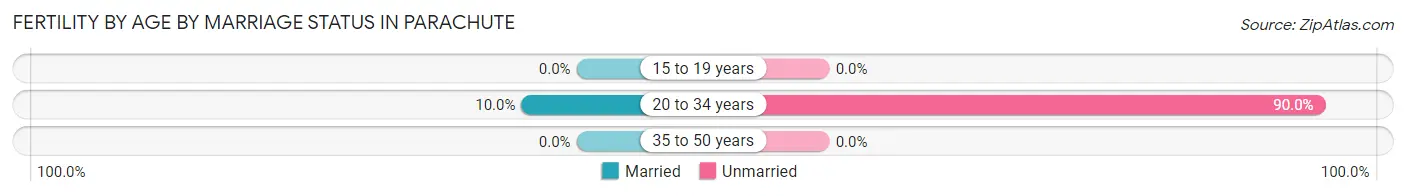
| Age Bracket | Married | Unmarried |
| 15 to 19 years | 0 (0.0%) | 0 (0.0%) |
| 20 to 34 years | 1 (10.0%) | 9 (90.0%) |
| 35 to 50 years | 0 (0.0%) | 0 (0.0%) |
| Total | 1 (10.0%) | 9 (90.0%) |
Fertility by Education in Parachute
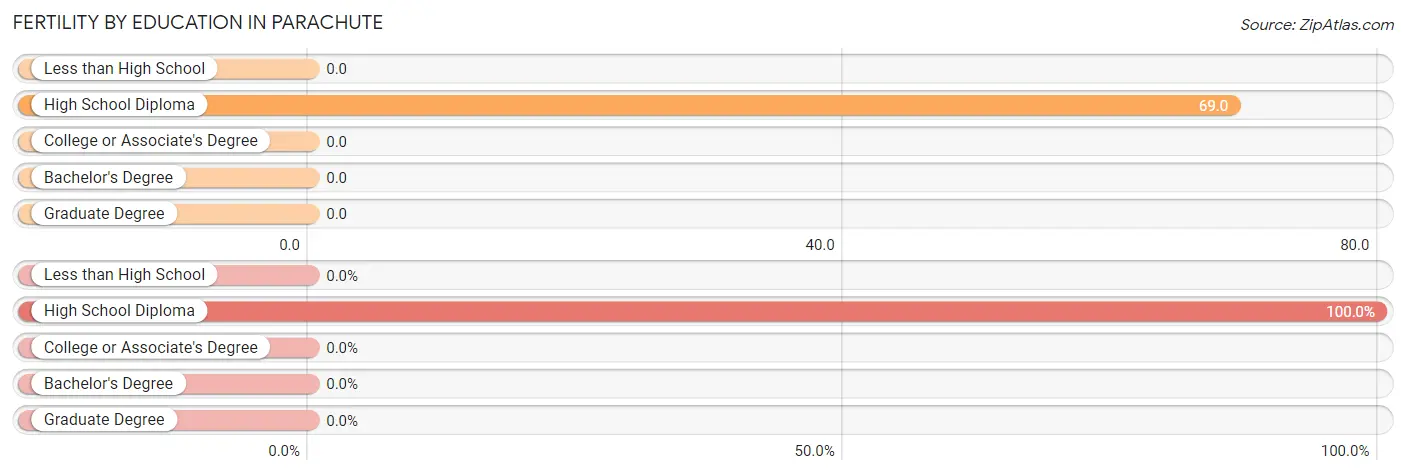
| Educational Attainment | Women with Births | Births / 1,000 Women |
| Less than High School | 0 (0.0%) | 0.0 |
| High School Diploma | 10 (100.0%) | 69.0 |
| College or Associate's Degree | 0 (0.0%) | 0.0 |
| Bachelor's Degree | 0 (0.0%) | 0.0 |
| Graduate Degree | 0 (0.0%) | 0.0 |
| Total | 10 (100.0%) | 25.0 |
Fertility by Education by Marriage Status in Parachute
90.0% of women with births in Parachute are unmarried. Women with the educational attainment of high school diploma are most likely to be married with 10.0% of them married at childbirth, while women with the educational attainment of high school diploma are least likely to be married with 90.0% of them unmarried at childbirth.
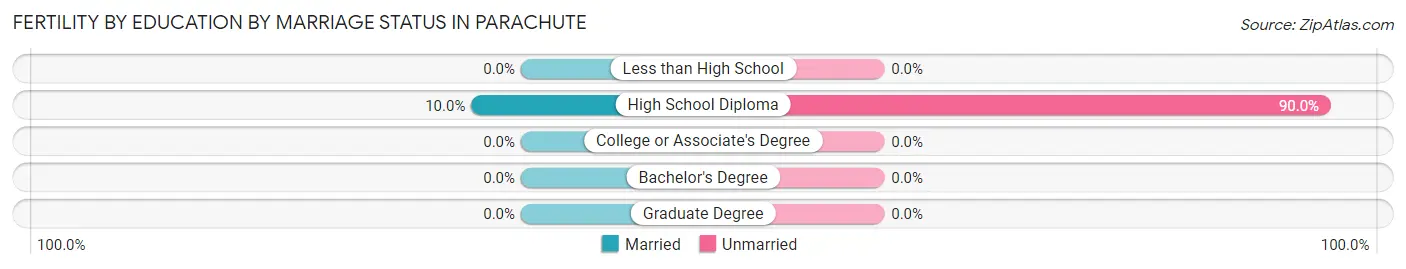
| Educational Attainment | Married | Unmarried |
| Less than High School | 0 (0.0%) | 0 (0.0%) |
| High School Diploma | 1 (10.0%) | 9 (90.0%) |
| College or Associate's Degree | 0 (0.0%) | 0 (0.0%) |
| Bachelor's Degree | 0 (0.0%) | 0 (0.0%) |
| Graduate Degree | 0 (0.0%) | 0 (0.0%) |
| Total | 1 (10.0%) | 9 (90.0%) |
Employment Characteristics in Parachute
Employment by Class of Employer in Parachute
Among the 638 employed individuals in Parachute, private company employees (424 | 66.5%), self-employed (not incorporated) (63 | 9.9%), and self-employed (incorporated) (62 | 9.7%) make up the most common classes of employment.
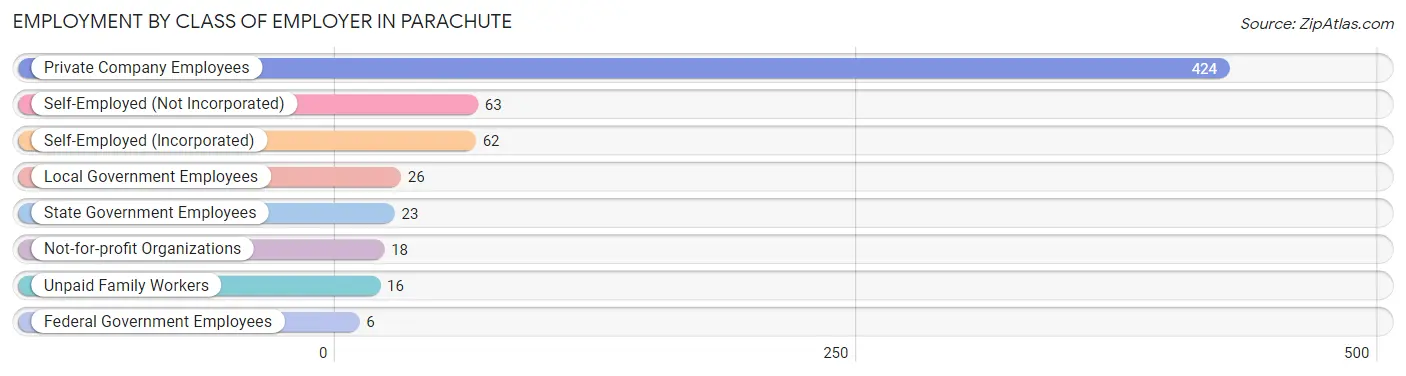
| Employer Class | # Employees | % Employees |
| Private Company Employees | 424 | 66.5% |
| Self-Employed (Incorporated) | 62 | 9.7% |
| Self-Employed (Not Incorporated) | 63 | 9.9% |
| Not-for-profit Organizations | 18 | 2.8% |
| Local Government Employees | 26 | 4.1% |
| State Government Employees | 23 | 3.6% |
| Federal Government Employees | 6 | 0.9% |
| Unpaid Family Workers | 16 | 2.5% |
| Total | 638 | 100.0% |
Employment Status by Age in Parachute
According to the labor force statistics for Parachute, out of the total population over 16 years of age (1,171), 72.0% or 843 individuals are in the labor force, with 19.3% or 163 of them unemployed. The age group with the highest labor force participation rate is 55 to 59 years, with 89.2% or 58 individuals in the labor force. Within the labor force, the 16 to 19 years age range has the highest percentage of unemployed individuals, with 69.5% or 116 of them being unemployed.
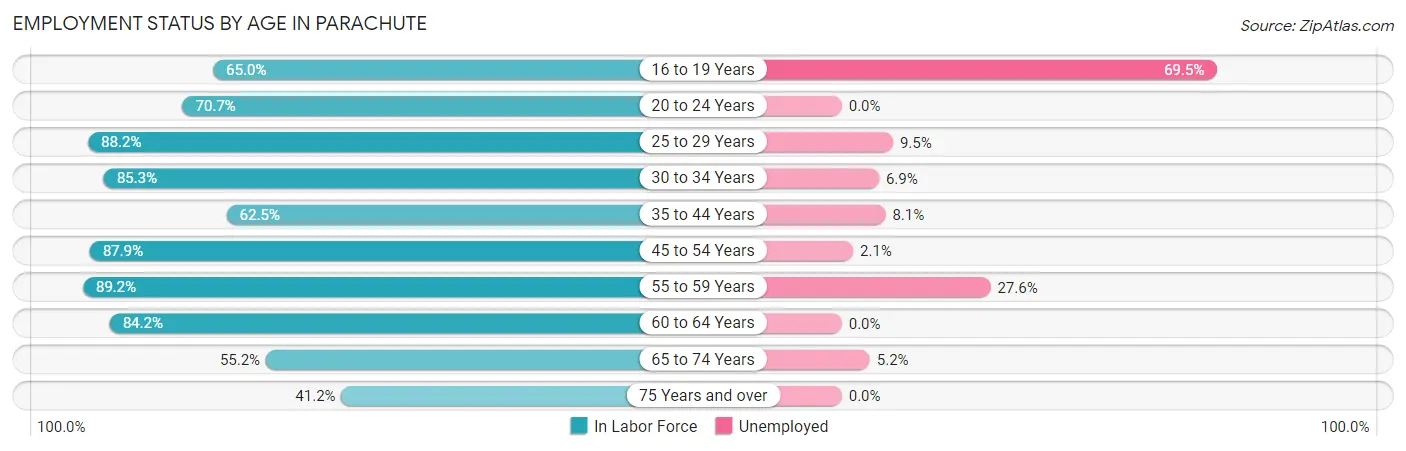
| Age Bracket | In Labor Force | Unemployed |
| 16 to 19 Years | 167 (65.0%) | 116 (69.5%) |
| 20 to 24 Years | 87 (70.7%) | 0 (0.0%) |
| 25 to 29 Years | 105 (88.2%) | 10 (9.5%) |
| 30 to 34 Years | 58 (85.3%) | 4 (6.9%) |
| 35 to 44 Years | 135 (62.5%) | 11 (8.1%) |
| 45 to 54 Years | 145 (87.9%) | 3 (2.1%) |
| 55 to 59 Years | 58 (89.2%) | 16 (27.6%) |
| 60 to 64 Years | 16 (84.2%) | 0 (0.0%) |
| 65 to 74 Years | 58 (55.2%) | 3 (5.2%) |
| 75 Years and over | 14 (41.2%) | 0 (0.0%) |
| Total | 843 (72.0%) | 163 (19.3%) |
Employment Status by Educational Attainment in Parachute
According to labor force statistics for Parachute, 79.3% of individuals (517) out of the total population between 25 and 64 years of age (652) are in the labor force, with 8.5% or 44 of them being unemployed. The group with the highest labor force participation rate are those with the educational attainment of less than high school, with 100.0% or 56 individuals in the labor force. Within the labor force, individuals with less than high school education have the highest percentage of unemployment, with 14.3% or 8 of them being unemployed.
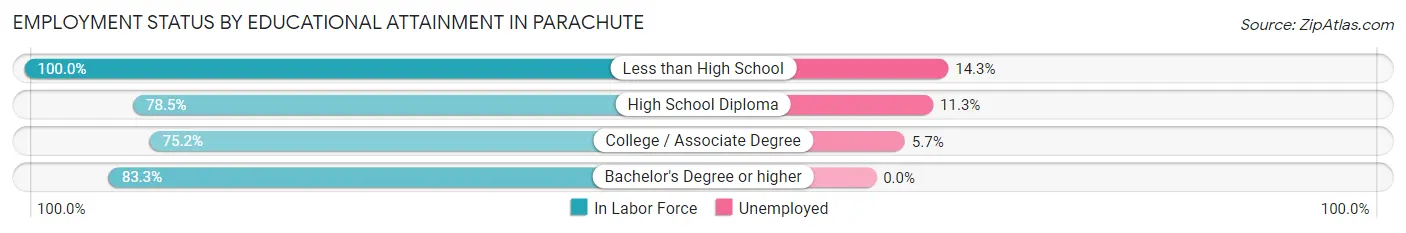
| Educational Attainment | In Labor Force | Unemployed |
| Less than High School | 56 (100.0%) | 8 (14.3%) |
| High School Diploma | 212 (78.5%) | 31 (11.3%) |
| College / Associate Degree | 209 (75.2%) | 16 (5.7%) |
| Bachelor's Degree or higher | 40 (83.3%) | 0 (0.0%) |
| Total | 517 (79.3%) | 55 (8.5%) |
Employment Occupations by Sex in Parachute
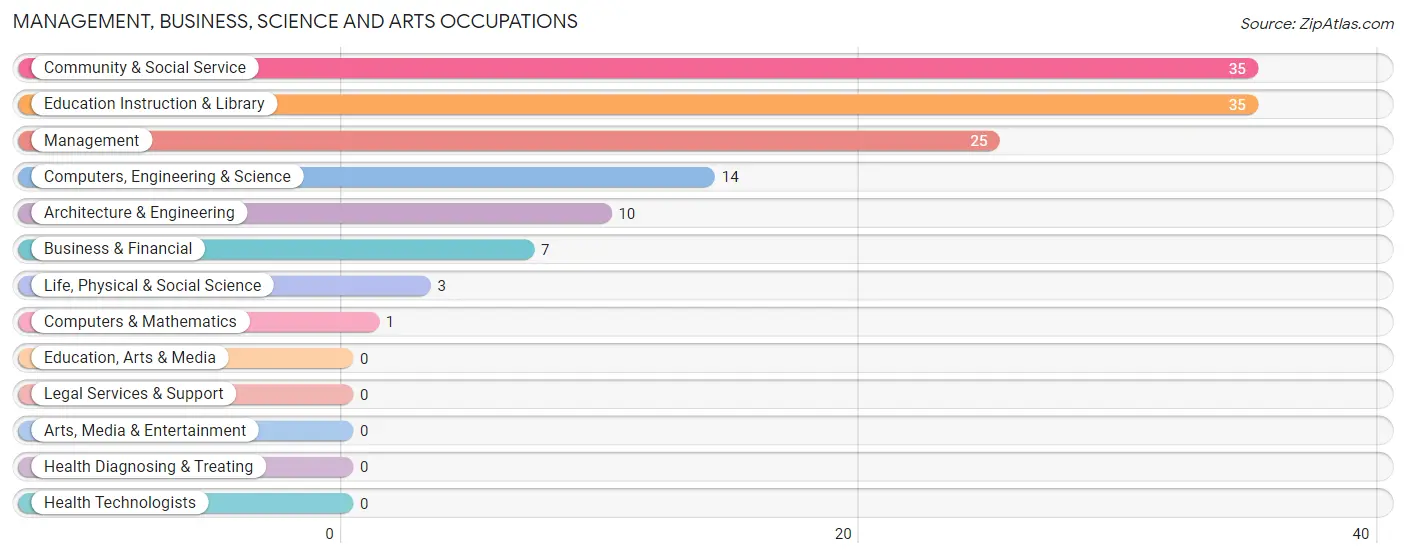
Management, Business, Science and Arts Occupations
The most common Management, Business, Science and Arts occupations in Parachute are Community & Social Service (35 | 5.1%), Education Instruction & Library (35 | 5.1%), Management (25 | 3.7%), Computers, Engineering & Science (14 | 2.1%), and Architecture & Engineering (10 | 1.5%).
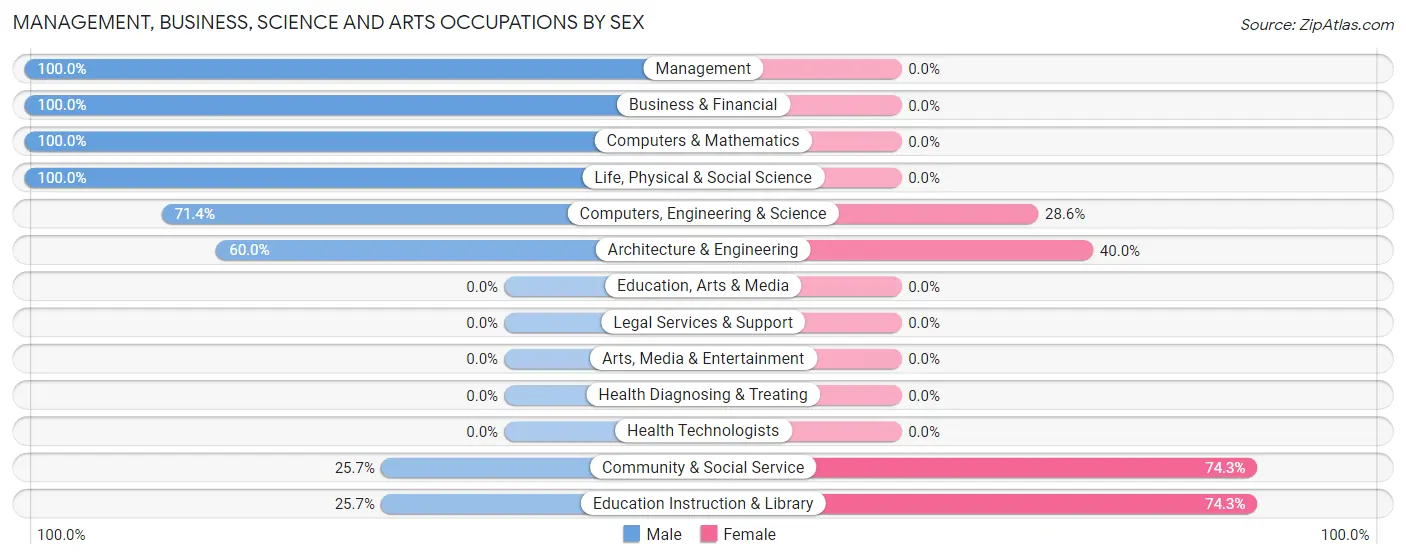
Management, Business, Science and Arts Occupations by Sex
Within the Management, Business, Science and Arts occupations in Parachute, the most male-oriented occupations are Management (100.0%), Business & Financial (100.0%), and Computers & Mathematics (100.0%), while the most female-oriented occupations are Community & Social Service (74.3%), Education Instruction & Library (74.3%), and Architecture & Engineering (40.0%).
| Occupation | Male | Female |
| Management | 25 (100.0%) | 0 (0.0%) |
| Business & Financial | 7 (100.0%) | 0 (0.0%) |
| Computers, Engineering & Science | 10 (71.4%) | 4 (28.6%) |
| Computers & Mathematics | 1 (100.0%) | 0 (0.0%) |
| Architecture & Engineering | 6 (60.0%) | 4 (40.0%) |
| Life, Physical & Social Science | 3 (100.0%) | 0 (0.0%) |
| Community & Social Service | 9 (25.7%) | 26 (74.3%) |
| Education, Arts & Media | 0 (0.0%) | 0 (0.0%) |
| Legal Services & Support | 0 (0.0%) | 0 (0.0%) |
| Education Instruction & Library | 9 (25.7%) | 26 (74.3%) |
| Arts, Media & Entertainment | 0 (0.0%) | 0 (0.0%) |
| Health Diagnosing & Treating | 0 (0.0%) | 0 (0.0%) |
| Health Technologists | 0 (0.0%) | 0 (0.0%) |
| Total (Category) | 51 (63.0%) | 30 (37.0%) |
| Total (Overall) | 397 (58.4%) | 283 (41.6%) |
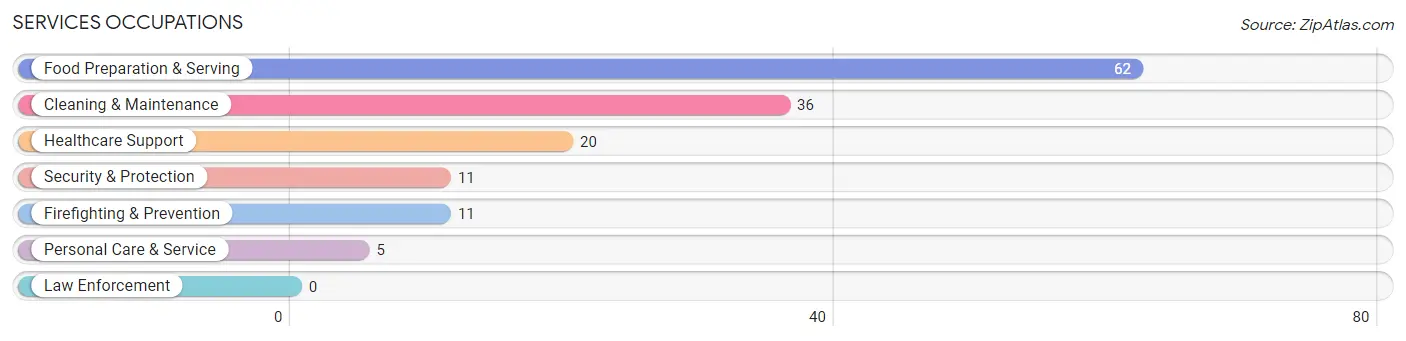
Services Occupations
The most common Services occupations in Parachute are Food Preparation & Serving (62 | 9.1%), Cleaning & Maintenance (36 | 5.3%), Healthcare Support (20 | 2.9%), Security & Protection (11 | 1.6%), and Firefighting & Prevention (11 | 1.6%).
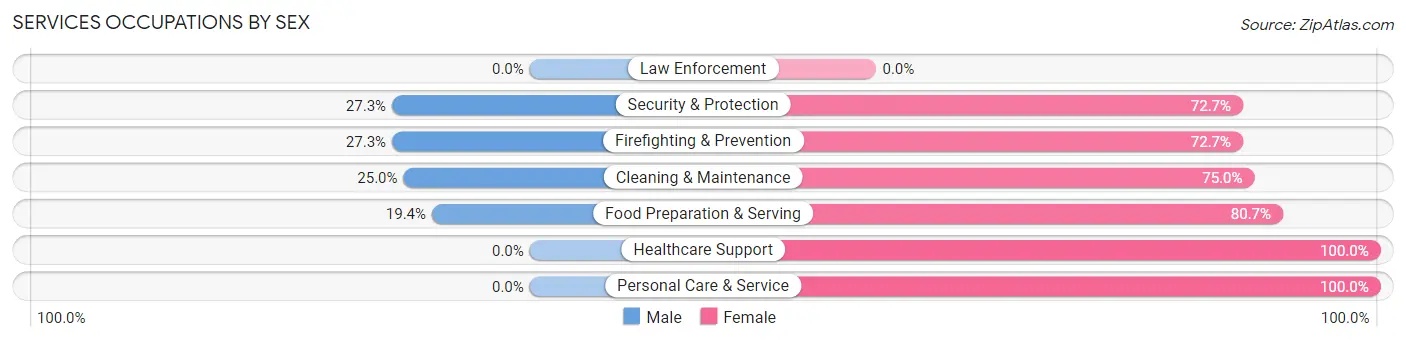
Services Occupations by Sex
Within the Services occupations in Parachute, the most male-oriented occupations are Security & Protection (27.3%), Firefighting & Prevention (27.3%), and Cleaning & Maintenance (25.0%), while the most female-oriented occupations are Healthcare Support (100.0%), Personal Care & Service (100.0%), and Food Preparation & Serving (80.6%).
| Occupation | Male | Female |
| Healthcare Support | 0 (0.0%) | 20 (100.0%) |
| Security & Protection | 3 (27.3%) | 8 (72.7%) |
| Firefighting & Prevention | 3 (27.3%) | 8 (72.7%) |
| Law Enforcement | 0 (0.0%) | 0 (0.0%) |
| Food Preparation & Serving | 12 (19.4%) | 50 (80.6%) |
| Cleaning & Maintenance | 9 (25.0%) | 27 (75.0%) |
| Personal Care & Service | 0 (0.0%) | 5 (100.0%) |
| Total (Category) | 24 (17.9%) | 110 (82.1%) |
| Total (Overall) | 397 (58.4%) | 283 (41.6%) |
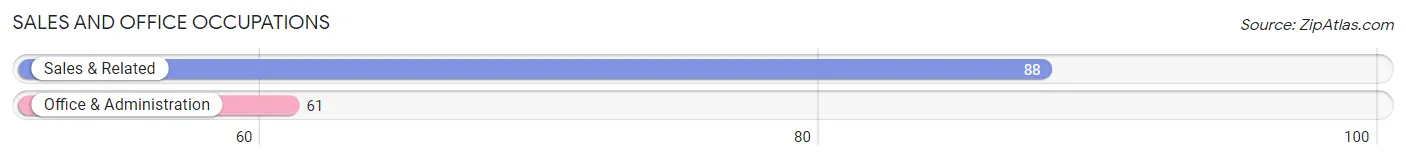
Sales and Office Occupations
The most common Sales and Office occupations in Parachute are Sales & Related (88 | 12.9%), and Office & Administration (61 | 9.0%).
Sales and Office Occupations by Sex
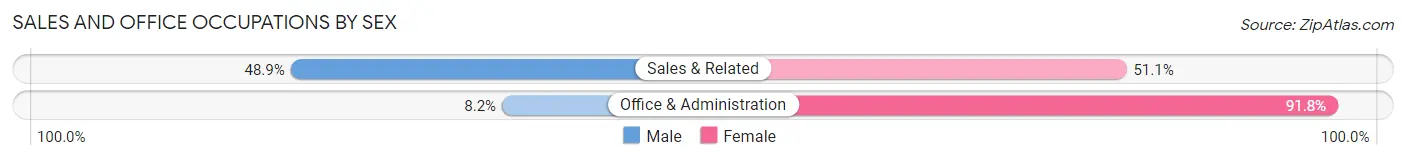
| Occupation | Male | Female |
| Sales & Related | 43 (48.9%) | 45 (51.1%) |
| Office & Administration | 5 (8.2%) | 56 (91.8%) |
| Total (Category) | 48 (32.2%) | 101 (67.8%) |
| Total (Overall) | 397 (58.4%) | 283 (41.6%) |
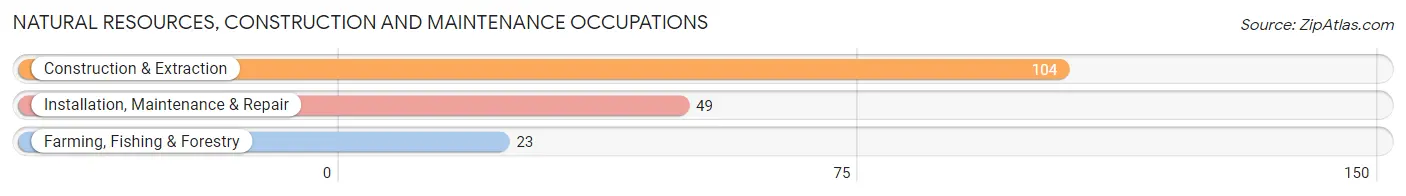
Natural Resources, Construction and Maintenance Occupations
The most common Natural Resources, Construction and Maintenance occupations in Parachute are Construction & Extraction (104 | 15.3%), Installation, Maintenance & Repair (49 | 7.2%), and Farming, Fishing & Forestry (23 | 3.4%).
Natural Resources, Construction and Maintenance Occupations by Sex
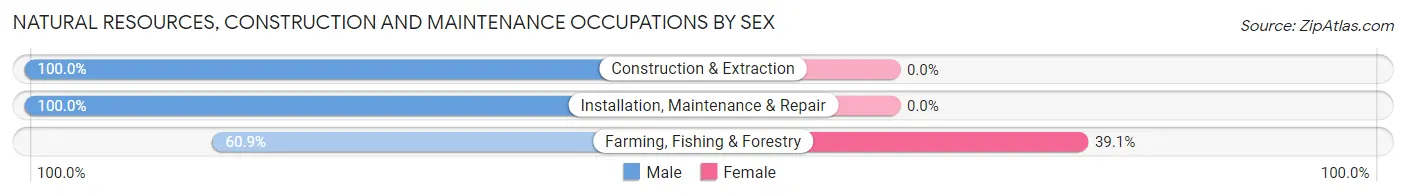
| Occupation | Male | Female |
| Farming, Fishing & Forestry | 14 (60.9%) | 9 (39.1%) |
| Construction & Extraction | 104 (100.0%) | 0 (0.0%) |
| Installation, Maintenance & Repair | 49 (100.0%) | 0 (0.0%) |
| Total (Category) | 167 (94.9%) | 9 (5.1%) |
| Total (Overall) | 397 (58.4%) | 283 (41.6%) |
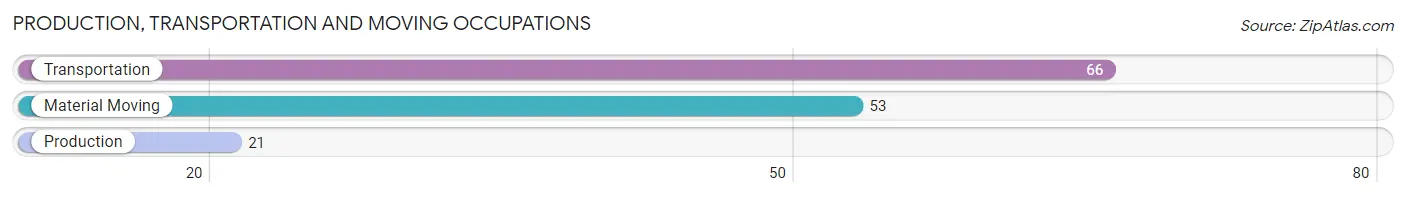
Production, Transportation and Moving Occupations
The most common Production, Transportation and Moving occupations in Parachute are Transportation (66 | 9.7%), Material Moving (53 | 7.8%), and Production (21 | 3.1%).
Production, Transportation and Moving Occupations by Sex
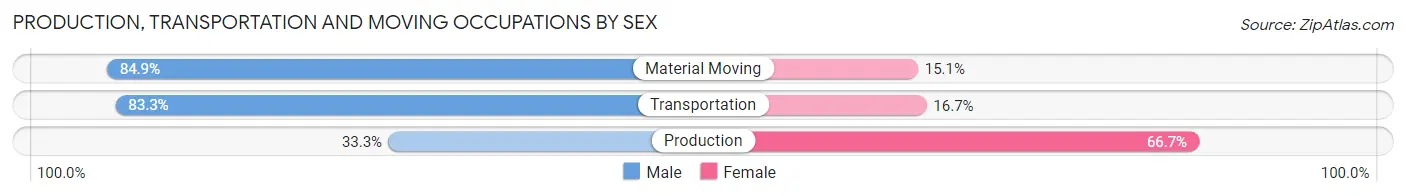
| Occupation | Male | Female |
| Production | 7 (33.3%) | 14 (66.7%) |
| Transportation | 55 (83.3%) | 11 (16.7%) |
| Material Moving | 45 (84.9%) | 8 (15.1%) |
| Total (Category) | 107 (76.4%) | 33 (23.6%) |
| Total (Overall) | 397 (58.4%) | 283 (41.6%) |
Employment Industries by Sex in Parachute
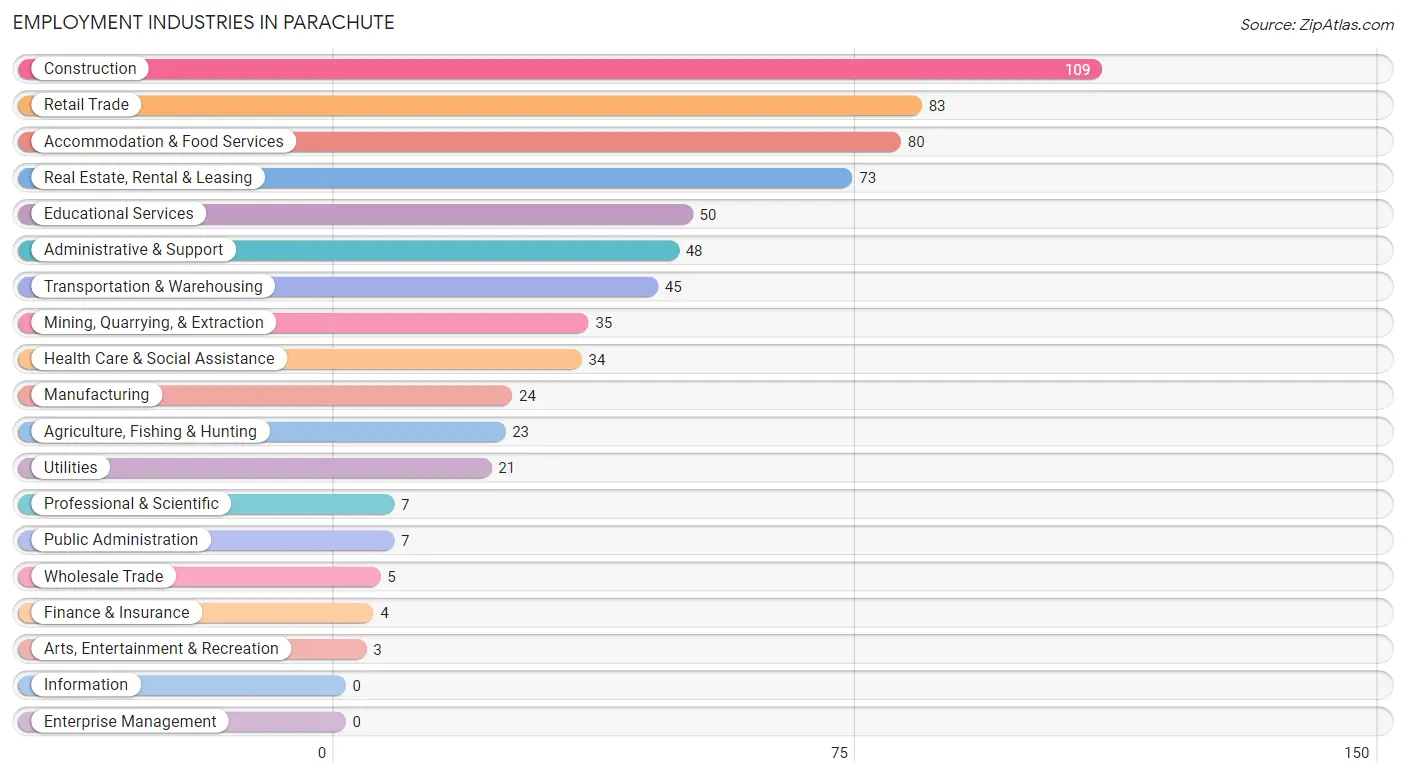
Employment Industries in Parachute
The major employment industries in Parachute include Construction (109 | 16.0%), Retail Trade (83 | 12.2%), Accommodation & Food Services (80 | 11.8%), Real Estate, Rental & Leasing (73 | 10.7%), and Educational Services (50 | 7.3%).
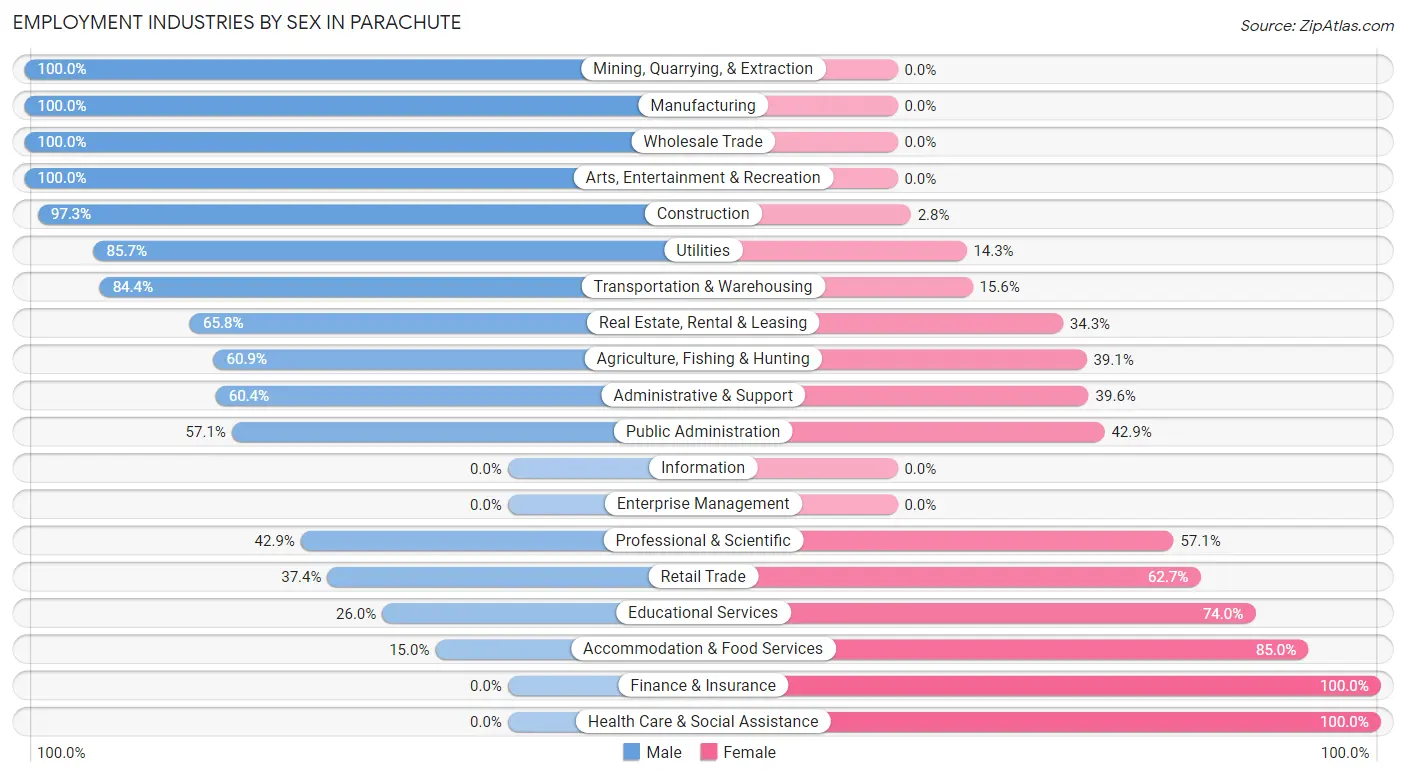
Employment Industries by Sex in Parachute
The Parachute industries that see more men than women are Mining, Quarrying, & Extraction (100.0%), Manufacturing (100.0%), and Wholesale Trade (100.0%), whereas the industries that tend to have a higher number of women are Finance & Insurance (100.0%), Health Care & Social Assistance (100.0%), and Accommodation & Food Services (85.0%).
| Industry | Male | Female |
| Agriculture, Fishing & Hunting | 14 (60.9%) | 9 (39.1%) |
| Mining, Quarrying, & Extraction | 35 (100.0%) | 0 (0.0%) |
| Construction | 106 (97.3%) | 3 (2.8%) |
| Manufacturing | 24 (100.0%) | 0 (0.0%) |
| Wholesale Trade | 5 (100.0%) | 0 (0.0%) |
| Retail Trade | 31 (37.3%) | 52 (62.6%) |
| Transportation & Warehousing | 38 (84.4%) | 7 (15.6%) |
| Utilities | 18 (85.7%) | 3 (14.3%) |
| Information | 0 (0.0%) | 0 (0.0%) |
| Finance & Insurance | 0 (0.0%) | 4 (100.0%) |
| Real Estate, Rental & Leasing | 48 (65.7%) | 25 (34.3%) |
| Professional & Scientific | 3 (42.9%) | 4 (57.1%) |
| Enterprise Management | 0 (0.0%) | 0 (0.0%) |
| Administrative & Support | 29 (60.4%) | 19 (39.6%) |
| Educational Services | 13 (26.0%) | 37 (74.0%) |
| Health Care & Social Assistance | 0 (0.0%) | 34 (100.0%) |
| Arts, Entertainment & Recreation | 3 (100.0%) | 0 (0.0%) |
| Accommodation & Food Services | 12 (15.0%) | 68 (85.0%) |
| Public Administration | 4 (57.1%) | 3 (42.9%) |
| Total | 397 (58.4%) | 283 (41.6%) |
Education in Parachute
School Enrollment in Parachute
The most common levels of schooling among the 485 students in Parachute are high school (171 | 35.3%), elementary school (108 | 22.3%), and college / undergraduate (89 | 18.3%).
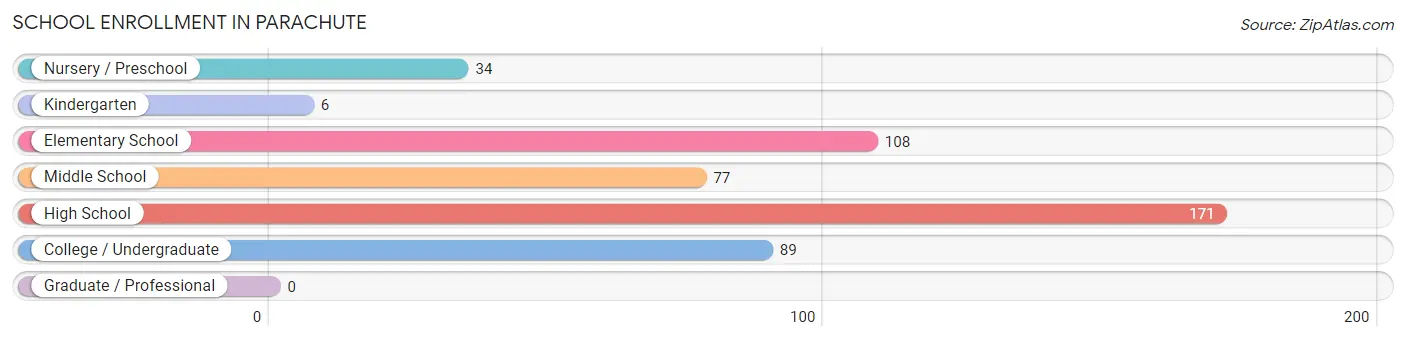
| School Level | # Students | % Students |
| Nursery / Preschool | 34 | 7.0% |
| Kindergarten | 6 | 1.2% |
| Elementary School | 108 | 22.3% |
| Middle School | 77 | 15.9% |
| High School | 171 | 35.3% |
| College / Undergraduate | 89 | 18.3% |
| Graduate / Professional | 0 | 0.0% |
| Total | 485 | 100.0% |
School Enrollment by Age by Funding Source in Parachute
Out of a total of 485 students who are enrolled in schools in Parachute, 60 (12.4%) attend a private institution, while the remaining 425 (87.6%) are enrolled in public schools. The age group of 20 to 24 year olds has the highest likelihood of being enrolled in private schools, with 4 (44.4% in the age bracket) enrolled. Conversely, the age group of 25 to 34 year olds has the lowest likelihood of being enrolled in a private school, with 2 (100.0% in the age bracket) attending a public institution.
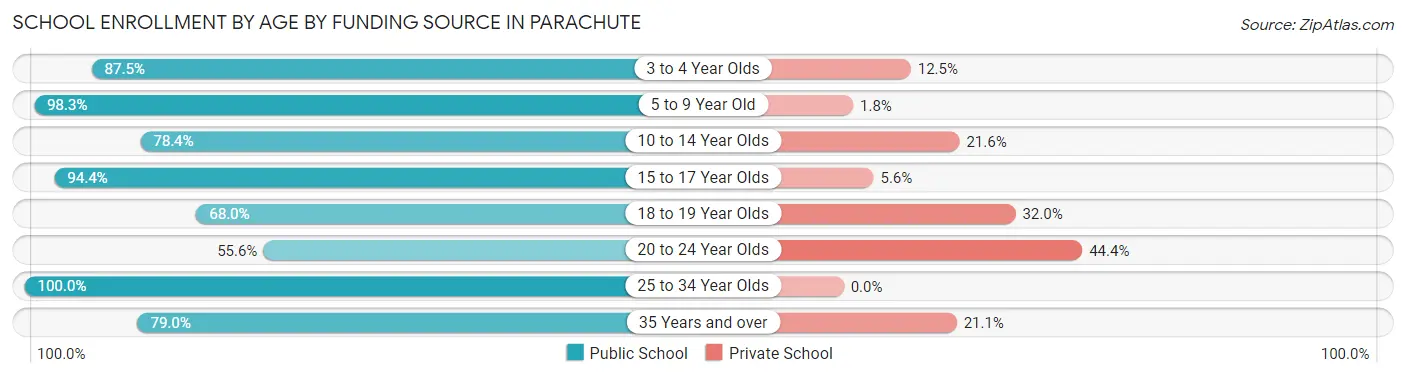
| Age Bracket | Public School | Private School |
| 3 to 4 Year Olds | 28 (87.5%) | 4 (12.5%) |
| 5 to 9 Year Old | 112 (98.3%) | 2 (1.8%) |
| 10 to 14 Year Olds | 80 (78.4%) | 22 (21.6%) |
| 15 to 17 Year Olds | 136 (94.4%) | 8 (5.6%) |
| 18 to 19 Year Olds | 17 (68.0%) | 8 (32.0%) |
| 20 to 24 Year Olds | 5 (55.6%) | 4 (44.4%) |
| 25 to 34 Year Olds | 2 (100.0%) | 0 (0.0%) |
| 35 Years and over | 45 (78.9%) | 12 (21.0%) |
| Total | 425 (87.6%) | 60 (12.4%) |
Educational Attainment by Field of Study in Parachute
Bio, nature & agricultural (15 | 25.0%), education (14 | 23.3%), engineering (12 | 20.0%), visual & performing arts (10 | 16.7%), and science & technology (5 | 8.3%) are the most common fields of study among 60 individuals in Parachute who have obtained a bachelor's degree or higher.
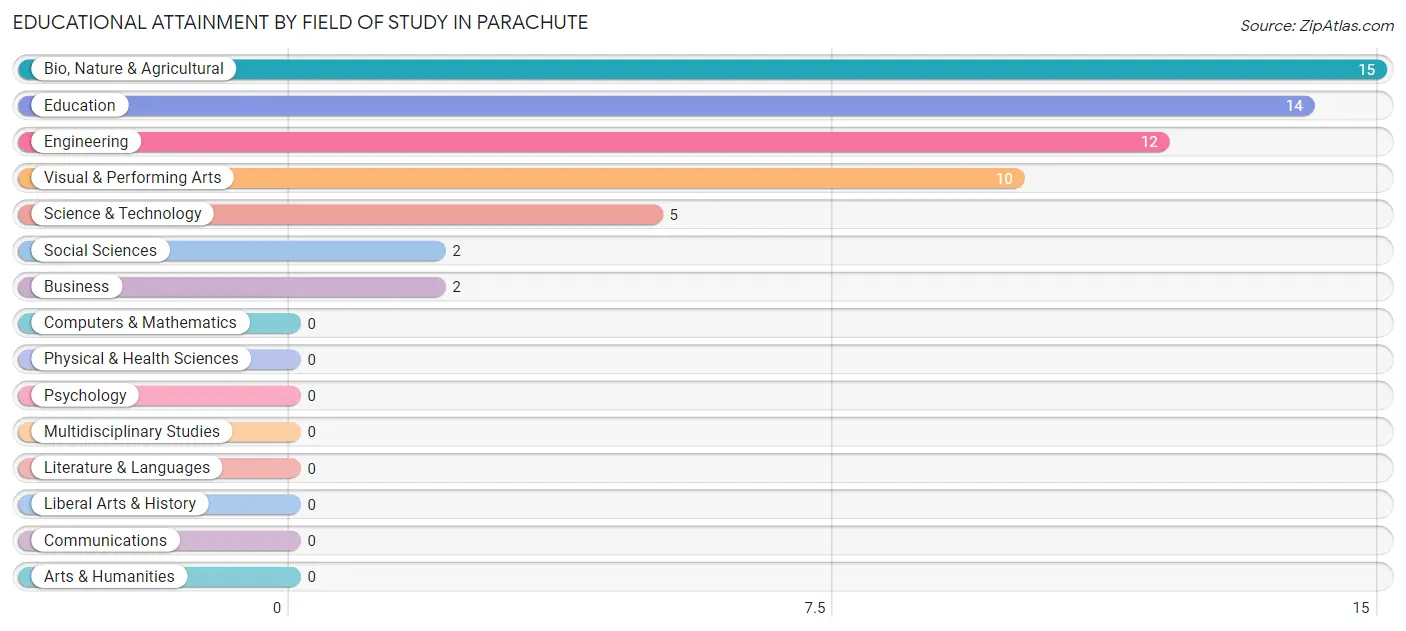
| Field of Study | # Graduates | % Graduates |
| Computers & Mathematics | 0 | 0.0% |
| Bio, Nature & Agricultural | 15 | 25.0% |
| Physical & Health Sciences | 0 | 0.0% |
| Psychology | 0 | 0.0% |
| Social Sciences | 2 | 3.3% |
| Engineering | 12 | 20.0% |
| Multidisciplinary Studies | 0 | 0.0% |
| Science & Technology | 5 | 8.3% |
| Business | 2 | 3.3% |
| Education | 14 | 23.3% |
| Literature & Languages | 0 | 0.0% |
| Liberal Arts & History | 0 | 0.0% |
| Visual & Performing Arts | 10 | 16.7% |
| Communications | 0 | 0.0% |
| Arts & Humanities | 0 | 0.0% |
| Total | 60 | 100.0% |
Transportation & Commute in Parachute
Vehicle Availability by Sex in Parachute
The most prevalent vehicle ownership categories in Parachute are males with 2 vehicles (160, accounting for 41.2%) and females with 2 vehicles (89, making up 67.5%).
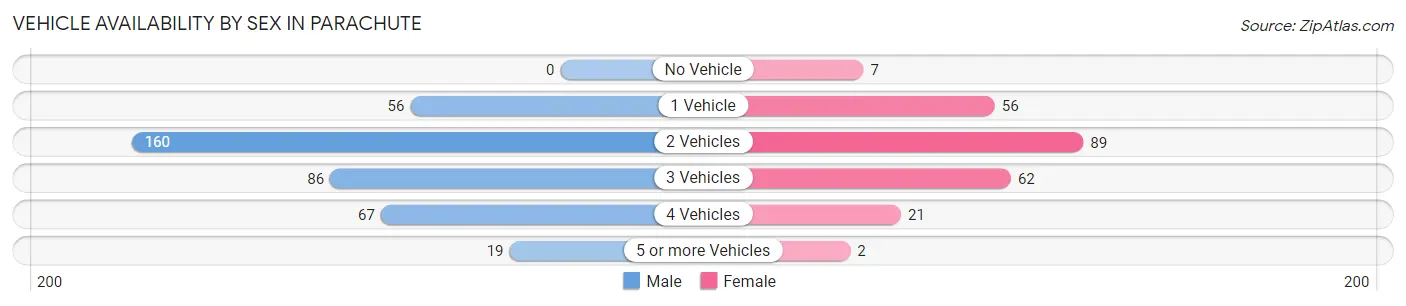
| Vehicles Available | Male | Female |
| No Vehicle | 0 (0.0%) | 7 (2.9%) |
| 1 Vehicle | 56 (14.4%) | 56 (23.6%) |
| 2 Vehicles | 160 (41.2%) | 89 (37.6%) |
| 3 Vehicles | 86 (22.2%) | 62 (26.2%) |
| 4 Vehicles | 67 (17.3%) | 21 (8.9%) |
| 5 or more Vehicles | 19 (4.9%) | 2 (0.8%) |
| Total | 388 (100.0%) | 237 (100.0%) |
Commute Time in Parachute
The most frequently occuring commute durations in Parachute are 20 to 24 minutes (102 commuters, 18.0%), 45 to 59 minutes (91 commuters, 16.1%), and 60 to 89 minutes (73 commuters, 12.9%).
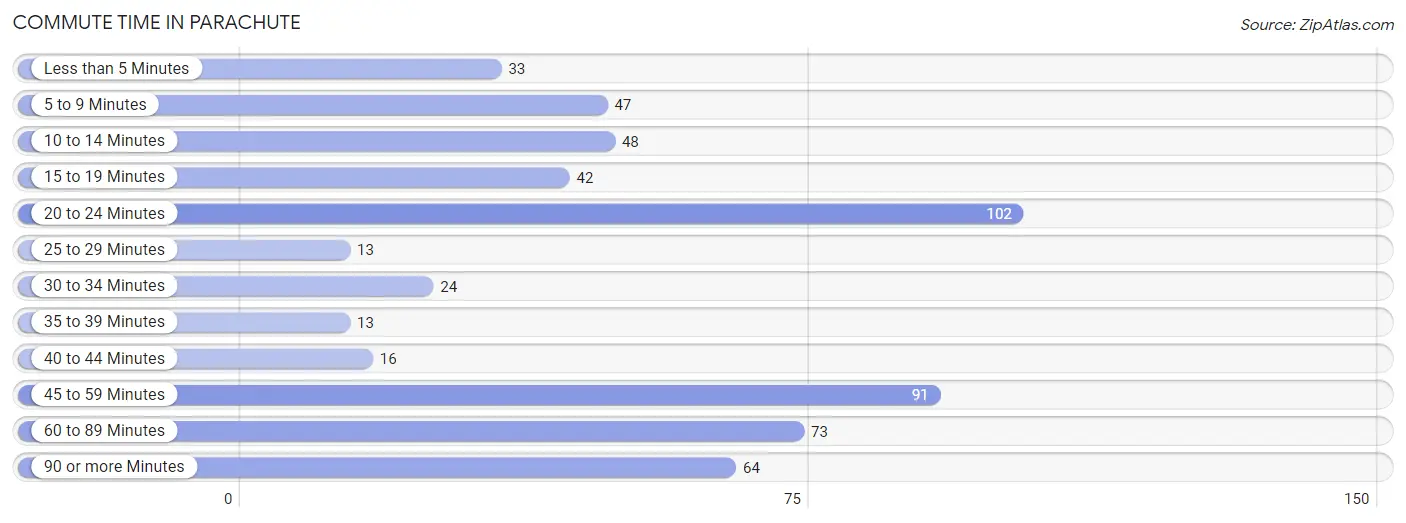
| Commute Time | # Commuters | % Commuters |
| Less than 5 Minutes | 33 | 5.8% |
| 5 to 9 Minutes | 47 | 8.3% |
| 10 to 14 Minutes | 48 | 8.5% |
| 15 to 19 Minutes | 42 | 7.4% |
| 20 to 24 Minutes | 102 | 18.0% |
| 25 to 29 Minutes | 13 | 2.3% |
| 30 to 34 Minutes | 24 | 4.2% |
| 35 to 39 Minutes | 13 | 2.3% |
| 40 to 44 Minutes | 16 | 2.8% |
| 45 to 59 Minutes | 91 | 16.1% |
| 60 to 89 Minutes | 73 | 12.9% |
| 90 or more Minutes | 64 | 11.3% |
Commute Time by Sex in Parachute
The most common commute times in Parachute are 20 to 24 minutes (66 commuters, 18.8%) for males and 45 to 59 minutes (45 commuters, 21.0%) for females.
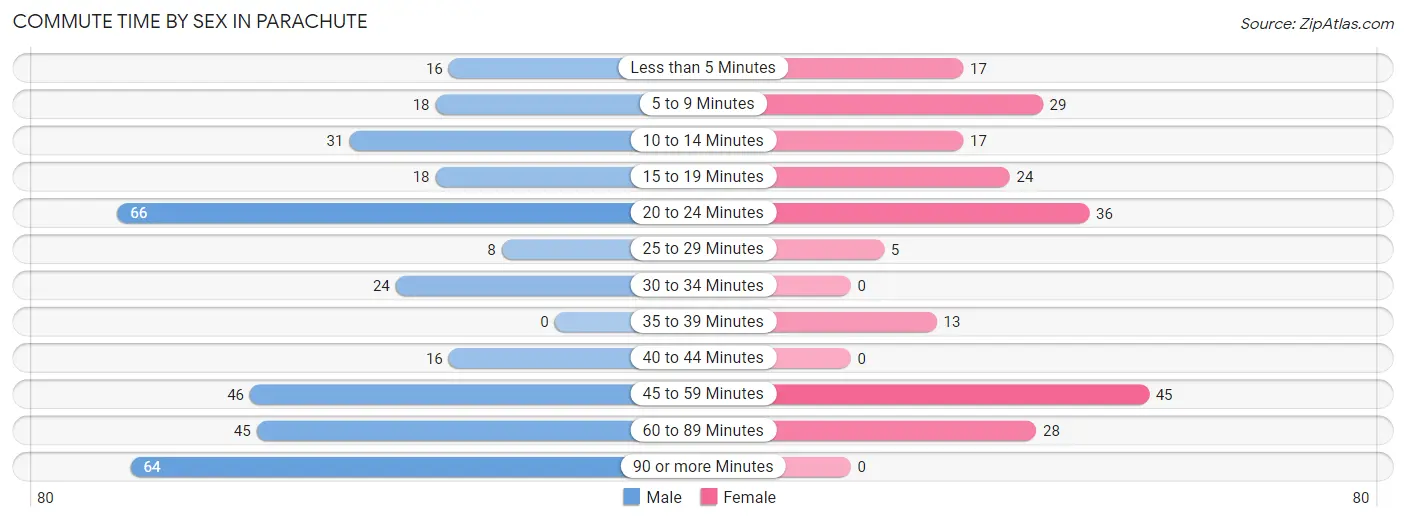
| Commute Time | Male | Female |
| Less than 5 Minutes | 16 (4.5%) | 17 (7.9%) |
| 5 to 9 Minutes | 18 (5.1%) | 29 (13.6%) |
| 10 to 14 Minutes | 31 (8.8%) | 17 (7.9%) |
| 15 to 19 Minutes | 18 (5.1%) | 24 (11.2%) |
| 20 to 24 Minutes | 66 (18.8%) | 36 (16.8%) |
| 25 to 29 Minutes | 8 (2.3%) | 5 (2.3%) |
| 30 to 34 Minutes | 24 (6.8%) | 0 (0.0%) |
| 35 to 39 Minutes | 0 (0.0%) | 13 (6.1%) |
| 40 to 44 Minutes | 16 (4.5%) | 0 (0.0%) |
| 45 to 59 Minutes | 46 (13.1%) | 45 (21.0%) |
| 60 to 89 Minutes | 45 (12.8%) | 28 (13.1%) |
| 90 or more Minutes | 64 (18.2%) | 0 (0.0%) |
Time of Departure to Work by Sex in Parachute
The most frequent times of departure to work in Parachute are 6:00 AM to 6:29 AM (102, 29.0%) for males and 7:30 AM to 7:59 AM (63, 29.4%) for females.
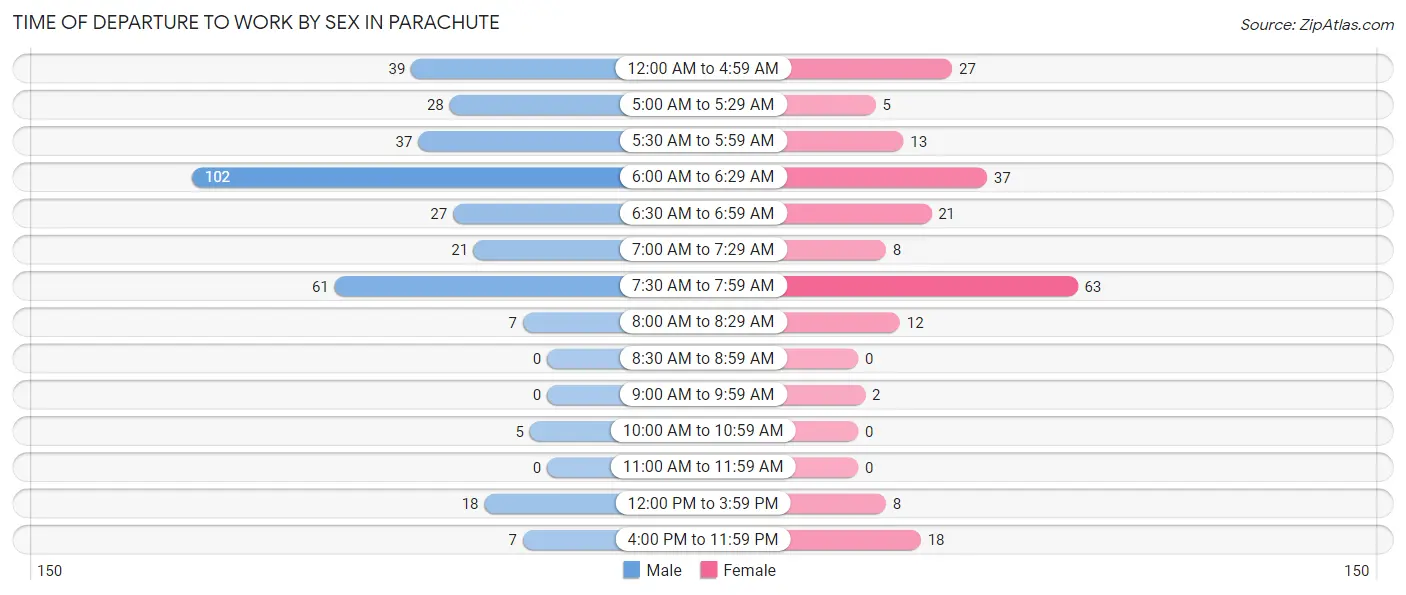
| Time of Departure | Male | Female |
| 12:00 AM to 4:59 AM | 39 (11.1%) | 27 (12.6%) |
| 5:00 AM to 5:29 AM | 28 (8.0%) | 5 (2.3%) |
| 5:30 AM to 5:59 AM | 37 (10.5%) | 13 (6.1%) |
| 6:00 AM to 6:29 AM | 102 (29.0%) | 37 (17.3%) |
| 6:30 AM to 6:59 AM | 27 (7.7%) | 21 (9.8%) |
| 7:00 AM to 7:29 AM | 21 (6.0%) | 8 (3.7%) |
| 7:30 AM to 7:59 AM | 61 (17.3%) | 63 (29.4%) |
| 8:00 AM to 8:29 AM | 7 (2.0%) | 12 (5.6%) |
| 8:30 AM to 8:59 AM | 0 (0.0%) | 0 (0.0%) |
| 9:00 AM to 9:59 AM | 0 (0.0%) | 2 (0.9%) |
| 10:00 AM to 10:59 AM | 5 (1.4%) | 0 (0.0%) |
| 11:00 AM to 11:59 AM | 0 (0.0%) | 0 (0.0%) |
| 12:00 PM to 3:59 PM | 18 (5.1%) | 8 (3.7%) |
| 4:00 PM to 11:59 PM | 7 (2.0%) | 18 (8.4%) |
| Total | 352 (100.0%) | 214 (100.0%) |
Housing Occupancy in Parachute
Occupancy by Ownership in Parachute
Of the total 524 dwellings in Parachute, owner-occupied units account for 257 (49.0%), while renter-occupied units make up 267 (50.9%).
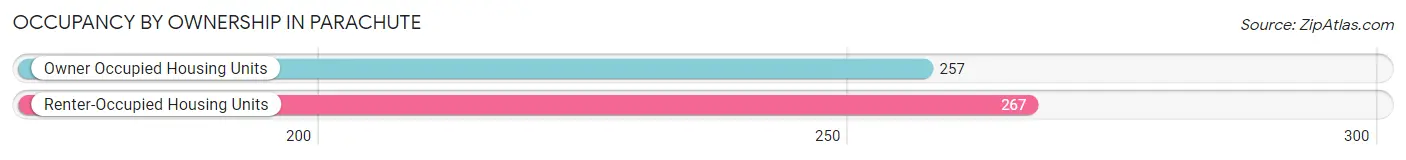
| Occupancy | # Housing Units | % Housing Units |
| Owner Occupied Housing Units | 257 | 49.0% |
| Renter-Occupied Housing Units | 267 | 50.9% |
| Total Occupied Housing Units | 524 | 100.0% |
Occupancy by Household Size in Parachute
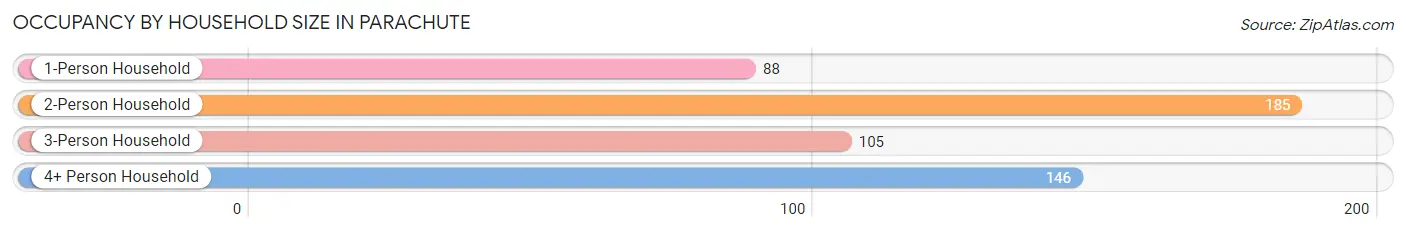
| Household Size | # Housing Units | % Housing Units |
| 1-Person Household | 88 | 16.8% |
| 2-Person Household | 185 | 35.3% |
| 3-Person Household | 105 | 20.0% |
| 4+ Person Household | 146 | 27.9% |
| Total Housing Units | 524 | 100.0% |
Occupancy by Ownership by Household Size in Parachute
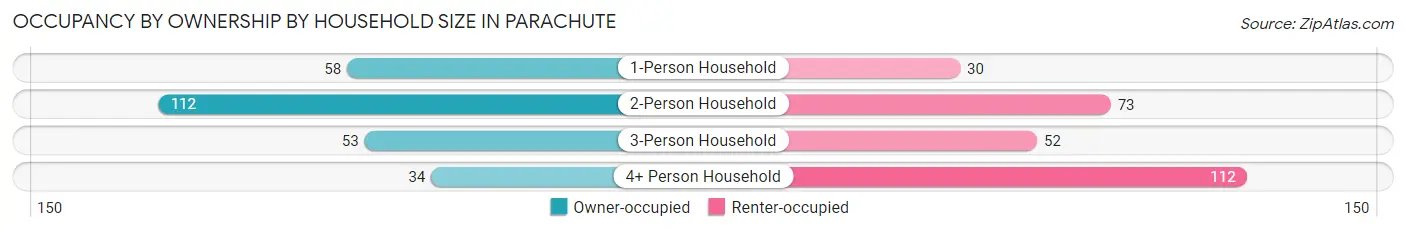
| Household Size | Owner-occupied | Renter-occupied |
| 1-Person Household | 58 (65.9%) | 30 (34.1%) |
| 2-Person Household | 112 (60.5%) | 73 (39.5%) |
| 3-Person Household | 53 (50.5%) | 52 (49.5%) |
| 4+ Person Household | 34 (23.3%) | 112 (76.7%) |
| Total Housing Units | 257 (49.0%) | 267 (50.9%) |
Occupancy by Educational Attainment in Parachute
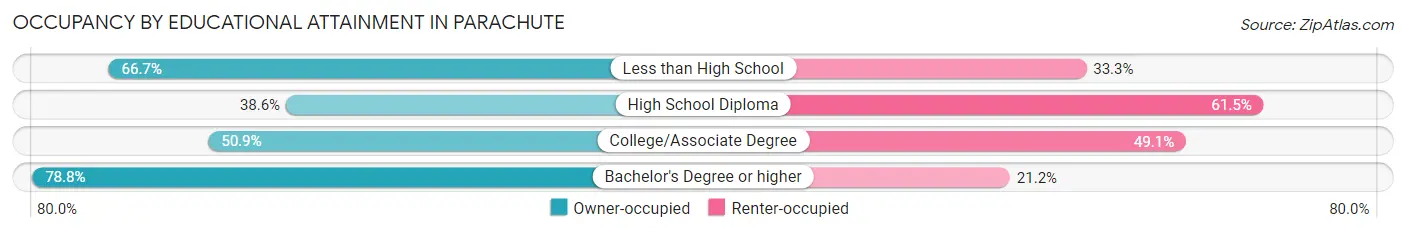
| Household Size | Owner-occupied | Renter-occupied |
| Less than High School | 14 (66.7%) | 7 (33.3%) |
| High School Diploma | 69 (38.6%) | 110 (61.5%) |
| College/Associate Degree | 148 (50.9%) | 143 (49.1%) |
| Bachelor's Degree or higher | 26 (78.8%) | 7 (21.2%) |
Occupancy by Age of Householder in Parachute
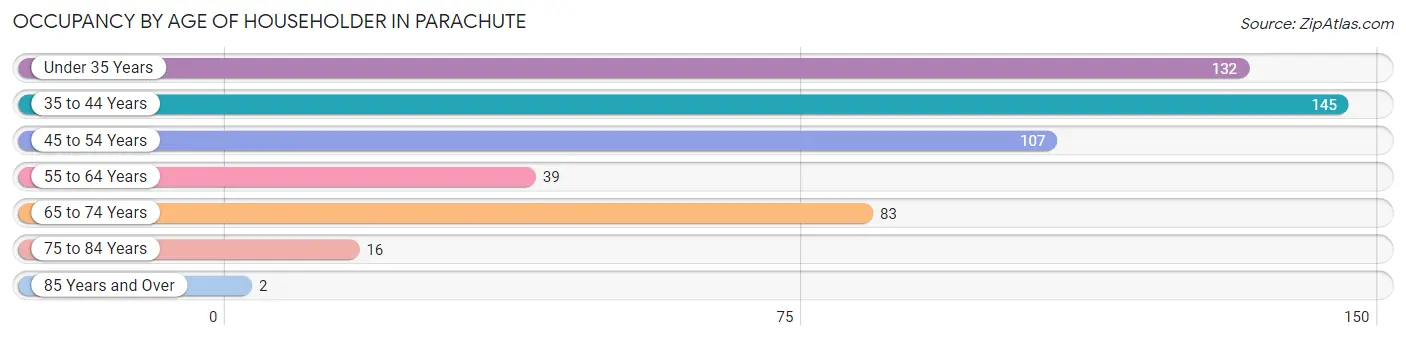
| Age Bracket | # Households | % Households |
| Under 35 Years | 132 | 25.2% |
| 35 to 44 Years | 145 | 27.7% |
| 45 to 54 Years | 107 | 20.4% |
| 55 to 64 Years | 39 | 7.4% |
| 65 to 74 Years | 83 | 15.8% |
| 75 to 84 Years | 16 | 3.0% |
| 85 Years and Over | 2 | 0.4% |
| Total | 524 | 100.0% |
Housing Finances in Parachute
Median Income by Occupancy in Parachute
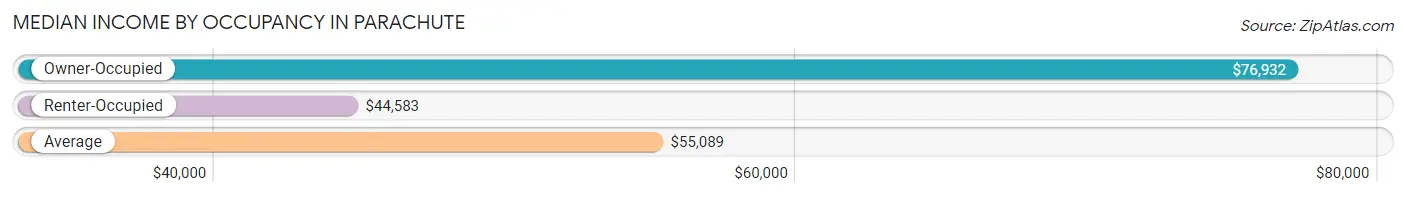
| Occupancy Type | # Households | Median Income |
| Owner-Occupied | 257 (49.0%) | $76,932 |
| Renter-Occupied | 267 (50.9%) | $44,583 |
| Average | 524 (100.0%) | $55,089 |
Occupancy by Householder Income Bracket in Parachute
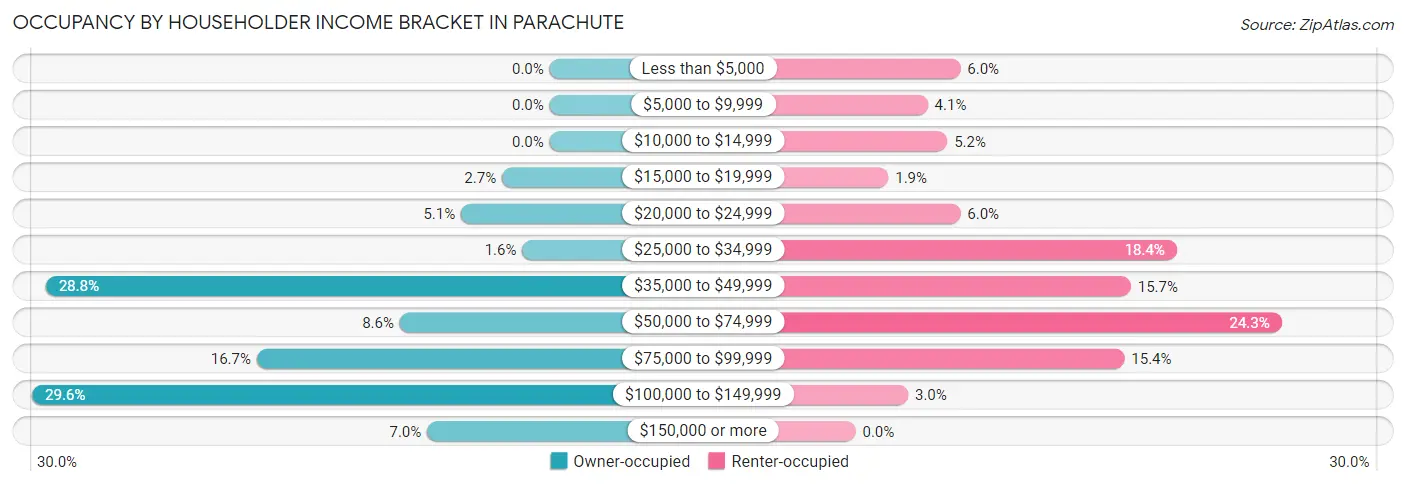
| Income Bracket | Owner-occupied | Renter-occupied |
| Less than $5,000 | 0 (0.0%) | 16 (6.0%) |
| $5,000 to $9,999 | 0 (0.0%) | 11 (4.1%) |
| $10,000 to $14,999 | 0 (0.0%) | 14 (5.2%) |
| $15,000 to $19,999 | 7 (2.7%) | 5 (1.9%) |
| $20,000 to $24,999 | 13 (5.1%) | 16 (6.0%) |
| $25,000 to $34,999 | 4 (1.6%) | 49 (18.3%) |
| $35,000 to $49,999 | 74 (28.8%) | 42 (15.7%) |
| $50,000 to $74,999 | 22 (8.6%) | 65 (24.3%) |
| $75,000 to $99,999 | 43 (16.7%) | 41 (15.4%) |
| $100,000 to $149,999 | 76 (29.6%) | 8 (3.0%) |
| $150,000 or more | 18 (7.0%) | 0 (0.0%) |
| Total | 257 (100.0%) | 267 (100.0%) |
Monthly Housing Cost Tiers in Parachute
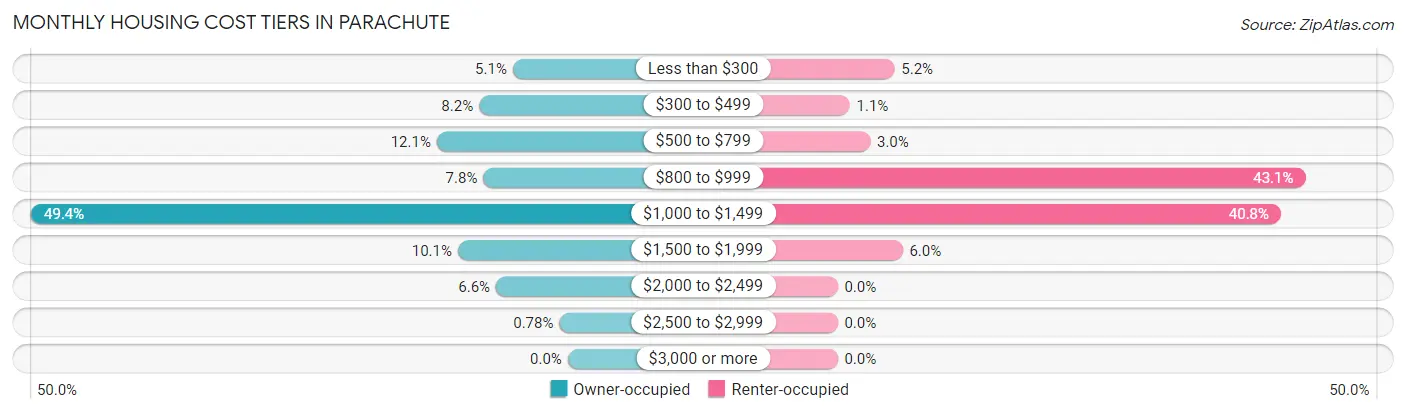
| Monthly Cost | Owner-occupied | Renter-occupied |
| Less than $300 | 13 (5.1%) | 14 (5.2%) |
| $300 to $499 | 21 (8.2%) | 3 (1.1%) |
| $500 to $799 | 31 (12.1%) | 8 (3.0%) |
| $800 to $999 | 20 (7.8%) | 115 (43.1%) |
| $1,000 to $1,499 | 127 (49.4%) | 109 (40.8%) |
| $1,500 to $1,999 | 26 (10.1%) | 16 (6.0%) |
| $2,000 to $2,499 | 17 (6.6%) | 0 (0.0%) |
| $2,500 to $2,999 | 2 (0.8%) | 0 (0.0%) |
| $3,000 or more | 0 (0.0%) | 0 (0.0%) |
| Total | 257 (100.0%) | 267 (100.0%) |
Physical Housing Characteristics in Parachute
Housing Structures in Parachute
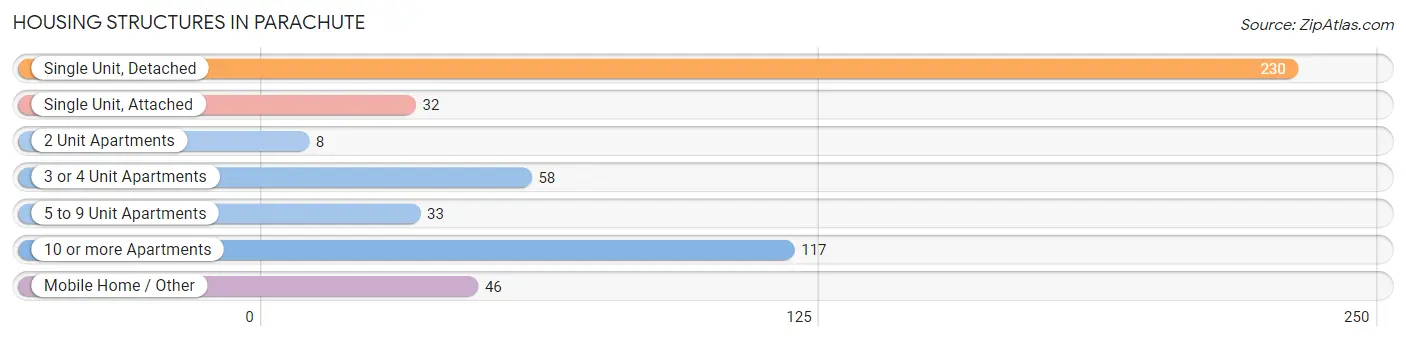
| Structure Type | # Housing Units | % Housing Units |
| Single Unit, Detached | 230 | 43.9% |
| Single Unit, Attached | 32 | 6.1% |
| 2 Unit Apartments | 8 | 1.5% |
| 3 or 4 Unit Apartments | 58 | 11.1% |
| 5 to 9 Unit Apartments | 33 | 6.3% |
| 10 or more Apartments | 117 | 22.3% |
| Mobile Home / Other | 46 | 8.8% |
| Total | 524 | 100.0% |
Housing Structures by Occupancy in Parachute
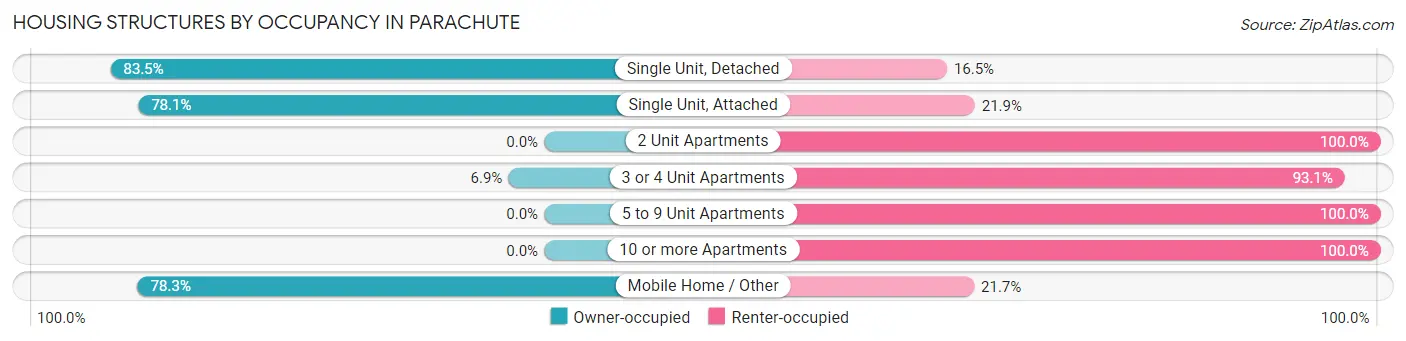
| Structure Type | Owner-occupied | Renter-occupied |
| Single Unit, Detached | 192 (83.5%) | 38 (16.5%) |
| Single Unit, Attached | 25 (78.1%) | 7 (21.9%) |
| 2 Unit Apartments | 0 (0.0%) | 8 (100.0%) |
| 3 or 4 Unit Apartments | 4 (6.9%) | 54 (93.1%) |
| 5 to 9 Unit Apartments | 0 (0.0%) | 33 (100.0%) |
| 10 or more Apartments | 0 (0.0%) | 117 (100.0%) |
| Mobile Home / Other | 36 (78.3%) | 10 (21.7%) |
| Total | 257 (49.0%) | 267 (50.9%) |
Housing Structures by Number of Rooms in Parachute
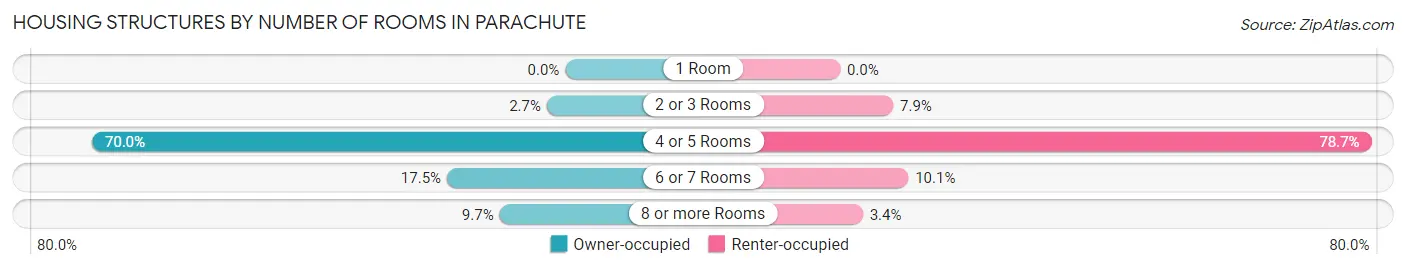
| Number of Rooms | Owner-occupied | Renter-occupied |
| 1 Room | 0 (0.0%) | 0 (0.0%) |
| 2 or 3 Rooms | 7 (2.7%) | 21 (7.9%) |
| 4 or 5 Rooms | 180 (70.0%) | 210 (78.6%) |
| 6 or 7 Rooms | 45 (17.5%) | 27 (10.1%) |
| 8 or more Rooms | 25 (9.7%) | 9 (3.4%) |
| Total | 257 (100.0%) | 267 (100.0%) |
Housing Structure by Heating Type in Parachute
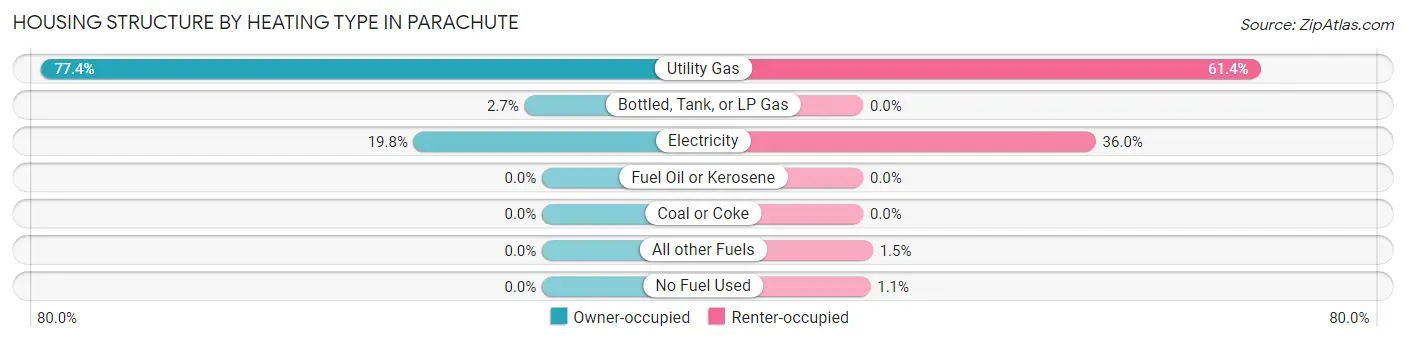
| Heating Type | Owner-occupied | Renter-occupied |
| Utility Gas | 199 (77.4%) | 164 (61.4%) |
| Bottled, Tank, or LP Gas | 7 (2.7%) | 0 (0.0%) |
| Electricity | 51 (19.8%) | 96 (36.0%) |
| Fuel Oil or Kerosene | 0 (0.0%) | 0 (0.0%) |
| Coal or Coke | 0 (0.0%) | 0 (0.0%) |
| All other Fuels | 0 (0.0%) | 4 (1.5%) |
| No Fuel Used | 0 (0.0%) | 3 (1.1%) |
| Total | 257 (100.0%) | 267 (100.0%) |
Household Vehicle Usage in Parachute
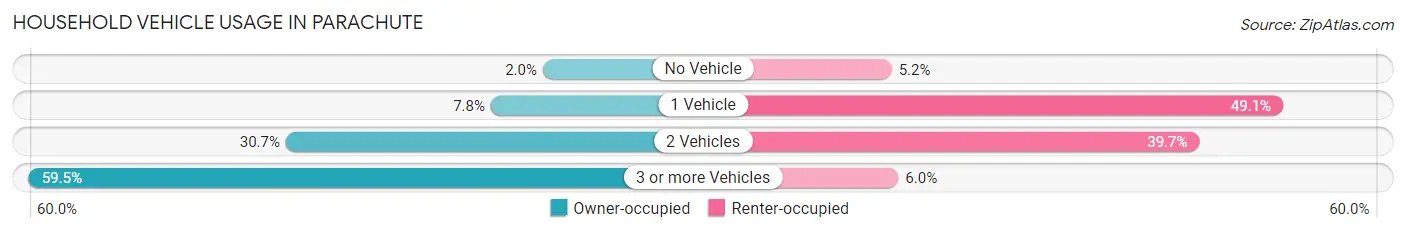
| Vehicles per Household | Owner-occupied | Renter-occupied |
| No Vehicle | 5 (1.9%) | 14 (5.2%) |
| 1 Vehicle | 20 (7.8%) | 131 (49.1%) |
| 2 Vehicles | 79 (30.7%) | 106 (39.7%) |
| 3 or more Vehicles | 153 (59.5%) | 16 (6.0%) |
| Total | 257 (100.0%) | 267 (100.0%) |
Real Estate & Mortgages in Parachute
Real Estate and Mortgage Overview in Parachute
| Characteristic | Without Mortgage | With Mortgage |
| Housing Units | 63 | 194 |
| Median Property Value | - | - |
| Median Household Income | $64,464 | $18 |
| Monthly Housing Costs | $469 | $0 |
| Real Estate Taxes | $335 | $0 |
Property Value by Mortgage Status in Parachute
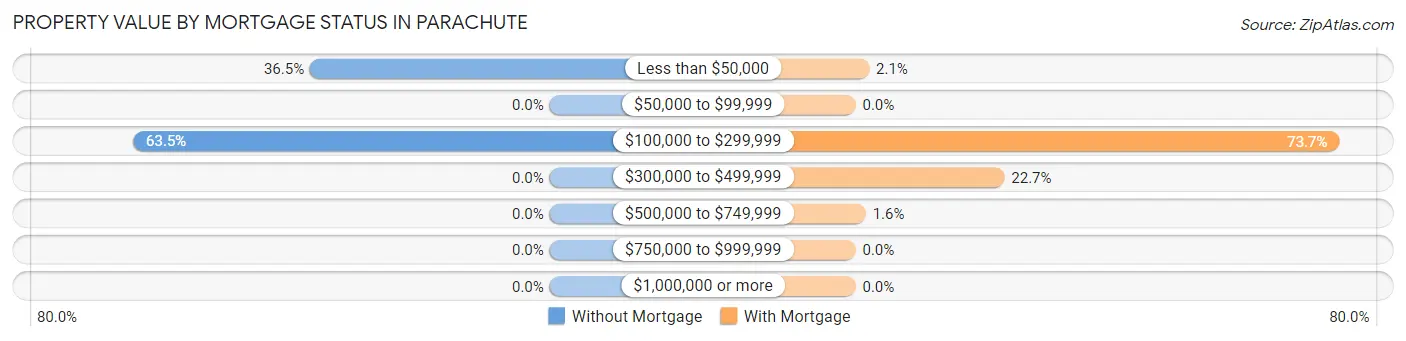
| Property Value | Without Mortgage | With Mortgage |
| Less than $50,000 | 23 (36.5%) | 4 (2.1%) |
| $50,000 to $99,999 | 0 (0.0%) | 0 (0.0%) |
| $100,000 to $299,999 | 40 (63.5%) | 143 (73.7%) |
| $300,000 to $499,999 | 0 (0.0%) | 44 (22.7%) |
| $500,000 to $749,999 | 0 (0.0%) | 3 (1.5%) |
| $750,000 to $999,999 | 0 (0.0%) | 0 (0.0%) |
| $1,000,000 or more | 0 (0.0%) | 0 (0.0%) |
| Total | 63 (100.0%) | 194 (100.0%) |
Household Income by Mortgage Status in Parachute
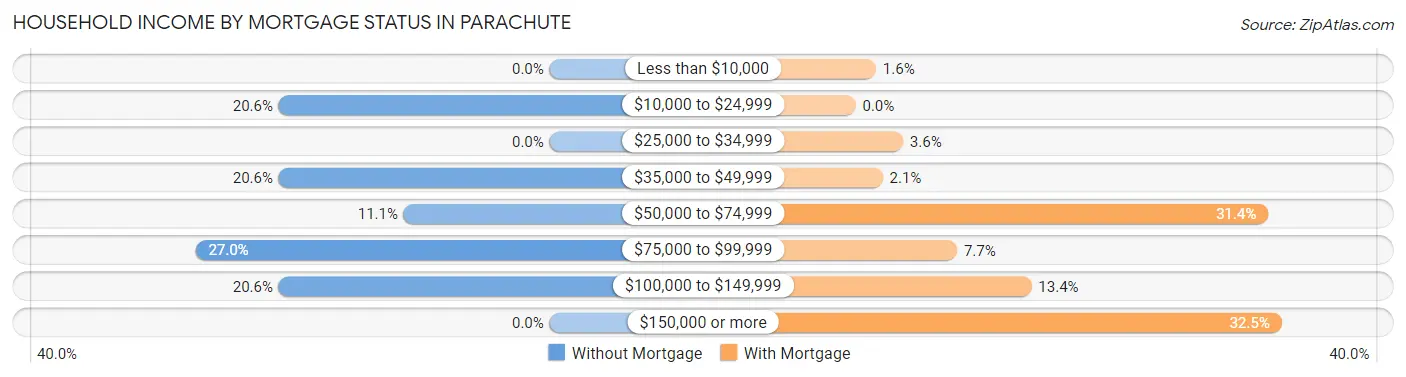
| Household Income | Without Mortgage | With Mortgage |
| Less than $10,000 | 0 (0.0%) | 3 (1.5%) |
| $10,000 to $24,999 | 13 (20.6%) | 0 (0.0%) |
| $25,000 to $34,999 | 0 (0.0%) | 7 (3.6%) |
| $35,000 to $49,999 | 13 (20.6%) | 4 (2.1%) |
| $50,000 to $74,999 | 7 (11.1%) | 61 (31.4%) |
| $75,000 to $99,999 | 17 (27.0%) | 15 (7.7%) |
| $100,000 to $149,999 | 13 (20.6%) | 26 (13.4%) |
| $150,000 or more | 0 (0.0%) | 63 (32.5%) |
| Total | 63 (100.0%) | 194 (100.0%) |
Property Value to Household Income Ratio in Parachute
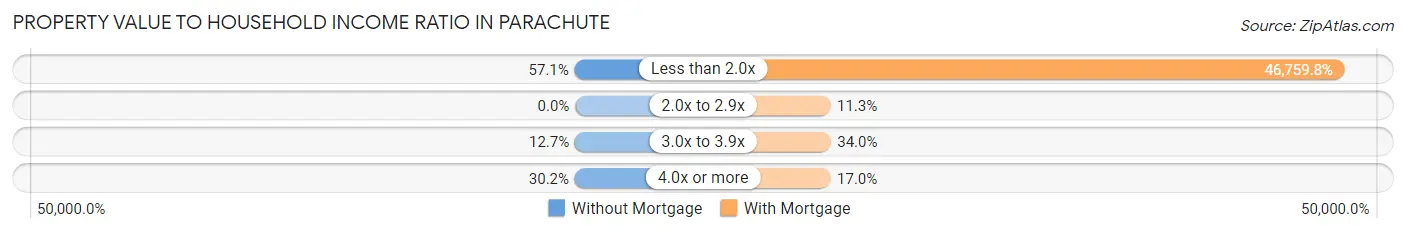
| Value-to-Income Ratio | Without Mortgage | With Mortgage |
| Less than 2.0x | 36 (57.1%) | 90,714 (46,759.8%) |
| 2.0x to 2.9x | 0 (0.0%) | 22 (11.3%) |
| 3.0x to 3.9x | 8 (12.7%) | 66 (34.0%) |
| 4.0x or more | 19 (30.2%) | 33 (17.0%) |
| Total | 63 (100.0%) | 194 (100.0%) |
Real Estate Taxes by Mortgage Status in Parachute
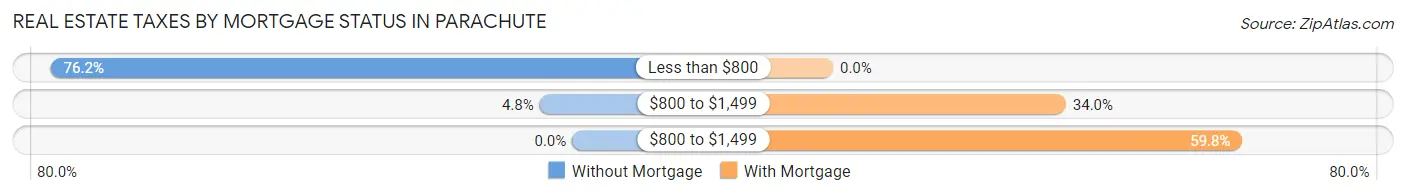
| Property Taxes | Without Mortgage | With Mortgage |
| Less than $800 | 48 (76.2%) | 0 (0.0%) |
| $800 to $1,499 | 3 (4.8%) | 66 (34.0%) |
| $800 to $1,499 | 0 (0.0%) | 116 (59.8%) |
| Total | 63 (100.0%) | 194 (100.0%) |
Health & Disability in Parachute
Health Insurance Coverage by Age in Parachute
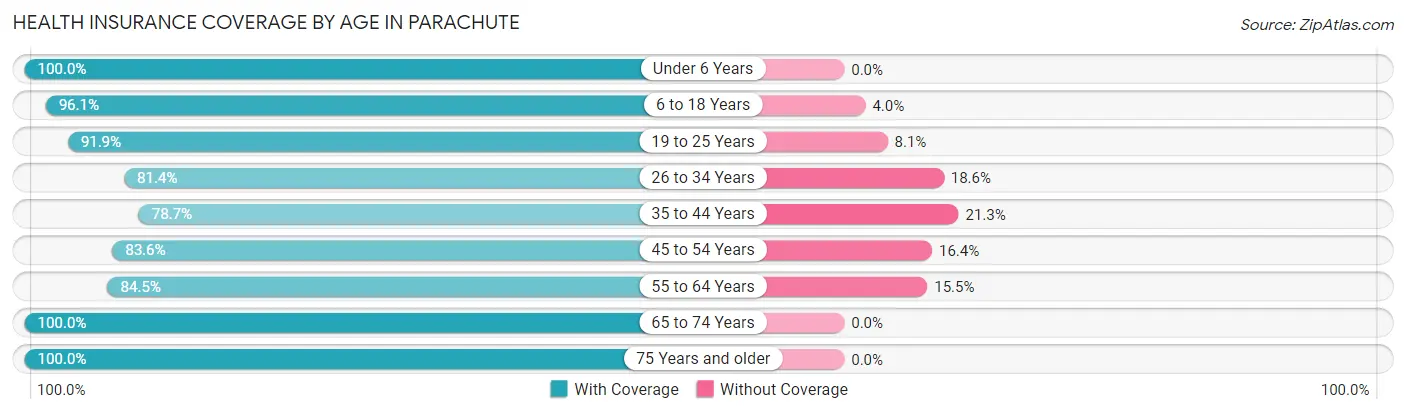
| Age Bracket | With Coverage | Without Coverage |
| Under 6 Years | 117 (100.0%) | 0 (0.0%) |
| 6 to 18 Years | 486 (96.1%) | 20 (4.0%) |
| 19 to 25 Years | 148 (91.9%) | 13 (8.1%) |
| 26 to 34 Years | 136 (81.4%) | 31 (18.6%) |
| 35 to 44 Years | 170 (78.7%) | 46 (21.3%) |
| 45 to 54 Years | 138 (83.6%) | 27 (16.4%) |
| 55 to 64 Years | 71 (84.5%) | 13 (15.5%) |
| 65 to 74 Years | 105 (100.0%) | 0 (0.0%) |
| 75 Years and older | 34 (100.0%) | 0 (0.0%) |
| Total | 1,405 (90.3%) | 150 (9.7%) |
Health Insurance Coverage by Citizenship Status in Parachute
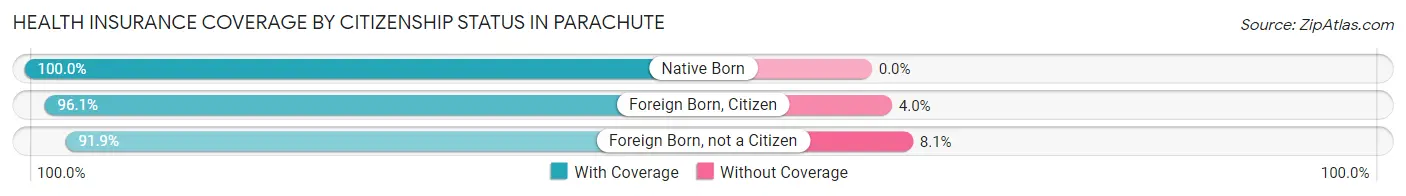
| Citizenship Status | With Coverage | Without Coverage |
| Native Born | 117 (100.0%) | 0 (0.0%) |
| Foreign Born, Citizen | 486 (96.1%) | 20 (4.0%) |
| Foreign Born, not a Citizen | 148 (91.9%) | 13 (8.1%) |
Health Insurance Coverage by Household Income in Parachute
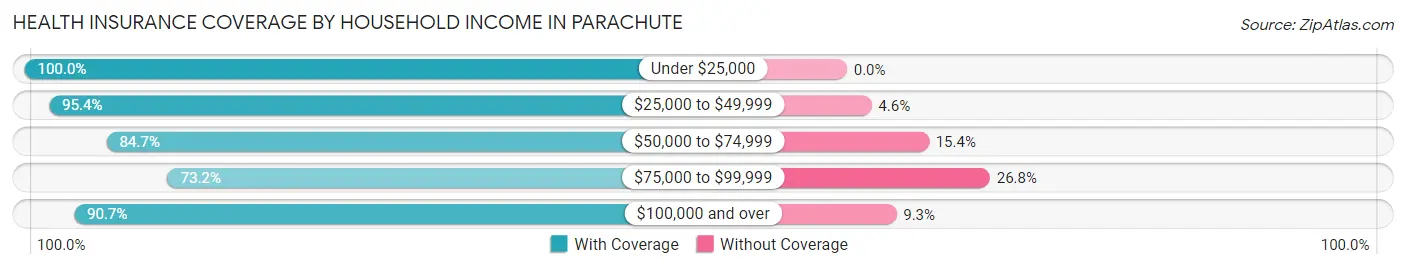
| Household Income | With Coverage | Without Coverage |
| Under $25,000 | 278 (100.0%) | 0 (0.0%) |
| $25,000 to $49,999 | 517 (95.4%) | 25 (4.6%) |
| $50,000 to $74,999 | 215 (84.7%) | 39 (15.3%) |
| $75,000 to $99,999 | 183 (73.2%) | 67 (26.8%) |
| $100,000 and over | 186 (90.7%) | 19 (9.3%) |
Public vs Private Health Insurance Coverage by Age in Parachute
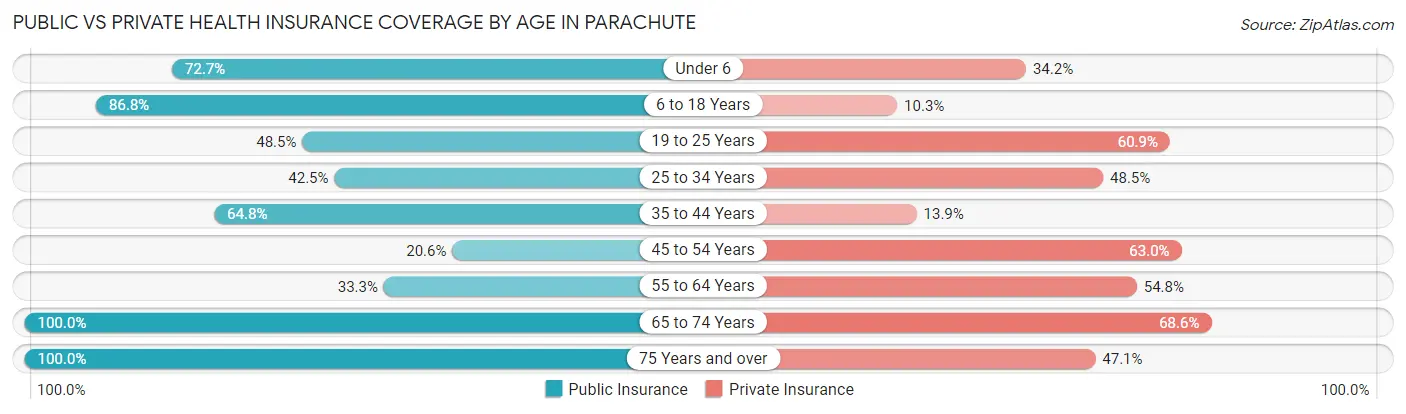
| Age Bracket | Public Insurance | Private Insurance |
| Under 6 | 85 (72.7%) | 40 (34.2%) |
| 6 to 18 Years | 439 (86.8%) | 52 (10.3%) |
| 19 to 25 Years | 78 (48.4%) | 98 (60.9%) |
| 25 to 34 Years | 71 (42.5%) | 81 (48.5%) |
| 35 to 44 Years | 140 (64.8%) | 30 (13.9%) |
| 45 to 54 Years | 34 (20.6%) | 104 (63.0%) |
| 55 to 64 Years | 28 (33.3%) | 46 (54.8%) |
| 65 to 74 Years | 105 (100.0%) | 72 (68.6%) |
| 75 Years and over | 34 (100.0%) | 16 (47.1%) |
| Total | 1,014 (65.2%) | 539 (34.7%) |
Disability Status by Sex by Age in Parachute
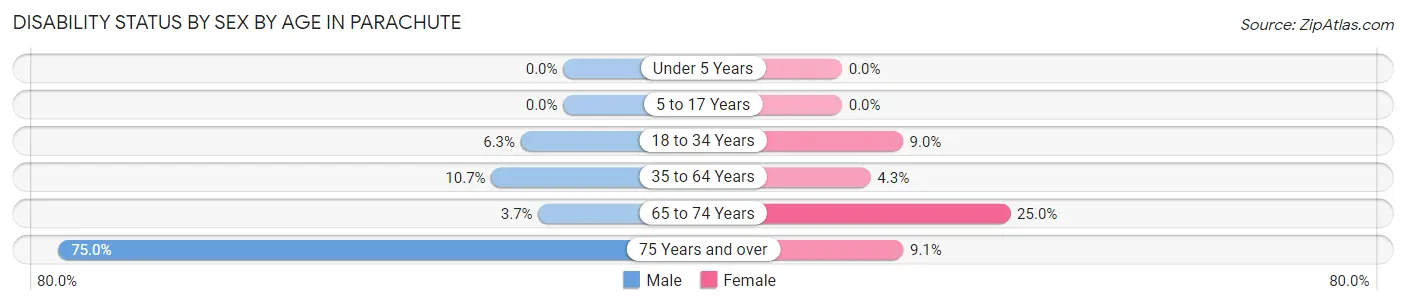
| Age Bracket | Male | Female |
| Under 5 Years | 0 (0.0%) | 0 (0.0%) |
| 5 to 17 Years | 0 (0.0%) | 0 (0.0%) |
| 18 to 34 Years | 21 (6.3%) | 13 (9.0%) |
| 35 to 64 Years | 22 (10.7%) | 11 (4.3%) |
| 65 to 74 Years | 3 (3.7%) | 6 (25.0%) |
| 75 Years and over | 9 (75.0%) | 2 (9.1%) |
Disability Class by Sex by Age in Parachute
Disability Class: Hearing Difficulty
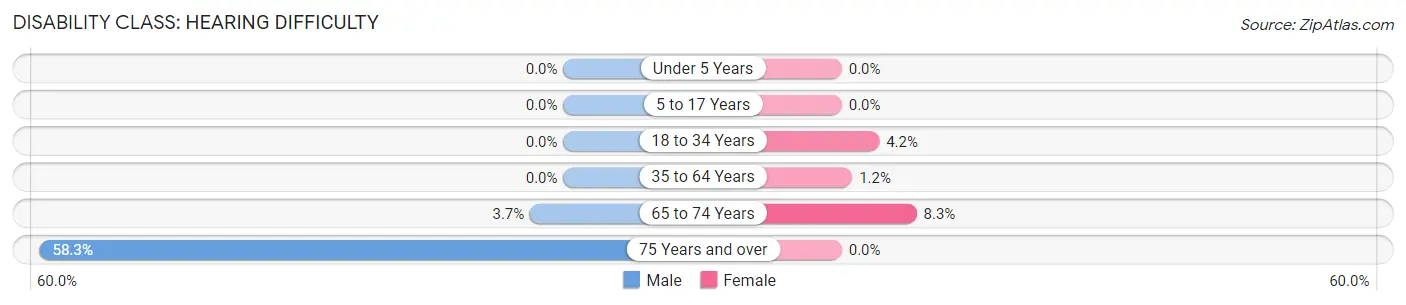
| Age Bracket | Male | Female |
| Under 5 Years | 0 (0.0%) | 0 (0.0%) |
| 5 to 17 Years | 0 (0.0%) | 0 (0.0%) |
| 18 to 34 Years | 0 (0.0%) | 6 (4.2%) |
| 35 to 64 Years | 0 (0.0%) | 3 (1.2%) |
| 65 to 74 Years | 3 (3.7%) | 2 (8.3%) |
| 75 Years and over | 7 (58.3%) | 0 (0.0%) |
Disability Class: Vision Difficulty
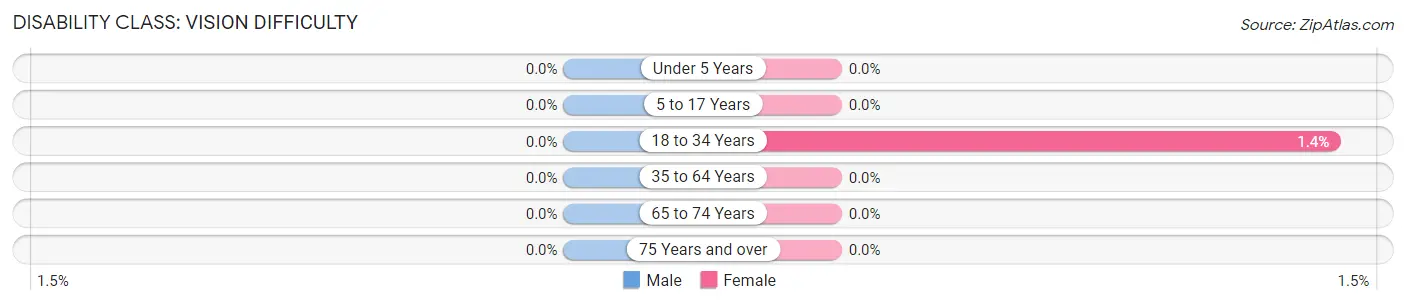
| Age Bracket | Male | Female |
| Under 5 Years | 0 (0.0%) | 0 (0.0%) |
| 5 to 17 Years | 0 (0.0%) | 0 (0.0%) |
| 18 to 34 Years | 0 (0.0%) | 2 (1.4%) |
| 35 to 64 Years | 0 (0.0%) | 0 (0.0%) |
| 65 to 74 Years | 0 (0.0%) | 0 (0.0%) |
| 75 Years and over | 0 (0.0%) | 0 (0.0%) |
Disability Class: Cognitive Difficulty
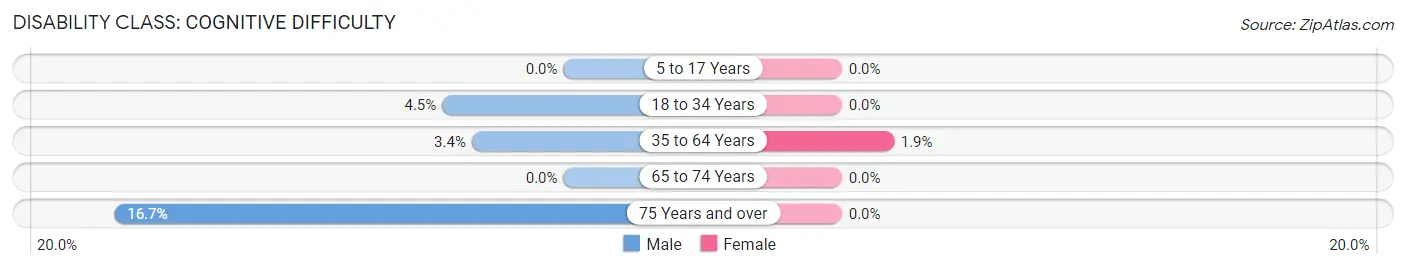
| Age Bracket | Male | Female |
| 5 to 17 Years | 0 (0.0%) | 0 (0.0%) |
| 18 to 34 Years | 15 (4.5%) | 0 (0.0%) |
| 35 to 64 Years | 7 (3.4%) | 5 (1.9%) |
| 65 to 74 Years | 0 (0.0%) | 0 (0.0%) |
| 75 Years and over | 2 (16.7%) | 0 (0.0%) |
Disability Class: Ambulatory Difficulty
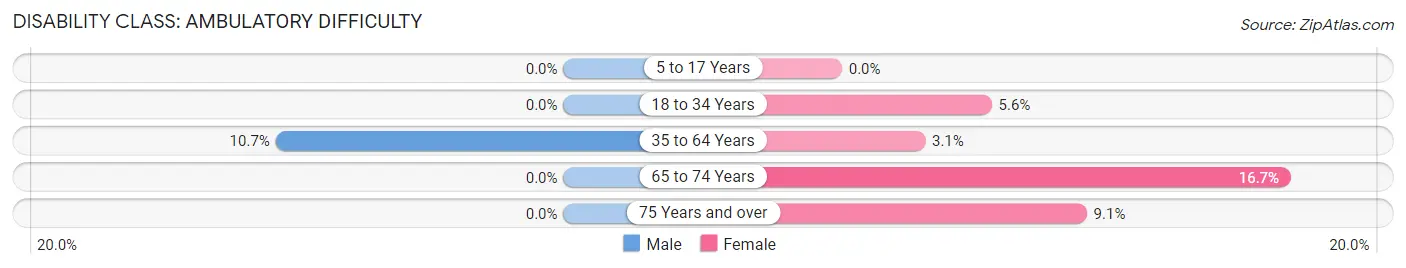
| Age Bracket | Male | Female |
| 5 to 17 Years | 0 (0.0%) | 0 (0.0%) |
| 18 to 34 Years | 0 (0.0%) | 8 (5.6%) |
| 35 to 64 Years | 22 (10.7%) | 8 (3.1%) |
| 65 to 74 Years | 0 (0.0%) | 4 (16.7%) |
| 75 Years and over | 0 (0.0%) | 2 (9.1%) |
Disability Class: Self-Care Difficulty
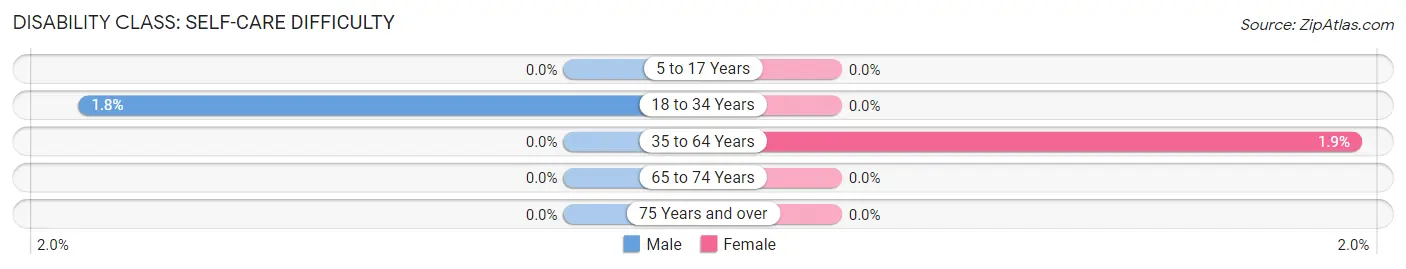
| Age Bracket | Male | Female |
| 5 to 17 Years | 0 (0.0%) | 0 (0.0%) |
| 18 to 34 Years | 6 (1.8%) | 0 (0.0%) |
| 35 to 64 Years | 0 (0.0%) | 5 (1.9%) |
| 65 to 74 Years | 0 (0.0%) | 0 (0.0%) |
| 75 Years and over | 0 (0.0%) | 0 (0.0%) |
Technology Access in Parachute
Computing Device Access in Parachute
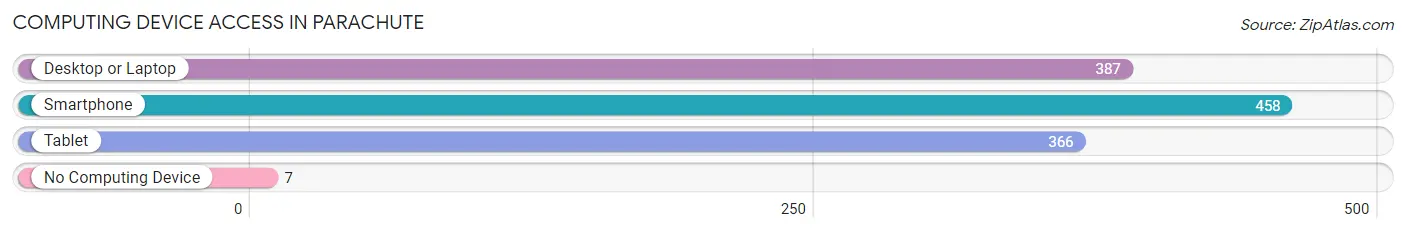
| Device Type | # Households | % Households |
| Desktop or Laptop | 387 | 73.9% |
| Smartphone | 458 | 87.4% |
| Tablet | 366 | 69.9% |
| No Computing Device | 7 | 1.3% |
| Total | 524 | 100.0% |
Internet Access in Parachute
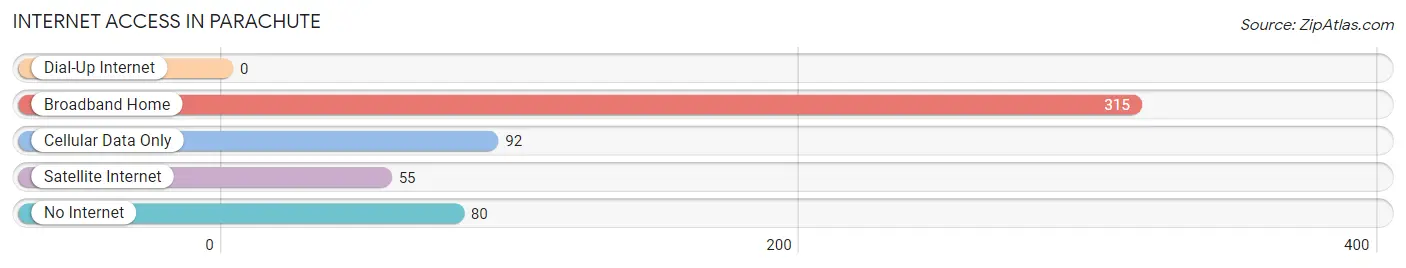
| Internet Type | # Households | % Households |
| Dial-Up Internet | 0 | 0.0% |
| Broadband Home | 315 | 60.1% |
| Cellular Data Only | 92 | 17.6% |
| Satellite Internet | 55 | 10.5% |
| No Internet | 80 | 15.3% |
| Total | 524 | 100.0% |
Parachute Summary
Parachute, Colorado is a small town located in Garfield County in the western part of the state. It is situated along the Colorado River, just south of Grand Junction and about an hour and a half drive from Denver. The town was founded in 1881 and has a population of about 1,000 people.
Geography
Parachute is located in the Grand Valley, a large valley that stretches from Grand Junction to Palisade. The town is situated on the Colorado River, which provides a source of irrigation for the area. The town is surrounded by mountains, including the Grand Mesa to the east and the Book Cliffs to the west. The climate in Parachute is semi-arid, with hot summers and cold winters.
Economy
The economy of Parachute is largely based on agriculture and energy production. The town is home to several large farms, which produce a variety of crops, including corn, wheat, and hay. The town is also home to several oil and gas companies, which produce natural gas and oil from the nearby Piceance Basin. In addition, the town is home to several small businesses, including restaurants, retail stores, and a few manufacturing companies.
Demographics
As of the 2010 census, the population of Parachute was 1,004. The racial makeup of the town was 94.3% White, 0.7% African American, 0.3% Native American, 0.2% Asian, 0.1% Pacific Islander, 2.3% from other races, and 2.3% from two or more races. Hispanic or Latino of any race were 8.2% of the population.
The median income for a household in Parachute was $41,250, and the median income for a family was $45,625. The per capita income for the town was $19,945. About 11.2% of families and 14.2% of the population were below the poverty line, including 18.2% of those under age 18 and 8.3% of those age 65 or over.
Education
Parachute is served by the Garfield County School District, which includes two elementary schools, one middle school, and one high school. The town is also home to a branch of Colorado Mountain College, which offers a variety of courses and programs.
Conclusion
Parachute, Colorado is a small town located in Garfield County in the western part of the state. It is situated along the Colorado River, just south of Grand Junction and about an hour and a half drive from Denver. The town was founded in 1881 and has a population of about 1,000 people. The economy of Parachute is largely based on agriculture and energy production, and the town is served by the Garfield County School District. Parachute is a small but vibrant community, with a diverse population and a variety of businesses and services.
Common Questions
What is Per Capita Income in Parachute?
Per Capita income in Parachute is $21,344.
What is the Median Family Income in Parachute?
Median Family Income in Parachute is $56,205.
What is the Median Household income in Parachute?
Median Household Income in Parachute is $55,089.
What is Income or Wage Gap in Parachute?
Income or Wage Gap in Parachute is 36.1%.
Women in Parachute earn 63.9 cents for every dollar earned by a man.
What is Family Income Deficit in Parachute?
Family Income Deficit in Parachute is $14,502.
Families that are below poverty line in Parachute earn $14,502 less on average than the poverty threshold level.
What is Inequality or Gini Index in Parachute?
Inequality or Gini Index in Parachute is 0.35.
What is the Total Population of Parachute?
Total Population of Parachute is 1,555.
What is the Total Male Population of Parachute?
Total Male Population of Parachute is 918.
What is the Total Female Population of Parachute?
Total Female Population of Parachute is 637.
What is the Ratio of Males per 100 Females in Parachute?
There are 144.11 Males per 100 Females in Parachute.
What is the Ratio of Females per 100 Males in Parachute?
There are 69.39 Females per 100 Males in Parachute.
What is the Median Population Age in Parachute?
Median Population Age in Parachute is 25.7 Years.
What is the Average Family Size in Parachute
Average Family Size in Parachute is 3.2 People.
What is the Average Household Size in Parachute
Average Household Size in Parachute is 2.9 People.
How Large is the Labor Force in Parachute?
There are 843 People in the Labor Forcein in Parachute.
What is the Percentage of People in the Labor Force in Parachute?
72.0% of People are in the Labor Force in Parachute.
What is the Unemployment Rate in Parachute?
Unemployment Rate in Parachute is 19.3%.