Lamar, CO Map & Demographics
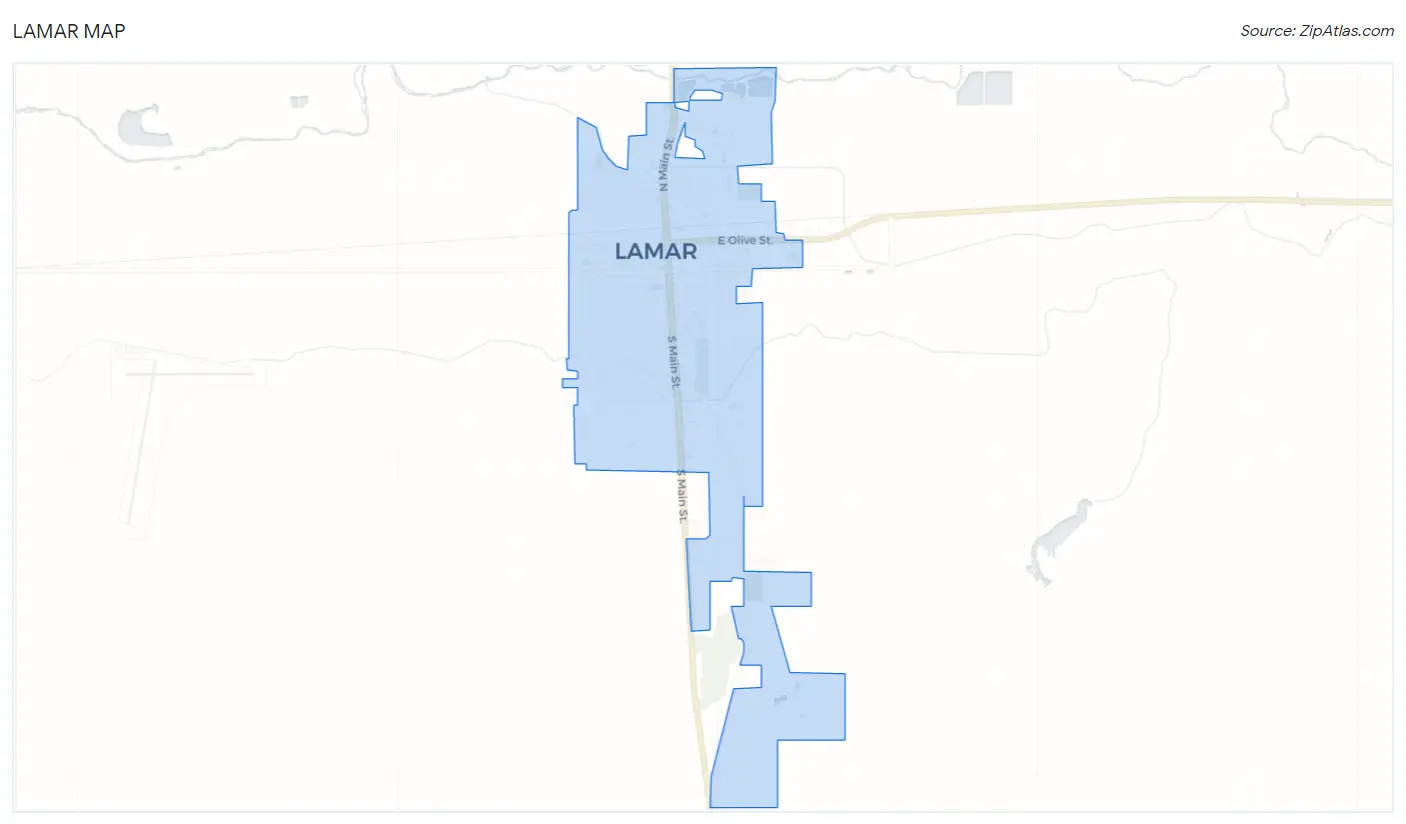
Lamar Map
Lamar Overview
$28,287
PER CAPITA INCOME
$59,632
AVG FAMILY INCOME
$48,422
AVG HOUSEHOLD INCOME
8.5%
WAGE / INCOME GAP [ % ]
91.5¢/ $1
WAGE / INCOME GAP [ $ ]
$9,928
FAMILY INCOME DEFICIT
0.53
INEQUALITY / GINI INDEX
7,667
TOTAL POPULATION
3,988
MALE POPULATION
3,679
FEMALE POPULATION
108.40
MALES / 100 FEMALES
92.25
FEMALES / 100 MALES
31.9
MEDIAN AGE
3.2
AVG FAMILY SIZE
2.6
AVG HOUSEHOLD SIZE
3,582
LABOR FORCE [ PEOPLE ]
61.4%
PERCENT IN LABOR FORCE
5.9%
UNEMPLOYMENT RATE
Lamar Zip Codes
Lamar Area Codes
Income in Lamar
Income Overview in Lamar
Per Capita Income in Lamar is $28,287, while median incomes of families and households are $59,632 and $48,422 respectively.
| Characteristic | Number | Measure |
| Per Capita Income | 7,667 | $28,287 |
| Median Family Income | 1,901 | $59,632 |
| Mean Family Income | 1,901 | $96,118 |
| Median Household Income | 2,806 | $48,422 |
| Mean Household Income | 2,806 | $79,530 |
| Income Deficit | 1,901 | $9,928 |
| Wage / Income Gap (%) | 7,667 | 8.48% |
| Wage / Income Gap ($) | 7,667 | 91.52¢ per $1 |
| Gini / Inequality Index | 7,667 | 0.53 |
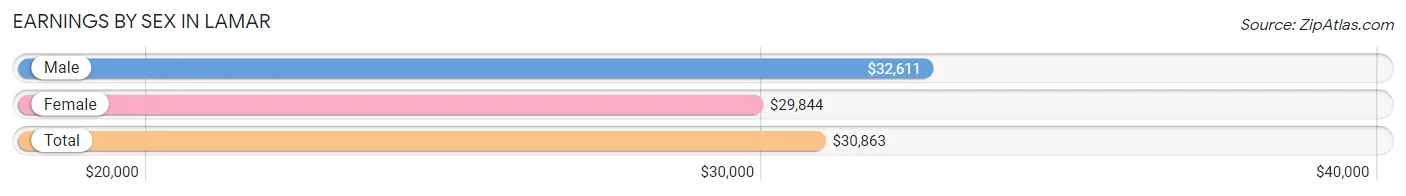
Earnings by Sex in Lamar
Average Earnings in Lamar are $30,863, $32,611 for men and $29,844 for women, a difference of 8.5%.
| Sex | Number | Average Earnings |
| Male | 2,043 (55.2%) | $32,611 |
| Female | 1,659 (44.8%) | $29,844 |
| Total | 3,702 (100.0%) | $30,863 |
Earnings by Sex by Income Bracket in Lamar
The most common earnings brackets in Lamar are $30,000 to $34,999 for men (320 | 15.7%) and $30,000 to $34,999 for women (196 | 11.8%).
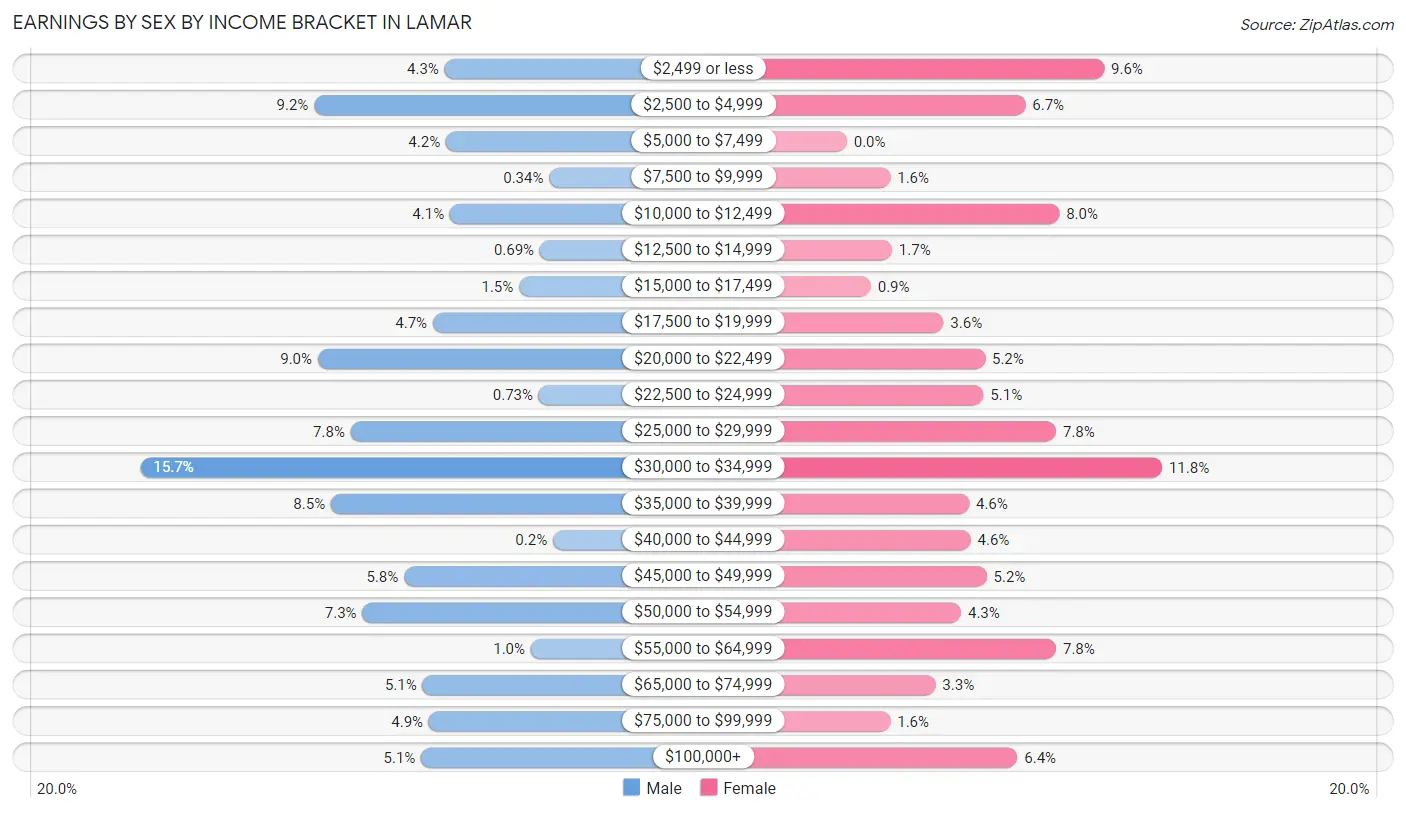
| Income | Male | Female |
| $2,499 or less | 87 (4.3%) | 160 (9.6%) |
| $2,500 to $4,999 | 187 (9.1%) | 111 (6.7%) |
| $5,000 to $7,499 | 86 (4.2%) | 0 (0.0%) |
| $7,500 to $9,999 | 7 (0.3%) | 27 (1.6%) |
| $10,000 to $12,499 | 83 (4.1%) | 132 (8.0%) |
| $12,500 to $14,999 | 14 (0.7%) | 28 (1.7%) |
| $15,000 to $17,499 | 30 (1.5%) | 15 (0.9%) |
| $17,500 to $19,999 | 96 (4.7%) | 60 (3.6%) |
| $20,000 to $22,499 | 184 (9.0%) | 86 (5.2%) |
| $22,500 to $24,999 | 15 (0.7%) | 85 (5.1%) |
| $25,000 to $29,999 | 159 (7.8%) | 130 (7.8%) |
| $30,000 to $34,999 | 320 (15.7%) | 196 (11.8%) |
| $35,000 to $39,999 | 174 (8.5%) | 76 (4.6%) |
| $40,000 to $44,999 | 4 (0.2%) | 77 (4.6%) |
| $45,000 to $49,999 | 118 (5.8%) | 87 (5.2%) |
| $50,000 to $54,999 | 150 (7.3%) | 71 (4.3%) |
| $55,000 to $64,999 | 21 (1.0%) | 130 (7.8%) |
| $65,000 to $74,999 | 104 (5.1%) | 55 (3.3%) |
| $75,000 to $99,999 | 99 (4.9%) | 27 (1.6%) |
| $100,000+ | 105 (5.1%) | 106 (6.4%) |
| Total | 2,043 (100.0%) | 1,659 (100.0%) |
Earnings by Sex by Educational Attainment in Lamar
Average earnings in Lamar are $37,059 for men and $36,528 for women, a difference of 1.4%. Men with an educational attainment of graduate degree enjoy the highest average annual earnings of $85,250, while those with college or associate's degree education earn the least with $30,357. Women with an educational attainment of bachelor's degree earn the most with the average annual earnings of $47,045, while those with high school diploma education have the smallest earnings of $25,991.
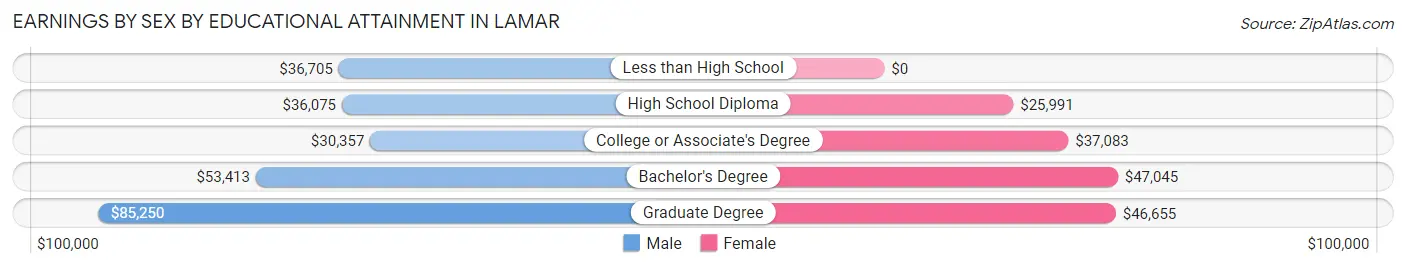
| Educational Attainment | Male Income | Female Income |
| Less than High School | $36,705 | $0 |
| High School Diploma | $36,075 | $25,991 |
| College or Associate's Degree | $30,357 | $37,083 |
| Bachelor's Degree | $53,413 | $47,045 |
| Graduate Degree | $85,250 | $46,655 |
| Total | $37,059 | $36,528 |
Family Income in Lamar
Family Income Brackets in Lamar
According to the Lamar family income data, there are 479 families falling into the $35,000 to $49,999 income range, which is the most common income bracket and makes up 25.2% of all families. Conversely, the $10,000 to $14,999 income bracket is the least frequent group with only 53 families (2.8%) belonging to this category.
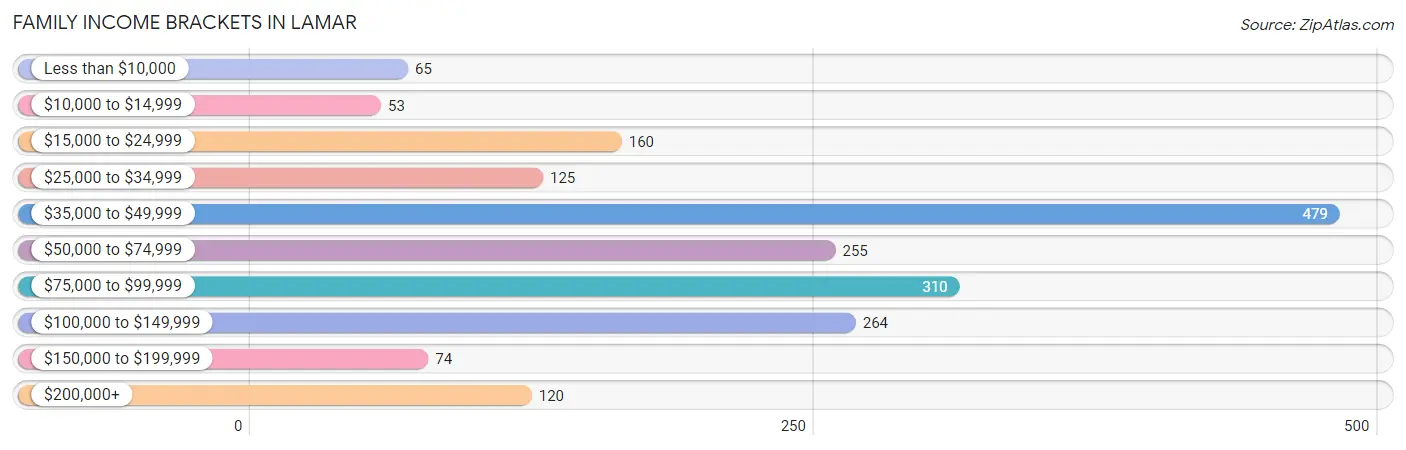
| Income Bracket | # Families | % Families |
| Less than $10,000 | 65 | 3.4% |
| $10,000 to $14,999 | 53 | 2.8% |
| $15,000 to $24,999 | 160 | 8.4% |
| $25,000 to $34,999 | 125 | 6.6% |
| $35,000 to $49,999 | 479 | 25.2% |
| $50,000 to $74,999 | 255 | 13.4% |
| $75,000 to $99,999 | 310 | 16.3% |
| $100,000 to $149,999 | 264 | 13.9% |
| $150,000 to $199,999 | 74 | 3.9% |
| $200,000+ | 120 | 6.3% |
Family Income by Famaliy Size in Lamar
4-person families (348 | 18.3%) account for the highest median family income in Lamar with $91,136 per family, while 2-person families (677 | 35.6%) have the highest median income of $30,814 per family member.
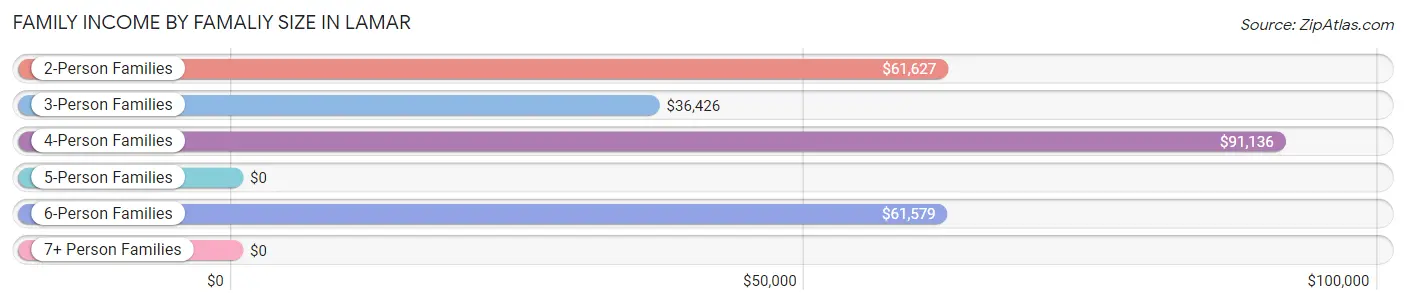
| Income Bracket | # Families | Median Income |
| 2-Person Families | 677 (35.6%) | $61,627 |
| 3-Person Families | 478 (25.1%) | $36,426 |
| 4-Person Families | 348 (18.3%) | $91,136 |
| 5-Person Families | 237 (12.5%) | $0 |
| 6-Person Families | 76 (4.0%) | $61,579 |
| 7+ Person Families | 85 (4.5%) | $0 |
| Total | 1,901 (100.0%) | $59,632 |
Family Income by Number of Earners in Lamar
The median family income in Lamar is $59,632, with families comprising 3+ earners (244) having the highest median family income of $106,786, while families with no earners (221) have the lowest median family income of $26,960, accounting for 12.8% and 11.6% of families, respectively.
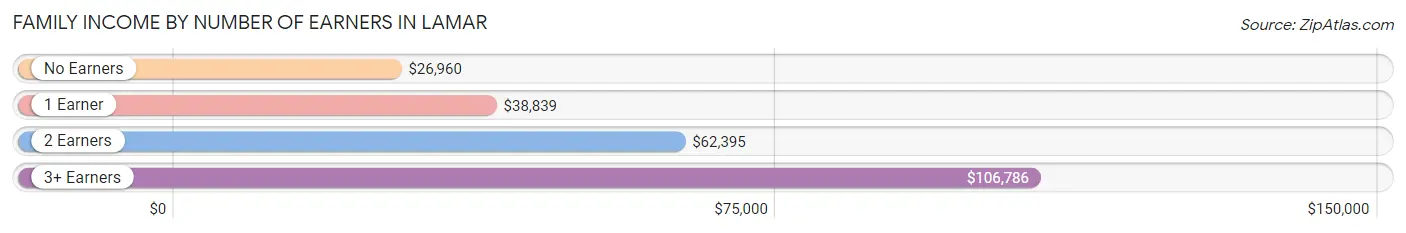
| Number of Earners | # Families | Median Income |
| No Earners | 221 (11.6%) | $26,960 |
| 1 Earner | 583 (30.7%) | $38,839 |
| 2 Earners | 853 (44.9%) | $62,395 |
| 3+ Earners | 244 (12.8%) | $106,786 |
| Total | 1,901 (100.0%) | $59,632 |
Household Income in Lamar
Household Income Brackets in Lamar
With 620 households falling in the category, the $35,000 to $49,999 income range is the most frequent in Lamar, accounting for 22.1% of all households. In contrast, only 84 households (3.0%) fall into the $150,000 to $199,999 income bracket, making it the least populous group.
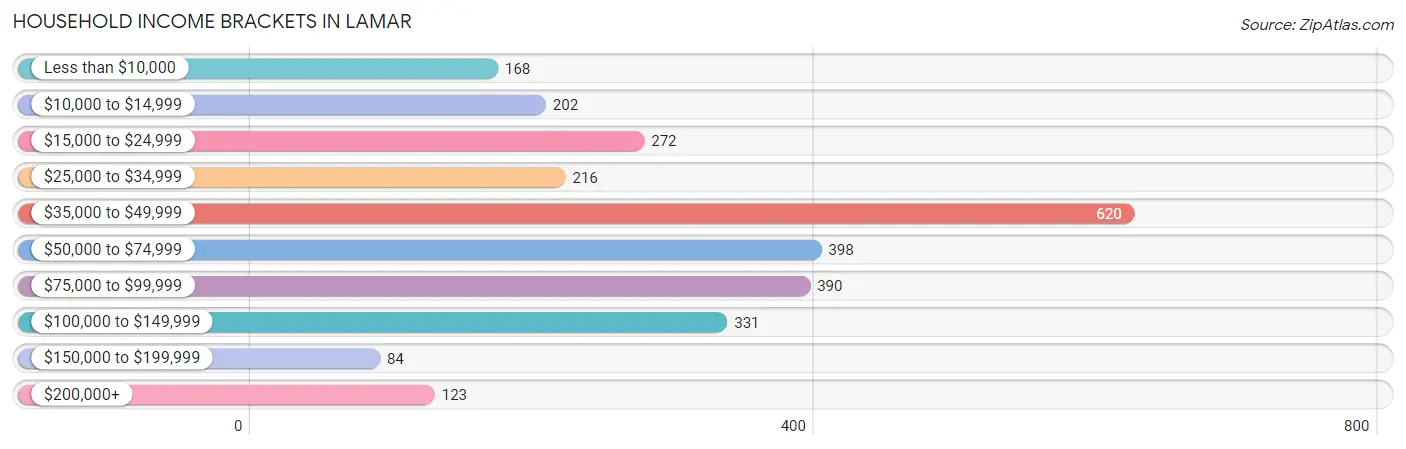
| Income Bracket | # Households | % Households |
| Less than $10,000 | 168 | 6.0% |
| $10,000 to $14,999 | 202 | 7.2% |
| $15,000 to $24,999 | 272 | 9.7% |
| $25,000 to $34,999 | 216 | 7.7% |
| $35,000 to $49,999 | 620 | 22.1% |
| $50,000 to $74,999 | 398 | 14.2% |
| $75,000 to $99,999 | 390 | 13.9% |
| $100,000 to $149,999 | 331 | 11.8% |
| $150,000 to $199,999 | 84 | 3.0% |
| $200,000+ | 123 | 4.4% |
Household Income by Householder Age in Lamar
The median household income in Lamar is $48,422, with the highest median household income of $73,214 found in the 45 to 64 years age bracket for the primary householder. A total of 1,014 households (36.1%) fall into this category. Meanwhile, the 15 to 24 years age bracket for the primary householder has the lowest median household income of $36,329, with 348 households (12.4%) in this group.
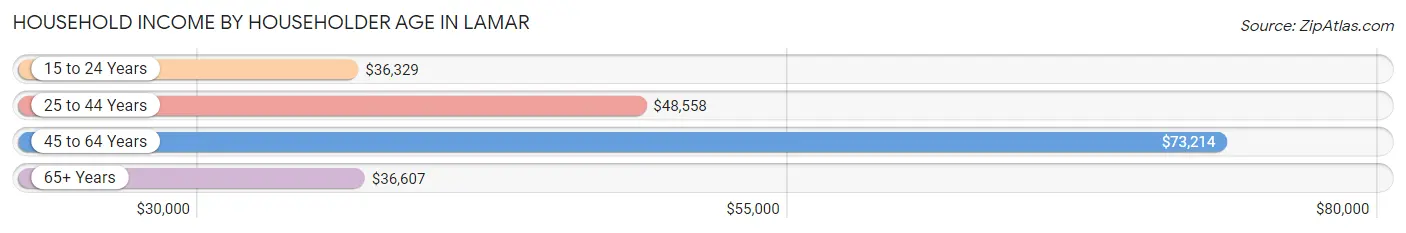
| Income Bracket | # Households | Median Income |
| 15 to 24 Years | 348 (12.4%) | $36,329 |
| 25 to 44 Years | 648 (23.1%) | $48,558 |
| 45 to 64 Years | 1,014 (36.1%) | $73,214 |
| 65+ Years | 796 (28.4%) | $36,607 |
| Total | 2,806 (100.0%) | $48,422 |
Poverty in Lamar
Income Below Poverty by Sex and Age in Lamar
With 18.9% poverty level for males and 23.5% for females among the residents of Lamar, under 5 year old males and 16 and 17 year old females are the most vulnerable to poverty, with 98 males (34.7%) and 26 females (70.3%) in their respective age groups living below the poverty level.
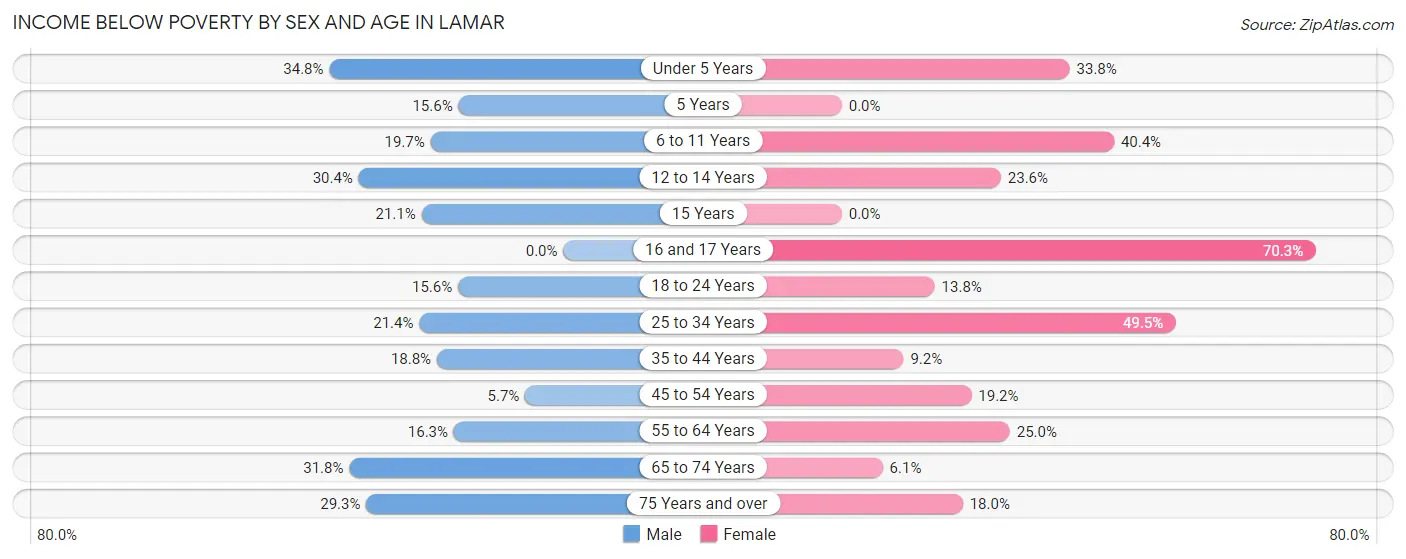
| Age Bracket | Male | Female |
| Under 5 Years | 98 (34.7%) | 91 (33.8%) |
| 5 Years | 26 (15.6%) | 0 (0.0%) |
| 6 to 11 Years | 67 (19.7%) | 137 (40.4%) |
| 12 to 14 Years | 31 (30.4%) | 30 (23.6%) |
| 15 Years | 8 (21.0%) | 0 (0.0%) |
| 16 and 17 Years | 0 (0.0%) | 26 (70.3%) |
| 18 to 24 Years | 74 (15.6%) | 64 (13.8%) |
| 25 to 34 Years | 86 (21.4%) | 195 (49.5%) |
| 35 to 44 Years | 70 (18.8%) | 37 (9.2%) |
| 45 to 54 Years | 24 (5.7%) | 71 (19.2%) |
| 55 to 64 Years | 80 (16.3%) | 123 (24.9%) |
| 65 to 74 Years | 96 (31.8%) | 19 (6.1%) |
| 75 Years and over | 55 (29.3%) | 44 (18.0%) |
| Total | 715 (18.9%) | 837 (23.5%) |
Income Above Poverty by Sex and Age in Lamar
According to the poverty statistics in Lamar, males aged 16 and 17 years and females aged 5 years are the age groups that are most secure financially, with 100.0% of males and 100.0% of females in these age groups living above the poverty line.
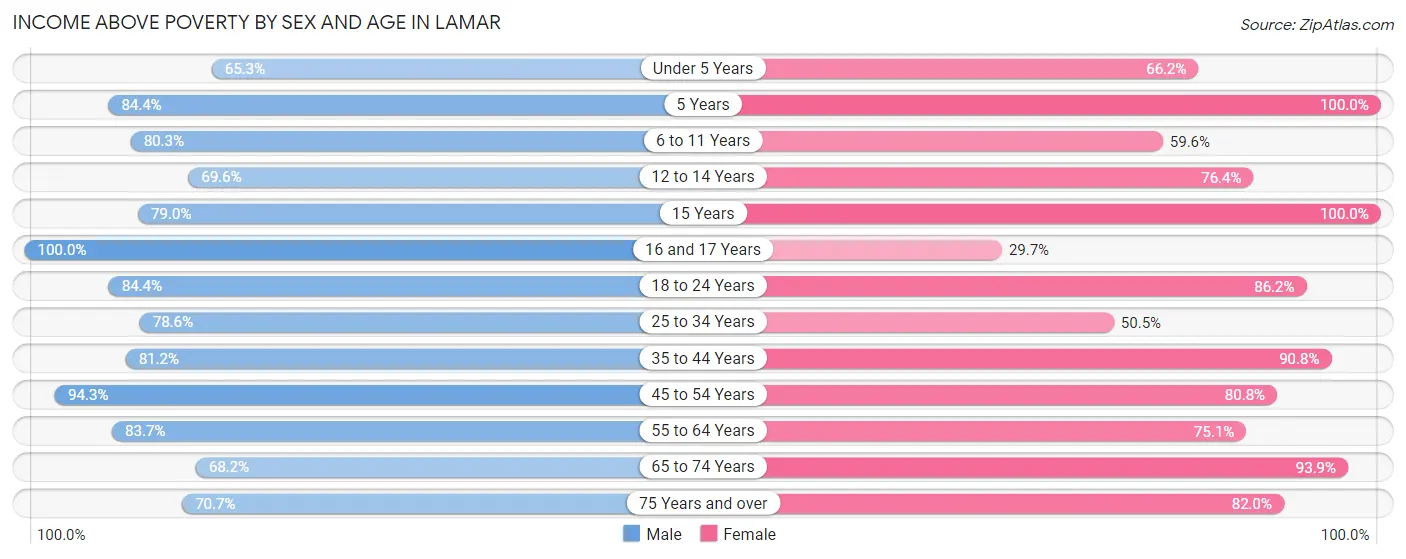
| Age Bracket | Male | Female |
| Under 5 Years | 184 (65.2%) | 178 (66.2%) |
| 5 Years | 141 (84.4%) | 11 (100.0%) |
| 6 to 11 Years | 273 (80.3%) | 202 (59.6%) |
| 12 to 14 Years | 71 (69.6%) | 97 (76.4%) |
| 15 Years | 30 (78.9%) | 90 (100.0%) |
| 16 and 17 Years | 198 (100.0%) | 11 (29.7%) |
| 18 to 24 Years | 399 (84.4%) | 400 (86.2%) |
| 25 to 34 Years | 316 (78.6%) | 199 (50.5%) |
| 35 to 44 Years | 303 (81.2%) | 367 (90.8%) |
| 45 to 54 Years | 399 (94.3%) | 298 (80.8%) |
| 55 to 64 Years | 412 (83.7%) | 370 (75.0%) |
| 65 to 74 Years | 206 (68.2%) | 294 (93.9%) |
| 75 Years and over | 133 (70.7%) | 201 (82.0%) |
| Total | 3,065 (81.1%) | 2,718 (76.5%) |
Income Below Poverty Among Married-Couple Families in Lamar
The poverty statistics for married-couple families in Lamar show that 8.9% or 126 of the total 1,415 families live below the poverty line. Families with 3 or 4 children have the highest poverty rate of 30.0%, comprising of 66 families. On the other hand, families with no children have the lowest poverty rate of 4.3%, which includes 28 families.
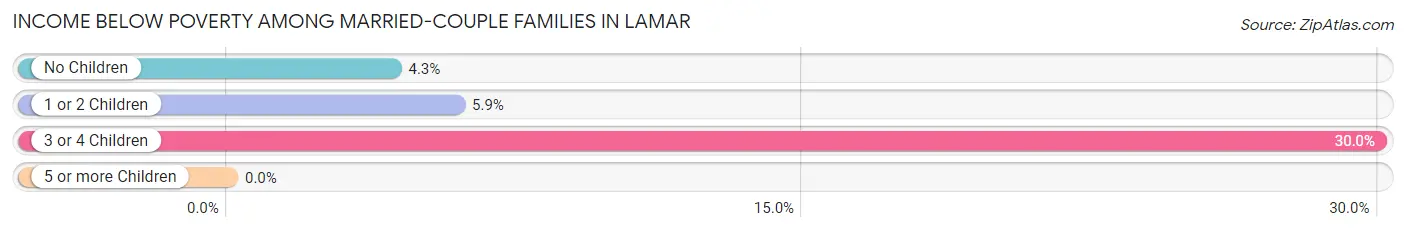
| Children | Above Poverty | Below Poverty |
| No Children | 627 (95.7%) | 28 (4.3%) |
| 1 or 2 Children | 508 (94.1%) | 32 (5.9%) |
| 3 or 4 Children | 154 (70.0%) | 66 (30.0%) |
| 5 or more Children | 0 (0.0%) | 0 (0.0%) |
| Total | 1,289 (91.1%) | 126 (8.9%) |
Income Below Poverty Among Single-Parent Households in Lamar
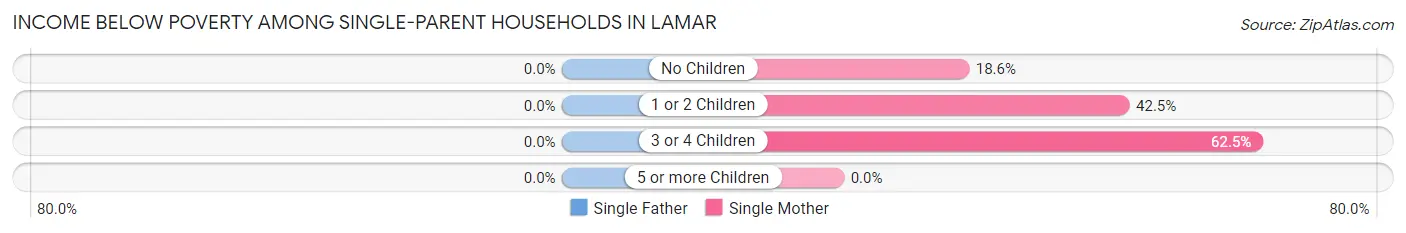
| Children | Single Father | Single Mother |
| No Children | 0 (0.0%) | 22 (18.6%) |
| 1 or 2 Children | 0 (0.0%) | 74 (42.5%) |
| 3 or 4 Children | 0 (0.0%) | 45 (62.5%) |
| 5 or more Children | 0 (0.0%) | 0 (0.0%) |
| Total | 0 (0.0%) | 141 (38.7%) |
Income Below Poverty Among Married-Couple vs Single-Parent Households in Lamar
The poverty data for Lamar shows that 126 of the married-couple family households (8.9%) and 141 of the single-parent households (29.0%) are living below the poverty level. Within the married-couple family households, those with 3 or 4 children have the highest poverty rate, with 66 households (30.0%) falling below the poverty line. Among the single-parent households, those with 3 or 4 children have the highest poverty rate, with 45 household (45.5%) living below poverty.
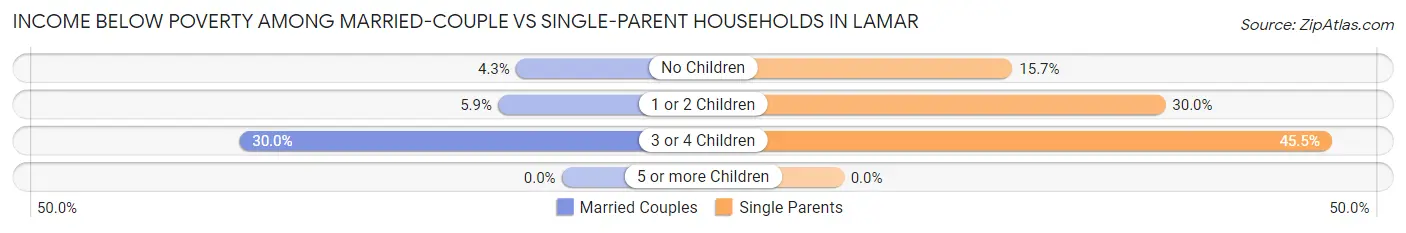
| Children | Married-Couple Families | Single-Parent Households |
| No Children | 28 (4.3%) | 22 (15.7%) |
| 1 or 2 Children | 32 (5.9%) | 74 (30.0%) |
| 3 or 4 Children | 66 (30.0%) | 45 (45.5%) |
| 5 or more Children | 0 (0.0%) | 0 (0.0%) |
| Total | 126 (8.9%) | 141 (29.0%) |
Race in Lamar
The most populous races in Lamar are White / Caucasian (5,730 | 74.7%), Hispanic or Latino (3,206 | 41.8%), and Two or more Races (817 | 10.7%).
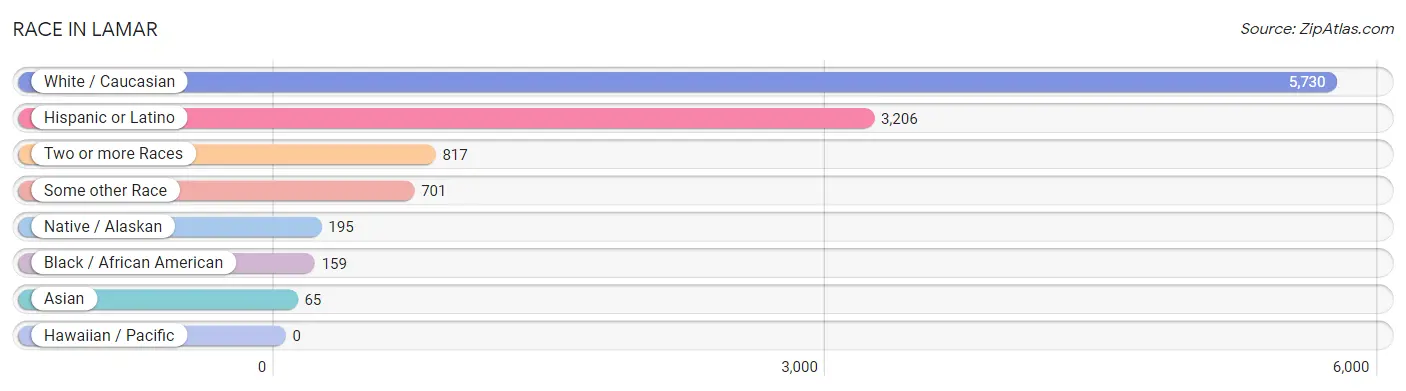
| Race | # Population | % Population |
| Asian | 65 | 0.9% |
| Black / African American | 159 | 2.1% |
| Hawaiian / Pacific | 0 | 0.0% |
| Hispanic or Latino | 3,206 | 41.8% |
| Native / Alaskan | 195 | 2.5% |
| White / Caucasian | 5,730 | 74.7% |
| Two or more Races | 817 | 10.7% |
| Some other Race | 701 | 9.1% |
| Total | 7,667 | 100.0% |
Ancestry in Lamar
The most populous ancestries reported in Lamar are Mexican (2,668 | 34.8%), German (1,082 | 14.1%), English (851 | 11.1%), American (643 | 8.4%), and Irish (251 | 3.3%), together accounting for 71.7% of all Lamar residents.
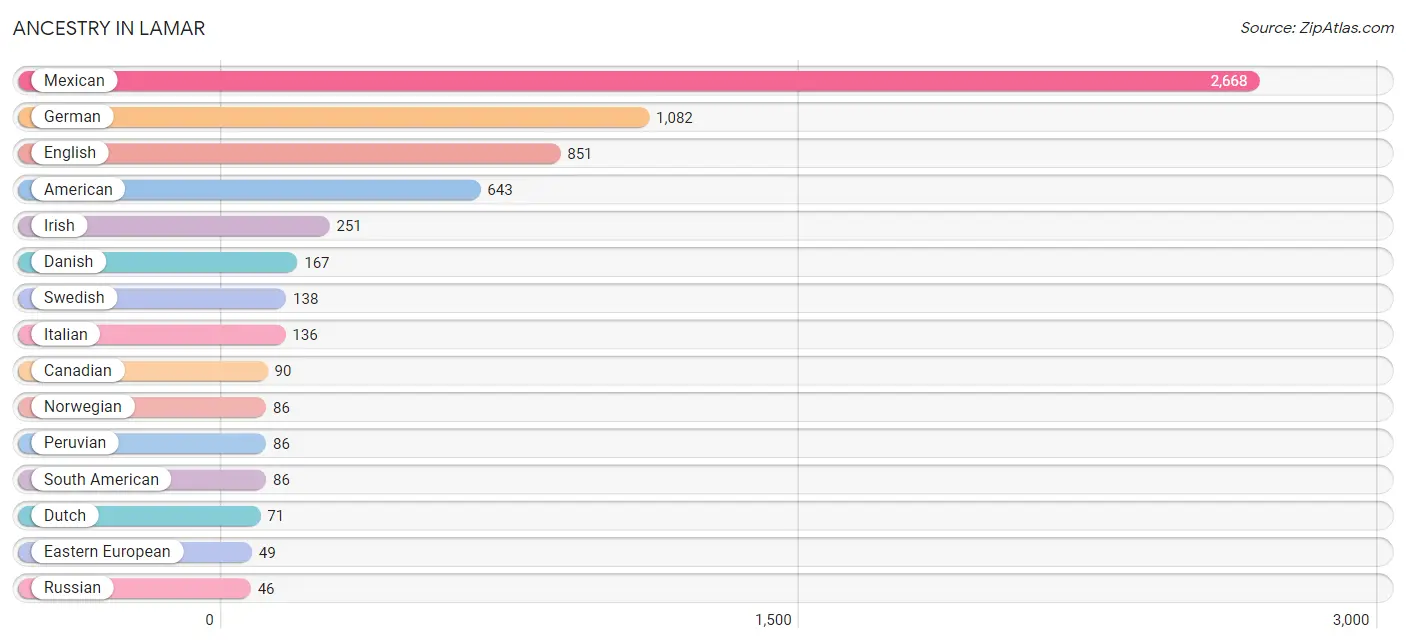
| Ancestry | # Population | % Population |
| Alaskan Athabascan | 26 | 0.3% |
| American | 643 | 8.4% |
| Apache | 31 | 0.4% |
| Burmese | 17 | 0.2% |
| Canadian | 90 | 1.2% |
| Cherokee | 36 | 0.5% |
| Chippewa | 19 | 0.3% |
| Czech | 23 | 0.3% |
| Danish | 167 | 2.2% |
| Dutch | 71 | 0.9% |
| Eastern European | 49 | 0.6% |
| English | 851 | 11.1% |
| European | 37 | 0.5% |
| French | 15 | 0.2% |
| German | 1,082 | 14.1% |
| Indian (Asian) | 8 | 0.1% |
| Irish | 251 | 3.3% |
| Italian | 136 | 1.8% |
| Korean | 30 | 0.4% |
| Mexican | 2,668 | 34.8% |
| Mexican American Indian | 13 | 0.2% |
| Norwegian | 86 | 1.1% |
| Peruvian | 86 | 1.1% |
| Polish | 18 | 0.2% |
| Russian | 46 | 0.6% |
| Scotch-Irish | 40 | 0.5% |
| Scottish | 43 | 0.6% |
| South American | 86 | 1.1% |
| Spaniard | 19 | 0.3% |
| Spanish | 38 | 0.5% |
| Swedish | 138 | 1.8% |
| Thai | 10 | 0.1% |
| Welsh | 31 | 0.4% | View All 33 Rows |
Immigrants in Lamar
The most numerous immigrant groups reported in Lamar came from Latin America (589 | 7.7%), Central America (503 | 6.6%), Mexico (503 | 6.6%), Peru (86 | 1.1%), and South America (86 | 1.1%), together accounting for 23.0% of all Lamar residents.
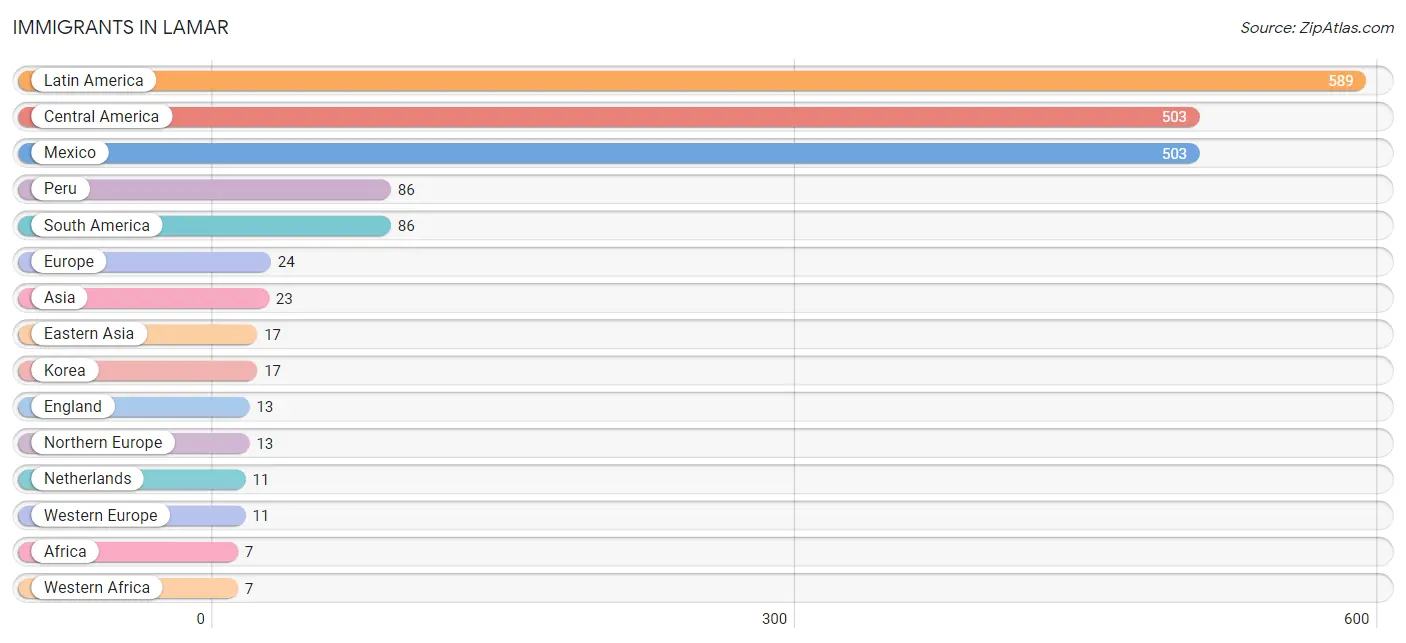
| Immigration Origin | # Population | % Population |
| Africa | 7 | 0.1% |
| Asia | 23 | 0.3% |
| Central America | 503 | 6.6% |
| Eastern Asia | 17 | 0.2% |
| England | 13 | 0.2% |
| Europe | 24 | 0.3% |
| Korea | 17 | 0.2% |
| Latin America | 589 | 7.7% |
| Mexico | 503 | 6.6% |
| Netherlands | 11 | 0.1% |
| Northern Europe | 13 | 0.2% |
| Peru | 86 | 1.1% |
| Philippines | 6 | 0.1% |
| South America | 86 | 1.1% |
| South Eastern Asia | 6 | 0.1% |
| Western Africa | 7 | 0.1% |
| Western Europe | 11 | 0.1% | View All 17 Rows |
Sex and Age in Lamar
Sex and Age in Lamar
The most populous age groups in Lamar are 15 to 19 Years (526 | 13.2%) for men and 5 to 9 Years (362 | 9.8%) for women.
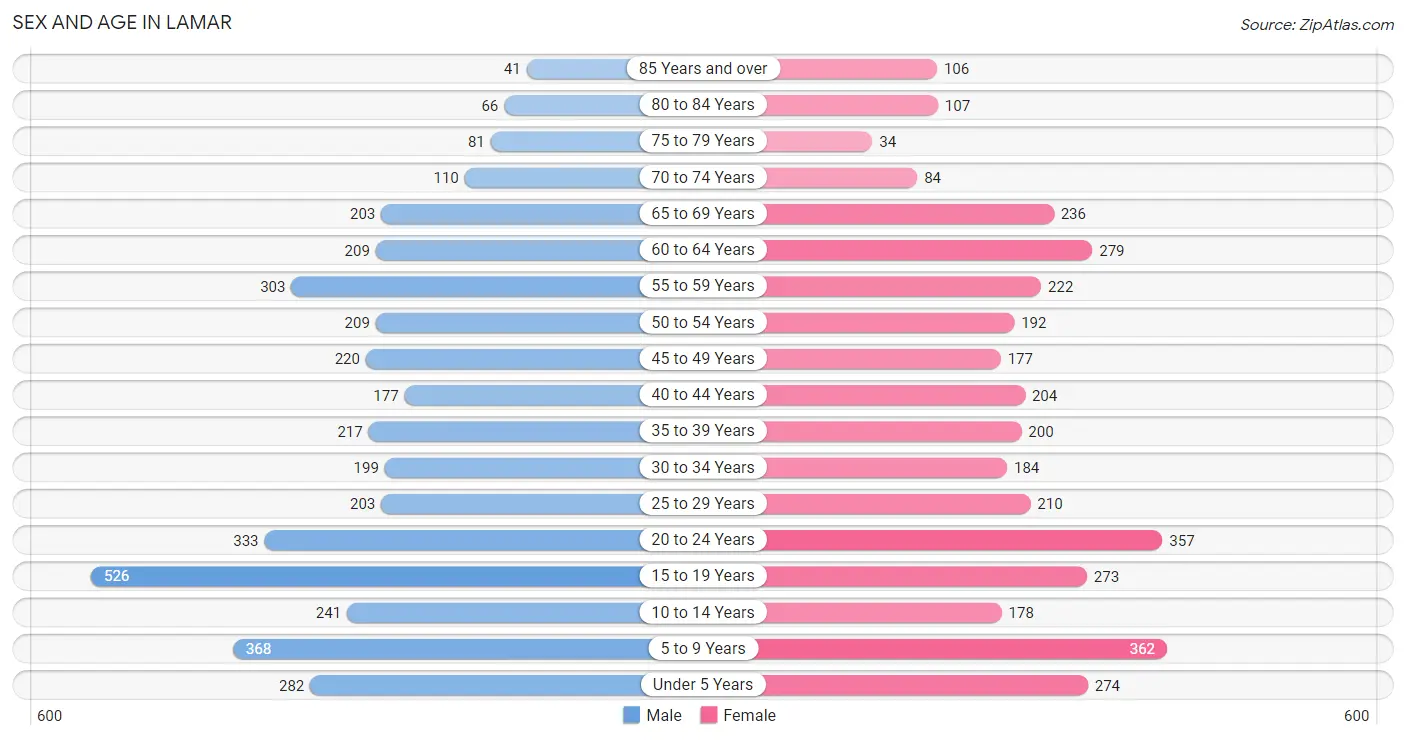
| Age Bracket | Male | Female |
| Under 5 Years | 282 (7.1%) | 274 (7.4%) |
| 5 to 9 Years | 368 (9.2%) | 362 (9.8%) |
| 10 to 14 Years | 241 (6.0%) | 178 (4.8%) |
| 15 to 19 Years | 526 (13.2%) | 273 (7.4%) |
| 20 to 24 Years | 333 (8.4%) | 357 (9.7%) |
| 25 to 29 Years | 203 (5.1%) | 210 (5.7%) |
| 30 to 34 Years | 199 (5.0%) | 184 (5.0%) |
| 35 to 39 Years | 217 (5.4%) | 200 (5.4%) |
| 40 to 44 Years | 177 (4.4%) | 204 (5.5%) |
| 45 to 49 Years | 220 (5.5%) | 177 (4.8%) |
| 50 to 54 Years | 209 (5.2%) | 192 (5.2%) |
| 55 to 59 Years | 303 (7.6%) | 222 (6.0%) |
| 60 to 64 Years | 209 (5.2%) | 279 (7.6%) |
| 65 to 69 Years | 203 (5.1%) | 236 (6.4%) |
| 70 to 74 Years | 110 (2.8%) | 84 (2.3%) |
| 75 to 79 Years | 81 (2.0%) | 34 (0.9%) |
| 80 to 84 Years | 66 (1.7%) | 107 (2.9%) |
| 85 Years and over | 41 (1.0%) | 106 (2.9%) |
| Total | 3,988 (100.0%) | 3,679 (100.0%) |
Families and Households in Lamar
Median Family Size in Lamar
The median family size in Lamar is 3.21 persons per family, with married-couple families (1,415 | 74.4%) accounting for the largest median family size of 3.28 persons per family. On the other hand, single male/father families (122 | 6.4%) represent the smallest median family size with 2.27 persons per family.
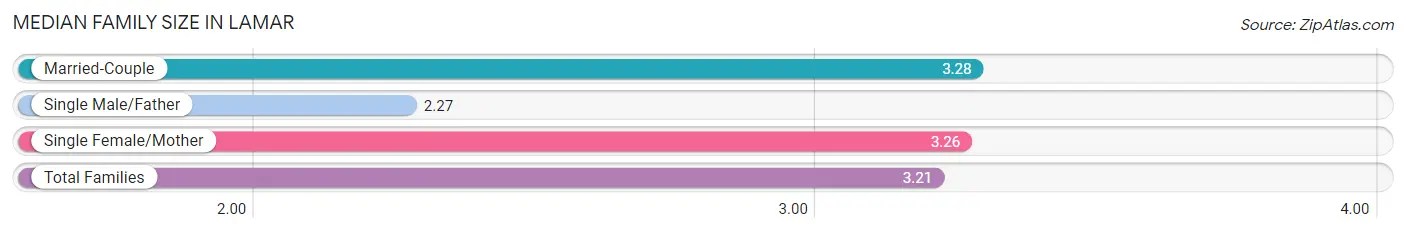
| Family Type | # Families | Family Size |
| Married-Couple | 1,415 (74.4%) | 3.28 |
| Single Male/Father | 122 (6.4%) | 2.27 |
| Single Female/Mother | 364 (19.2%) | 3.26 |
| Total Families | 1,901 (100.0%) | 3.21 |
Median Household Size in Lamar
The median household size in Lamar is 2.62 persons per household, with single female/mother households (364 | 13.0%) accounting for the largest median household size of 3.7 persons per household. non-family households (905 | 32.3%) represent the smallest median household size with 1.14 persons per household.
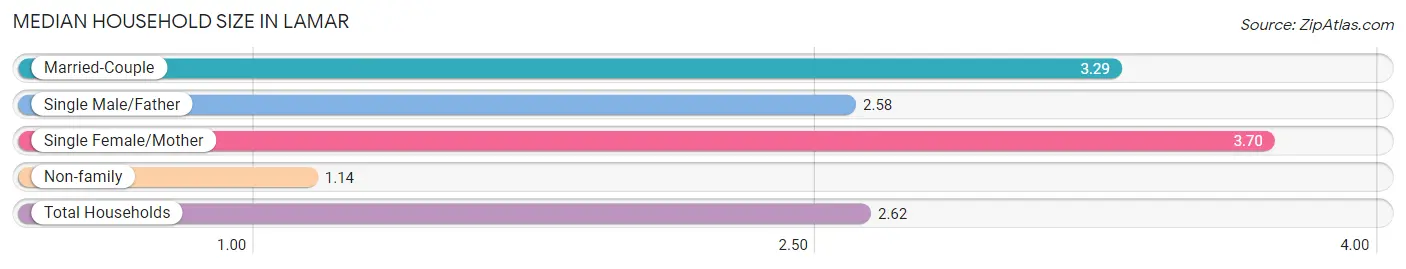
| Household Type | # Households | Household Size |
| Married-Couple | 1,415 (50.4%) | 3.29 |
| Single Male/Father | 122 (4.3%) | 2.58 |
| Single Female/Mother | 364 (13.0%) | 3.70 |
| Non-family | 905 (32.3%) | 1.14 |
| Total Households | 2,806 (100.0%) | 2.62 |
Household Size by Marriage Status in Lamar
Out of a total of 2,806 households in Lamar, 1,901 (67.7%) are family households, while 905 (32.3%) are nonfamily households. The most numerous type of family households are 2-person households, comprising 655, and the most common type of nonfamily households are 1-person households, comprising 789.
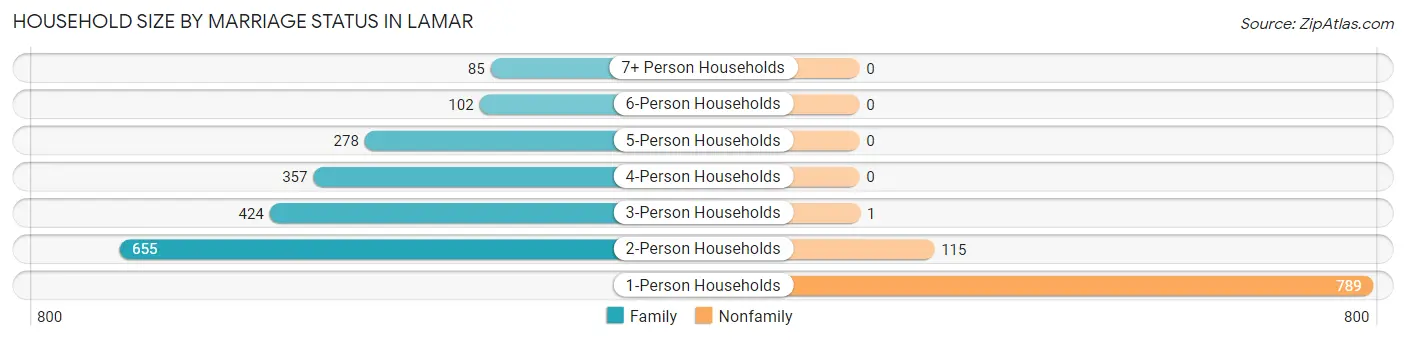
| Household Size | Family Households | Nonfamily Households |
| 1-Person Households | - | 789 (28.1%) |
| 2-Person Households | 655 (23.3%) | 115 (4.1%) |
| 3-Person Households | 424 (15.1%) | 1 (0.0%) |
| 4-Person Households | 357 (12.7%) | 0 (0.0%) |
| 5-Person Households | 278 (9.9%) | 0 (0.0%) |
| 6-Person Households | 102 (3.6%) | 0 (0.0%) |
| 7+ Person Households | 85 (3.0%) | 0 (0.0%) |
| Total | 1,901 (67.7%) | 905 (32.3%) |
Female Fertility in Lamar
Fertility by Age in Lamar
Average fertility rate in Lamar is 106.0 births per 1,000 women. Women in the age bracket of 20 to 34 years have the highest fertility rate with 228.0 births per 1,000 women. Women in the age bracket of 20 to 34 years acount for 100.0% of all women with births.
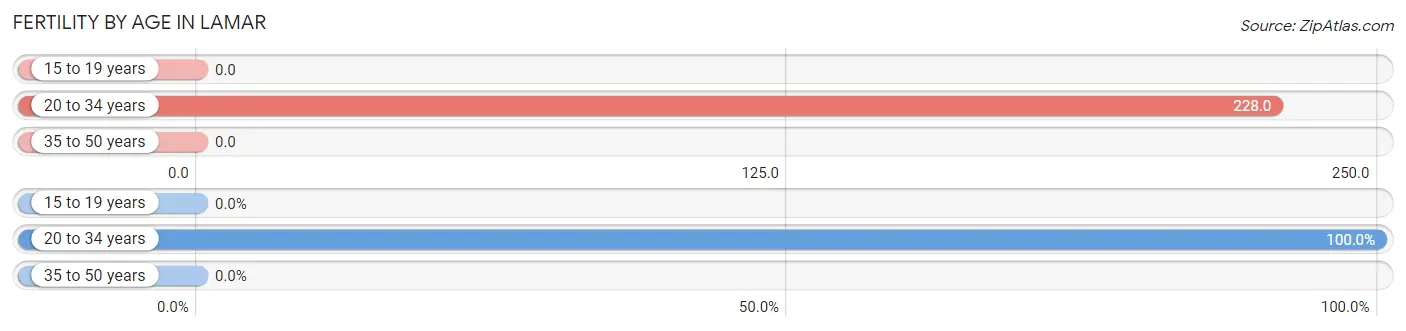
| Age Bracket | Women with Births | Births / 1,000 Women |
| 15 to 19 years | 0 (0.0%) | 0.0 |
| 20 to 34 years | 171 (100.0%) | 228.0 |
| 35 to 50 years | 0 (0.0%) | 0.0 |
| Total | 171 (100.0%) | 106.0 |
Fertility by Age by Marriage Status in Lamar
84.2% of women with births (171) in Lamar are married. The highest percentage of unmarried women with births falls into 20 to 34 years age bracket with 15.8% of them unmarried at the time of birth, while the lowest percentage of unmarried women with births belong to 20 to 34 years age bracket with 15.8% of them unmarried.
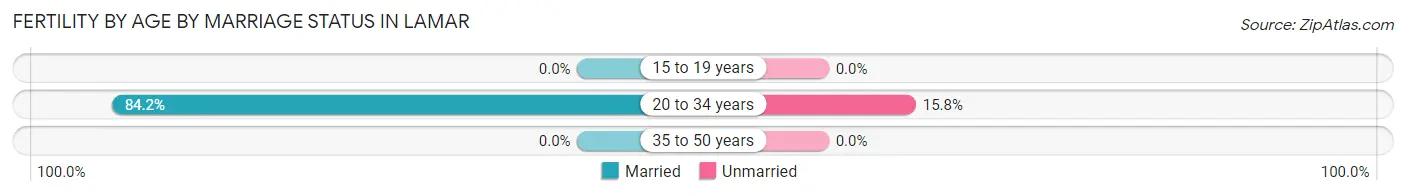
| Age Bracket | Married | Unmarried |
| 15 to 19 years | 0 (0.0%) | 0 (0.0%) |
| 20 to 34 years | 144 (84.2%) | 27 (15.8%) |
| 35 to 50 years | 0 (0.0%) | 0 (0.0%) |
| Total | 144 (84.2%) | 27 (15.8%) |
Fertility by Education in Lamar
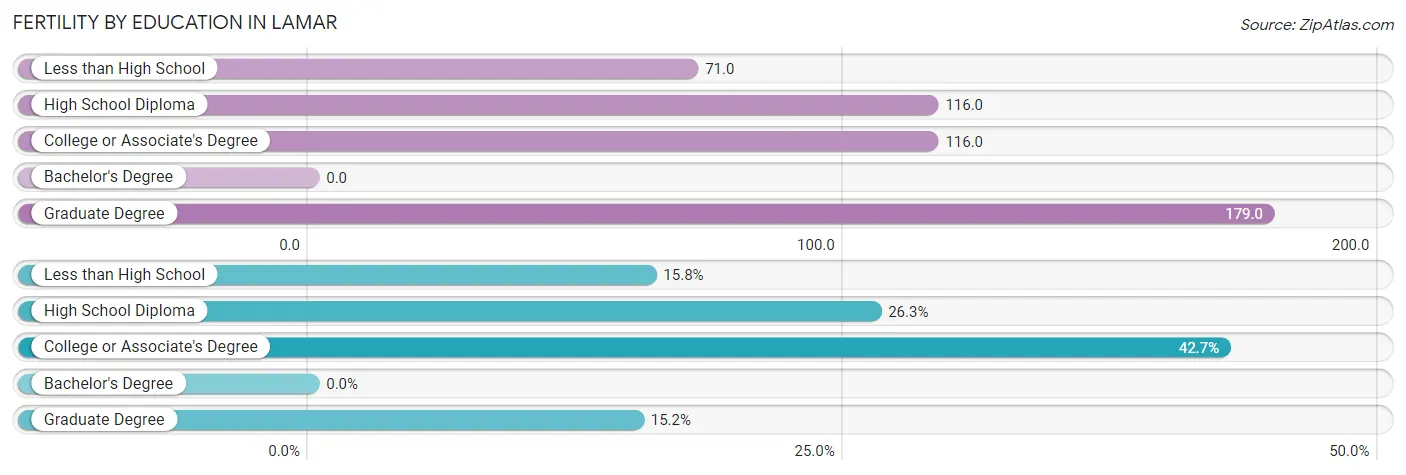
| Educational Attainment | Women with Births | Births / 1,000 Women |
| Less than High School | 27 (15.8%) | 71.0 |
| High School Diploma | 45 (26.3%) | 116.0 |
| College or Associate's Degree | 73 (42.7%) | 116.0 |
| Bachelor's Degree | 0 (0.0%) | 0.0 |
| Graduate Degree | 26 (15.2%) | 179.0 |
| Total | 171 (100.0%) | 106.0 |
Fertility by Education by Marriage Status in Lamar
15.8% of women with births in Lamar are unmarried. Women with the educational attainment of high school diploma are most likely to be married with 100.0% of them married at childbirth, while women with the educational attainment of less than high school are least likely to be married with 100.0% of them unmarried at childbirth.
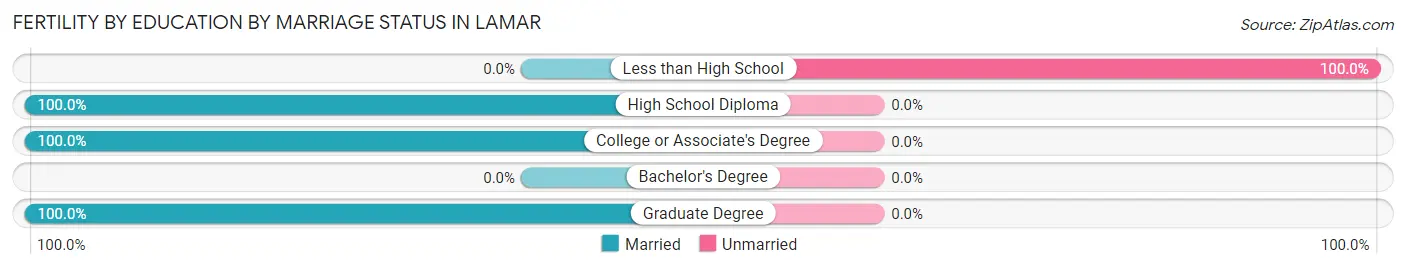
| Educational Attainment | Married | Unmarried |
| Less than High School | 0 (0.0%) | 27 (100.0%) |
| High School Diploma | 45 (100.0%) | 0 (0.0%) |
| College or Associate's Degree | 73 (100.0%) | 0 (0.0%) |
| Bachelor's Degree | 0 (0.0%) | 0 (0.0%) |
| Graduate Degree | 26 (100.0%) | 0 (0.0%) |
| Total | 144 (84.2%) | 27 (15.8%) |
Employment Characteristics in Lamar
Employment by Class of Employer in Lamar
Among the 3,347 employed individuals in Lamar, private company employees (2,048 | 61.2%), local government employees (471 | 14.1%), and not-for-profit organizations (316 | 9.4%) make up the most common classes of employment.
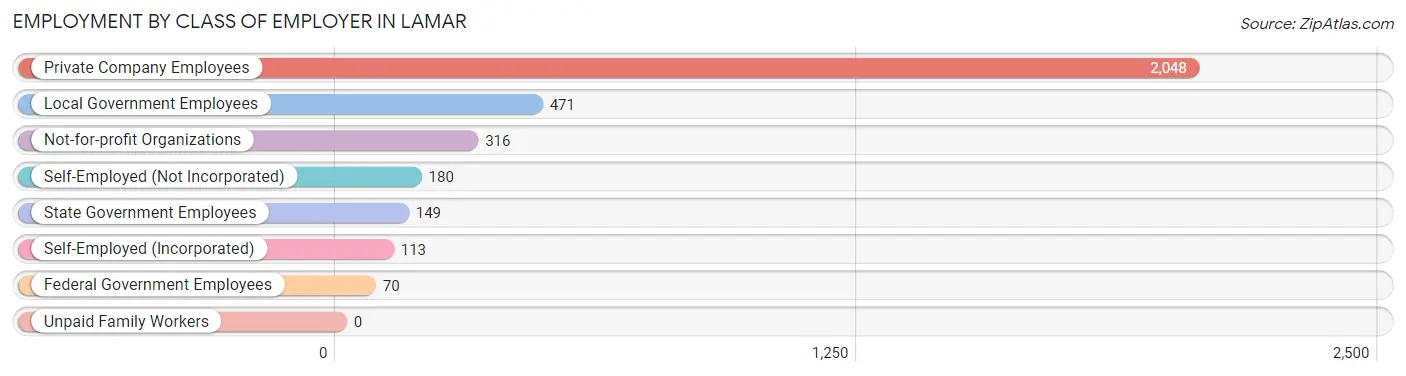
| Employer Class | # Employees | % Employees |
| Private Company Employees | 2,048 | 61.2% |
| Self-Employed (Incorporated) | 113 | 3.4% |
| Self-Employed (Not Incorporated) | 180 | 5.4% |
| Not-for-profit Organizations | 316 | 9.4% |
| Local Government Employees | 471 | 14.1% |
| State Government Employees | 149 | 4.4% |
| Federal Government Employees | 70 | 2.1% |
| Unpaid Family Workers | 0 | 0.0% |
| Total | 3,347 | 100.0% |
Employment Status by Age in Lamar
According to the labor force statistics for Lamar, out of the total population over 16 years of age (5,834), 61.4% or 3,582 individuals are in the labor force, with 5.9% or 211 of them unemployed. The age group with the highest labor force participation rate is 20 to 24 years, with 89.7% or 619 individuals in the labor force. Within the labor force, the 30 to 34 years age range has the highest percentage of unemployed individuals, with 16.8% or 46 of them being unemployed.
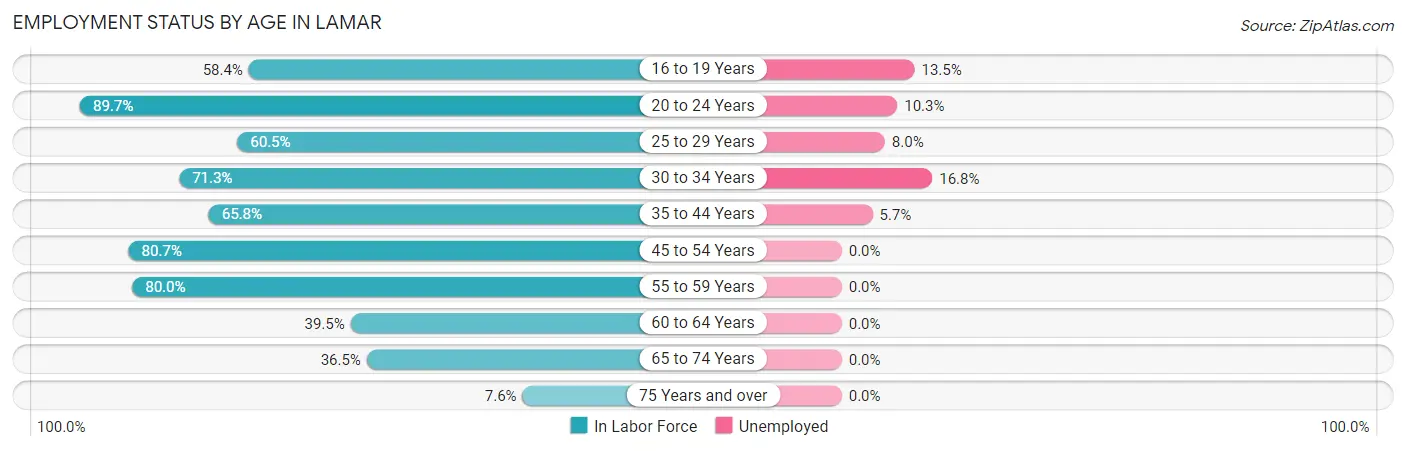
| Age Bracket | In Labor Force | Unemployed |
| 16 to 19 Years | 392 (58.4%) | 53 (13.5%) |
| 20 to 24 Years | 619 (89.7%) | 64 (10.3%) |
| 25 to 29 Years | 250 (60.5%) | 20 (8.0%) |
| 30 to 34 Years | 273 (71.3%) | 46 (16.8%) |
| 35 to 44 Years | 525 (65.8%) | 30 (5.7%) |
| 45 to 54 Years | 644 (80.7%) | 0 (0.0%) |
| 55 to 59 Years | 420 (80.0%) | 0 (0.0%) |
| 60 to 64 Years | 193 (39.5%) | 0 (0.0%) |
| 65 to 74 Years | 231 (36.5%) | 0 (0.0%) |
| 75 Years and over | 33 (7.6%) | 0 (0.0%) |
| Total | 3,582 (61.4%) | 211 (5.9%) |
Employment Status by Educational Attainment in Lamar
According to labor force statistics for Lamar, 67.7% of individuals (2,305) out of the total population between 25 and 64 years of age (3,405) are in the labor force, with 4.2% or 97 of them being unemployed. The group with the highest labor force participation rate are those with the educational attainment of bachelor's degree or higher, with 80.3% or 573 individuals in the labor force. Within the labor force, individuals with less than high school education have the highest percentage of unemployment, with 8.1% or 20 of them being unemployed.
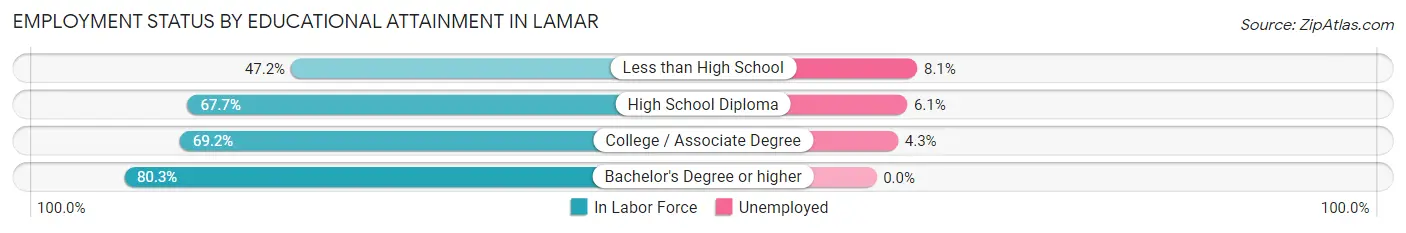
| Educational Attainment | In Labor Force | Unemployed |
| Less than High School | 246 (47.2%) | 42 (8.1%) |
| High School Diploma | 687 (67.7%) | 62 (6.1%) |
| College / Associate Degree | 799 (69.2%) | 50 (4.3%) |
| Bachelor's Degree or higher | 573 (80.3%) | 0 (0.0%) |
| Total | 2,305 (67.7%) | 143 (4.2%) |
Employment Occupations by Sex in Lamar
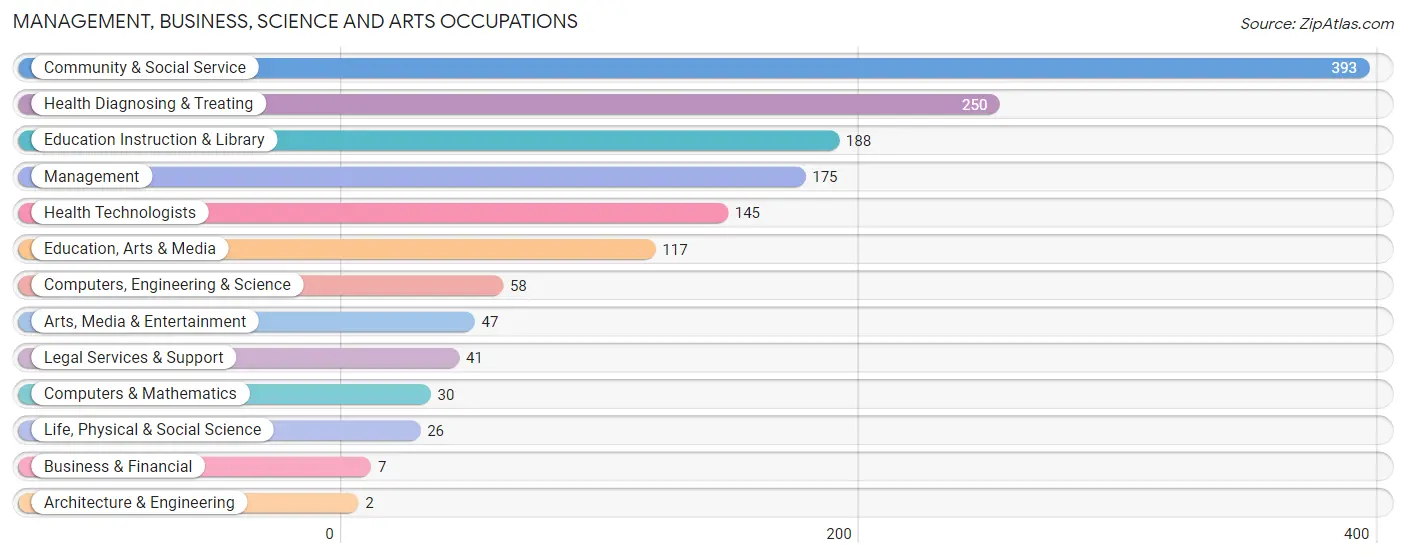
Management, Business, Science and Arts Occupations
The most common Management, Business, Science and Arts occupations in Lamar are Community & Social Service (393 | 11.7%), Health Diagnosing & Treating (250 | 7.4%), Education Instruction & Library (188 | 5.6%), Management (175 | 5.2%), and Health Technologists (145 | 4.3%).
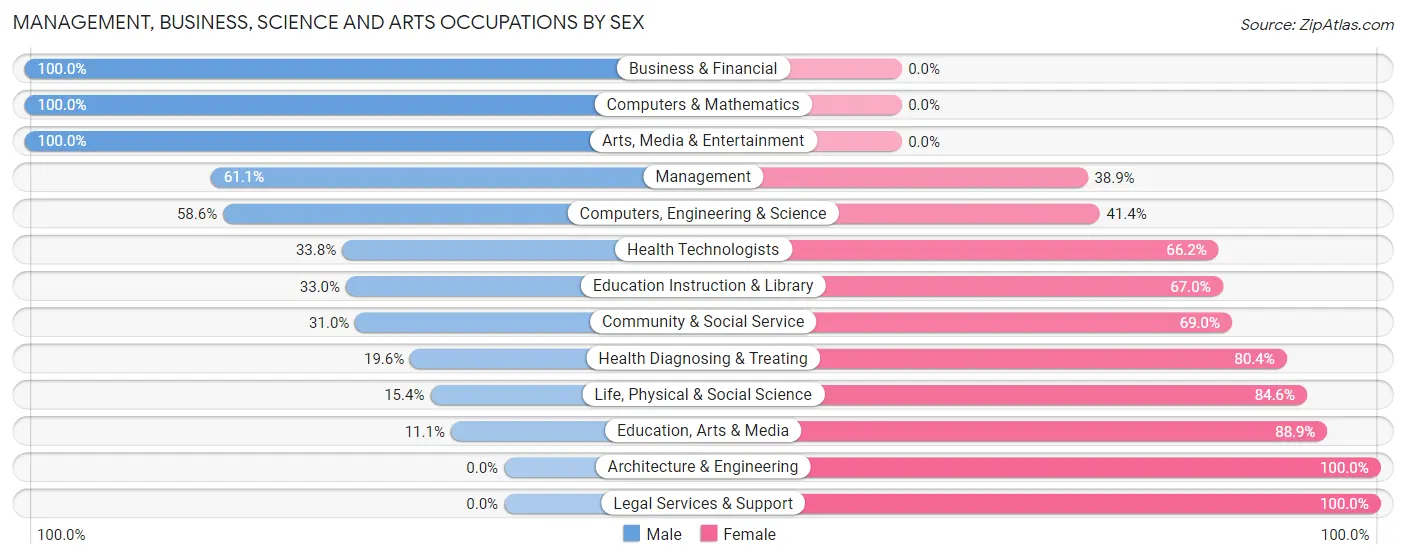
Management, Business, Science and Arts Occupations by Sex
Within the Management, Business, Science and Arts occupations in Lamar, the most male-oriented occupations are Business & Financial (100.0%), Computers & Mathematics (100.0%), and Arts, Media & Entertainment (100.0%), while the most female-oriented occupations are Architecture & Engineering (100.0%), Legal Services & Support (100.0%), and Education, Arts & Media (88.9%).
| Occupation | Male | Female |
| Management | 107 (61.1%) | 68 (38.9%) |
| Business & Financial | 7 (100.0%) | 0 (0.0%) |
| Computers, Engineering & Science | 34 (58.6%) | 24 (41.4%) |
| Computers & Mathematics | 30 (100.0%) | 0 (0.0%) |
| Architecture & Engineering | 0 (0.0%) | 2 (100.0%) |
| Life, Physical & Social Science | 4 (15.4%) | 22 (84.6%) |
| Community & Social Service | 122 (31.0%) | 271 (69.0%) |
| Education, Arts & Media | 13 (11.1%) | 104 (88.9%) |
| Legal Services & Support | 0 (0.0%) | 41 (100.0%) |
| Education Instruction & Library | 62 (33.0%) | 126 (67.0%) |
| Arts, Media & Entertainment | 47 (100.0%) | 0 (0.0%) |
| Health Diagnosing & Treating | 49 (19.6%) | 201 (80.4%) |
| Health Technologists | 49 (33.8%) | 96 (66.2%) |
| Total (Category) | 319 (36.1%) | 564 (63.9%) |
| Total (Overall) | 1,908 (56.7%) | 1,459 (43.3%) |
Services Occupations
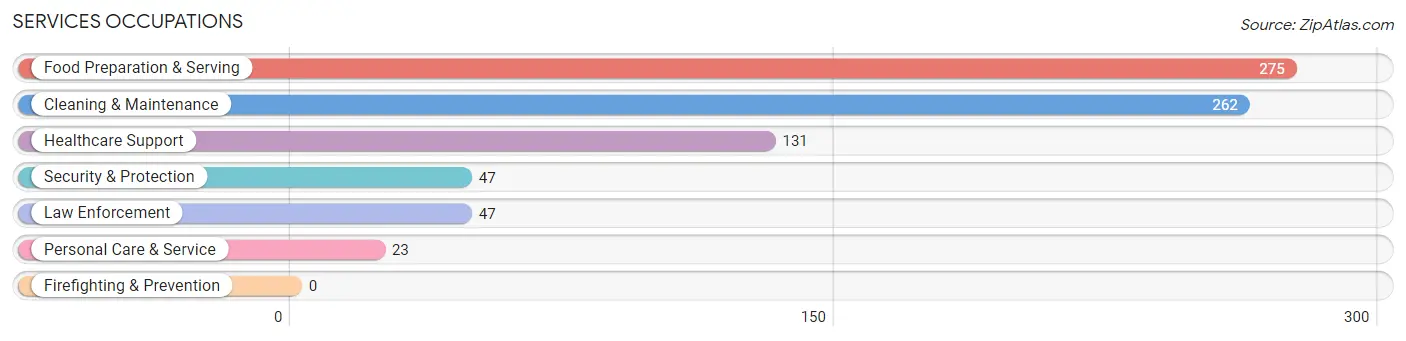
The most common Services occupations in Lamar are Food Preparation & Serving (275 | 8.2%), Cleaning & Maintenance (262 | 7.8%), Healthcare Support (131 | 3.9%), Security & Protection (47 | 1.4%), and Law Enforcement (47 | 1.4%).
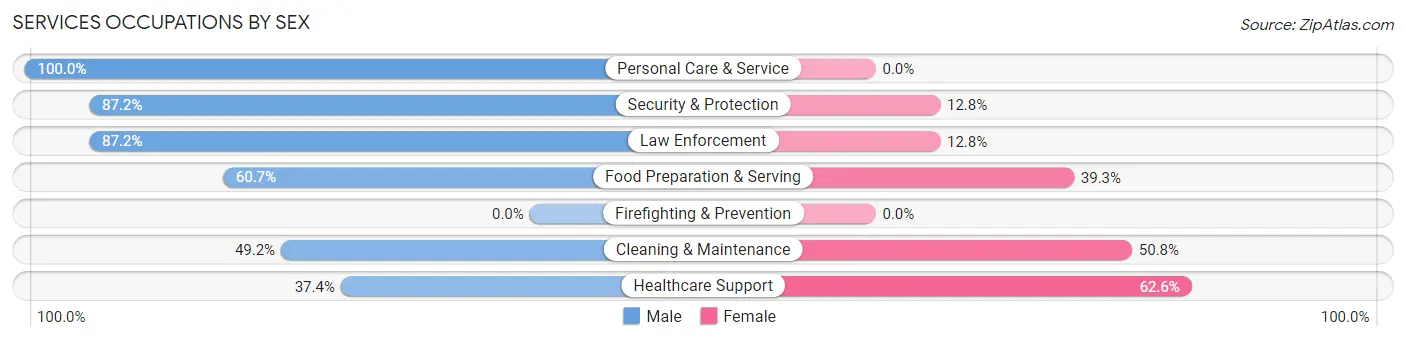
Services Occupations by Sex
Within the Services occupations in Lamar, the most male-oriented occupations are Personal Care & Service (100.0%), Security & Protection (87.2%), and Law Enforcement (87.2%), while the most female-oriented occupations are Healthcare Support (62.6%), Cleaning & Maintenance (50.8%), and Food Preparation & Serving (39.3%).
| Occupation | Male | Female |
| Healthcare Support | 49 (37.4%) | 82 (62.6%) |
| Security & Protection | 41 (87.2%) | 6 (12.8%) |
| Firefighting & Prevention | 0 (0.0%) | 0 (0.0%) |
| Law Enforcement | 41 (87.2%) | 6 (12.8%) |
| Food Preparation & Serving | 167 (60.7%) | 108 (39.3%) |
| Cleaning & Maintenance | 129 (49.2%) | 133 (50.8%) |
| Personal Care & Service | 23 (100.0%) | 0 (0.0%) |
| Total (Category) | 409 (55.4%) | 329 (44.6%) |
| Total (Overall) | 1,908 (56.7%) | 1,459 (43.3%) |
Sales and Office Occupations
The most common Sales and Office occupations in Lamar are Office & Administration (480 | 14.3%), and Sales & Related (239 | 7.1%).
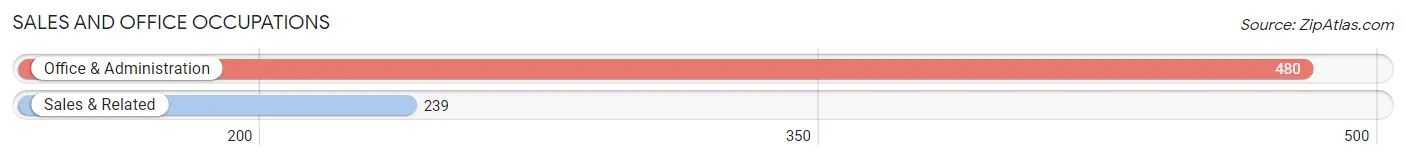
Sales and Office Occupations by Sex

| Occupation | Male | Female |
| Sales & Related | 86 (36.0%) | 153 (64.0%) |
| Office & Administration | 81 (16.9%) | 399 (83.1%) |
| Total (Category) | 167 (23.2%) | 552 (76.8%) |
| Total (Overall) | 1,908 (56.7%) | 1,459 (43.3%) |
Natural Resources, Construction and Maintenance Occupations
The most common Natural Resources, Construction and Maintenance occupations in Lamar are Construction & Extraction (298 | 8.8%), Farming, Fishing & Forestry (96 | 2.9%), and Installation, Maintenance & Repair (37 | 1.1%).
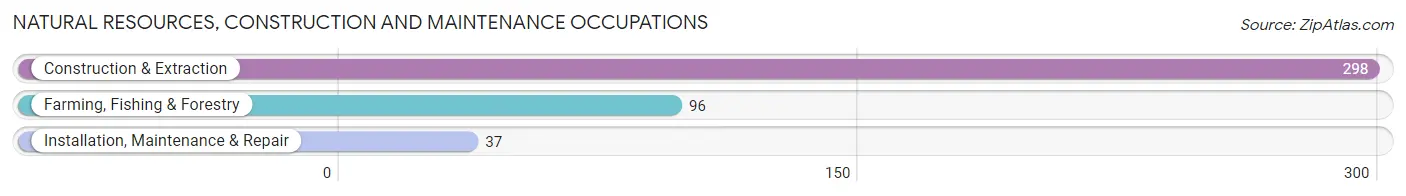
Natural Resources, Construction and Maintenance Occupations by Sex
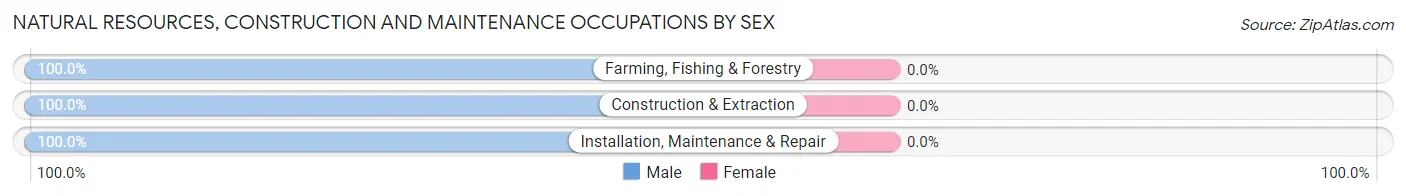
| Occupation | Male | Female |
| Farming, Fishing & Forestry | 96 (100.0%) | 0 (0.0%) |
| Construction & Extraction | 298 (100.0%) | 0 (0.0%) |
| Installation, Maintenance & Repair | 37 (100.0%) | 0 (0.0%) |
| Total (Category) | 431 (100.0%) | 0 (0.0%) |
| Total (Overall) | 1,908 (56.7%) | 1,459 (43.3%) |
Production, Transportation and Moving Occupations
The most common Production, Transportation and Moving occupations in Lamar are Production (233 | 6.9%), Material Moving (200 | 5.9%), and Transportation (163 | 4.8%).
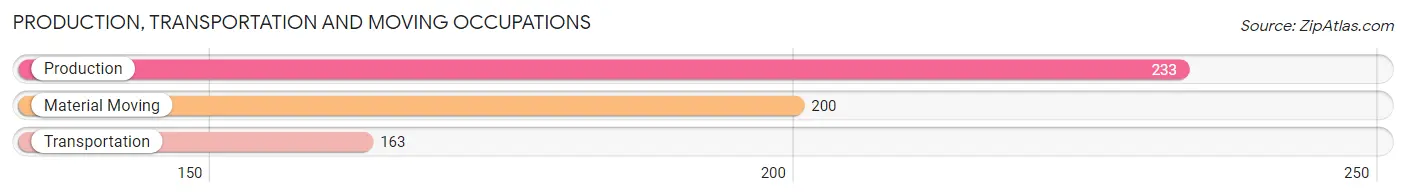
Production, Transportation and Moving Occupations by Sex
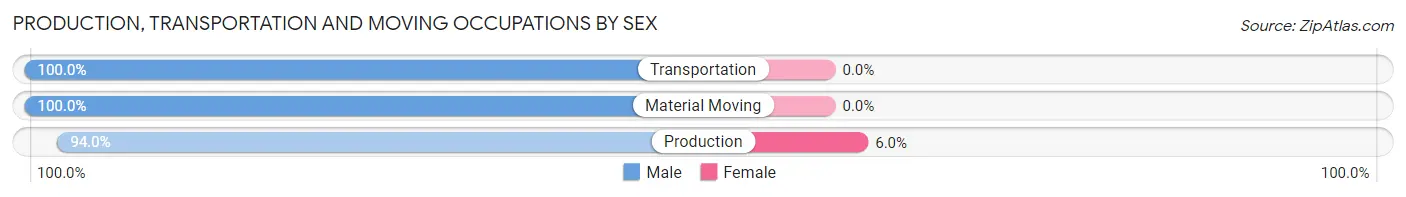
| Occupation | Male | Female |
| Production | 219 (94.0%) | 14 (6.0%) |
| Transportation | 163 (100.0%) | 0 (0.0%) |
| Material Moving | 200 (100.0%) | 0 (0.0%) |
| Total (Category) | 582 (97.7%) | 14 (2.4%) |
| Total (Overall) | 1,908 (56.7%) | 1,459 (43.3%) |
Employment Industries by Sex in Lamar
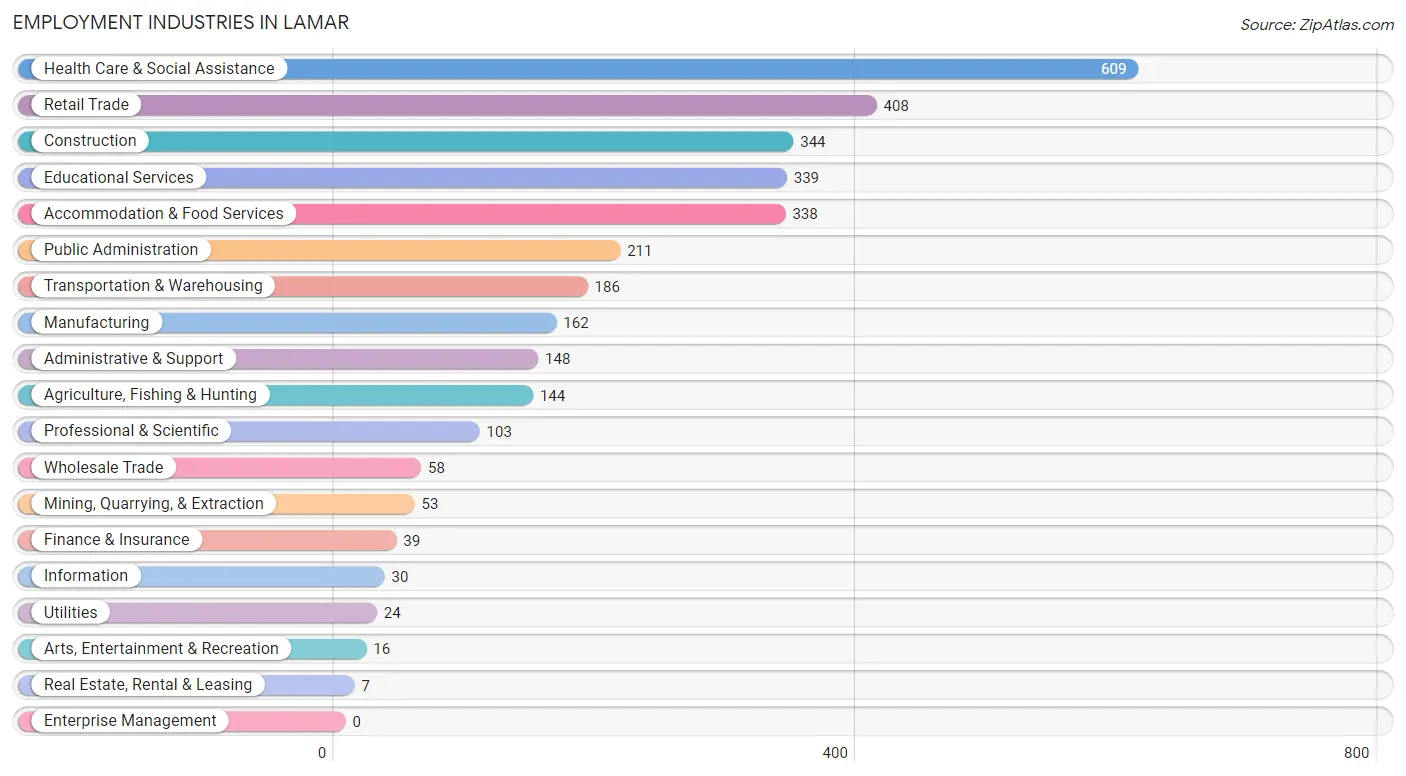
Employment Industries in Lamar
The major employment industries in Lamar include Health Care & Social Assistance (609 | 18.1%), Retail Trade (408 | 12.1%), Construction (344 | 10.2%), Educational Services (339 | 10.1%), and Accommodation & Food Services (338 | 10.0%).
Employment Industries by Sex in Lamar
The Lamar industries that see more men than women are Agriculture, Fishing & Hunting (100.0%), Mining, Quarrying, & Extraction (100.0%), and Wholesale Trade (100.0%), whereas the industries that tend to have a higher number of women are Finance & Insurance (100.0%), Real Estate, Rental & Leasing (100.0%), and Arts, Entertainment & Recreation (100.0%).
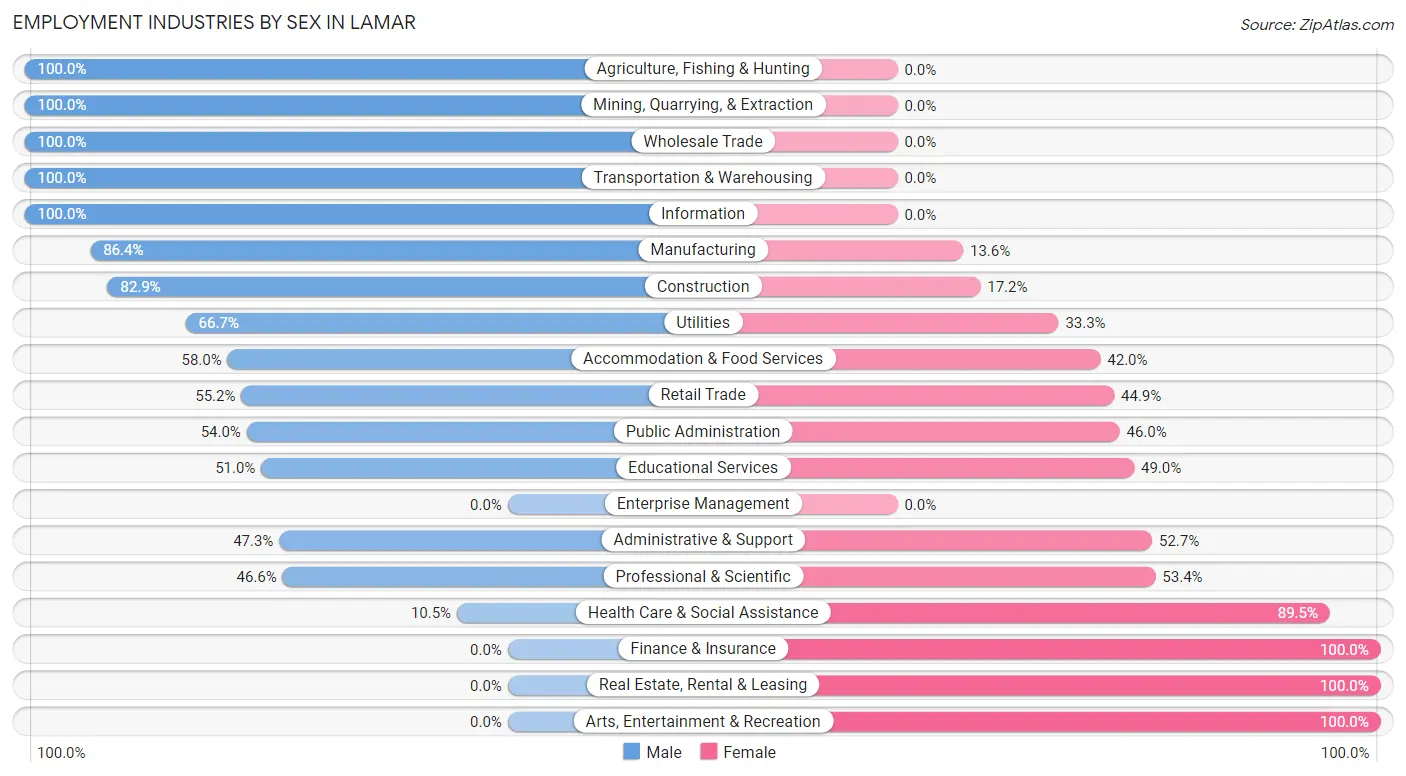
| Industry | Male | Female |
| Agriculture, Fishing & Hunting | 144 (100.0%) | 0 (0.0%) |
| Mining, Quarrying, & Extraction | 53 (100.0%) | 0 (0.0%) |
| Construction | 285 (82.9%) | 59 (17.2%) |
| Manufacturing | 140 (86.4%) | 22 (13.6%) |
| Wholesale Trade | 58 (100.0%) | 0 (0.0%) |
| Retail Trade | 225 (55.1%) | 183 (44.9%) |
| Transportation & Warehousing | 186 (100.0%) | 0 (0.0%) |
| Utilities | 16 (66.7%) | 8 (33.3%) |
| Information | 30 (100.0%) | 0 (0.0%) |
| Finance & Insurance | 0 (0.0%) | 39 (100.0%) |
| Real Estate, Rental & Leasing | 0 (0.0%) | 7 (100.0%) |
| Professional & Scientific | 48 (46.6%) | 55 (53.4%) |
| Enterprise Management | 0 (0.0%) | 0 (0.0%) |
| Administrative & Support | 70 (47.3%) | 78 (52.7%) |
| Educational Services | 173 (51.0%) | 166 (49.0%) |
| Health Care & Social Assistance | 64 (10.5%) | 545 (89.5%) |
| Arts, Entertainment & Recreation | 0 (0.0%) | 16 (100.0%) |
| Accommodation & Food Services | 196 (58.0%) | 142 (42.0%) |
| Public Administration | 114 (54.0%) | 97 (46.0%) |
| Total | 1,908 (56.7%) | 1,459 (43.3%) |
Education in Lamar
School Enrollment in Lamar
The most common levels of schooling among the 1,903 students in Lamar are high school (486 | 25.5%), elementary school (429 | 22.5%), and college / undergraduate (368 | 19.3%).
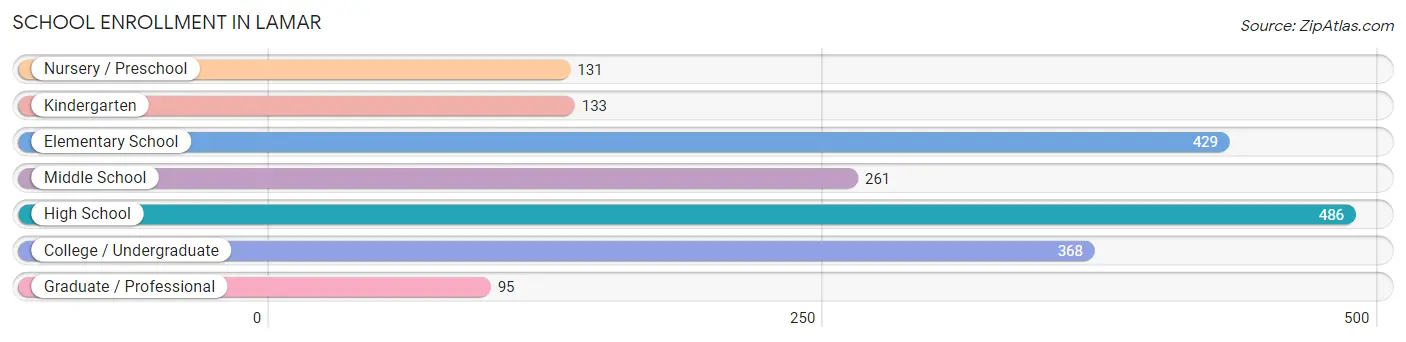
| School Level | # Students | % Students |
| Nursery / Preschool | 131 | 6.9% |
| Kindergarten | 133 | 7.0% |
| Elementary School | 429 | 22.5% |
| Middle School | 261 | 13.7% |
| High School | 486 | 25.5% |
| College / Undergraduate | 368 | 19.3% |
| Graduate / Professional | 95 | 5.0% |
| Total | 1,903 | 100.0% |
School Enrollment by Age by Funding Source in Lamar
Out of a total of 1,903 students who are enrolled in schools in Lamar, 53 (2.8%) attend a private institution, while the remaining 1,850 (97.2%) are enrolled in public schools. The age group of 18 to 19 year olds has the highest likelihood of being enrolled in private schools, with 27 (9.6% in the age bracket) enrolled. Conversely, the age group of 3 to 4 year olds has the lowest likelihood of being enrolled in a private school, with 60 (100.0% in the age bracket) attending a public institution.
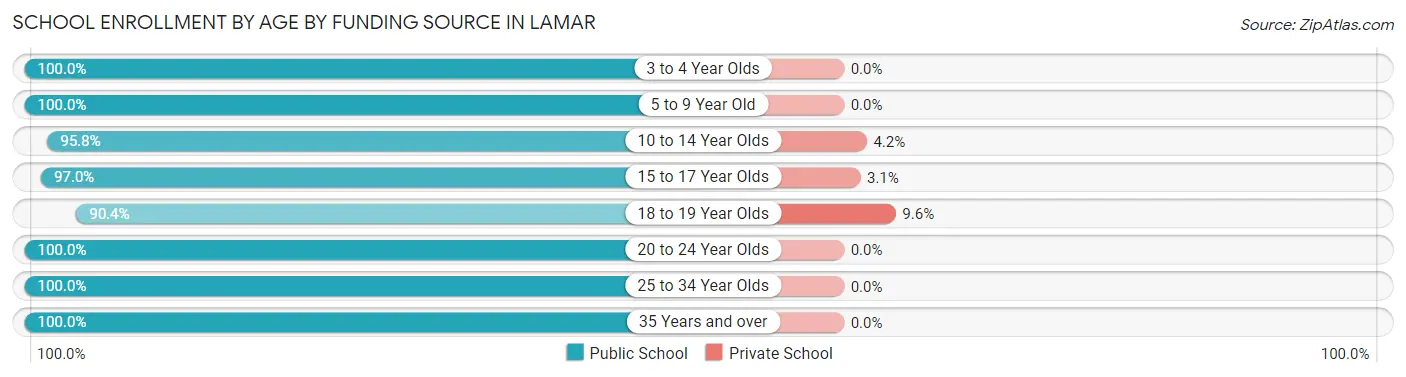
| Age Bracket | Public School | Private School |
| 3 to 4 Year Olds | 60 (100.0%) | 0 (0.0%) |
| 5 to 9 Year Old | 537 (100.0%) | 0 (0.0%) |
| 10 to 14 Year Olds | 361 (95.8%) | 16 (4.2%) |
| 15 to 17 Year Olds | 350 (97.0%) | 11 (3.0%) |
| 18 to 19 Year Olds | 253 (90.4%) | 27 (9.6%) |
| 20 to 24 Year Olds | 124 (100.0%) | 0 (0.0%) |
| 25 to 34 Year Olds | 41 (100.0%) | 0 (0.0%) |
| 35 Years and over | 123 (100.0%) | 0 (0.0%) |
| Total | 1,850 (97.2%) | 53 (2.8%) |
Educational Attainment by Field of Study in Lamar
Liberal arts & history (195 | 20.8%), education (164 | 17.5%), science & technology (153 | 16.3%), social sciences (107 | 11.4%), and business (80 | 8.5%) are the most common fields of study among 937 individuals in Lamar who have obtained a bachelor's degree or higher.
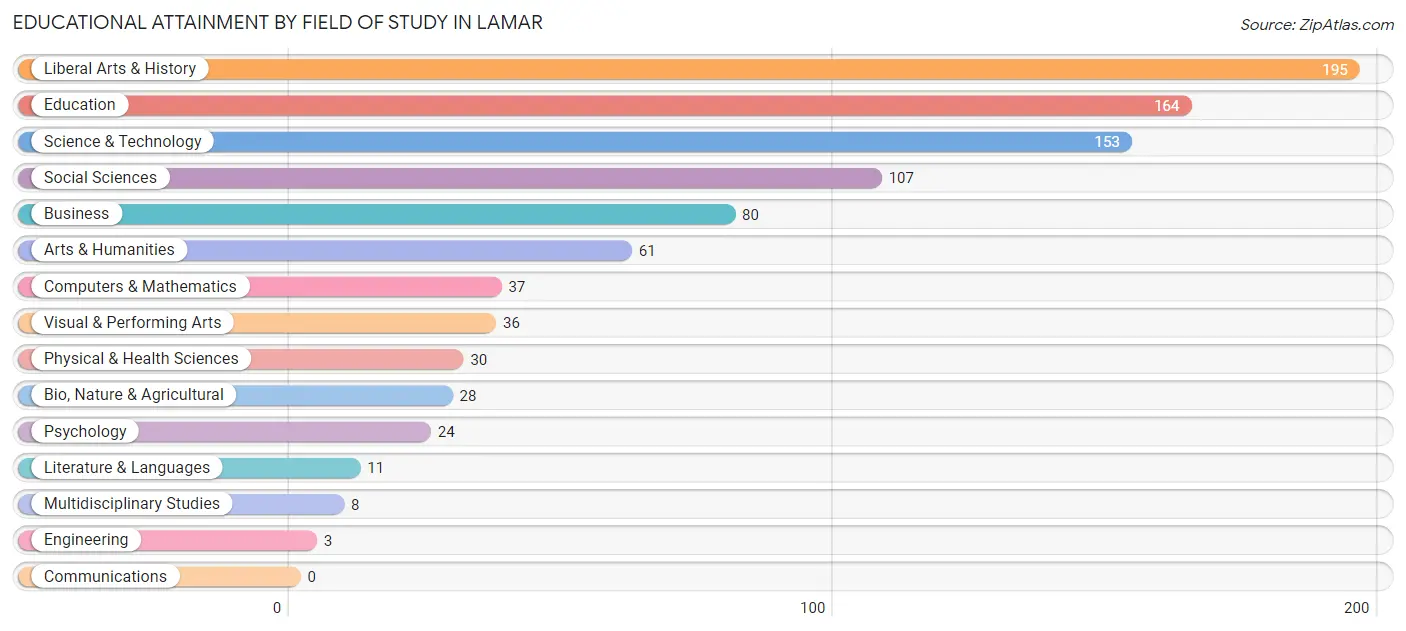
| Field of Study | # Graduates | % Graduates |
| Computers & Mathematics | 37 | 4.0% |
| Bio, Nature & Agricultural | 28 | 3.0% |
| Physical & Health Sciences | 30 | 3.2% |
| Psychology | 24 | 2.6% |
| Social Sciences | 107 | 11.4% |
| Engineering | 3 | 0.3% |
| Multidisciplinary Studies | 8 | 0.9% |
| Science & Technology | 153 | 16.3% |
| Business | 80 | 8.5% |
| Education | 164 | 17.5% |
| Literature & Languages | 11 | 1.2% |
| Liberal Arts & History | 195 | 20.8% |
| Visual & Performing Arts | 36 | 3.8% |
| Communications | 0 | 0.0% |
| Arts & Humanities | 61 | 6.5% |
| Total | 937 | 100.0% |
Transportation & Commute in Lamar
Vehicle Availability by Sex in Lamar
The most prevalent vehicle ownership categories in Lamar are males with 2 vehicles (869, accounting for 47.1%) and females with 2 vehicles (600, making up 60.9%).
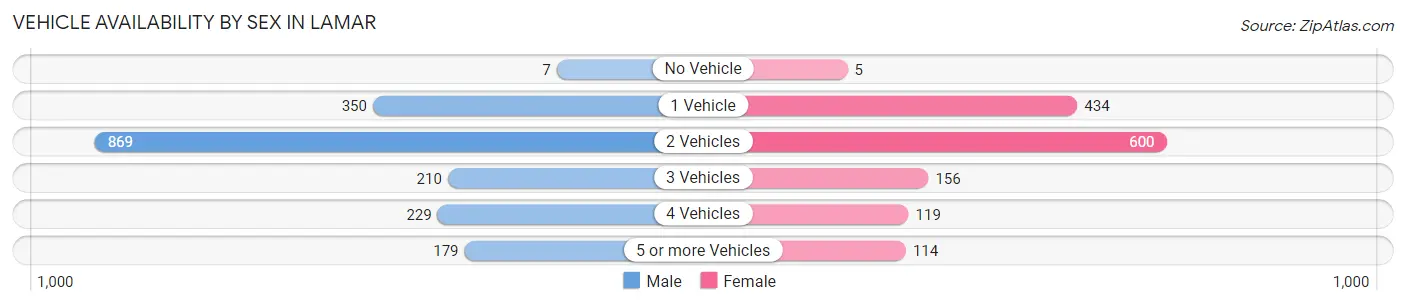
| Vehicles Available | Male | Female |
| No Vehicle | 7 (0.4%) | 5 (0.4%) |
| 1 Vehicle | 350 (19.0%) | 434 (30.4%) |
| 2 Vehicles | 869 (47.1%) | 600 (42.0%) |
| 3 Vehicles | 210 (11.4%) | 156 (10.9%) |
| 4 Vehicles | 229 (12.4%) | 119 (8.3%) |
| 5 or more Vehicles | 179 (9.7%) | 114 (8.0%) |
| Total | 1,844 (100.0%) | 1,428 (100.0%) |
Commute Time in Lamar
The most frequently occuring commute durations in Lamar are 5 to 9 minutes (1,692 commuters, 53.3%), 10 to 14 minutes (477 commuters, 15.0%), and less than 5 minutes (371 commuters, 11.7%).
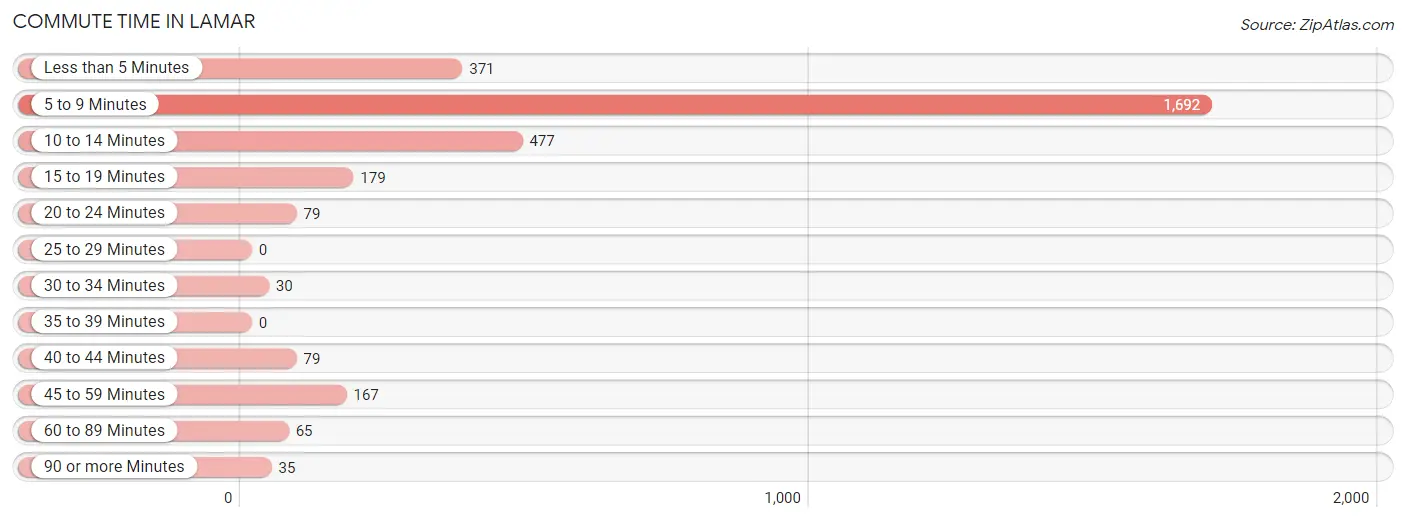
| Commute Time | # Commuters | % Commuters |
| Less than 5 Minutes | 371 | 11.7% |
| 5 to 9 Minutes | 1,692 | 53.3% |
| 10 to 14 Minutes | 477 | 15.0% |
| 15 to 19 Minutes | 179 | 5.6% |
| 20 to 24 Minutes | 79 | 2.5% |
| 25 to 29 Minutes | 0 | 0.0% |
| 30 to 34 Minutes | 30 | 0.9% |
| 35 to 39 Minutes | 0 | 0.0% |
| 40 to 44 Minutes | 79 | 2.5% |
| 45 to 59 Minutes | 167 | 5.3% |
| 60 to 89 Minutes | 65 | 2.1% |
| 90 or more Minutes | 35 | 1.1% |
Commute Time by Sex in Lamar
The most common commute times in Lamar are 5 to 9 minutes (884 commuters, 50.6%) for males and 5 to 9 minutes (808 commuters, 56.6%) for females.
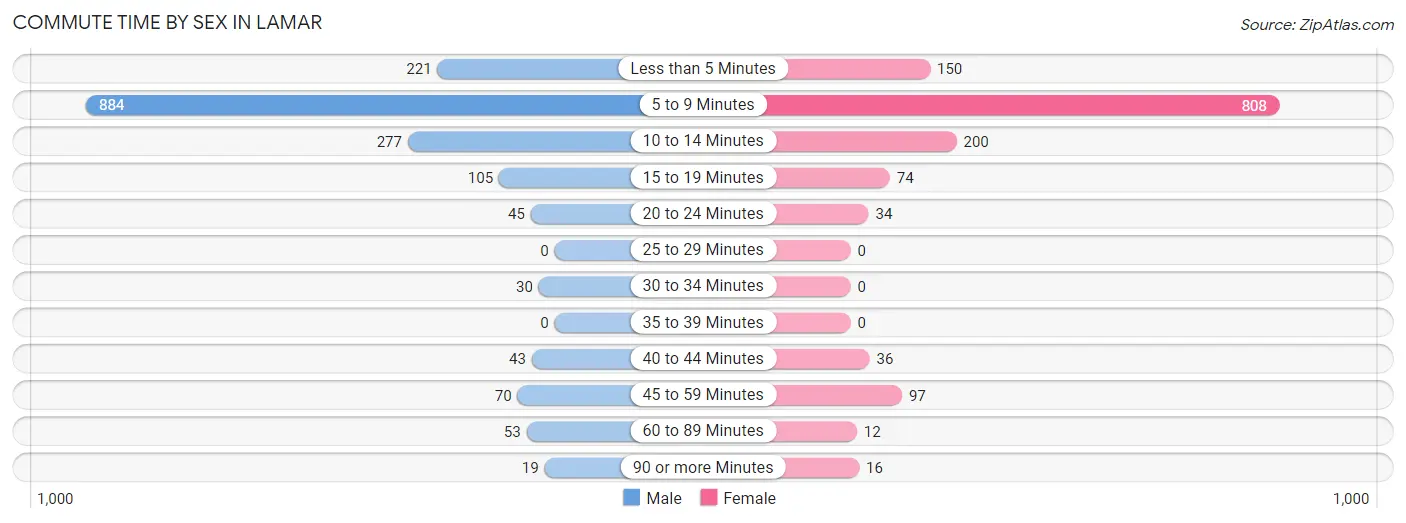
| Commute Time | Male | Female |
| Less than 5 Minutes | 221 (12.7%) | 150 (10.5%) |
| 5 to 9 Minutes | 884 (50.6%) | 808 (56.6%) |
| 10 to 14 Minutes | 277 (15.9%) | 200 (14.0%) |
| 15 to 19 Minutes | 105 (6.0%) | 74 (5.2%) |
| 20 to 24 Minutes | 45 (2.6%) | 34 (2.4%) |
| 25 to 29 Minutes | 0 (0.0%) | 0 (0.0%) |
| 30 to 34 Minutes | 30 (1.7%) | 0 (0.0%) |
| 35 to 39 Minutes | 0 (0.0%) | 0 (0.0%) |
| 40 to 44 Minutes | 43 (2.5%) | 36 (2.5%) |
| 45 to 59 Minutes | 70 (4.0%) | 97 (6.8%) |
| 60 to 89 Minutes | 53 (3.0%) | 12 (0.8%) |
| 90 or more Minutes | 19 (1.1%) | 16 (1.1%) |
Time of Departure to Work by Sex in Lamar
The most frequent times of departure to work in Lamar are 7:00 AM to 7:29 AM (229, 13.1%) for males and 8:00 AM to 8:29 AM (383, 26.8%) for females.
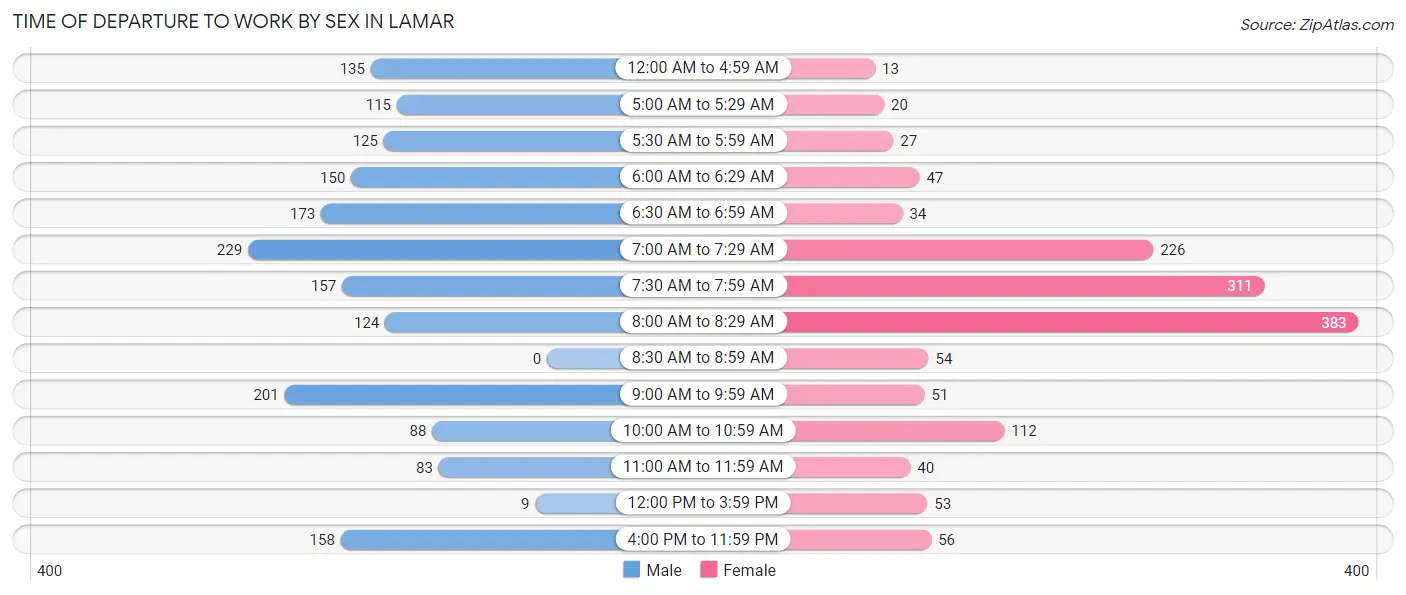
| Time of Departure | Male | Female |
| 12:00 AM to 4:59 AM | 135 (7.7%) | 13 (0.9%) |
| 5:00 AM to 5:29 AM | 115 (6.6%) | 20 (1.4%) |
| 5:30 AM to 5:59 AM | 125 (7.2%) | 27 (1.9%) |
| 6:00 AM to 6:29 AM | 150 (8.6%) | 47 (3.3%) |
| 6:30 AM to 6:59 AM | 173 (9.9%) | 34 (2.4%) |
| 7:00 AM to 7:29 AM | 229 (13.1%) | 226 (15.8%) |
| 7:30 AM to 7:59 AM | 157 (9.0%) | 311 (21.8%) |
| 8:00 AM to 8:29 AM | 124 (7.1%) | 383 (26.8%) |
| 8:30 AM to 8:59 AM | 0 (0.0%) | 54 (3.8%) |
| 9:00 AM to 9:59 AM | 201 (11.5%) | 51 (3.6%) |
| 10:00 AM to 10:59 AM | 88 (5.0%) | 112 (7.9%) |
| 11:00 AM to 11:59 AM | 83 (4.8%) | 40 (2.8%) |
| 12:00 PM to 3:59 PM | 9 (0.5%) | 53 (3.7%) |
| 4:00 PM to 11:59 PM | 158 (9.0%) | 56 (3.9%) |
| Total | 1,747 (100.0%) | 1,427 (100.0%) |
Housing Occupancy in Lamar
Occupancy by Ownership in Lamar
Of the total 2,806 dwellings in Lamar, owner-occupied units account for 1,935 (69.0%), while renter-occupied units make up 871 (31.0%).
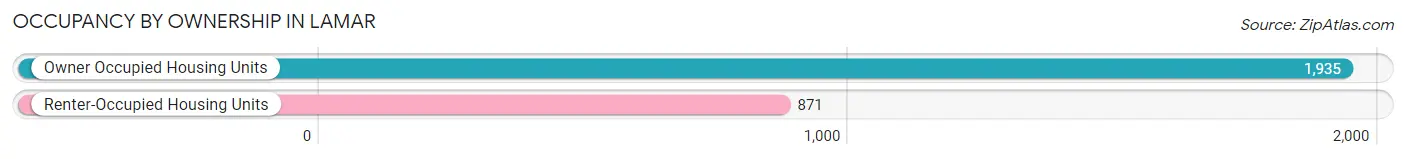
| Occupancy | # Housing Units | % Housing Units |
| Owner Occupied Housing Units | 1,935 | 69.0% |
| Renter-Occupied Housing Units | 871 | 31.0% |
| Total Occupied Housing Units | 2,806 | 100.0% |
Occupancy by Household Size in Lamar
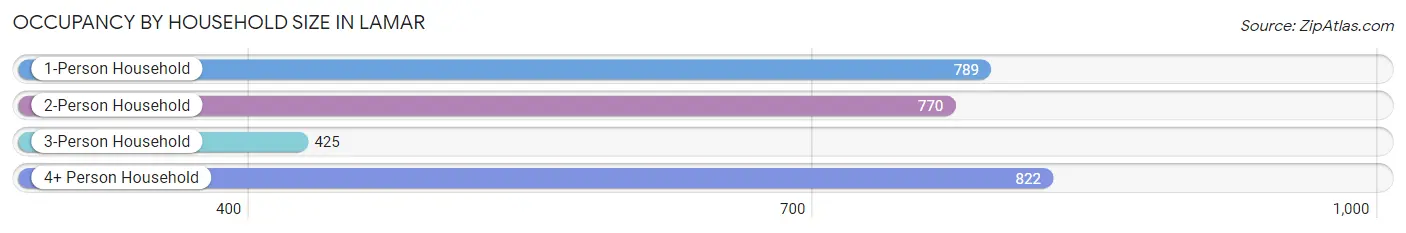
| Household Size | # Housing Units | % Housing Units |
| 1-Person Household | 789 | 28.1% |
| 2-Person Household | 770 | 27.4% |
| 3-Person Household | 425 | 15.1% |
| 4+ Person Household | 822 | 29.3% |
| Total Housing Units | 2,806 | 100.0% |
Occupancy by Ownership by Household Size in Lamar
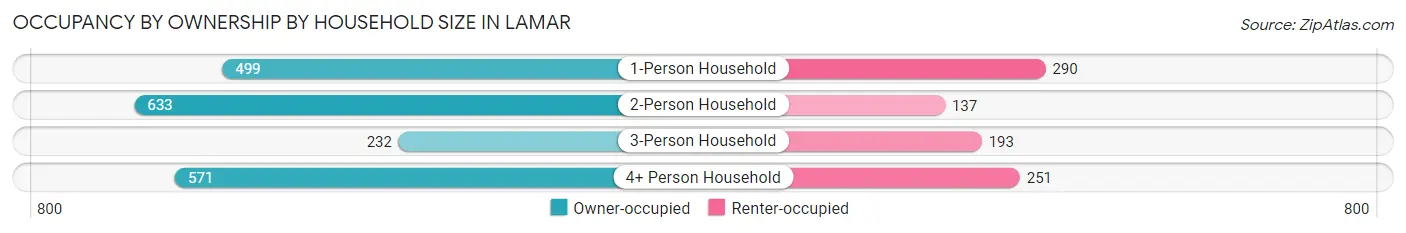
| Household Size | Owner-occupied | Renter-occupied |
| 1-Person Household | 499 (63.2%) | 290 (36.8%) |
| 2-Person Household | 633 (82.2%) | 137 (17.8%) |
| 3-Person Household | 232 (54.6%) | 193 (45.4%) |
| 4+ Person Household | 571 (69.5%) | 251 (30.5%) |
| Total Housing Units | 1,935 (69.0%) | 871 (31.0%) |
Occupancy by Educational Attainment in Lamar
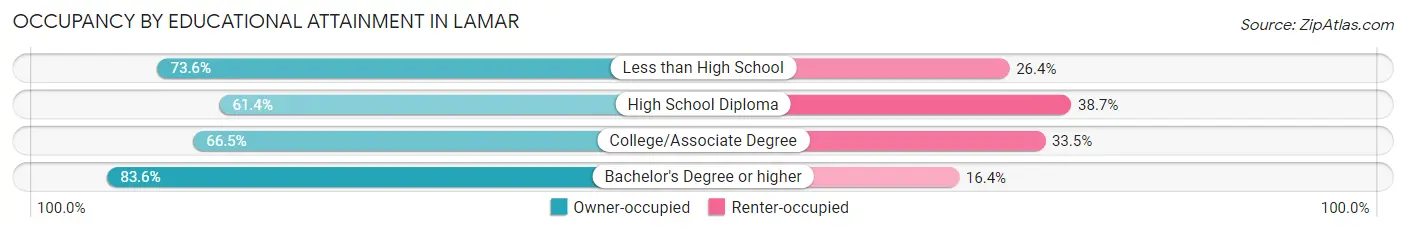
| Household Size | Owner-occupied | Renter-occupied |
| Less than High School | 226 (73.6%) | 81 (26.4%) |
| High School Diploma | 573 (61.4%) | 361 (38.7%) |
| College/Associate Degree | 672 (66.5%) | 338 (33.5%) |
| Bachelor's Degree or higher | 464 (83.6%) | 91 (16.4%) |
Occupancy by Age of Householder in Lamar
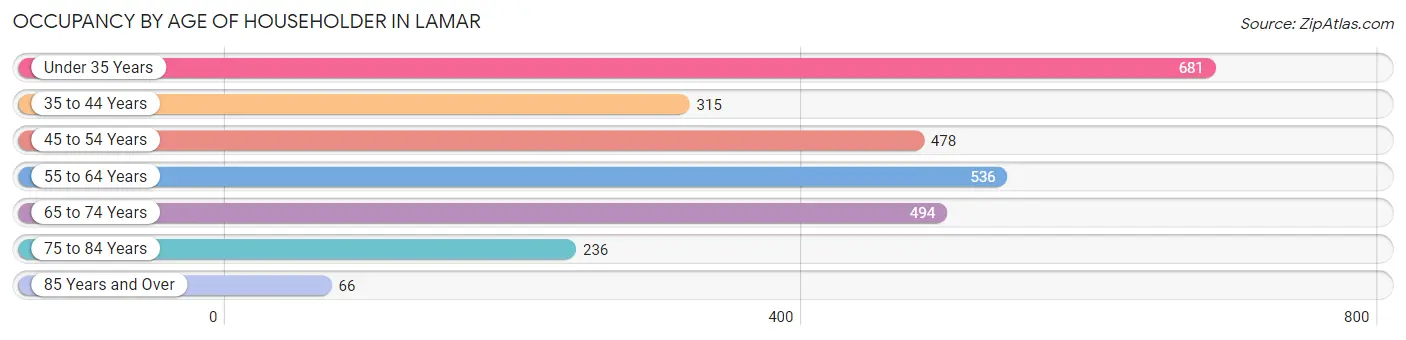
| Age Bracket | # Households | % Households |
| Under 35 Years | 681 | 24.3% |
| 35 to 44 Years | 315 | 11.2% |
| 45 to 54 Years | 478 | 17.0% |
| 55 to 64 Years | 536 | 19.1% |
| 65 to 74 Years | 494 | 17.6% |
| 75 to 84 Years | 236 | 8.4% |
| 85 Years and Over | 66 | 2.4% |
| Total | 2,806 | 100.0% |
Housing Finances in Lamar
Median Income by Occupancy in Lamar
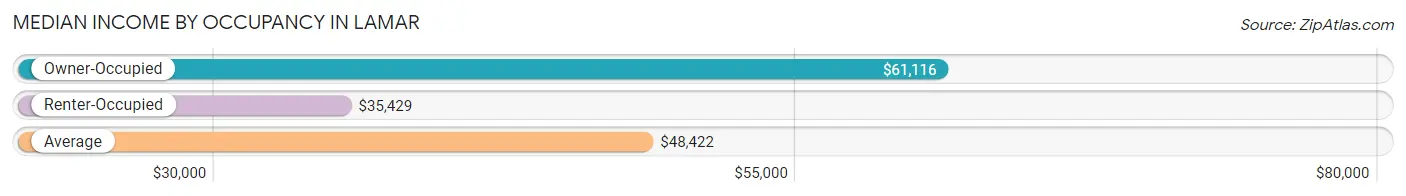
| Occupancy Type | # Households | Median Income |
| Owner-Occupied | 1,935 (69.0%) | $61,116 |
| Renter-Occupied | 871 (31.0%) | $35,429 |
| Average | 2,806 (100.0%) | $48,422 |
Occupancy by Householder Income Bracket in Lamar
| Income Bracket | Owner-occupied | Renter-occupied |
| Less than $5,000 | 48 (2.5%) | 4 (0.5%) |
| $5,000 to $9,999 | 0 (0.0%) | 117 (13.4%) |
| $10,000 to $14,999 | 175 (9.0%) | 28 (3.2%) |
| $15,000 to $19,999 | 28 (1.5%) | 26 (3.0%) |
| $20,000 to $24,999 | 106 (5.5%) | 112 (12.9%) |
| $25,000 to $34,999 | 108 (5.6%) | 108 (12.4%) |
| $35,000 to $49,999 | 292 (15.1%) | 328 (37.7%) |
| $50,000 to $74,999 | 367 (19.0%) | 31 (3.6%) |
| $75,000 to $99,999 | 335 (17.3%) | 54 (6.2%) |
| $100,000 to $149,999 | 272 (14.1%) | 59 (6.8%) |
| $150,000 or more | 204 (10.5%) | 4 (0.5%) |
| Total | 1,935 (100.0%) | 871 (100.0%) |
Monthly Housing Cost Tiers in Lamar
| Monthly Cost | Owner-occupied | Renter-occupied |
| Less than $300 | 175 (9.0%) | 123 (14.1%) |
| $300 to $499 | 364 (18.8%) | 114 (13.1%) |
| $500 to $799 | 524 (27.1%) | 168 (19.3%) |
| $800 to $999 | 243 (12.6%) | 177 (20.3%) |
| $1,000 to $1,499 | 423 (21.9%) | 227 (26.1%) |
| $1,500 to $1,999 | 149 (7.7%) | 31 (3.6%) |
| $2,000 to $2,499 | 30 (1.5%) | 0 (0.0%) |
| $2,500 to $2,999 | 27 (1.4%) | 0 (0.0%) |
| $3,000 or more | 0 (0.0%) | 26 (3.0%) |
| Total | 1,935 (100.0%) | 871 (100.0%) |
Physical Housing Characteristics in Lamar
Housing Structures in Lamar
| Structure Type | # Housing Units | % Housing Units |
| Single Unit, Detached | 1,958 | 69.8% |
| Single Unit, Attached | 100 | 3.6% |
| 2 Unit Apartments | 224 | 8.0% |
| 3 or 4 Unit Apartments | 51 | 1.8% |
| 5 to 9 Unit Apartments | 38 | 1.3% |
| 10 or more Apartments | 173 | 6.2% |
| Mobile Home / Other | 262 | 9.3% |
| Total | 2,806 | 100.0% |
Housing Structures by Occupancy in Lamar
| Structure Type | Owner-occupied | Renter-occupied |
| Single Unit, Detached | 1,688 (86.2%) | 270 (13.8%) |
| Single Unit, Attached | 100 (100.0%) | 0 (0.0%) |
| 2 Unit Apartments | 0 (0.0%) | 224 (100.0%) |
| 3 or 4 Unit Apartments | 0 (0.0%) | 51 (100.0%) |
| 5 to 9 Unit Apartments | 0 (0.0%) | 38 (100.0%) |
| 10 or more Apartments | 0 (0.0%) | 173 (100.0%) |
| Mobile Home / Other | 147 (56.1%) | 115 (43.9%) |
| Total | 1,935 (69.0%) | 871 (31.0%) |
Housing Structures by Number of Rooms in Lamar
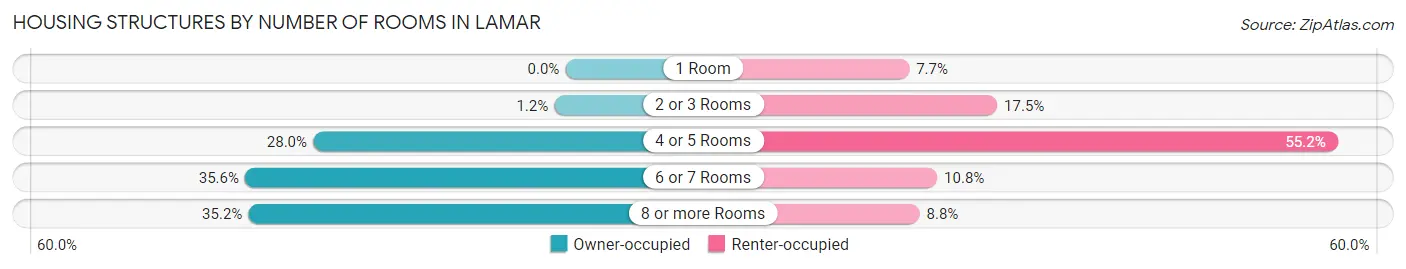
| Number of Rooms | Owner-occupied | Renter-occupied |
| 1 Room | 0 (0.0%) | 67 (7.7%) |
| 2 or 3 Rooms | 24 (1.2%) | 152 (17.4%) |
| 4 or 5 Rooms | 542 (28.0%) | 481 (55.2%) |
| 6 or 7 Rooms | 688 (35.6%) | 94 (10.8%) |
| 8 or more Rooms | 681 (35.2%) | 77 (8.8%) |
| Total | 1,935 (100.0%) | 871 (100.0%) |
Housing Structure by Heating Type in Lamar
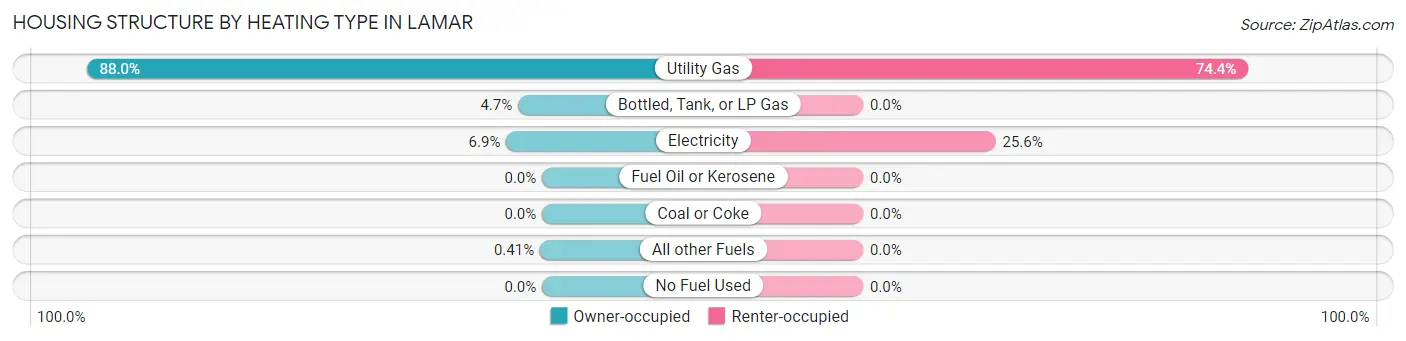
| Heating Type | Owner-occupied | Renter-occupied |
| Utility Gas | 1,703 (88.0%) | 648 (74.4%) |
| Bottled, Tank, or LP Gas | 90 (4.6%) | 0 (0.0%) |
| Electricity | 134 (6.9%) | 223 (25.6%) |
| Fuel Oil or Kerosene | 0 (0.0%) | 0 (0.0%) |
| Coal or Coke | 0 (0.0%) | 0 (0.0%) |
| All other Fuels | 8 (0.4%) | 0 (0.0%) |
| No Fuel Used | 0 (0.0%) | 0 (0.0%) |
| Total | 1,935 (100.0%) | 871 (100.0%) |
Household Vehicle Usage in Lamar
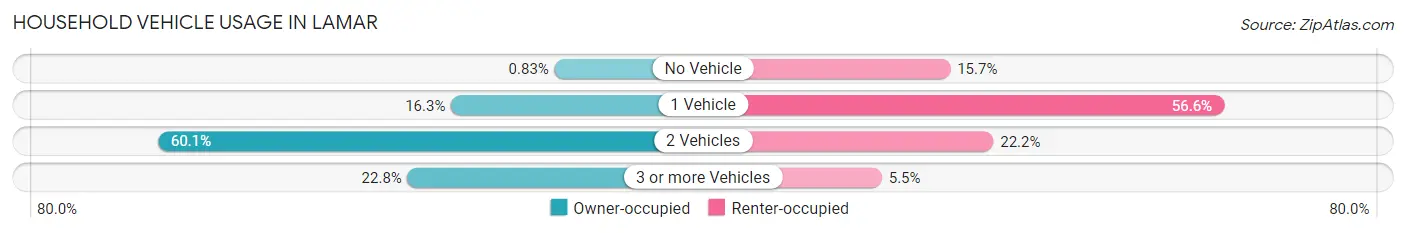
| Vehicles per Household | Owner-occupied | Renter-occupied |
| No Vehicle | 16 (0.8%) | 137 (15.7%) |
| 1 Vehicle | 315 (16.3%) | 493 (56.6%) |
| 2 Vehicles | 1,163 (60.1%) | 193 (22.2%) |
| 3 or more Vehicles | 441 (22.8%) | 48 (5.5%) |
| Total | 1,935 (100.0%) | 871 (100.0%) |
Real Estate & Mortgages in Lamar
Real Estate and Mortgage Overview in Lamar
| Characteristic | Without Mortgage | With Mortgage |
| Housing Units | 905 | 1,030 |
| Median Property Value | $90,100 | $153,600 |
| Median Household Income | $49,627 | $129 |
| Monthly Housing Costs | $456 | $0 |
| Real Estate Taxes | $310 | $54 |
Property Value by Mortgage Status in Lamar
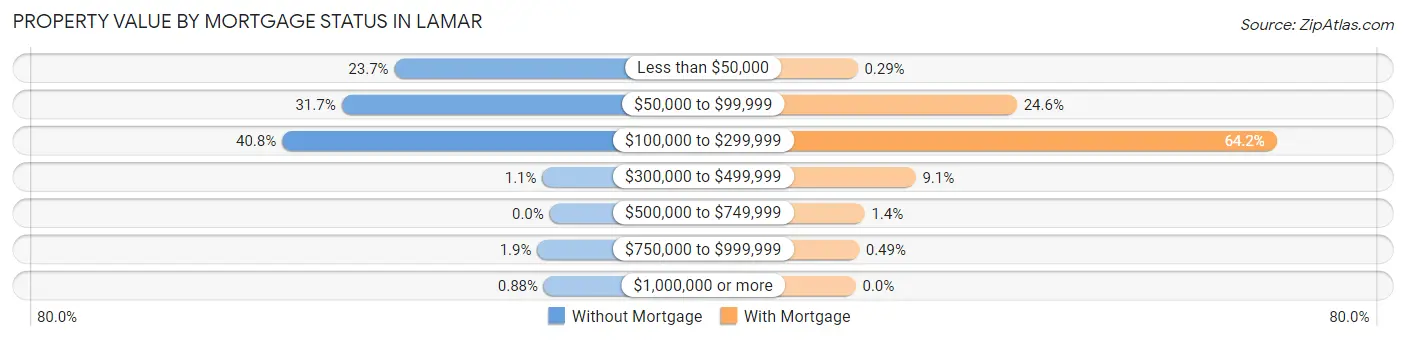
| Property Value | Without Mortgage | With Mortgage |
| Less than $50,000 | 214 (23.6%) | 3 (0.3%) |
| $50,000 to $99,999 | 287 (31.7%) | 253 (24.6%) |
| $100,000 to $299,999 | 369 (40.8%) | 661 (64.2%) |
| $300,000 to $499,999 | 10 (1.1%) | 94 (9.1%) |
| $500,000 to $749,999 | 0 (0.0%) | 14 (1.4%) |
| $750,000 to $999,999 | 17 (1.9%) | 5 (0.5%) |
| $1,000,000 or more | 8 (0.9%) | 0 (0.0%) |
| Total | 905 (100.0%) | 1,030 (100.0%) |
Household Income by Mortgage Status in Lamar
| Household Income | Without Mortgage | With Mortgage |
| Less than $10,000 | 42 (4.6%) | 0 (0.0%) |
| $10,000 to $24,999 | 201 (22.2%) | 6 (0.6%) |
| $25,000 to $34,999 | 64 (7.1%) | 108 (10.5%) |
| $35,000 to $49,999 | 157 (17.3%) | 44 (4.3%) |
| $50,000 to $74,999 | 144 (15.9%) | 135 (13.1%) |
| $75,000 to $99,999 | 212 (23.4%) | 223 (21.6%) |
| $100,000 to $149,999 | 10 (1.1%) | 123 (11.9%) |
| $150,000 or more | 75 (8.3%) | 262 (25.4%) |
| Total | 905 (100.0%) | 1,030 (100.0%) |
Property Value to Household Income Ratio in Lamar
| Value-to-Income Ratio | Without Mortgage | With Mortgage |
| Less than 2.0x | 495 (54.7%) | 74,868 (7,268.7%) |
| 2.0x to 2.9x | 103 (11.4%) | 461 (44.8%) |
| 3.0x to 3.9x | 57 (6.3%) | 328 (31.8%) |
| 4.0x or more | 244 (27.0%) | 82 (8.0%) |
| Total | 905 (100.0%) | 1,030 (100.0%) |
Real Estate Taxes by Mortgage Status in Lamar
| Property Taxes | Without Mortgage | With Mortgage |
| Less than $800 | 745 (82.3%) | 0 (0.0%) |
| $800 to $1,499 | 36 (4.0%) | 610 (59.2%) |
| $800 to $1,499 | 42 (4.6%) | 241 (23.4%) |
| Total | 905 (100.0%) | 1,030 (100.0%) |
Health & Disability in Lamar
Health Insurance Coverage by Age in Lamar
| Age Bracket | With Coverage | Without Coverage |
| Under 6 Years | 734 (100.0%) | 0 (0.0%) |
| 6 to 18 Years | 1,610 (98.5%) | 25 (1.5%) |
| 19 to 25 Years | 886 (92.9%) | 68 (7.1%) |
| 26 to 34 Years | 486 (75.2%) | 160 (24.8%) |
| 35 to 44 Years | 612 (78.8%) | 165 (21.2%) |
| 45 to 54 Years | 603 (76.1%) | 189 (23.9%) |
| 55 to 64 Years | 817 (82.9%) | 168 (17.1%) |
| 65 to 74 Years | 615 (100.0%) | 0 (0.0%) |
| 75 Years and older | 433 (100.0%) | 0 (0.0%) |
| Total | 6,796 (89.8%) | 775 (10.2%) |
Health Insurance Coverage by Citizenship Status in Lamar
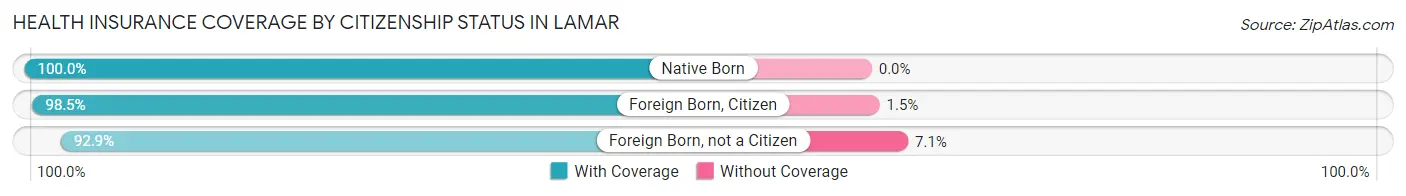
| Citizenship Status | With Coverage | Without Coverage |
| Native Born | 734 (100.0%) | 0 (0.0%) |
| Foreign Born, Citizen | 1,610 (98.5%) | 25 (1.5%) |
| Foreign Born, not a Citizen | 886 (92.9%) | 68 (7.1%) |
Health Insurance Coverage by Household Income in Lamar
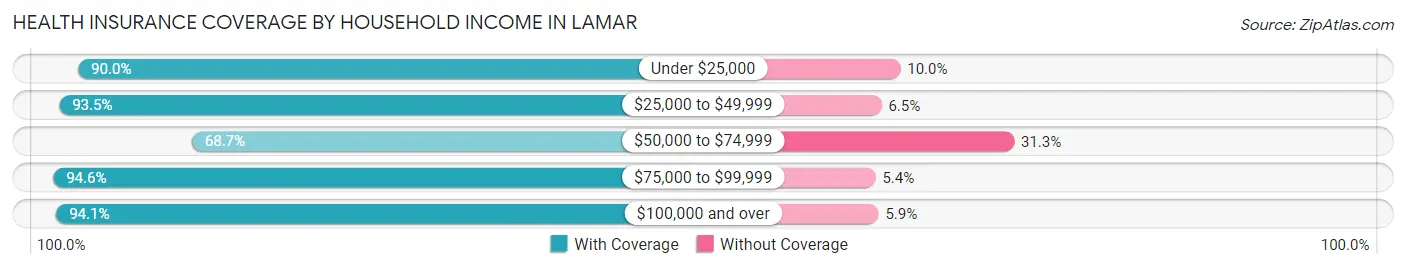
| Household Income | With Coverage | Without Coverage |
| Under $25,000 | 1,139 (90.0%) | 127 (10.0%) |
| $25,000 to $49,999 | 1,874 (93.5%) | 130 (6.5%) |
| $50,000 to $74,999 | 734 (68.7%) | 335 (31.3%) |
| $75,000 to $99,999 | 881 (94.6%) | 50 (5.4%) |
| $100,000 and over | 1,952 (94.1%) | 123 (5.9%) |
Public vs Private Health Insurance Coverage by Age in Lamar
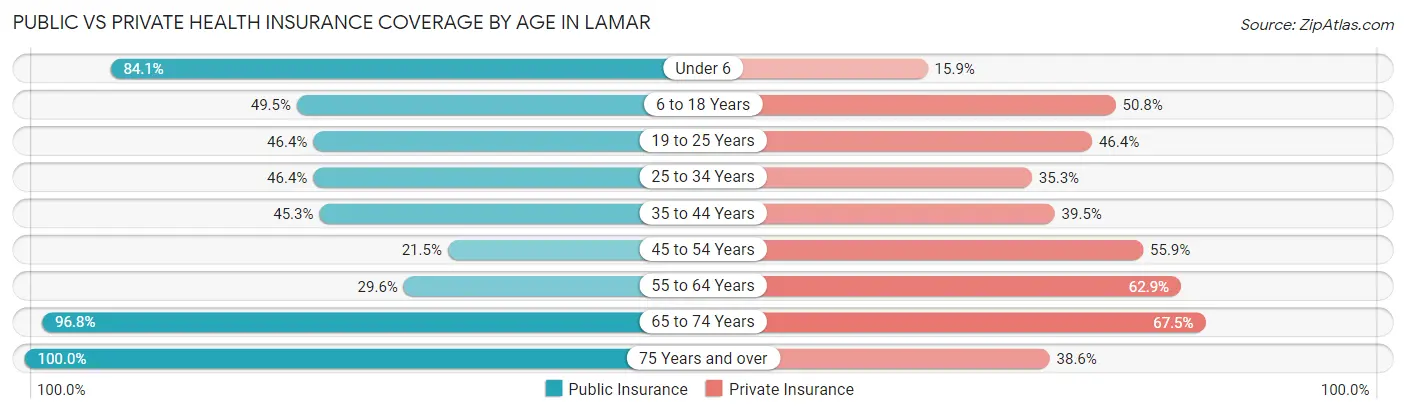
| Age Bracket | Public Insurance | Private Insurance |
| Under 6 | 617 (84.1%) | 117 (15.9%) |
| 6 to 18 Years | 809 (49.5%) | 831 (50.8%) |
| 19 to 25 Years | 443 (46.4%) | 443 (46.4%) |
| 25 to 34 Years | 300 (46.4%) | 228 (35.3%) |
| 35 to 44 Years | 352 (45.3%) | 307 (39.5%) |
| 45 to 54 Years | 170 (21.5%) | 443 (55.9%) |
| 55 to 64 Years | 292 (29.6%) | 620 (62.9%) |
| 65 to 74 Years | 595 (96.8%) | 415 (67.5%) |
| 75 Years and over | 433 (100.0%) | 167 (38.6%) |
| Total | 4,011 (53.0%) | 3,571 (47.2%) |
Disability Status by Sex by Age in Lamar
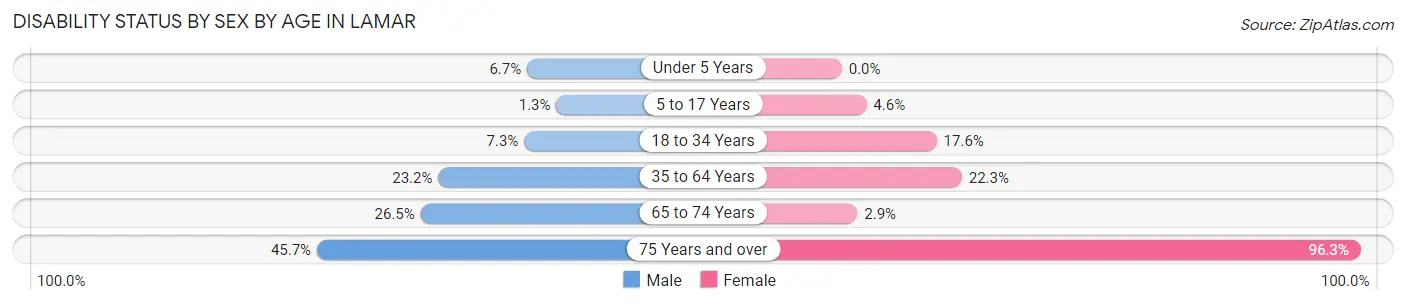
| Age Bracket | Male | Female |
| Under 5 Years | 19 (6.7%) | 0 (0.0%) |
| 5 to 17 Years | 11 (1.3%) | 31 (4.6%) |
| 18 to 34 Years | 73 (7.3%) | 156 (17.6%) |
| 35 to 64 Years | 299 (23.2%) | 282 (22.3%) |
| 65 to 74 Years | 80 (26.5%) | 9 (2.9%) |
| 75 Years and over | 86 (45.7%) | 236 (96.3%) |
Disability Class by Sex by Age in Lamar
Disability Class: Hearing Difficulty
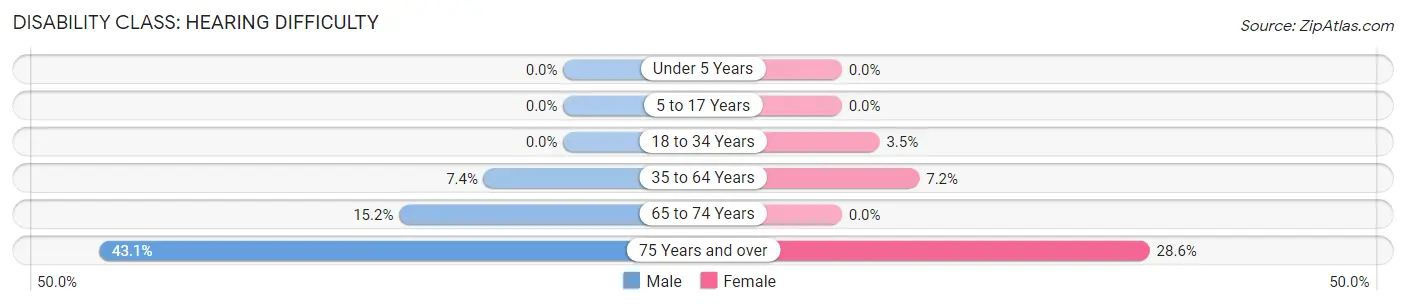
| Age Bracket | Male | Female |
| Under 5 Years | 0 (0.0%) | 0 (0.0%) |
| 5 to 17 Years | 0 (0.0%) | 0 (0.0%) |
| 18 to 34 Years | 0 (0.0%) | 31 (3.5%) |
| 35 to 64 Years | 95 (7.4%) | 91 (7.2%) |
| 65 to 74 Years | 46 (15.2%) | 0 (0.0%) |
| 75 Years and over | 81 (43.1%) | 70 (28.6%) |
Disability Class: Vision Difficulty
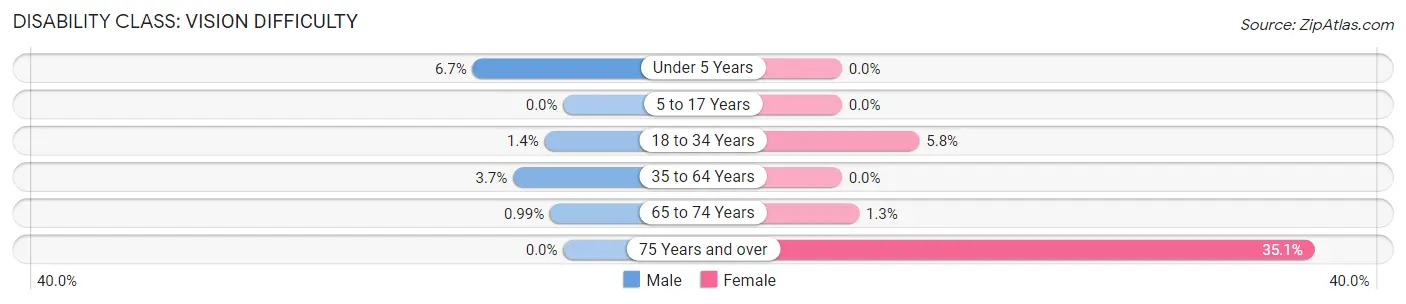
| Age Bracket | Male | Female |
| Under 5 Years | 19 (6.7%) | 0 (0.0%) |
| 5 to 17 Years | 0 (0.0%) | 0 (0.0%) |
| 18 to 34 Years | 14 (1.4%) | 51 (5.8%) |
| 35 to 64 Years | 48 (3.7%) | 0 (0.0%) |
| 65 to 74 Years | 3 (1.0%) | 4 (1.3%) |
| 75 Years and over | 0 (0.0%) | 86 (35.1%) |
Disability Class: Cognitive Difficulty
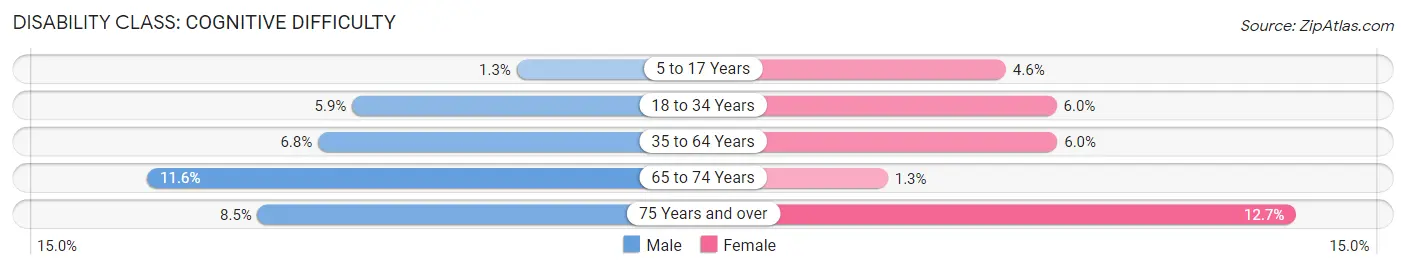
| Age Bracket | Male | Female |
| 5 to 17 Years | 11 (1.3%) | 31 (4.6%) |
| 18 to 34 Years | 59 (5.9%) | 53 (6.0%) |
| 35 to 64 Years | 88 (6.8%) | 76 (6.0%) |
| 65 to 74 Years | 35 (11.6%) | 4 (1.3%) |
| 75 Years and over | 16 (8.5%) | 31 (12.7%) |
Disability Class: Ambulatory Difficulty
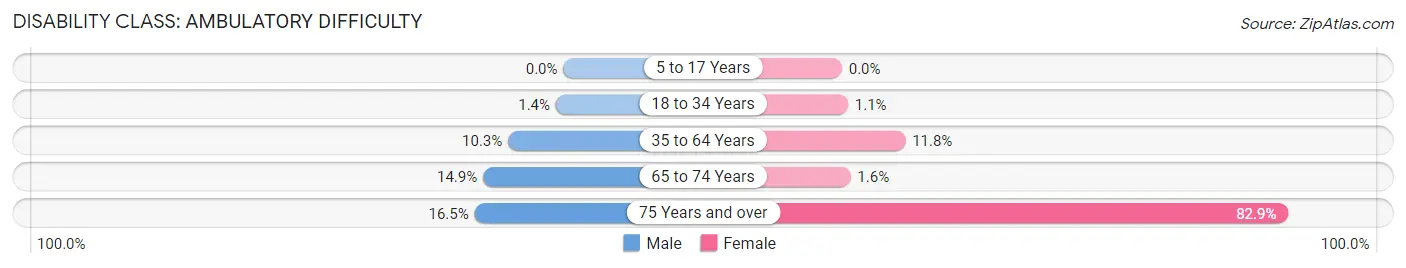
| Age Bracket | Male | Female |
| 5 to 17 Years | 0 (0.0%) | 0 (0.0%) |
| 18 to 34 Years | 14 (1.4%) | 10 (1.1%) |
| 35 to 64 Years | 132 (10.2%) | 149 (11.8%) |
| 65 to 74 Years | 45 (14.9%) | 5 (1.6%) |
| 75 Years and over | 31 (16.5%) | 203 (82.9%) |
Disability Class: Self-Care Difficulty
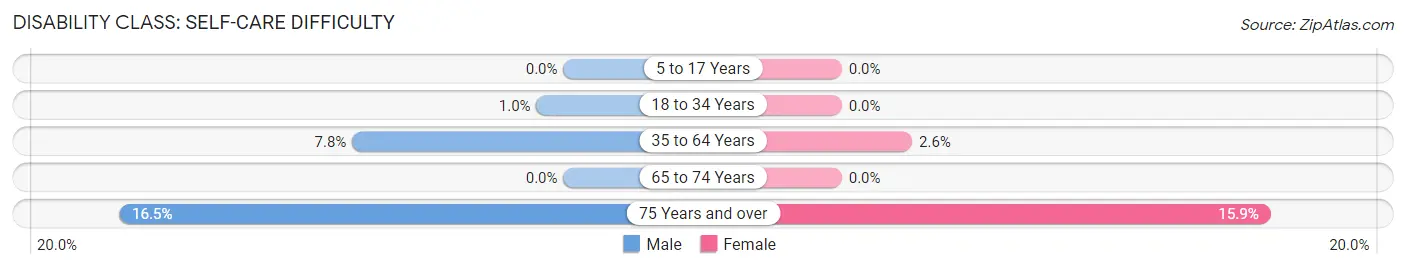
| Age Bracket | Male | Female |
| 5 to 17 Years | 0 (0.0%) | 0 (0.0%) |
| 18 to 34 Years | 10 (1.0%) | 0 (0.0%) |
| 35 to 64 Years | 101 (7.8%) | 33 (2.6%) |
| 65 to 74 Years | 0 (0.0%) | 0 (0.0%) |
| 75 Years and over | 31 (16.5%) | 39 (15.9%) |
Technology Access in Lamar
Computing Device Access in Lamar
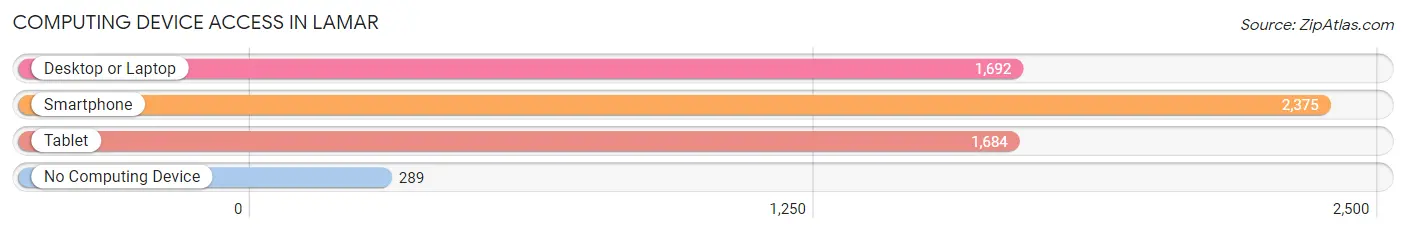
| Device Type | # Households | % Households |
| Desktop or Laptop | 1,692 | 60.3% |
| Smartphone | 2,375 | 84.6% |
| Tablet | 1,684 | 60.0% |
| No Computing Device | 289 | 10.3% |
| Total | 2,806 | 100.0% |
Internet Access in Lamar
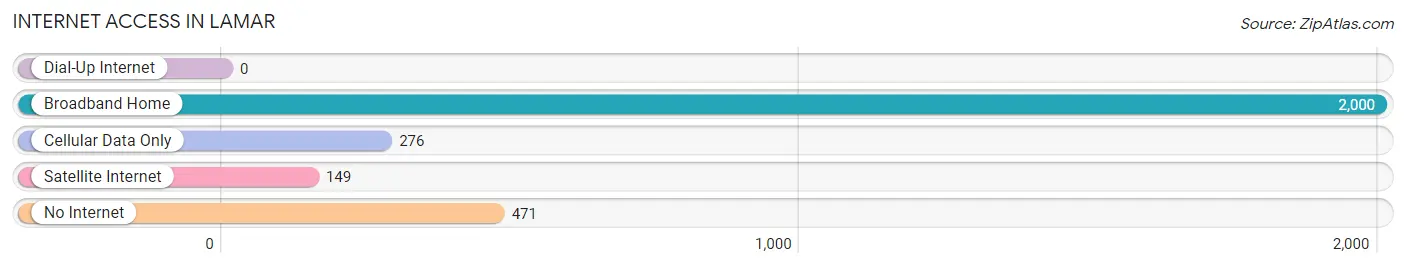
| Internet Type | # Households | % Households |
| Dial-Up Internet | 0 | 0.0% |
| Broadband Home | 2,000 | 71.3% |
| Cellular Data Only | 276 | 9.8% |
| Satellite Internet | 149 | 5.3% |
| No Internet | 471 | 16.8% |
| Total | 2,806 | 100.0% |
Lamar Summary
Lamar, Colorado is a small city located in the southeastern corner of the state, in Prowers County. It is situated on the Arkansas River, and is the county seat of Prowers County. The city has a population of 8,841 as of the 2020 census, and is the largest city in the county.
History
Lamar was founded in 1886 by the Colorado and Southern Railway. The city was named after Lucius Quintus Cincinnatus Lamar, a former United States Senator from Mississippi. The city was incorporated in 1888, and the first mayor was elected in 1889.
The city was an important stop on the Santa Fe Trail, and was a major trading center for the area. The city was also an important stop on the Atchison, Topeka and Santa Fe Railway.
Geography
Lamar is located in the southeastern corner of Colorado, in Prowers County. It is situated on the Arkansas River, and is the county seat of Prowers County. The city has a total area of 4.3 square miles, all of which is land.
The city is located in the High Plains region of Colorado, and is characterized by flat terrain and rolling hills. The climate is semi-arid, with hot summers and cold winters. The average annual precipitation is 16.5 inches.
Economy
Lamar’s economy is largely based on agriculture and energy production. The city is home to several large agricultural operations, including grain and livestock production. The city is also home to several energy production facilities, including a coal-fired power plant and a natural gas processing plant.
The city is also home to several manufacturing and service businesses, including a food processing plant, a plastics manufacturer, and a printing company. The city is also home to several retail businesses, including a grocery store, a hardware store, and several restaurants.
Demographics
As of the 2020 census, Lamar had a population of 8,841. The racial makeup of the city was 79.2% White, 0.7% African American, 0.9% Native American, 0.3% Asian, 0.1% Pacific Islander, 16.2% from other races, and 2.7% from two or more races. Hispanic or Latino of any race were 33.2% of the population.
The median income for a household in Lamar was $37,941, and the median income for a family was $45,941. The per capita income for the city was $18,941. About 16.2% of families and 20.2% of the population were below the poverty line, including 28.2% of those under age 18 and 11.2% of those age 65 or over.
Common Questions
What is Per Capita Income in Lamar?
Per Capita income in Lamar is $28,287.
What is the Median Family Income in Lamar?
Median Family Income in Lamar is $59,632.
What is the Median Household income in Lamar?
Median Household Income in Lamar is $48,422.
What is Income or Wage Gap in Lamar?
Income or Wage Gap in Lamar is 8.5%.
Women in Lamar earn 91.5 cents for every dollar earned by a man.
What is Family Income Deficit in Lamar?
Family Income Deficit in Lamar is $9,928.
Families that are below poverty line in Lamar earn $9,928 less on average than the poverty threshold level.
What is Inequality or Gini Index in Lamar?
Inequality or Gini Index in Lamar is 0.53.
What is the Total Population of Lamar?
Total Population of Lamar is 7,667.
What is the Total Male Population of Lamar?
Total Male Population of Lamar is 3,988.
What is the Total Female Population of Lamar?
Total Female Population of Lamar is 3,679.
What is the Ratio of Males per 100 Females in Lamar?
There are 108.40 Males per 100 Females in Lamar.
What is the Ratio of Females per 100 Males in Lamar?
There are 92.25 Females per 100 Males in Lamar.
What is the Median Population Age in Lamar?
Median Population Age in Lamar is 31.9 Years.
What is the Average Family Size in Lamar
Average Family Size in Lamar is 3.2 People.
What is the Average Household Size in Lamar
Average Household Size in Lamar is 2.6 People.
How Large is the Labor Force in Lamar?
There are 3,582 People in the Labor Forcein in Lamar.
What is the Percentage of People in the Labor Force in Lamar?
61.4% of People are in the Labor Force in Lamar.
What is the Unemployment Rate in Lamar?
Unemployment Rate in Lamar is 5.9%.