Florissant, CO Map & Demographics
Florissant Map
Florissant Overview
$23,598
PER CAPITA INCOME
$89,135
AVG FAMILY INCOME
0.33
INEQUALITY / GINI INDEX
173
TOTAL POPULATION
86
MALE POPULATION
87
FEMALE POPULATION
98.85
MALES / 100 FEMALES
101.16
FEMALES / 100 MALES
47.9
MEDIAN AGE
3.7
AVG FAMILY SIZE
3.0
AVG HOUSEHOLD SIZE
63
LABOR FORCE [ PEOPLE ]
46.7%
PERCENT IN LABOR FORCE
Florissant Zip Codes
Florissant Area Codes
Income in Florissant
Income Overview in Florissant
| Characteristic | Number | Measure |
| Per Capita Income | 173 | $23,598 |
| Median Family Income | 43 | $89,135 |
| Mean Family Income | 43 | $80,851 |
| Median Household Income | 58 | $0 |
| Mean Household Income | 58 | $68,529 |
| Income Deficit | 43 | $0 |
| Wage / Income Gap (%) | 173 | 0.00% |
| Wage / Income Gap ($) | 173 | 100.00¢ per $1 |
| Gini / Inequality Index | 173 | 0.33 |
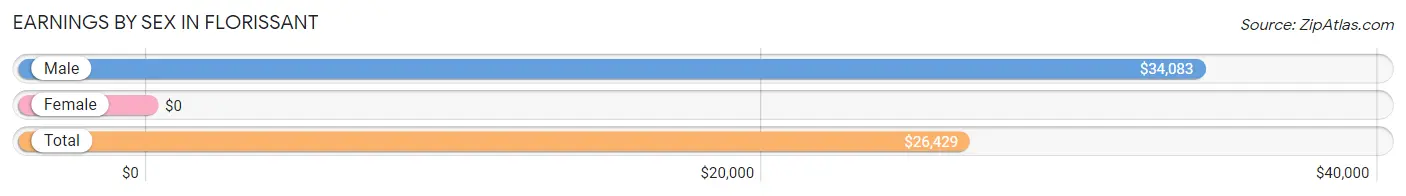
Earnings by Sex in Florissant
| Sex | Number | Average Earnings |
| Male | 33 (35.9%) | $34,083 |
| Female | 59 (64.1%) | $0 |
| Total | 92 (100.0%) | $26,429 |
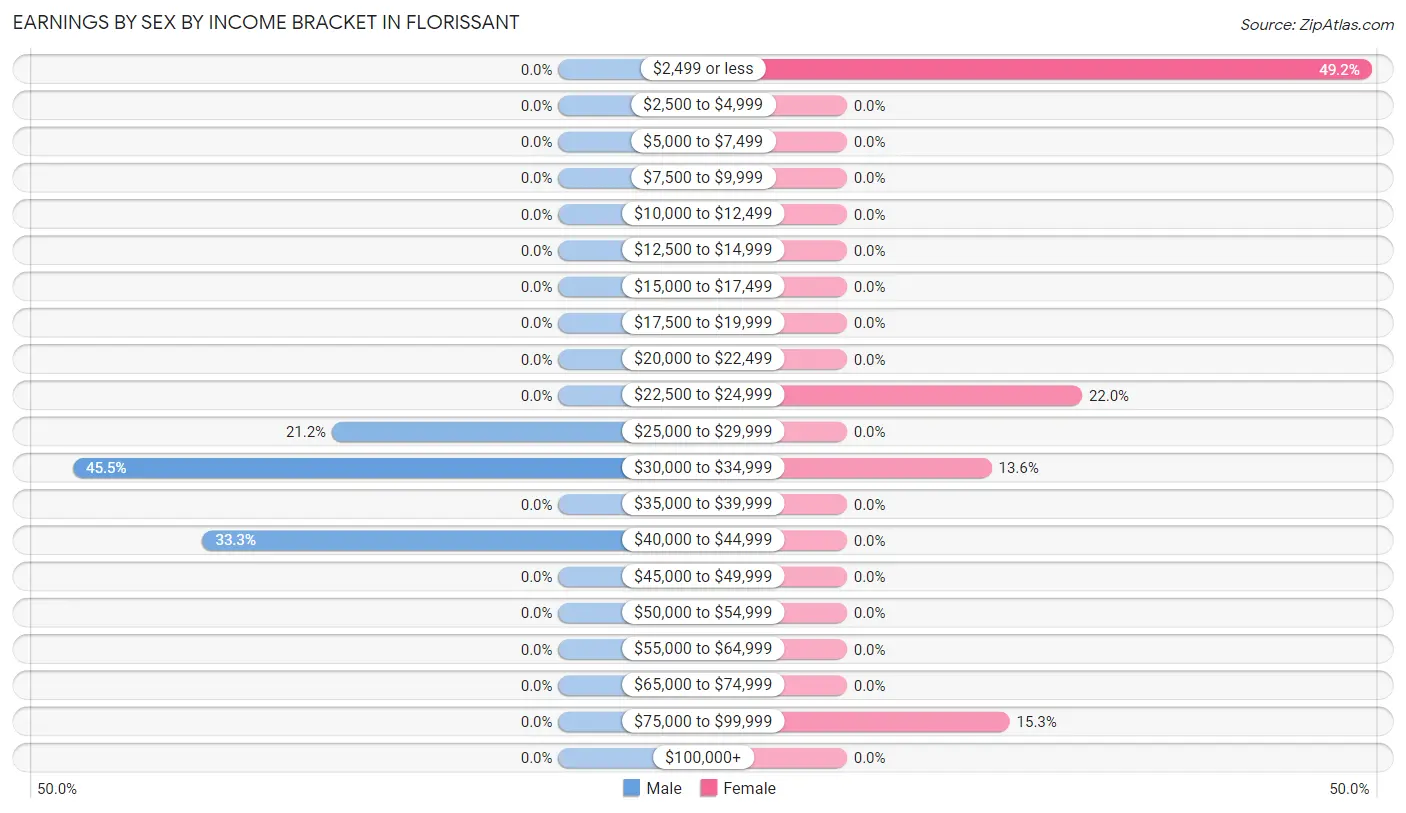
Earnings by Sex by Income Bracket in Florissant
The most common earnings brackets in Florissant are $30,000 to $34,999 for men (15 | 45.5%) and $2,499 or less for women (29 | 49.1%).
| Income | Male | Female |
| $2,499 or less | 0 (0.0%) | 29 (49.1%) |
| $2,500 to $4,999 | 0 (0.0%) | 0 (0.0%) |
| $5,000 to $7,499 | 0 (0.0%) | 0 (0.0%) |
| $7,500 to $9,999 | 0 (0.0%) | 0 (0.0%) |
| $10,000 to $12,499 | 0 (0.0%) | 0 (0.0%) |
| $12,500 to $14,999 | 0 (0.0%) | 0 (0.0%) |
| $15,000 to $17,499 | 0 (0.0%) | 0 (0.0%) |
| $17,500 to $19,999 | 0 (0.0%) | 0 (0.0%) |
| $20,000 to $22,499 | 0 (0.0%) | 0 (0.0%) |
| $22,500 to $24,999 | 0 (0.0%) | 13 (22.0%) |
| $25,000 to $29,999 | 7 (21.2%) | 0 (0.0%) |
| $30,000 to $34,999 | 15 (45.5%) | 8 (13.6%) |
| $35,000 to $39,999 | 0 (0.0%) | 0 (0.0%) |
| $40,000 to $44,999 | 11 (33.3%) | 0 (0.0%) |
| $45,000 to $49,999 | 0 (0.0%) | 0 (0.0%) |
| $50,000 to $54,999 | 0 (0.0%) | 0 (0.0%) |
| $55,000 to $64,999 | 0 (0.0%) | 0 (0.0%) |
| $65,000 to $74,999 | 0 (0.0%) | 0 (0.0%) |
| $75,000 to $99,999 | 0 (0.0%) | 9 (15.2%) |
| $100,000+ | 0 (0.0%) | 0 (0.0%) |
| Total | 33 (100.0%) | 59 (100.0%) |
Earnings by Sex by Educational Attainment in Florissant
| Educational Attainment | Male Income | Female Income |
| Less than High School | - | - |
| High School Diploma | - | - |
| College or Associate's Degree | - | - |
| Bachelor's Degree | - | - |
| Graduate Degree | - | - |
| Total | $34,083 | $0 |
Family Income in Florissant
Family Income Brackets in Florissant
According to the Florissant family income data, there are 21 families falling into the $75,000 to $99,999 income range, which is the most common income bracket and makes up 48.8% of all families.
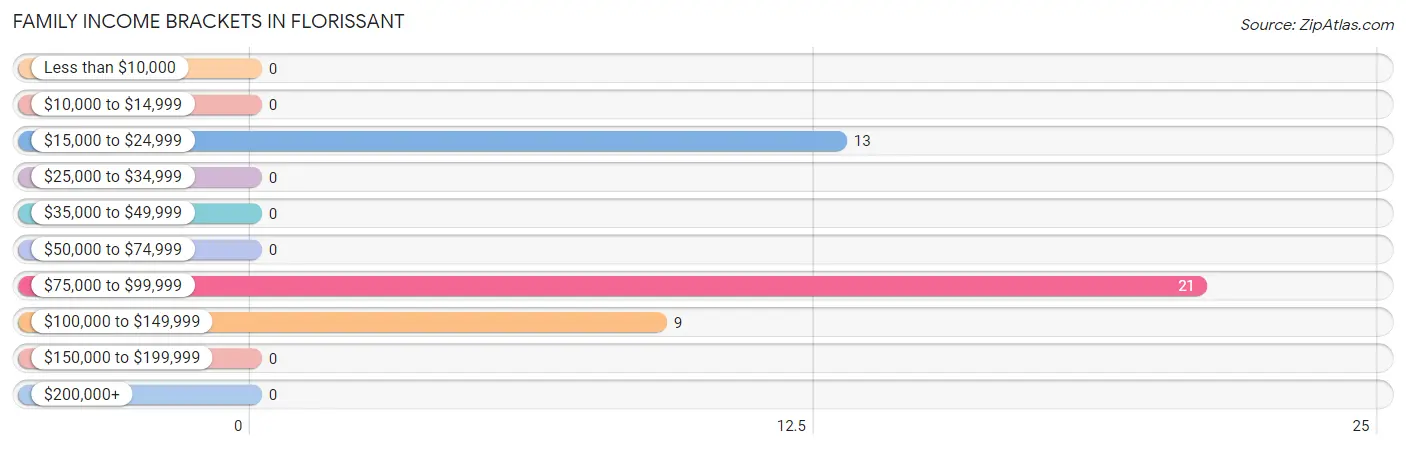
| Income Bracket | # Families | % Families |
| Less than $10,000 | 0 | 0.0% |
| $10,000 to $14,999 | 0 | 0.0% |
| $15,000 to $24,999 | 13 | 30.2% |
| $25,000 to $34,999 | 0 | 0.0% |
| $35,000 to $49,999 | 0 | 0.0% |
| $50,000 to $74,999 | 0 | 0.0% |
| $75,000 to $99,999 | 21 | 48.8% |
| $100,000 to $149,999 | 9 | 20.9% |
| $150,000 to $199,999 | 0 | 0.0% |
| $200,000+ | 0 | 0.0% |
Family Income by Famaliy Size in Florissant
| Income Bracket | # Families | Median Income |
| 2-Person Families | 13 (30.2%) | $0 |
| 3-Person Families | 13 (30.2%) | $0 |
| 4-Person Families | 9 (20.9%) | $0 |
| 5-Person Families | 8 (18.6%) | $0 |
| 6-Person Families | 0 (0.0%) | $0 |
| 7+ Person Families | 0 (0.0%) | $0 |
| Total | 43 (100.0%) | $89,135 |
Family Income by Number of Earners in Florissant
| Number of Earners | # Families | Median Income |
| No Earners | 0 (0.0%) | $0 |
| 1 Earner | 26 (60.5%) | $0 |
| 2 Earners | 8 (18.6%) | $0 |
| 3+ Earners | 9 (20.9%) | $0 |
| Total | 43 (100.0%) | $89,135 |
Household Income in Florissant
Household Income Brackets in Florissant
With 21 households falling in the category, the $75,000 to $99,999 income range is the most frequent in Florissant, accounting for 36.2% of all households.
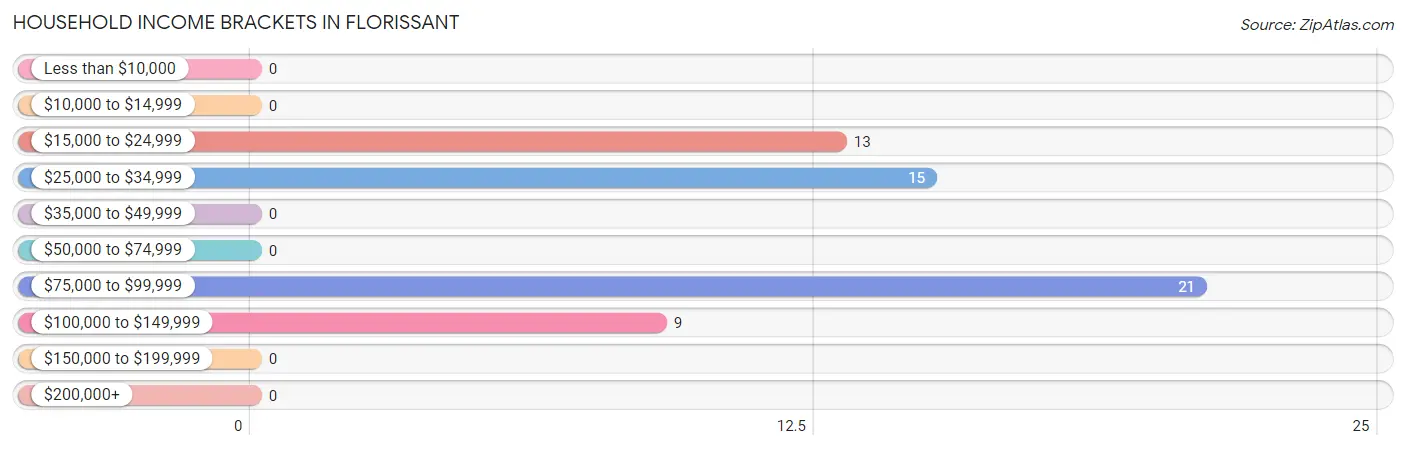
| Income Bracket | # Households | % Households |
| Less than $10,000 | 0 | 0.0% |
| $10,000 to $14,999 | 0 | 0.0% |
| $15,000 to $24,999 | 13 | 22.4% |
| $25,000 to $34,999 | 15 | 25.9% |
| $35,000 to $49,999 | 0 | 0.0% |
| $50,000 to $74,999 | 0 | 0.0% |
| $75,000 to $99,999 | 21 | 36.2% |
| $100,000 to $149,999 | 9 | 15.5% |
| $150,000 to $199,999 | 0 | 0.0% |
| $200,000+ | 0 | 0.0% |
Household Income by Householder Age in Florissant
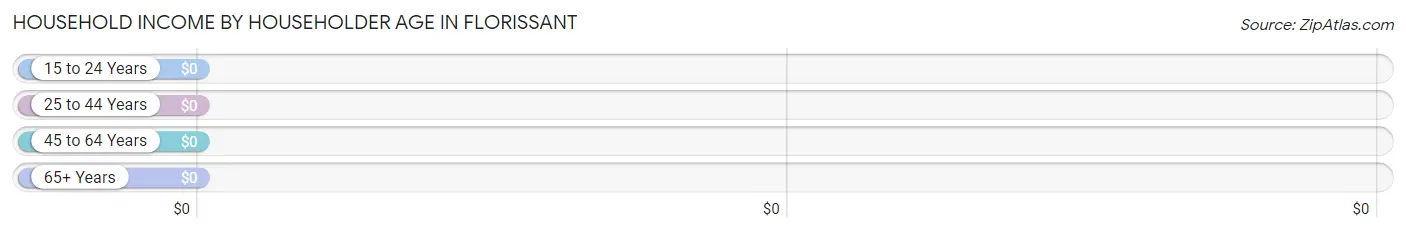
| Income Bracket | # Households | Median Income |
| 15 to 24 Years | 0 (0.0%) | $0 |
| 25 to 44 Years | 0 (0.0%) | $0 |
| 45 to 64 Years | 37 (63.8%) | $0 |
| 65+ Years | 21 (36.2%) | $0 |
| Total | 58 (100.0%) | $0 |
Poverty in Florissant
Income Below Poverty by Sex and Age in Florissant
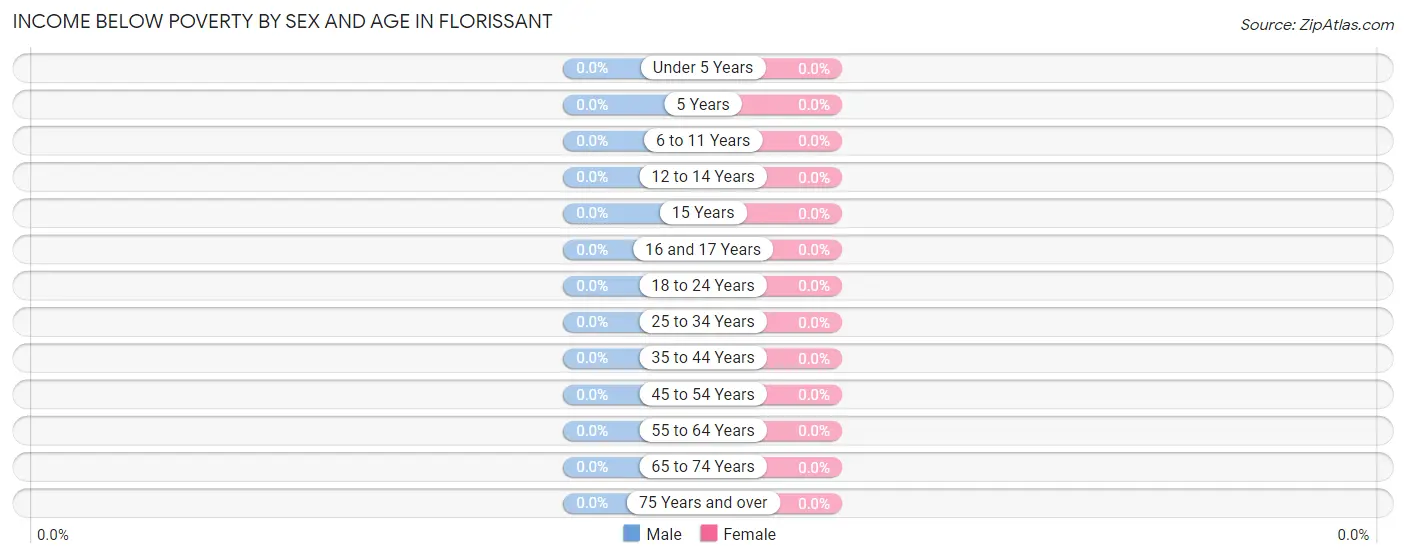
| Age Bracket | Male | Female |
| Under 5 Years | 0 (0.0%) | 0 (0.0%) |
| 5 Years | 0 (0.0%) | 0 (0.0%) |
| 6 to 11 Years | 0 (0.0%) | 0 (0.0%) |
| 12 to 14 Years | 0 (0.0%) | 0 (0.0%) |
| 15 Years | 0 (0.0%) | 0 (0.0%) |
| 16 and 17 Years | 0 (0.0%) | 0 (0.0%) |
| 18 to 24 Years | 0 (0.0%) | 0 (0.0%) |
| 25 to 34 Years | 0 (0.0%) | 0 (0.0%) |
| 35 to 44 Years | 0 (0.0%) | 0 (0.0%) |
| 45 to 54 Years | 0 (0.0%) | 0 (0.0%) |
| 55 to 64 Years | 0 (0.0%) | 0 (0.0%) |
| 65 to 74 Years | 0 (0.0%) | 0 (0.0%) |
| 75 Years and over | 0 (0.0%) | 0 (0.0%) |
| Total | 0 (0.0%) | 0 (0.0%) |
Income Above Poverty by Sex and Age in Florissant
According to the poverty statistics in Florissant, males aged 6 to 11 years and females aged 6 to 11 years are the age groups that are most secure financially, with 100.0% of males and 100.0% of females in these age groups living above the poverty line.
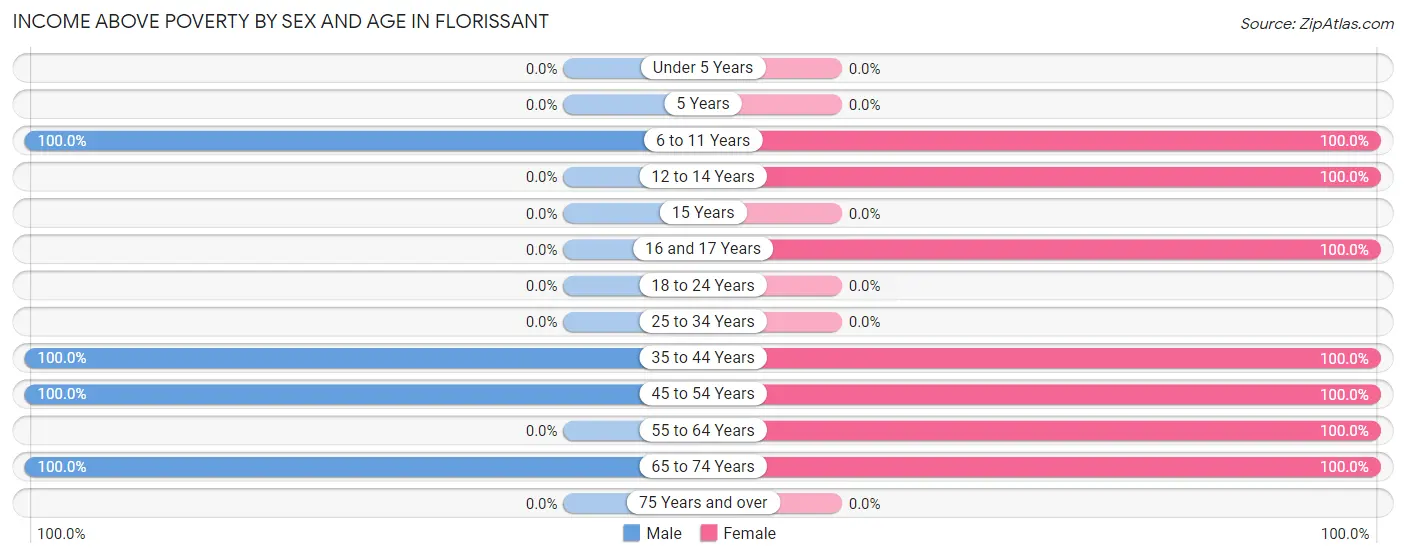
| Age Bracket | Male | Female |
| Under 5 Years | 0 (0.0%) | 0 (0.0%) |
| 5 Years | 0 (0.0%) | 0 (0.0%) |
| 6 to 11 Years | 17 (100.0%) | 10 (100.0%) |
| 12 to 14 Years | 0 (0.0%) | 11 (100.0%) |
| 15 Years | 0 (0.0%) | 0 (0.0%) |
| 16 and 17 Years | 0 (0.0%) | 16 (100.0%) |
| 18 to 24 Years | 0 (0.0%) | 0 (0.0%) |
| 25 to 34 Years | 0 (0.0%) | 0 (0.0%) |
| 35 to 44 Years | 7 (100.0%) | 8 (100.0%) |
| 45 to 54 Years | 40 (100.0%) | 22 (100.0%) |
| 55 to 64 Years | 0 (0.0%) | 7 (100.0%) |
| 65 to 74 Years | 22 (100.0%) | 13 (100.0%) |
| 75 Years and over | 0 (0.0%) | 0 (0.0%) |
| Total | 86 (100.0%) | 87 (100.0%) |
Income Below Poverty Among Married-Couple Families in Florissant
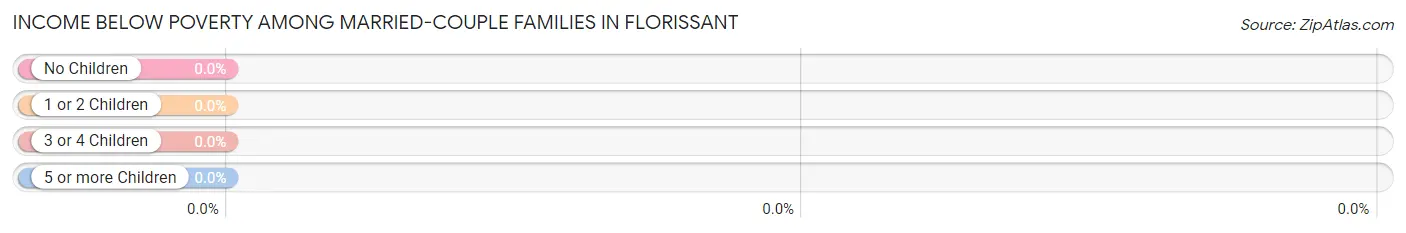
| Children | Above Poverty | Below Poverty |
| No Children | 13 (100.0%) | 0 (0.0%) |
| 1 or 2 Children | 30 (100.0%) | 0 (0.0%) |
| 3 or 4 Children | 0 (0.0%) | 0 (0.0%) |
| 5 or more Children | 0 (0.0%) | 0 (0.0%) |
| Total | 43 (100.0%) | 0 (0.0%) |
Income Below Poverty Among Single-Parent Households in Florissant
| Children | Single Father | Single Mother |
| No Children | 0 (0.0%) | 0 (0.0%) |
| 1 or 2 Children | 0 (0.0%) | 0 (0.0%) |
| 3 or 4 Children | 0 (0.0%) | 0 (0.0%) |
| 5 or more Children | 0 (0.0%) | 0 (0.0%) |
| Total | 0 (0.0%) | 0 (0.0%) |
Income Below Poverty Among Married-Couple vs Single-Parent Households in Florissant
| Children | Married-Couple Families | Single-Parent Households |
| No Children | 0 (0.0%) | 0 (0.0%) |
| 1 or 2 Children | 0 (0.0%) | 0 (0.0%) |
| 3 or 4 Children | 0 (0.0%) | 0 (0.0%) |
| 5 or more Children | 0 (0.0%) | 0 (0.0%) |
| Total | 0 (0.0%) | 0 (0.0%) |
Race in Florissant
The most populous races in Florissant are , and White / Caucasian (173 | 100.0%).
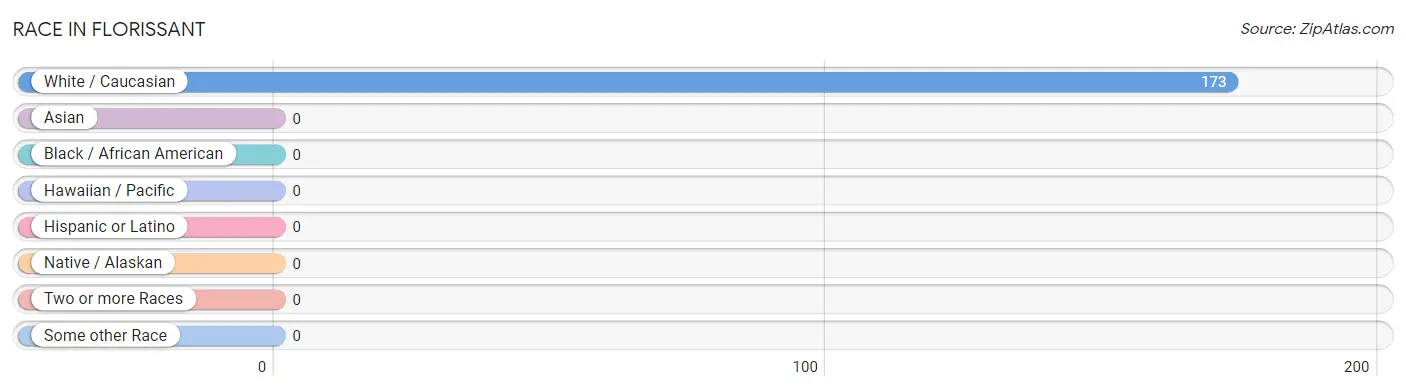
| Race | # Population | % Population |
| Asian | 0 | 0.0% |
| Black / African American | 0 | 0.0% |
| Hawaiian / Pacific | 0 | 0.0% |
| Hispanic or Latino | 0 | 0.0% |
| Native / Alaskan | 0 | 0.0% |
| White / Caucasian | 173 | 100.0% |
| Two or more Races | 0 | 0.0% |
| Some other Race | 0 | 0.0% |
| Total | 173 | 100.0% |
Ancestry in Florissant
The most populous ancestries reported in Florissant are German (53 | 30.6%), Scottish (50 | 28.9%), Scandinavian (47 | 27.2%), Czech (31 | 17.9%), and English (27 | 15.6%), together accounting for 120.2% of all Florissant residents.
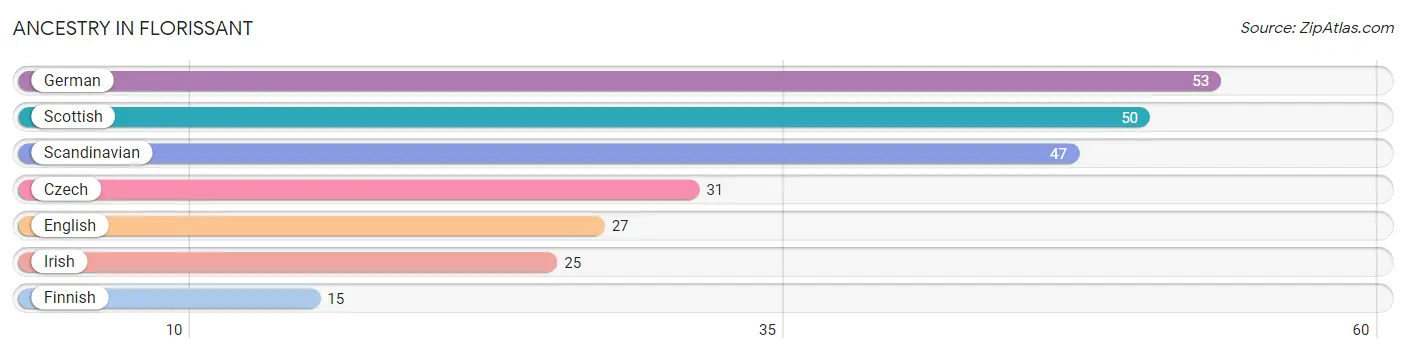
| Ancestry | # Population | % Population |
| Czech | 31 | 17.9% |
| English | 27 | 15.6% |
| Finnish | 15 | 8.7% |
| German | 53 | 30.6% |
| Irish | 25 | 14.4% |
| Scandinavian | 47 | 27.2% |
| Scottish | 50 | 28.9% | View All 7 Rows |
Immigrants in Florissant

| Immigration Origin | # Population | % Population | View All 0 Rows |
Sex and Age in Florissant
Sex and Age in Florissant
The most populous age groups in Florissant are 50 to 54 Years (29 | 33.7%) for men and 45 to 49 Years (22 | 25.3%) for women.
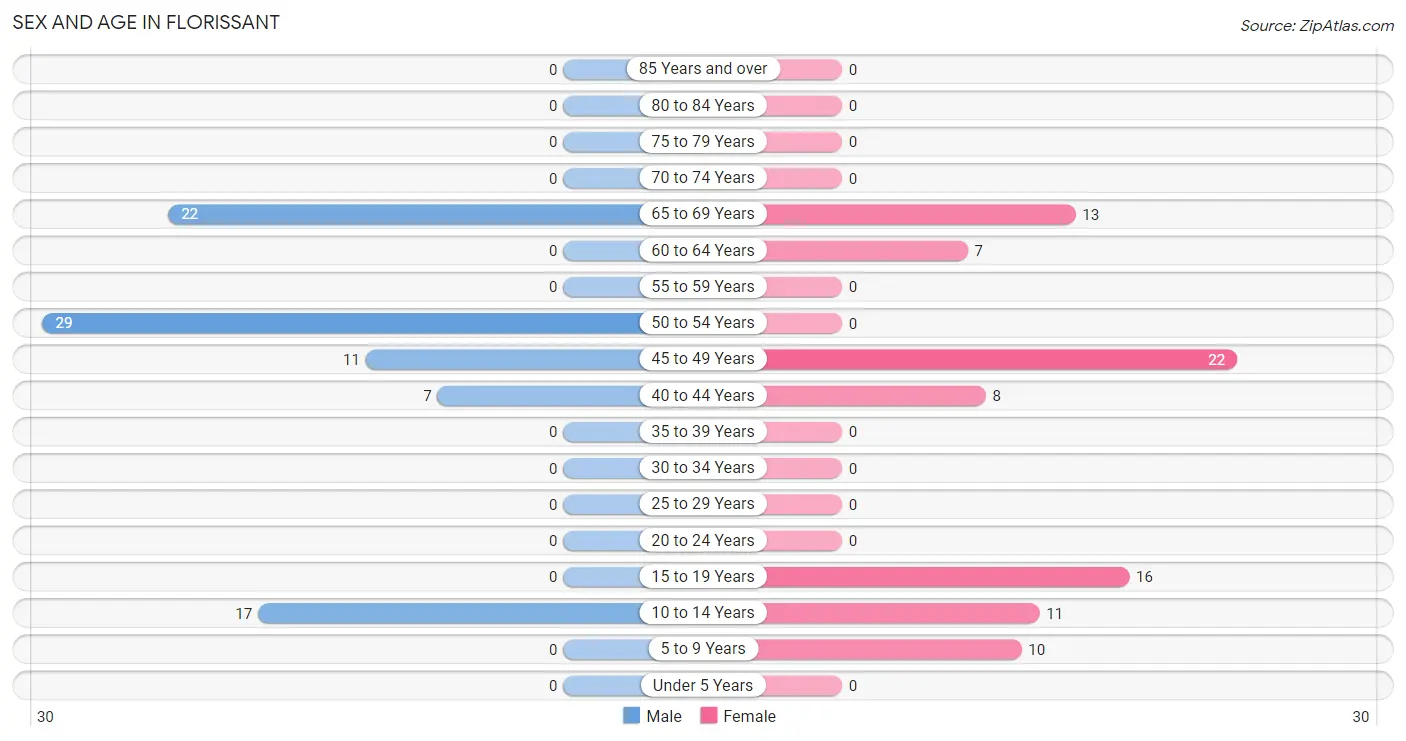
| Age Bracket | Male | Female |
| Under 5 Years | 0 (0.0%) | 0 (0.0%) |
| 5 to 9 Years | 0 (0.0%) | 10 (11.5%) |
| 10 to 14 Years | 17 (19.8%) | 11 (12.6%) |
| 15 to 19 Years | 0 (0.0%) | 16 (18.4%) |
| 20 to 24 Years | 0 (0.0%) | 0 (0.0%) |
| 25 to 29 Years | 0 (0.0%) | 0 (0.0%) |
| 30 to 34 Years | 0 (0.0%) | 0 (0.0%) |
| 35 to 39 Years | 0 (0.0%) | 0 (0.0%) |
| 40 to 44 Years | 7 (8.1%) | 8 (9.2%) |
| 45 to 49 Years | 11 (12.8%) | 22 (25.3%) |
| 50 to 54 Years | 29 (33.7%) | 0 (0.0%) |
| 55 to 59 Years | 0 (0.0%) | 0 (0.0%) |
| 60 to 64 Years | 0 (0.0%) | 7 (8.1%) |
| 65 to 69 Years | 22 (25.6%) | 13 (14.9%) |
| 70 to 74 Years | 0 (0.0%) | 0 (0.0%) |
| 75 to 79 Years | 0 (0.0%) | 0 (0.0%) |
| 80 to 84 Years | 0 (0.0%) | 0 (0.0%) |
| 85 Years and over | 0 (0.0%) | 0 (0.0%) |
| Total | 86 (100.0%) | 87 (100.0%) |
Families and Households in Florissant
Median Family Size in Florissant
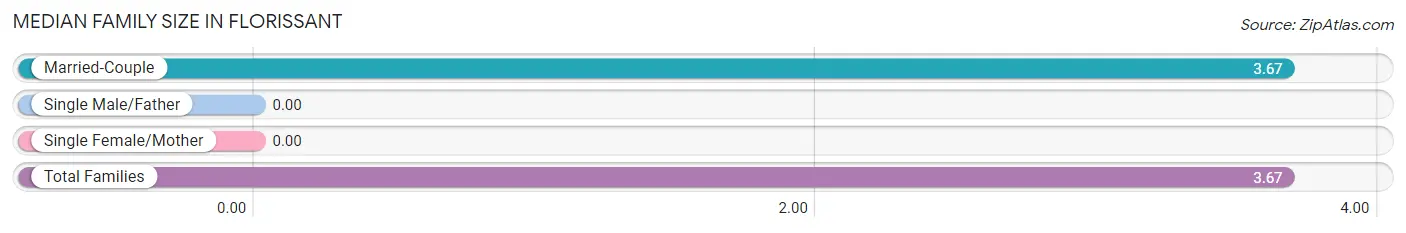
| Family Type | # Families | Family Size |
| Married-Couple | 43 (100.0%) | 3.67 |
| Single Male/Father | 0 (0.0%) | - |
| Single Female/Mother | 0 (0.0%) | - |
| Total Families | 43 (100.0%) | 3.67 |
Median Household Size in Florissant
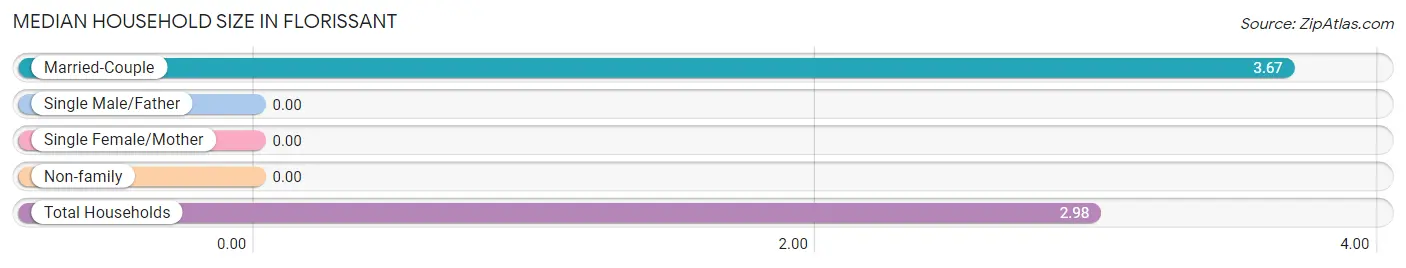
| Household Type | # Households | Household Size |
| Married-Couple | 43 (74.1%) | 3.67 |
| Single Male/Father | 0 (0.0%) | - |
| Single Female/Mother | 0 (0.0%) | - |
| Non-family | 15 (25.9%) | - |
| Total Households | 58 (100.0%) | 2.98 |
Household Size by Marriage Status in Florissant
Out of a total of 58 households in Florissant, 43 (74.1%) are family households, while 15 (25.9%) are nonfamily households. The most numerous type of family households are 2-person households, comprising 13, and the most common type of nonfamily households are 1-person households, comprising 15.
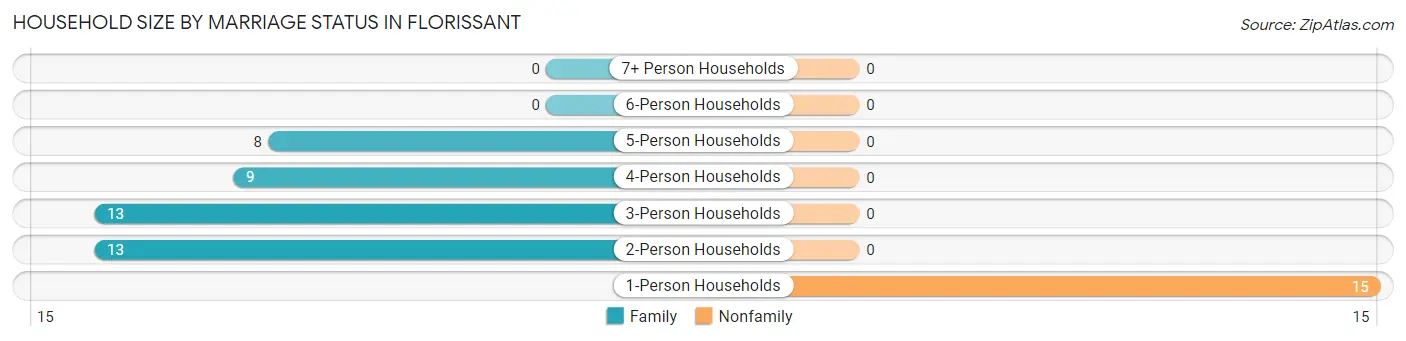
| Household Size | Family Households | Nonfamily Households |
| 1-Person Households | - | 15 (25.9%) |
| 2-Person Households | 13 (22.4%) | 0 (0.0%) |
| 3-Person Households | 13 (22.4%) | 0 (0.0%) |
| 4-Person Households | 9 (15.5%) | 0 (0.0%) |
| 5-Person Households | 8 (13.8%) | 0 (0.0%) |
| 6-Person Households | 0 (0.0%) | 0 (0.0%) |
| 7+ Person Households | 0 (0.0%) | 0 (0.0%) |
| Total | 43 (74.1%) | 15 (25.9%) |
Female Fertility in Florissant
Fertility by Age in Florissant
| Age Bracket | Women with Births | Births / 1,000 Women |
| 15 to 19 years | 0 (0.0%) | 0.0 |
| 20 to 34 years | 0 (0.0%) | 0.0 |
| 35 to 50 years | 0 (0.0%) | 0.0 |
| Total | 0 (0.0%) | 0.0 |
Fertility by Age by Marriage Status in Florissant
| Age Bracket | Married | Unmarried |
| 15 to 19 years | 0 (0.0%) | 0 (0.0%) |
| 20 to 34 years | 0 (0.0%) | 0 (0.0%) |
| 35 to 50 years | 0 (0.0%) | 0 (0.0%) |
| Total | 0 (0.0%) | 0 (0.0%) |
Fertility by Education in Florissant
| Educational Attainment | Women with Births | Births / 1,000 Women |
| Less than High School | 0 (0.0%) | 0.0 |
| High School Diploma | 0 (0.0%) | 0.0 |
| College or Associate's Degree | 0 (0.0%) | 0.0 |
| Bachelor's Degree | 0 (0.0%) | 0.0 |
| Graduate Degree | 0 (0.0%) | 0.0 |
| Total | 0 (0.0%) | 0.0 |
Fertility by Education by Marriage Status in Florissant
| Educational Attainment | Married | Unmarried |
| Less than High School | 0 (0.0%) | 0 (0.0%) |
| High School Diploma | 0 (0.0%) | 0 (0.0%) |
| College or Associate's Degree | 0 (0.0%) | 0 (0.0%) |
| Bachelor's Degree | 0 (0.0%) | 0 (0.0%) |
| Graduate Degree | 0 (0.0%) | 0 (0.0%) |
| Total | 0 (0.0%) | 0 (0.0%) |
Employment Characteristics in Florissant
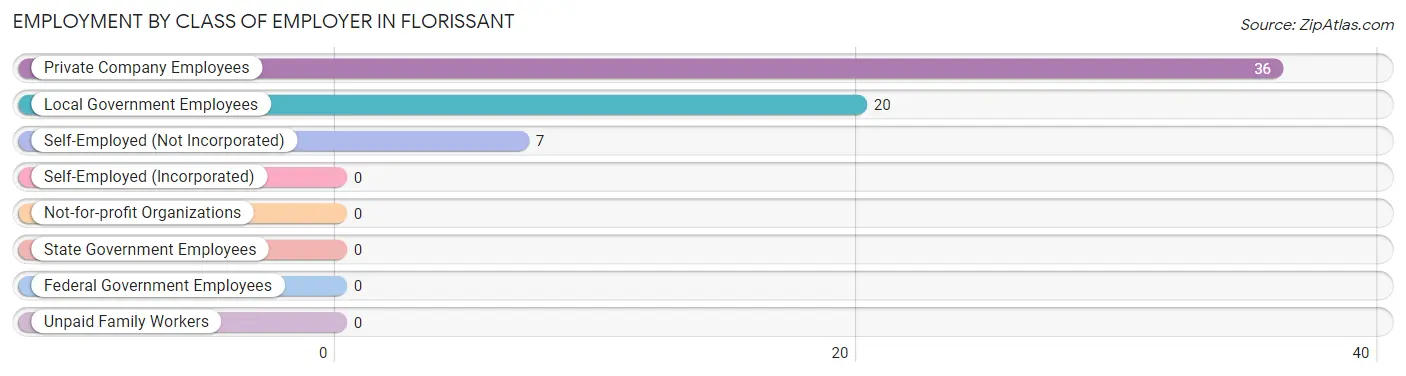
Employment by Class of Employer in Florissant
Among the 63 employed individuals in Florissant, private company employees (36 | 57.1%), local government employees (20 | 31.8%), and self-employed (not incorporated) (7 | 11.1%) make up the most common classes of employment.
| Employer Class | # Employees | % Employees |
| Private Company Employees | 36 | 57.1% |
| Self-Employed (Incorporated) | 0 | 0.0% |
| Self-Employed (Not Incorporated) | 7 | 11.1% |
| Not-for-profit Organizations | 0 | 0.0% |
| Local Government Employees | 20 | 31.8% |
| State Government Employees | 0 | 0.0% |
| Federal Government Employees | 0 | 0.0% |
| Unpaid Family Workers | 0 | 0.0% |
| Total | 63 | 100.0% |
Employment Status by Age in Florissant
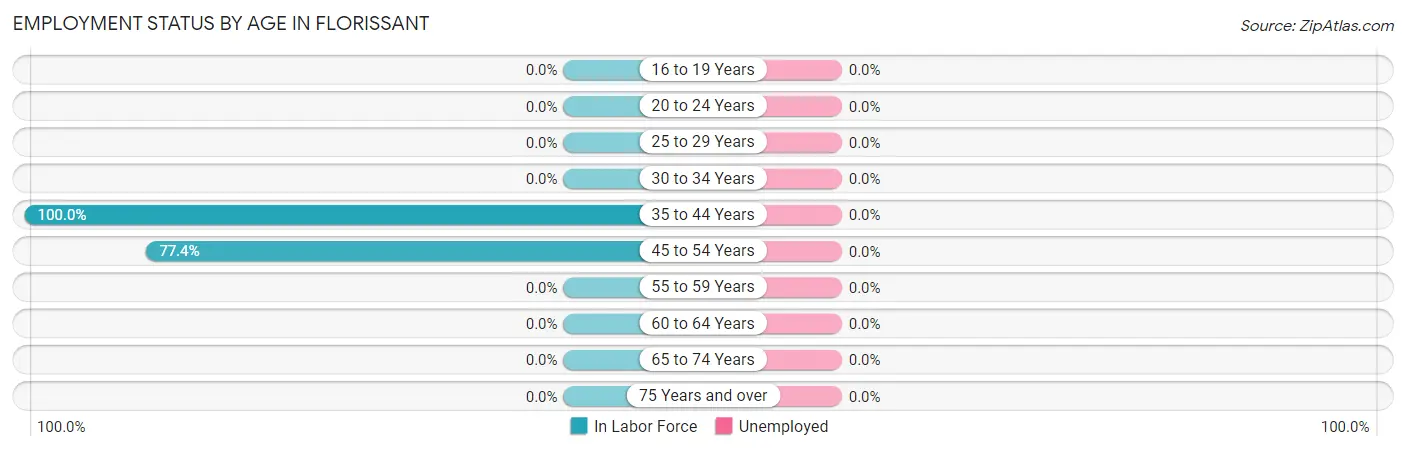
| Age Bracket | In Labor Force | Unemployed |
| 16 to 19 Years | 0 (0.0%) | 0 (0.0%) |
| 20 to 24 Years | 0 (0.0%) | 0 (0.0%) |
| 25 to 29 Years | 0 (0.0%) | 0 (0.0%) |
| 30 to 34 Years | 0 (0.0%) | 0 (0.0%) |
| 35 to 44 Years | 15 (100.0%) | 0 (0.0%) |
| 45 to 54 Years | 48 (77.4%) | 0 (0.0%) |
| 55 to 59 Years | 0 (0.0%) | 0 (0.0%) |
| 60 to 64 Years | 0 (0.0%) | 0 (0.0%) |
| 65 to 74 Years | 0 (0.0%) | 0 (0.0%) |
| 75 Years and over | 0 (0.0%) | 0 (0.0%) |
| Total | 63 (46.7%) | 0 (0.0%) |
Employment Status by Educational Attainment in Florissant
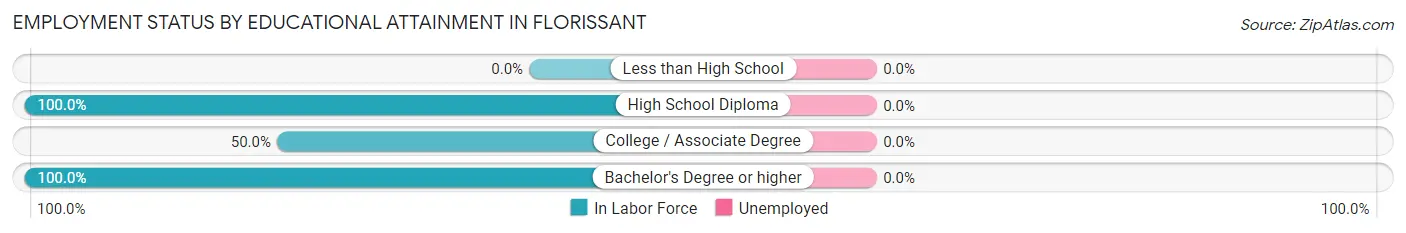
| Educational Attainment | In Labor Force | Unemployed |
| Less than High School | 0 (0.0%) | 0 (0.0%) |
| High School Diploma | 22 (100.0%) | 0 (0.0%) |
| College / Associate Degree | 21 (50.0%) | 0 (0.0%) |
| Bachelor's Degree or higher | 20 (100.0%) | 0 (0.0%) |
| Total | 63 (75.0%) | 0 (0.0%) |
Employment Occupations by Sex in Florissant
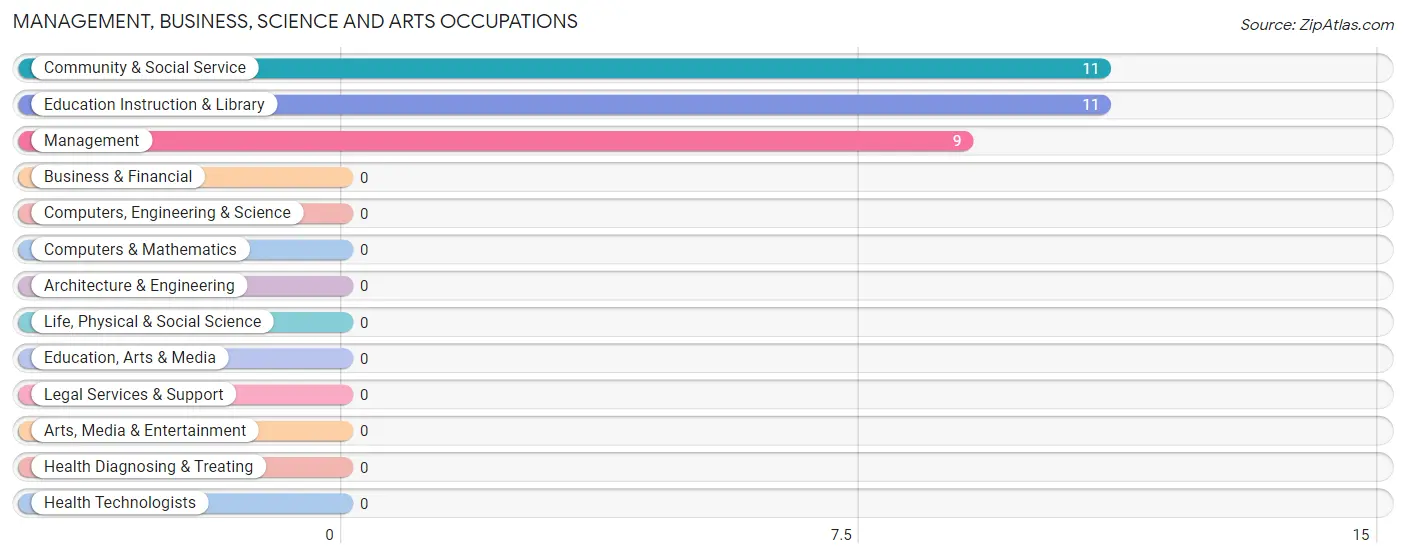
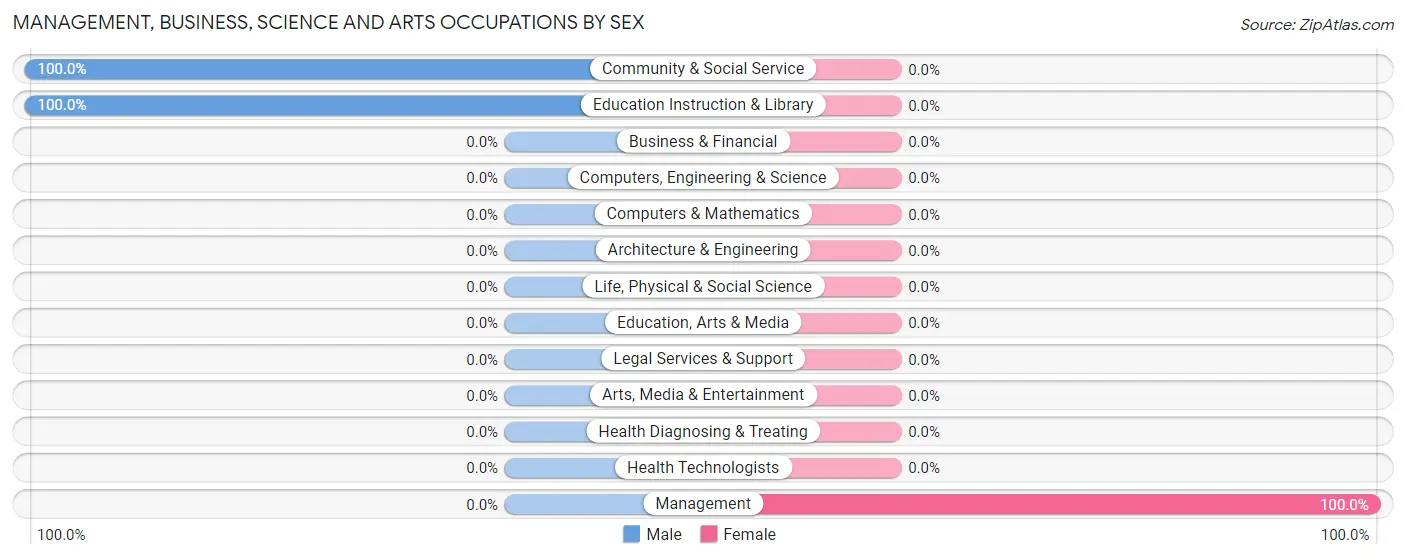
Management, Business, Science and Arts Occupations
The most common Management, Business, Science and Arts occupations in Florissant are Community & Social Service (11 | 17.5%), Education Instruction & Library (11 | 17.5%), and Management (9 | 14.3%).
Management, Business, Science and Arts Occupations by Sex
| Occupation | Male | Female |
| Management | 0 (0.0%) | 9 (100.0%) |
| Business & Financial | 0 (0.0%) | 0 (0.0%) |
| Computers, Engineering & Science | 0 (0.0%) | 0 (0.0%) |
| Computers & Mathematics | 0 (0.0%) | 0 (0.0%) |
| Architecture & Engineering | 0 (0.0%) | 0 (0.0%) |
| Life, Physical & Social Science | 0 (0.0%) | 0 (0.0%) |
| Community & Social Service | 11 (100.0%) | 0 (0.0%) |
| Education, Arts & Media | 0 (0.0%) | 0 (0.0%) |
| Legal Services & Support | 0 (0.0%) | 0 (0.0%) |
| Education Instruction & Library | 11 (100.0%) | 0 (0.0%) |
| Arts, Media & Entertainment | 0 (0.0%) | 0 (0.0%) |
| Health Diagnosing & Treating | 0 (0.0%) | 0 (0.0%) |
| Health Technologists | 0 (0.0%) | 0 (0.0%) |
| Total (Category) | 11 (55.0%) | 9 (45.0%) |
| Total (Overall) | 33 (52.4%) | 30 (47.6%) |
Services Occupations
The most common Services occupations in Florissant are , and Food Preparation & Serving (13 | 20.6%).
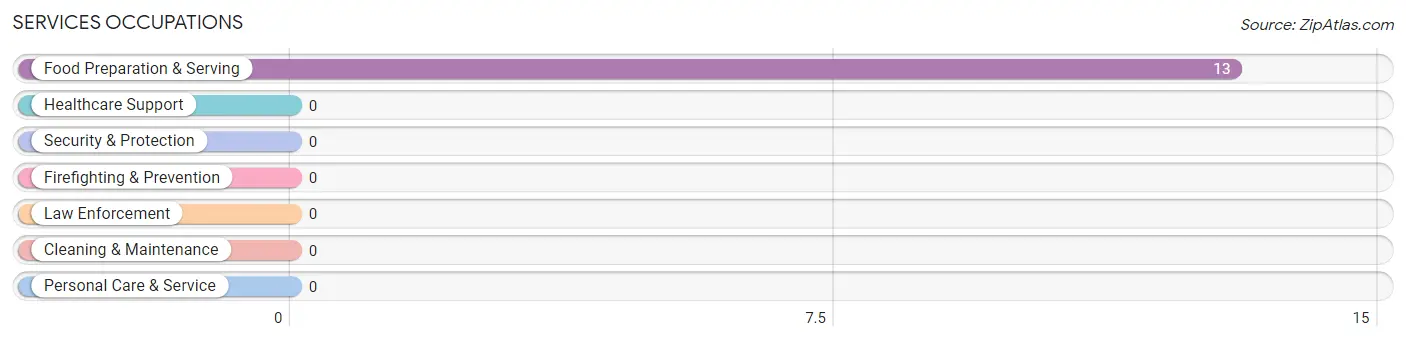
Services Occupations by Sex
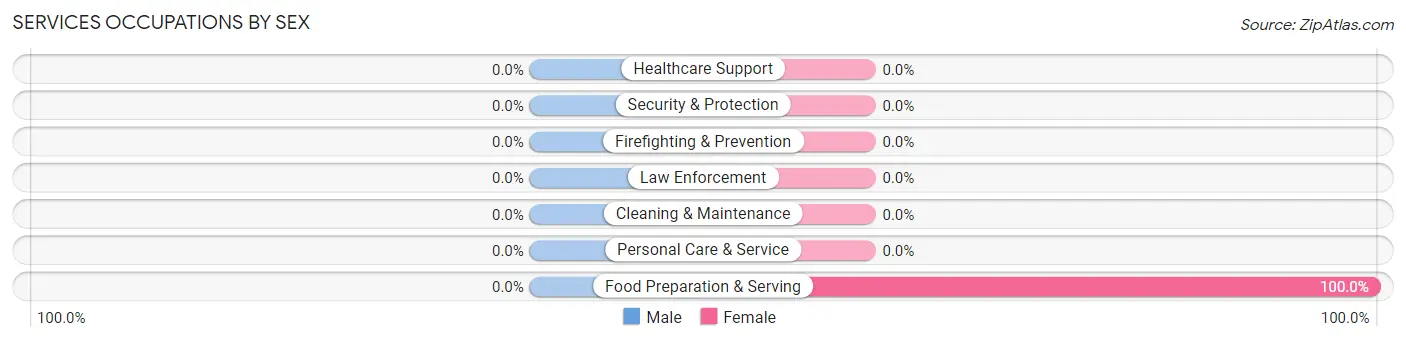
| Occupation | Male | Female |
| Healthcare Support | 0 (0.0%) | 0 (0.0%) |
| Security & Protection | 0 (0.0%) | 0 (0.0%) |
| Firefighting & Prevention | 0 (0.0%) | 0 (0.0%) |
| Law Enforcement | 0 (0.0%) | 0 (0.0%) |
| Food Preparation & Serving | 0 (0.0%) | 13 (100.0%) |
| Cleaning & Maintenance | 0 (0.0%) | 0 (0.0%) |
| Personal Care & Service | 0 (0.0%) | 0 (0.0%) |
| Total (Category) | 0 (0.0%) | 13 (100.0%) |
| Total (Overall) | 33 (52.4%) | 30 (47.6%) |
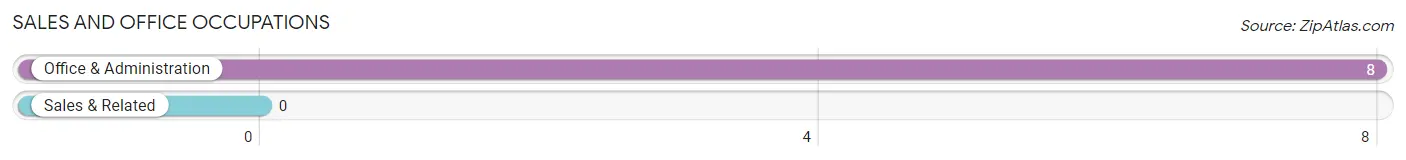
Sales and Office Occupations
The most common Sales and Office occupations in Florissant are , and Office & Administration (8 | 12.7%).
Sales and Office Occupations by Sex
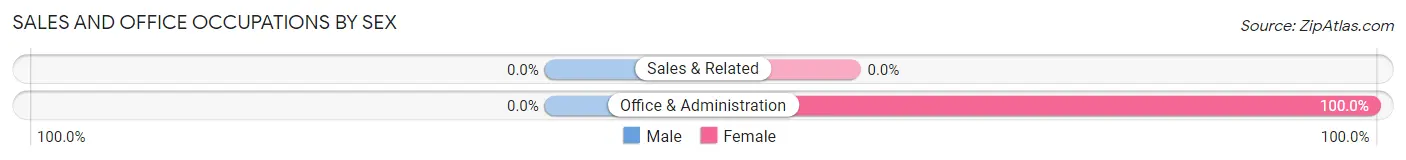
| Occupation | Male | Female |
| Sales & Related | 0 (0.0%) | 0 (0.0%) |
| Office & Administration | 0 (0.0%) | 8 (100.0%) |
| Total (Category) | 0 (0.0%) | 8 (100.0%) |
| Total (Overall) | 33 (52.4%) | 30 (47.6%) |
Natural Resources, Construction and Maintenance Occupations
The most common Natural Resources, Construction and Maintenance occupations in Florissant are Installation, Maintenance & Repair (15 | 23.8%), and Construction & Extraction (7 | 11.1%).
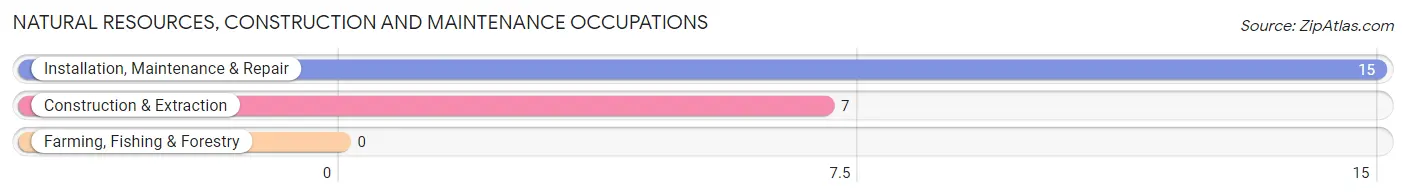
Natural Resources, Construction and Maintenance Occupations by Sex
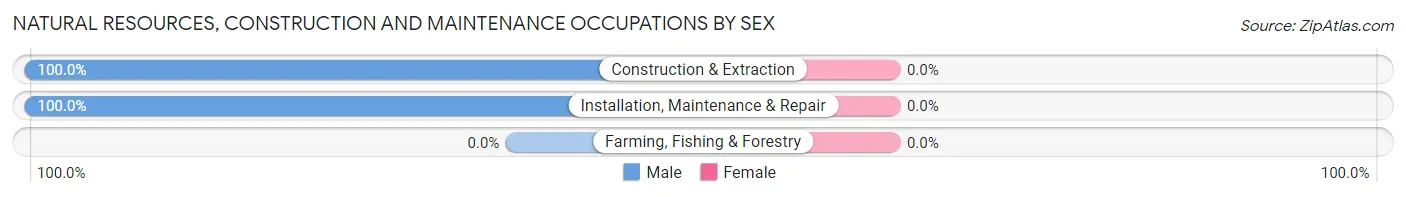
| Occupation | Male | Female |
| Farming, Fishing & Forestry | 0 (0.0%) | 0 (0.0%) |
| Construction & Extraction | 7 (100.0%) | 0 (0.0%) |
| Installation, Maintenance & Repair | 15 (100.0%) | 0 (0.0%) |
| Total (Category) | 22 (100.0%) | 0 (0.0%) |
| Total (Overall) | 33 (52.4%) | 30 (47.6%) |
Production, Transportation and Moving Occupations
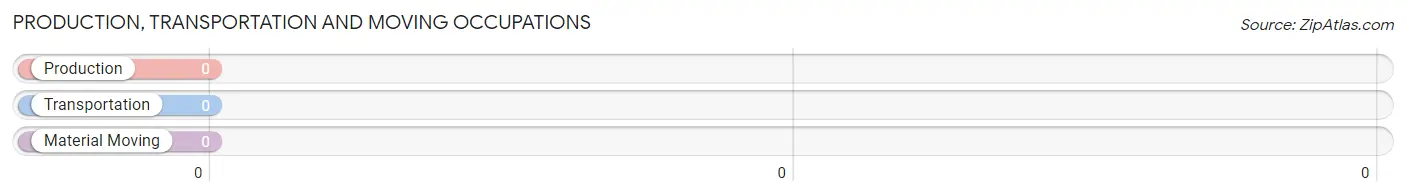
Production, Transportation and Moving Occupations by Sex
| Occupation | Male | Female |
| Production | 0 (0.0%) | 0 (0.0%) |
| Transportation | 0 (0.0%) | 0 (0.0%) |
| Material Moving | 0 (0.0%) | 0 (0.0%) |
| Total (Category) | 0 (0.0%) | 0 (0.0%) |
| Total (Overall) | 33 (52.4%) | 30 (47.6%) |
Employment Industries by Sex in Florissant
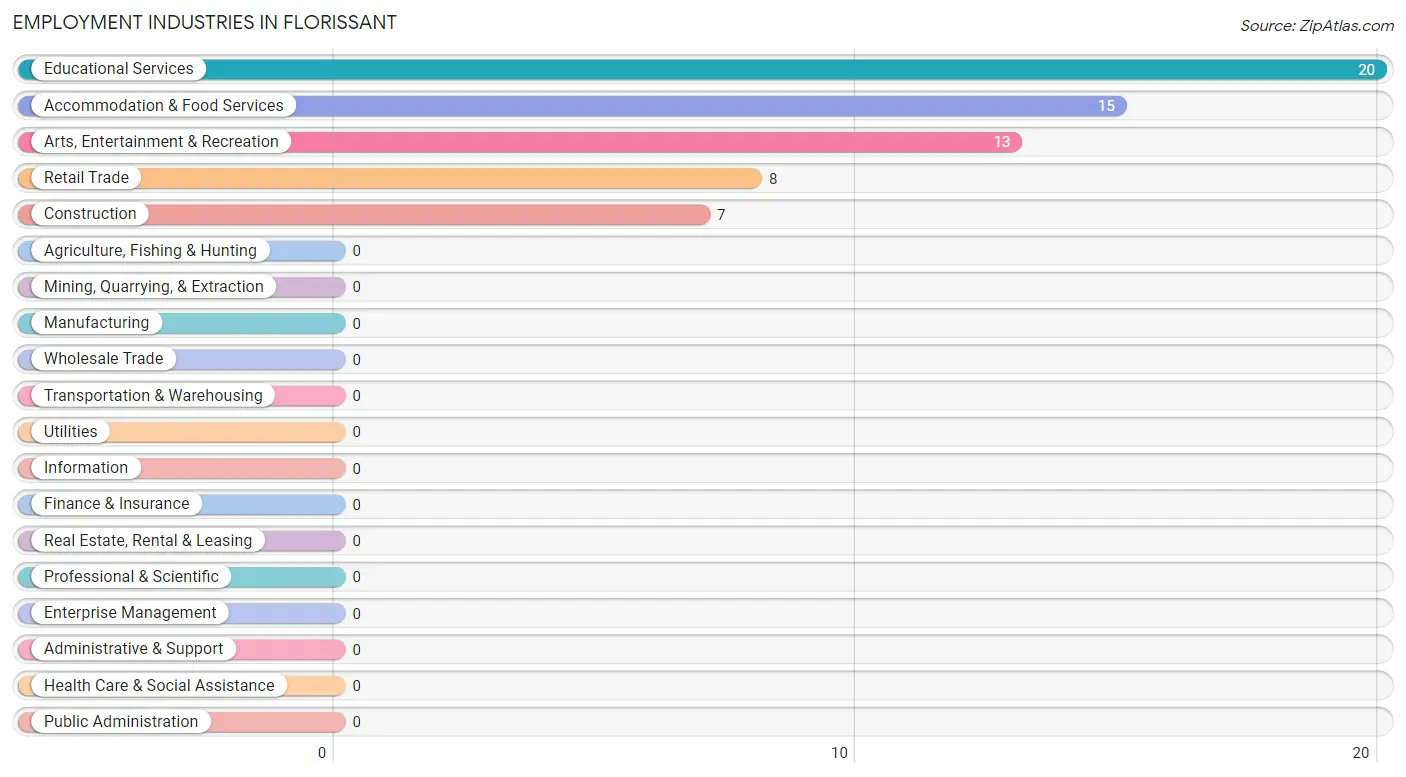
Employment Industries in Florissant
The major employment industries in Florissant include Educational Services (20 | 31.8%), Accommodation & Food Services (15 | 23.8%), Arts, Entertainment & Recreation (13 | 20.6%), Retail Trade (8 | 12.7%), and Construction (7 | 11.1%).
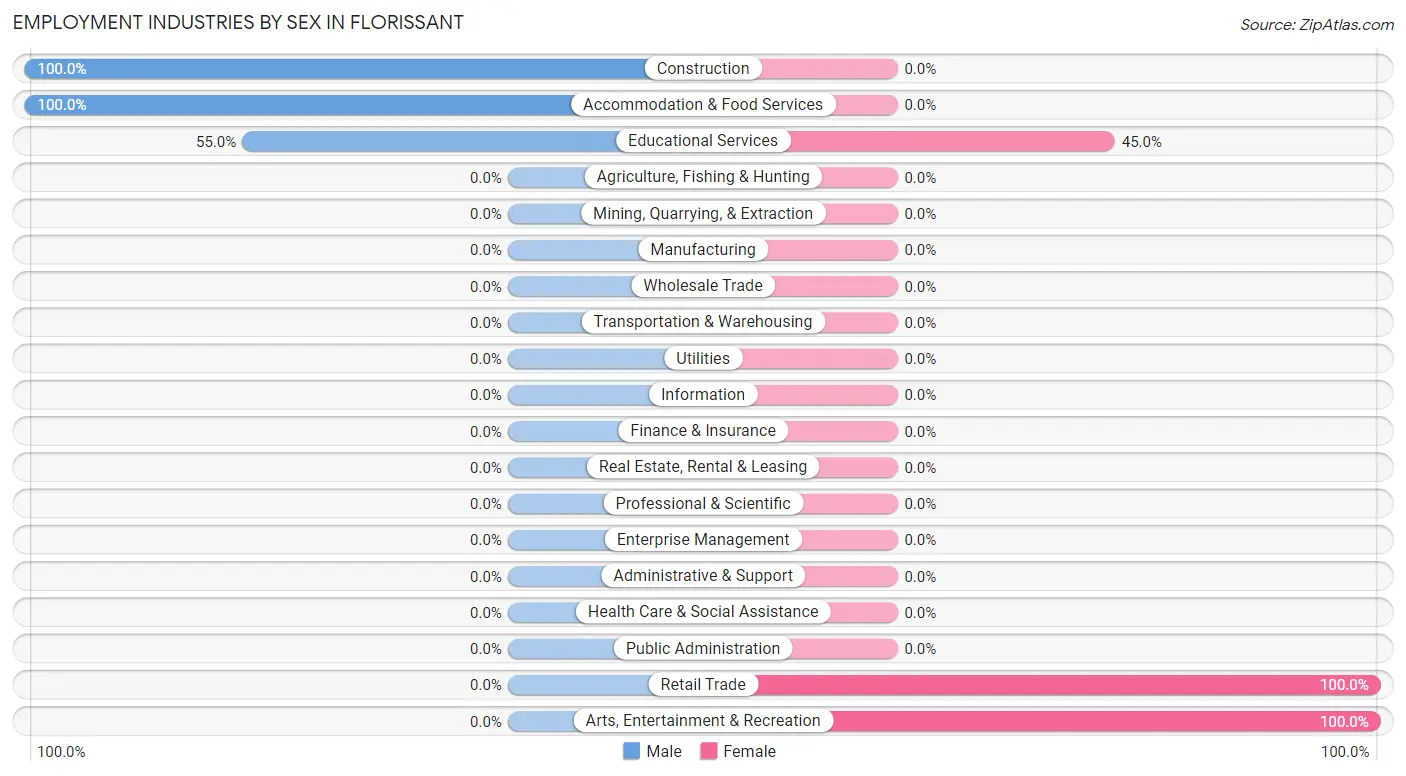
Employment Industries by Sex in Florissant
The Florissant industries that see more men than women are Construction (100.0%), Accommodation & Food Services (100.0%), and Educational Services (55.0%), whereas the industries that tend to have a higher number of women are Retail Trade (100.0%), Arts, Entertainment & Recreation (100.0%), and Educational Services (45.0%).
| Industry | Male | Female |
| Agriculture, Fishing & Hunting | 0 (0.0%) | 0 (0.0%) |
| Mining, Quarrying, & Extraction | 0 (0.0%) | 0 (0.0%) |
| Construction | 7 (100.0%) | 0 (0.0%) |
| Manufacturing | 0 (0.0%) | 0 (0.0%) |
| Wholesale Trade | 0 (0.0%) | 0 (0.0%) |
| Retail Trade | 0 (0.0%) | 8 (100.0%) |
| Transportation & Warehousing | 0 (0.0%) | 0 (0.0%) |
| Utilities | 0 (0.0%) | 0 (0.0%) |
| Information | 0 (0.0%) | 0 (0.0%) |
| Finance & Insurance | 0 (0.0%) | 0 (0.0%) |
| Real Estate, Rental & Leasing | 0 (0.0%) | 0 (0.0%) |
| Professional & Scientific | 0 (0.0%) | 0 (0.0%) |
| Enterprise Management | 0 (0.0%) | 0 (0.0%) |
| Administrative & Support | 0 (0.0%) | 0 (0.0%) |
| Educational Services | 11 (55.0%) | 9 (45.0%) |
| Health Care & Social Assistance | 0 (0.0%) | 0 (0.0%) |
| Arts, Entertainment & Recreation | 0 (0.0%) | 13 (100.0%) |
| Accommodation & Food Services | 15 (100.0%) | 0 (0.0%) |
| Public Administration | 0 (0.0%) | 0 (0.0%) |
| Total | 33 (52.4%) | 30 (47.6%) |
Education in Florissant
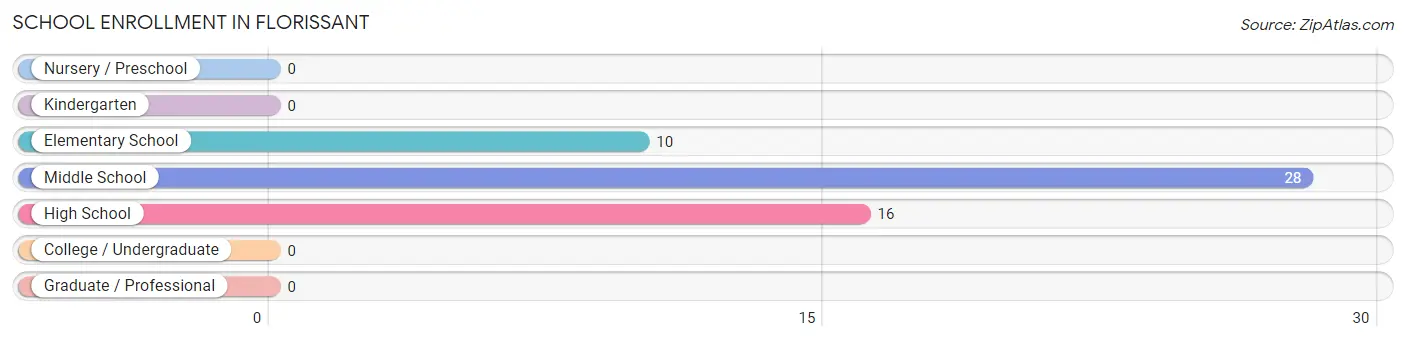
School Enrollment in Florissant
The most common levels of schooling among the 54 students in Florissant are middle school (28 | 51.8%), high school (16 | 29.6%), and elementary school (10 | 18.5%).
| School Level | # Students | % Students |
| Nursery / Preschool | 0 | 0.0% |
| Kindergarten | 0 | 0.0% |
| Elementary School | 10 | 18.5% |
| Middle School | 28 | 51.8% |
| High School | 16 | 29.6% |
| College / Undergraduate | 0 | 0.0% |
| Graduate / Professional | 0 | 0.0% |
| Total | 54 | 100.0% |
School Enrollment by Age by Funding Source in Florissant
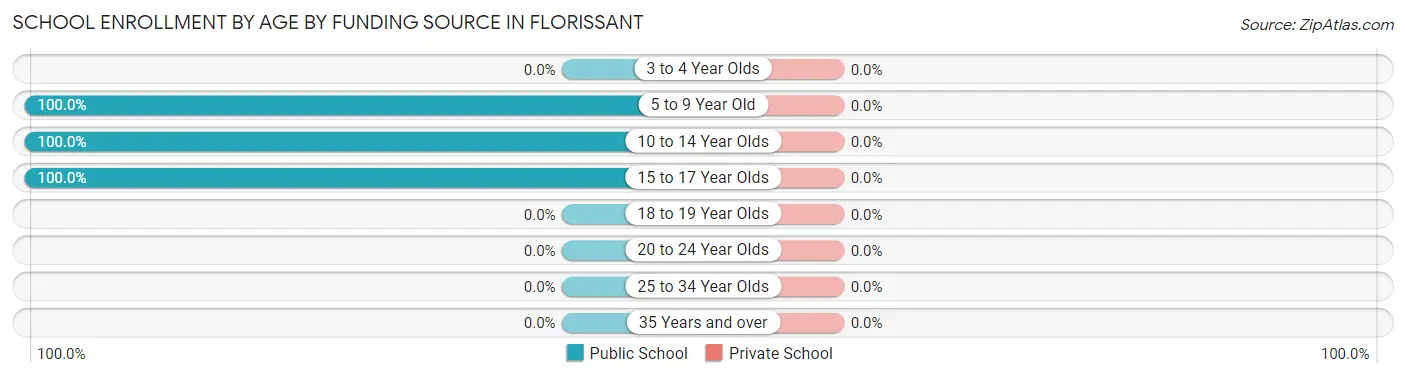
| Age Bracket | Public School | Private School |
| 3 to 4 Year Olds | 0 (0.0%) | 0 (0.0%) |
| 5 to 9 Year Old | 10 (100.0%) | 0 (0.0%) |
| 10 to 14 Year Olds | 28 (100.0%) | 0 (0.0%) |
| 15 to 17 Year Olds | 16 (100.0%) | 0 (0.0%) |
| 18 to 19 Year Olds | 0 (0.0%) | 0 (0.0%) |
| 20 to 24 Year Olds | 0 (0.0%) | 0 (0.0%) |
| 25 to 34 Year Olds | 0 (0.0%) | 0 (0.0%) |
| 35 Years and over | 0 (0.0%) | 0 (0.0%) |
| Total | 54 (100.0%) | 0 (0.0%) |
Educational Attainment by Field of Study in Florissant
Education (33 | 71.7%), and science & technology (13 | 28.3%) are the most common fields of study among 46 individuals in Florissant who have obtained a bachelor's degree or higher.
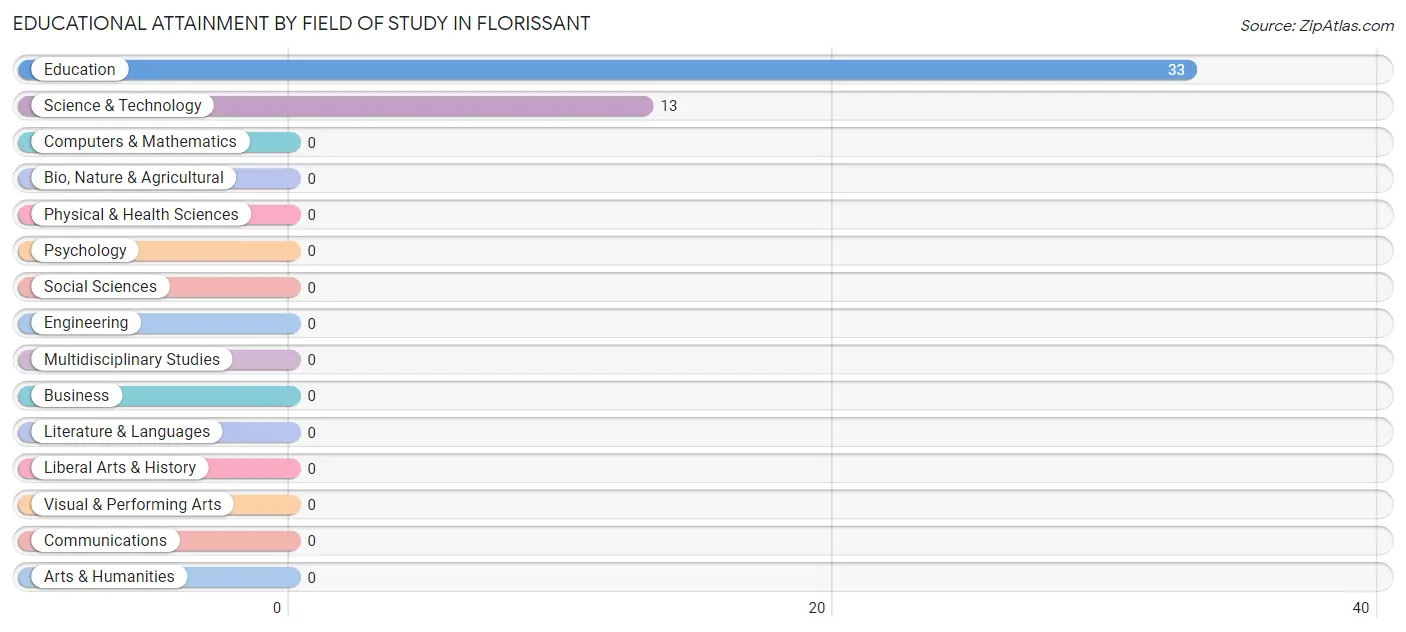
| Field of Study | # Graduates | % Graduates |
| Computers & Mathematics | 0 | 0.0% |
| Bio, Nature & Agricultural | 0 | 0.0% |
| Physical & Health Sciences | 0 | 0.0% |
| Psychology | 0 | 0.0% |
| Social Sciences | 0 | 0.0% |
| Engineering | 0 | 0.0% |
| Multidisciplinary Studies | 0 | 0.0% |
| Science & Technology | 13 | 28.3% |
| Business | 0 | 0.0% |
| Education | 33 | 71.7% |
| Literature & Languages | 0 | 0.0% |
| Liberal Arts & History | 0 | 0.0% |
| Visual & Performing Arts | 0 | 0.0% |
| Communications | 0 | 0.0% |
| Arts & Humanities | 0 | 0.0% |
| Total | 46 | 100.0% |
Transportation & Commute in Florissant
Vehicle Availability by Sex in Florissant
The most prevalent vehicle ownership categories in Florissant are males with 2 vehicles (26, accounting for 78.8%) and females with 2 vehicles (22, making up 86.7%).
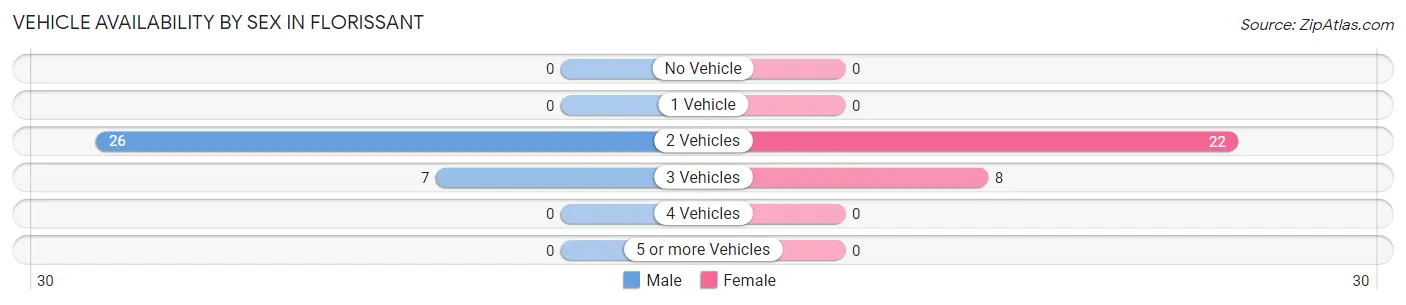
| Vehicles Available | Male | Female |
| No Vehicle | 0 (0.0%) | 0 (0.0%) |
| 1 Vehicle | 0 (0.0%) | 0 (0.0%) |
| 2 Vehicles | 26 (78.8%) | 22 (73.3%) |
| 3 Vehicles | 7 (21.2%) | 8 (26.7%) |
| 4 Vehicles | 0 (0.0%) | 0 (0.0%) |
| 5 or more Vehicles | 0 (0.0%) | 0 (0.0%) |
| Total | 33 (100.0%) | 30 (100.0%) |
Commute Time in Florissant
The most frequently occuring commute durations in Florissant are 20 to 24 minutes (48 commuters, 76.2%), 25 to 29 minutes (8 commuters, 12.7%), and 15 to 19 minutes (7 commuters, 11.1%).
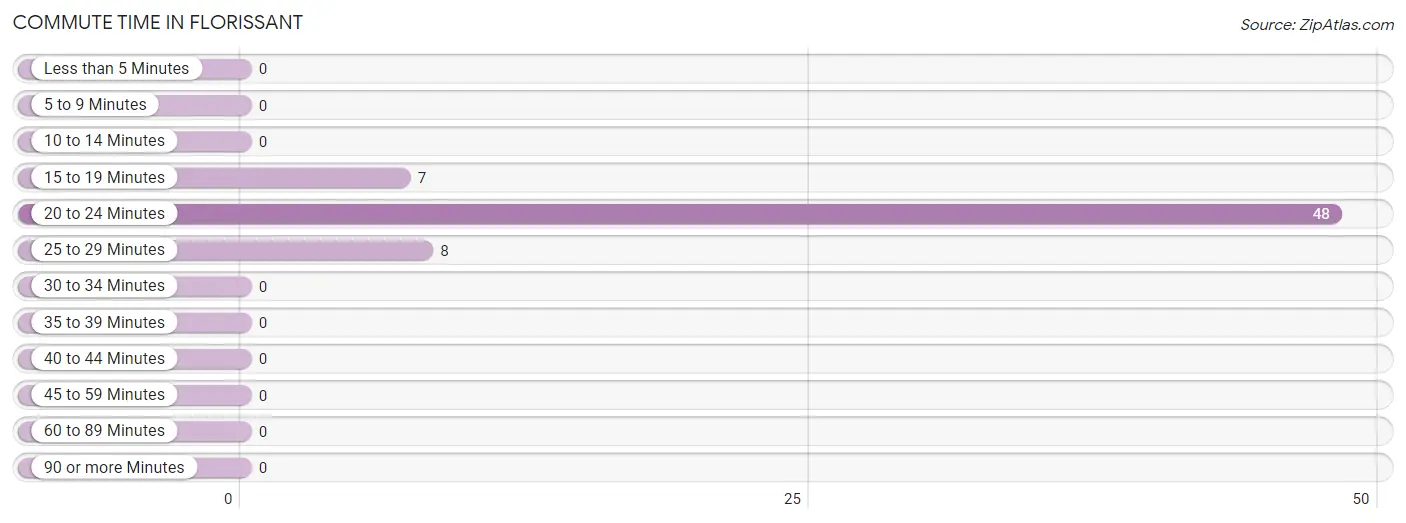
| Commute Time | # Commuters | % Commuters |
| Less than 5 Minutes | 0 | 0.0% |
| 5 to 9 Minutes | 0 | 0.0% |
| 10 to 14 Minutes | 0 | 0.0% |
| 15 to 19 Minutes | 7 | 11.1% |
| 20 to 24 Minutes | 48 | 76.2% |
| 25 to 29 Minutes | 8 | 12.7% |
| 30 to 34 Minutes | 0 | 0.0% |
| 35 to 39 Minutes | 0 | 0.0% |
| 40 to 44 Minutes | 0 | 0.0% |
| 45 to 59 Minutes | 0 | 0.0% |
| 60 to 89 Minutes | 0 | 0.0% |
| 90 or more Minutes | 0 | 0.0% |
Commute Time by Sex in Florissant
The most common commute times in Florissant are 20 to 24 minutes (26 commuters, 78.8%) for males and 20 to 24 minutes (22 commuters, 73.3%) for females.
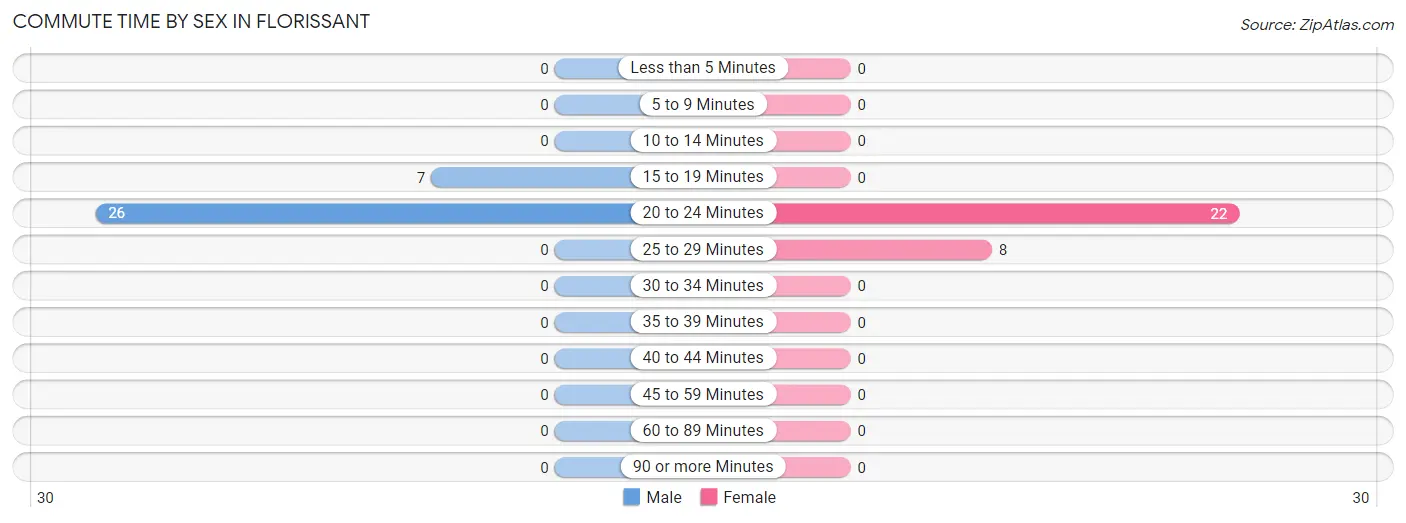
| Commute Time | Male | Female |
| Less than 5 Minutes | 0 (0.0%) | 0 (0.0%) |
| 5 to 9 Minutes | 0 (0.0%) | 0 (0.0%) |
| 10 to 14 Minutes | 0 (0.0%) | 0 (0.0%) |
| 15 to 19 Minutes | 7 (21.2%) | 0 (0.0%) |
| 20 to 24 Minutes | 26 (78.8%) | 22 (73.3%) |
| 25 to 29 Minutes | 0 (0.0%) | 8 (26.7%) |
| 30 to 34 Minutes | 0 (0.0%) | 0 (0.0%) |
| 35 to 39 Minutes | 0 (0.0%) | 0 (0.0%) |
| 40 to 44 Minutes | 0 (0.0%) | 0 (0.0%) |
| 45 to 59 Minutes | 0 (0.0%) | 0 (0.0%) |
| 60 to 89 Minutes | 0 (0.0%) | 0 (0.0%) |
| 90 or more Minutes | 0 (0.0%) | 0 (0.0%) |
Time of Departure to Work by Sex in Florissant
The most frequent times of departure to work in Florissant are 7:30 AM to 7:59 AM (18, 54.5%) for males and 12:00 AM to 4:59 AM (13, 43.3%) for females.
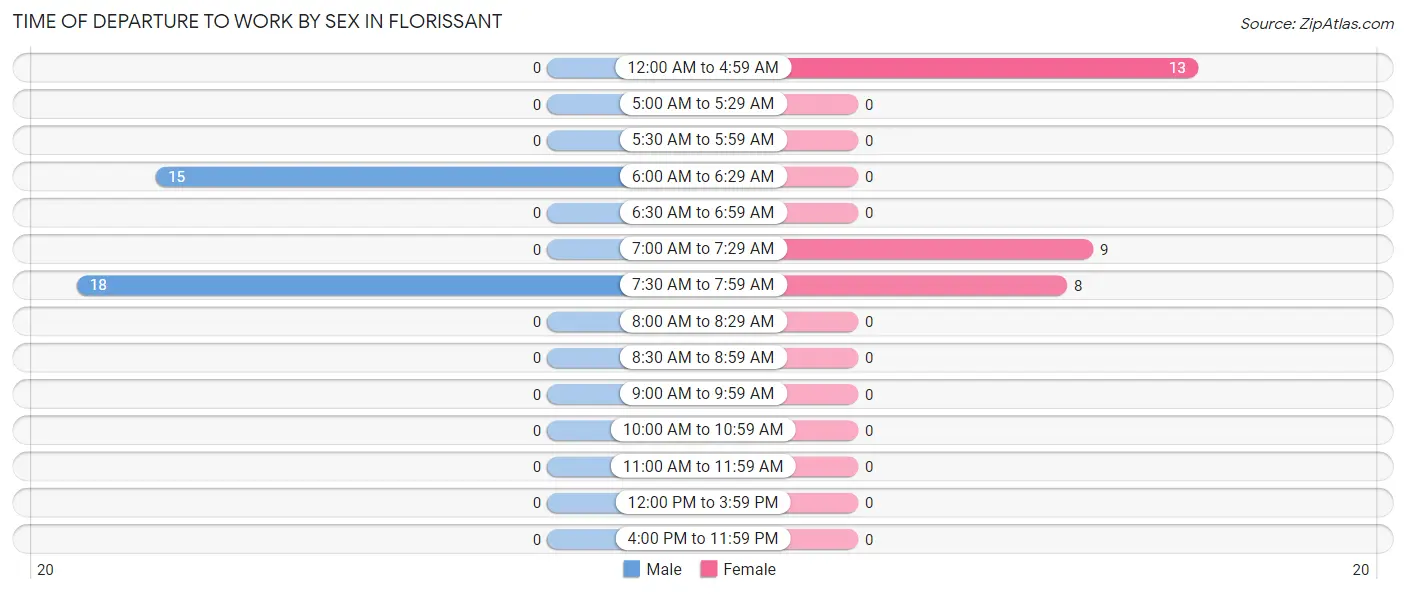
| Time of Departure | Male | Female |
| 12:00 AM to 4:59 AM | 0 (0.0%) | 13 (43.3%) |
| 5:00 AM to 5:29 AM | 0 (0.0%) | 0 (0.0%) |
| 5:30 AM to 5:59 AM | 0 (0.0%) | 0 (0.0%) |
| 6:00 AM to 6:29 AM | 15 (45.5%) | 0 (0.0%) |
| 6:30 AM to 6:59 AM | 0 (0.0%) | 0 (0.0%) |
| 7:00 AM to 7:29 AM | 0 (0.0%) | 9 (30.0%) |
| 7:30 AM to 7:59 AM | 18 (54.5%) | 8 (26.7%) |
| 8:00 AM to 8:29 AM | 0 (0.0%) | 0 (0.0%) |
| 8:30 AM to 8:59 AM | 0 (0.0%) | 0 (0.0%) |
| 9:00 AM to 9:59 AM | 0 (0.0%) | 0 (0.0%) |
| 10:00 AM to 10:59 AM | 0 (0.0%) | 0 (0.0%) |
| 11:00 AM to 11:59 AM | 0 (0.0%) | 0 (0.0%) |
| 12:00 PM to 3:59 PM | 0 (0.0%) | 0 (0.0%) |
| 4:00 PM to 11:59 PM | 0 (0.0%) | 0 (0.0%) |
| Total | 33 (100.0%) | 30 (100.0%) |
Housing Occupancy in Florissant
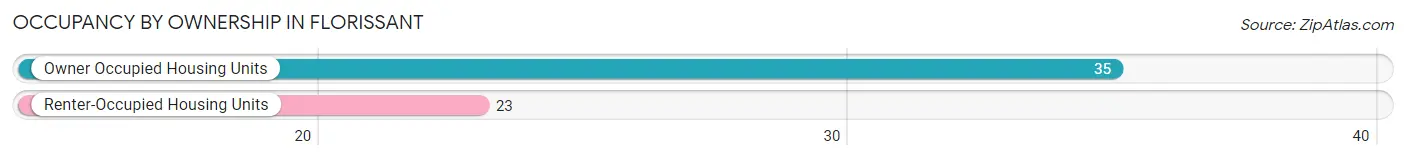
Occupancy by Ownership in Florissant
Of the total 58 dwellings in Florissant, owner-occupied units account for 35 (60.3%), while renter-occupied units make up 23 (39.7%).
| Occupancy | # Housing Units | % Housing Units |
| Owner Occupied Housing Units | 35 | 60.3% |
| Renter-Occupied Housing Units | 23 | 39.7% |
| Total Occupied Housing Units | 58 | 100.0% |
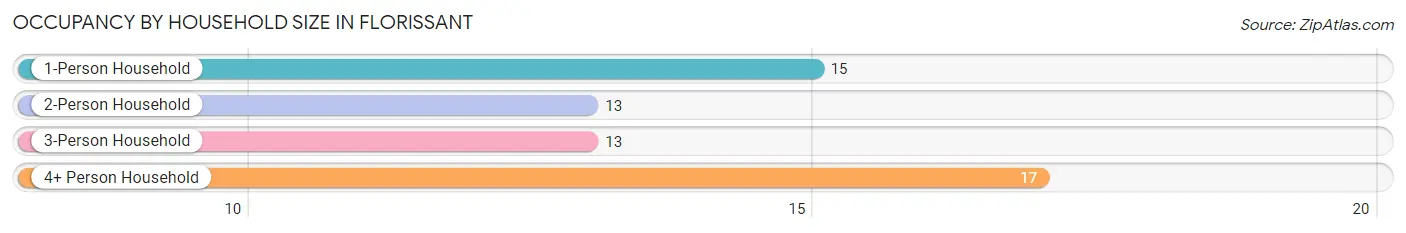
Occupancy by Household Size in Florissant
| Household Size | # Housing Units | % Housing Units |
| 1-Person Household | 15 | 25.9% |
| 2-Person Household | 13 | 22.4% |
| 3-Person Household | 13 | 22.4% |
| 4+ Person Household | 17 | 29.3% |
| Total Housing Units | 58 | 100.0% |
Occupancy by Ownership by Household Size in Florissant
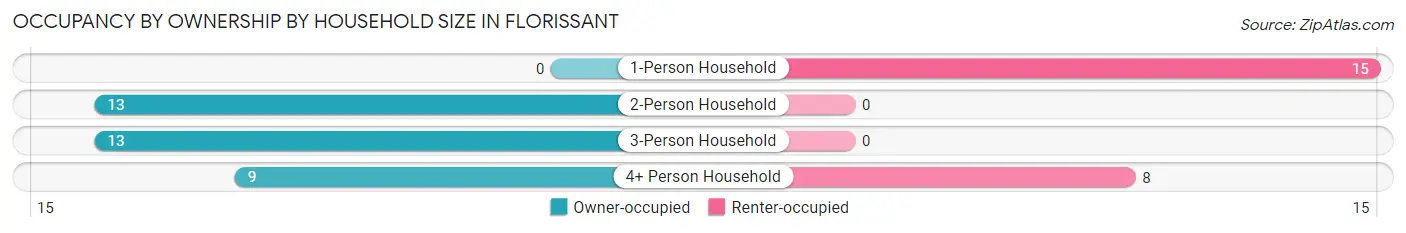
| Household Size | Owner-occupied | Renter-occupied |
| 1-Person Household | 0 (0.0%) | 15 (100.0%) |
| 2-Person Household | 13 (100.0%) | 0 (0.0%) |
| 3-Person Household | 13 (100.0%) | 0 (0.0%) |
| 4+ Person Household | 9 (52.9%) | 8 (47.1%) |
| Total Housing Units | 35 (60.3%) | 23 (39.7%) |
Occupancy by Educational Attainment in Florissant
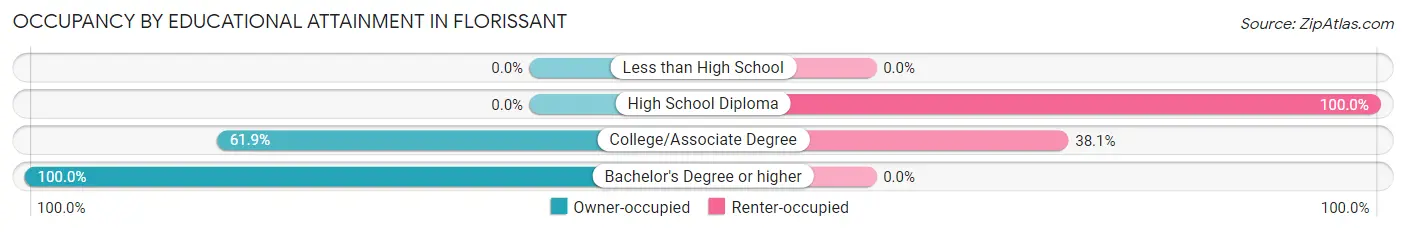
| Household Size | Owner-occupied | Renter-occupied |
| Less than High School | 0 (0.0%) | 0 (0.0%) |
| High School Diploma | 0 (0.0%) | 15 (100.0%) |
| College/Associate Degree | 13 (61.9%) | 8 (38.1%) |
| Bachelor's Degree or higher | 22 (100.0%) | 0 (0.0%) |
Occupancy by Age of Householder in Florissant
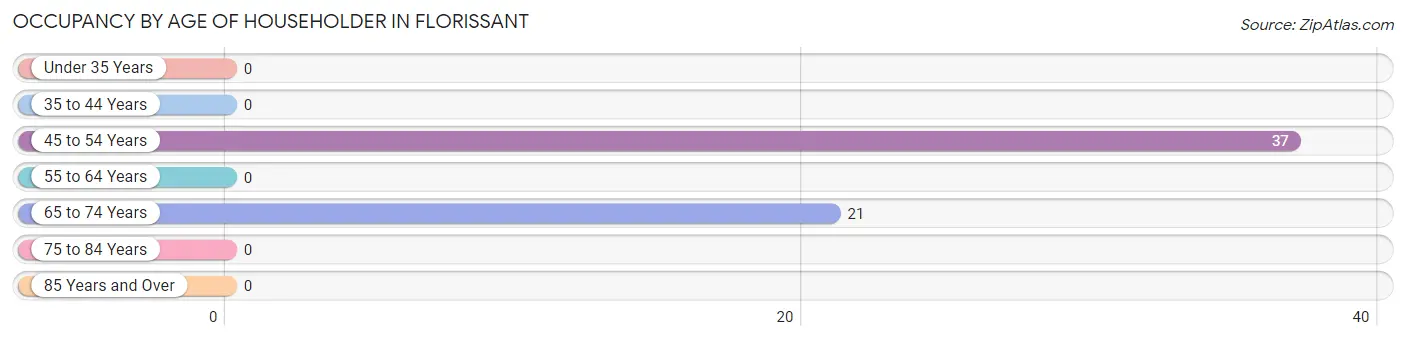
| Age Bracket | # Households | % Households |
| Under 35 Years | 0 | 0.0% |
| 35 to 44 Years | 0 | 0.0% |
| 45 to 54 Years | 37 | 63.8% |
| 55 to 64 Years | 0 | 0.0% |
| 65 to 74 Years | 21 | 36.2% |
| 75 to 84 Years | 0 | 0.0% |
| 85 Years and Over | 0 | 0.0% |
| Total | 58 | 100.0% |
Housing Finances in Florissant
Median Income by Occupancy in Florissant
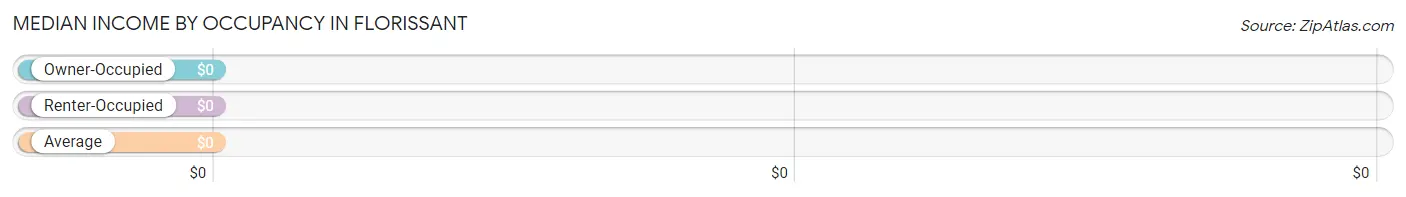
| Occupancy Type | # Households | Median Income |
| Owner-Occupied | 35 (60.3%) | $0 |
| Renter-Occupied | 23 (39.7%) | $0 |
| Average | 58 (100.0%) | $0 |
Occupancy by Householder Income Bracket in Florissant
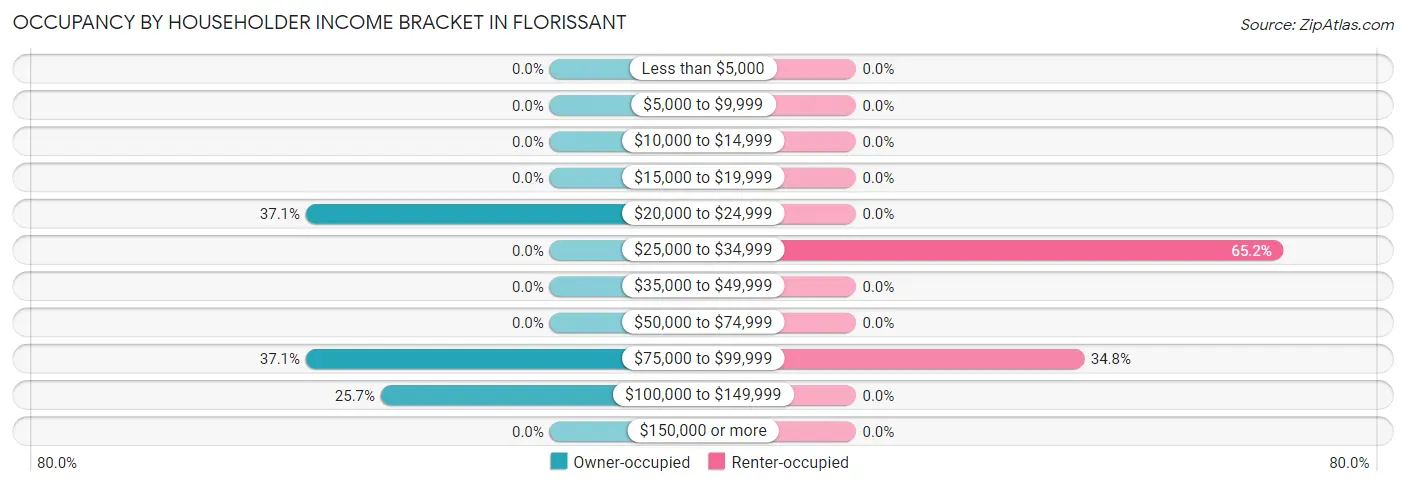
| Income Bracket | Owner-occupied | Renter-occupied |
| Less than $5,000 | 0 (0.0%) | 0 (0.0%) |
| $5,000 to $9,999 | 0 (0.0%) | 0 (0.0%) |
| $10,000 to $14,999 | 0 (0.0%) | 0 (0.0%) |
| $15,000 to $19,999 | 0 (0.0%) | 0 (0.0%) |
| $20,000 to $24,999 | 13 (37.1%) | 0 (0.0%) |
| $25,000 to $34,999 | 0 (0.0%) | 15 (65.2%) |
| $35,000 to $49,999 | 0 (0.0%) | 0 (0.0%) |
| $50,000 to $74,999 | 0 (0.0%) | 0 (0.0%) |
| $75,000 to $99,999 | 13 (37.1%) | 8 (34.8%) |
| $100,000 to $149,999 | 9 (25.7%) | 0 (0.0%) |
| $150,000 or more | 0 (0.0%) | 0 (0.0%) |
| Total | 35 (100.0%) | 23 (100.0%) |
Monthly Housing Cost Tiers in Florissant
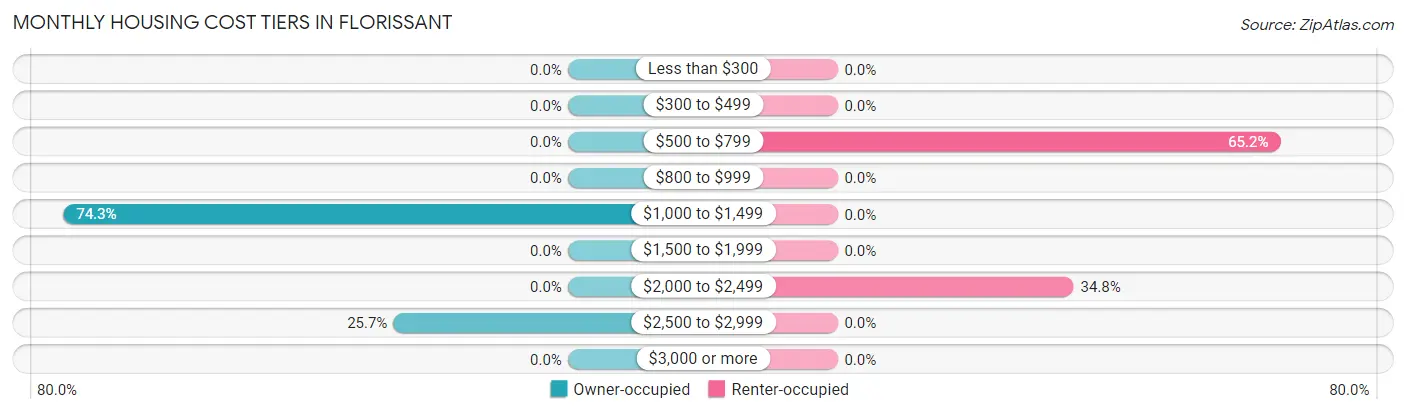
| Monthly Cost | Owner-occupied | Renter-occupied |
| Less than $300 | 0 (0.0%) | 0 (0.0%) |
| $300 to $499 | 0 (0.0%) | 0 (0.0%) |
| $500 to $799 | 0 (0.0%) | 15 (65.2%) |
| $800 to $999 | 0 (0.0%) | 0 (0.0%) |
| $1,000 to $1,499 | 26 (74.3%) | 0 (0.0%) |
| $1,500 to $1,999 | 0 (0.0%) | 0 (0.0%) |
| $2,000 to $2,499 | 0 (0.0%) | 8 (34.8%) |
| $2,500 to $2,999 | 9 (25.7%) | 0 (0.0%) |
| $3,000 or more | 0 (0.0%) | 0 (0.0%) |
| Total | 35 (100.0%) | 23 (100.0%) |
Physical Housing Characteristics in Florissant
Housing Structures in Florissant
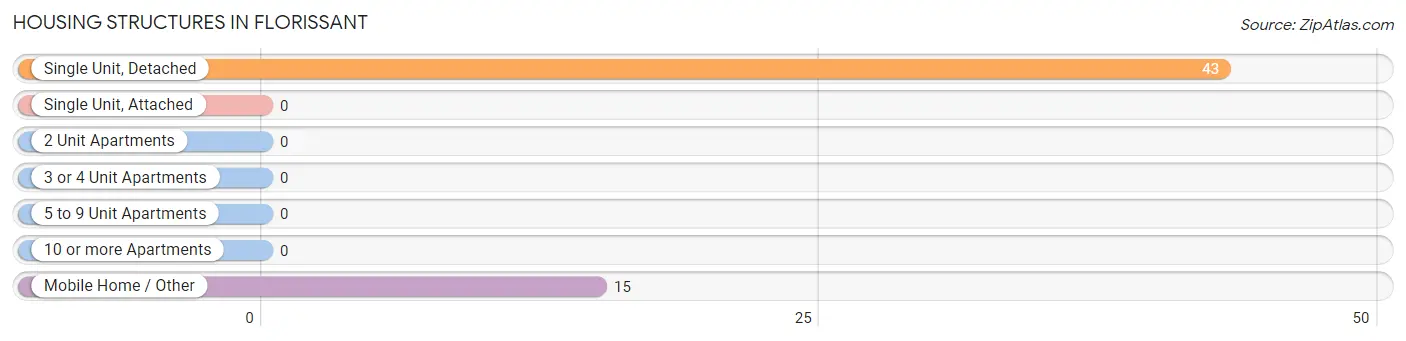
| Structure Type | # Housing Units | % Housing Units |
| Single Unit, Detached | 43 | 74.1% |
| Single Unit, Attached | 0 | 0.0% |
| 2 Unit Apartments | 0 | 0.0% |
| 3 or 4 Unit Apartments | 0 | 0.0% |
| 5 to 9 Unit Apartments | 0 | 0.0% |
| 10 or more Apartments | 0 | 0.0% |
| Mobile Home / Other | 15 | 25.9% |
| Total | 58 | 100.0% |
Housing Structures by Occupancy in Florissant
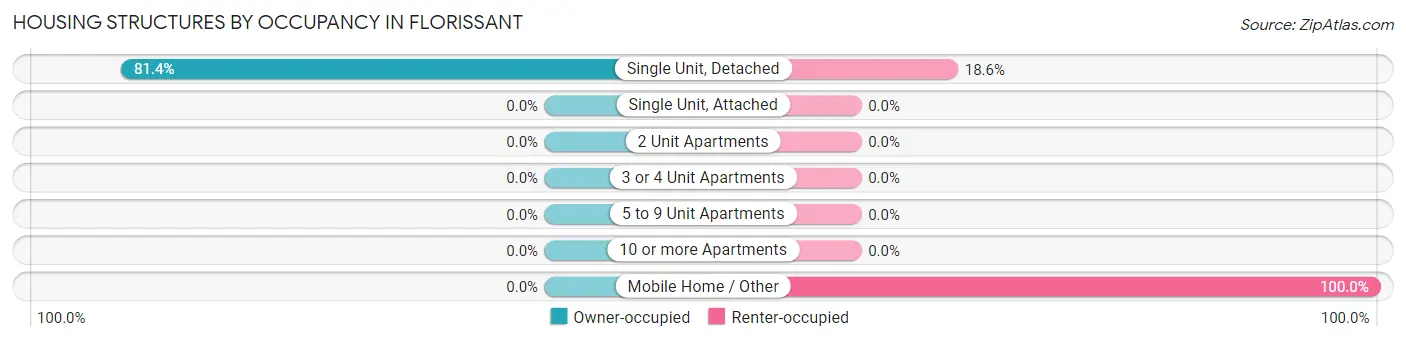
| Structure Type | Owner-occupied | Renter-occupied |
| Single Unit, Detached | 35 (81.4%) | 8 (18.6%) |
| Single Unit, Attached | 0 (0.0%) | 0 (0.0%) |
| 2 Unit Apartments | 0 (0.0%) | 0 (0.0%) |
| 3 or 4 Unit Apartments | 0 (0.0%) | 0 (0.0%) |
| 5 to 9 Unit Apartments | 0 (0.0%) | 0 (0.0%) |
| 10 or more Apartments | 0 (0.0%) | 0 (0.0%) |
| Mobile Home / Other | 0 (0.0%) | 15 (100.0%) |
| Total | 35 (60.3%) | 23 (39.7%) |
Housing Structures by Number of Rooms in Florissant
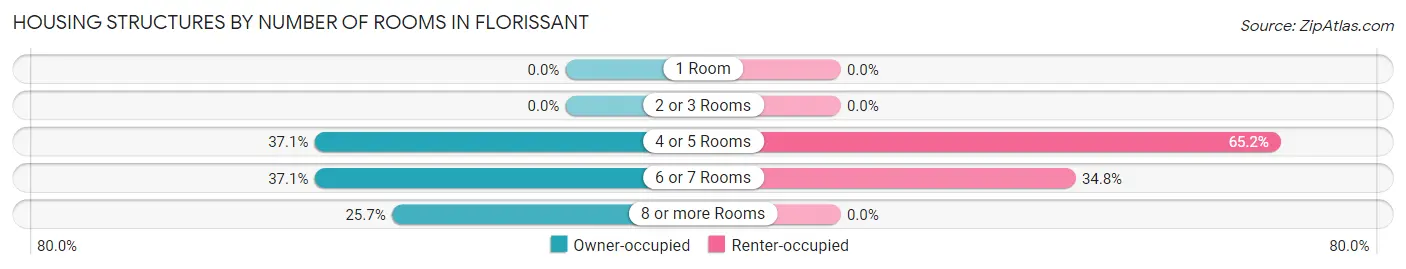
| Number of Rooms | Owner-occupied | Renter-occupied |
| 1 Room | 0 (0.0%) | 0 (0.0%) |
| 2 or 3 Rooms | 0 (0.0%) | 0 (0.0%) |
| 4 or 5 Rooms | 13 (37.1%) | 15 (65.2%) |
| 6 or 7 Rooms | 13 (37.1%) | 8 (34.8%) |
| 8 or more Rooms | 9 (25.7%) | 0 (0.0%) |
| Total | 35 (100.0%) | 23 (100.0%) |
Housing Structure by Heating Type in Florissant
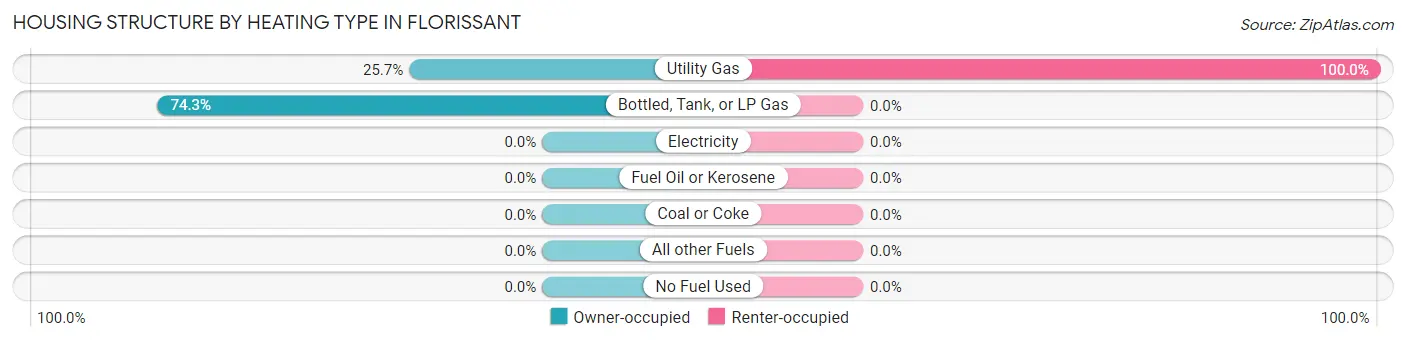
| Heating Type | Owner-occupied | Renter-occupied |
| Utility Gas | 9 (25.7%) | 23 (100.0%) |
| Bottled, Tank, or LP Gas | 26 (74.3%) | 0 (0.0%) |
| Electricity | 0 (0.0%) | 0 (0.0%) |
| Fuel Oil or Kerosene | 0 (0.0%) | 0 (0.0%) |
| Coal or Coke | 0 (0.0%) | 0 (0.0%) |
| All other Fuels | 0 (0.0%) | 0 (0.0%) |
| No Fuel Used | 0 (0.0%) | 0 (0.0%) |
| Total | 35 (100.0%) | 23 (100.0%) |
Household Vehicle Usage in Florissant
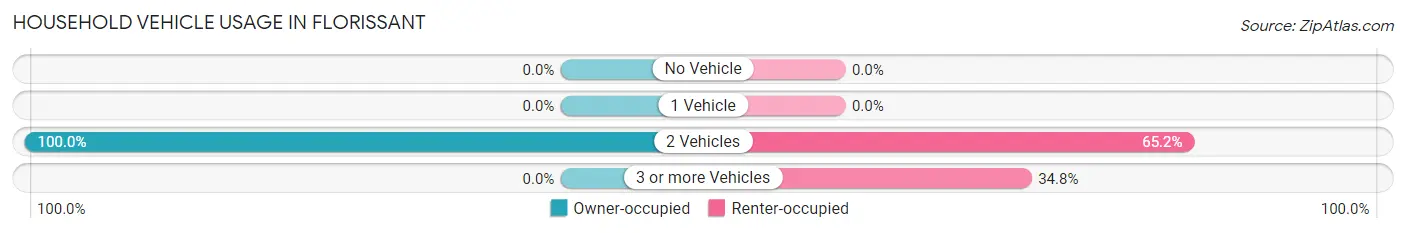
| Vehicles per Household | Owner-occupied | Renter-occupied |
| No Vehicle | 0 (0.0%) | 0 (0.0%) |
| 1 Vehicle | 0 (0.0%) | 0 (0.0%) |
| 2 Vehicles | 35 (100.0%) | 15 (65.2%) |
| 3 or more Vehicles | 0 (0.0%) | 8 (34.8%) |
| Total | 35 (100.0%) | 23 (100.0%) |
Real Estate & Mortgages in Florissant
Real Estate and Mortgage Overview in Florissant
| Characteristic | Without Mortgage | With Mortgage |
| Housing Units | 0 | 35 |
| Median Property Value | - | - |
| Median Household Income | - | - |
| Monthly Housing Costs | - | - |
| Real Estate Taxes | - | - |
Property Value by Mortgage Status in Florissant
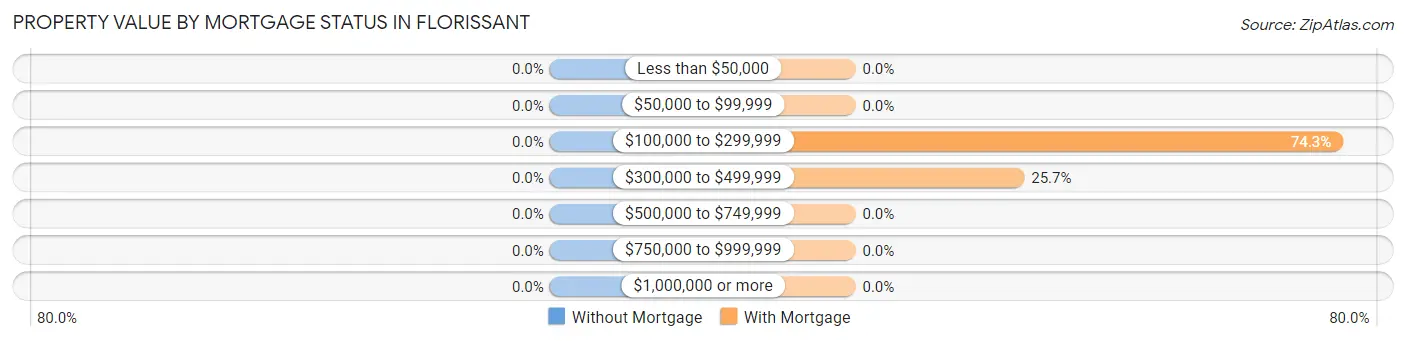
| Property Value | Without Mortgage | With Mortgage |
| Less than $50,000 | 0 (0.0%) | 0 (0.0%) |
| $50,000 to $99,999 | 0 (0.0%) | 0 (0.0%) |
| $100,000 to $299,999 | 0 (0.0%) | 26 (74.3%) |
| $300,000 to $499,999 | 0 (0.0%) | 9 (25.7%) |
| $500,000 to $749,999 | 0 (0.0%) | 0 (0.0%) |
| $750,000 to $999,999 | 0 (0.0%) | 0 (0.0%) |
| $1,000,000 or more | 0 (0.0%) | 0 (0.0%) |
| Total | 0 (0.0%) | 35 (100.0%) |
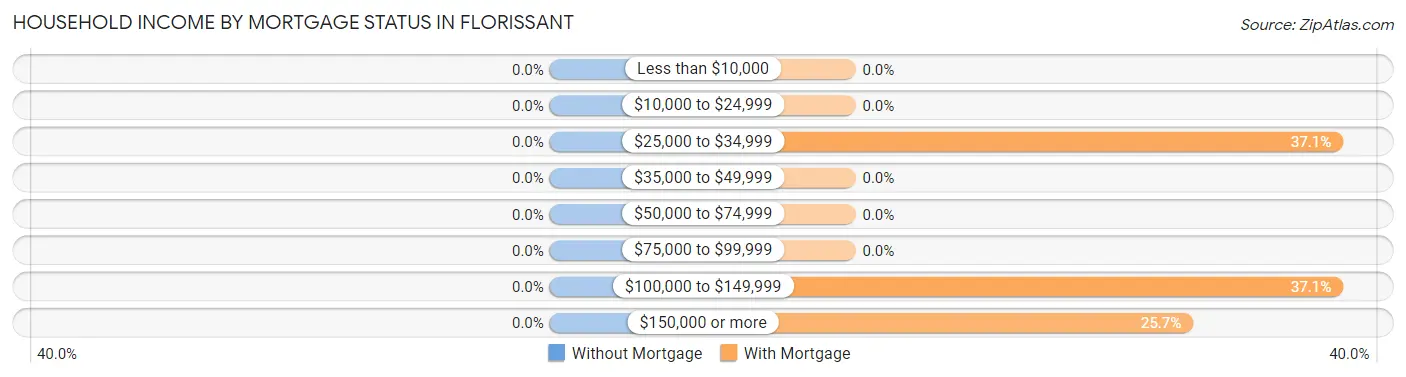
Household Income by Mortgage Status in Florissant
| Household Income | Without Mortgage | With Mortgage |
| Less than $10,000 | 0 (0.0%) | 0 (0.0%) |
| $10,000 to $24,999 | 0 (0.0%) | 0 (0.0%) |
| $25,000 to $34,999 | 0 (0.0%) | 13 (37.1%) |
| $35,000 to $49,999 | 0 (0.0%) | 0 (0.0%) |
| $50,000 to $74,999 | 0 (0.0%) | 0 (0.0%) |
| $75,000 to $99,999 | 0 (0.0%) | 0 (0.0%) |
| $100,000 to $149,999 | 0 (0.0%) | 13 (37.1%) |
| $150,000 or more | 0 (0.0%) | 9 (25.7%) |
| Total | 0 (0.0%) | 35 (100.0%) |
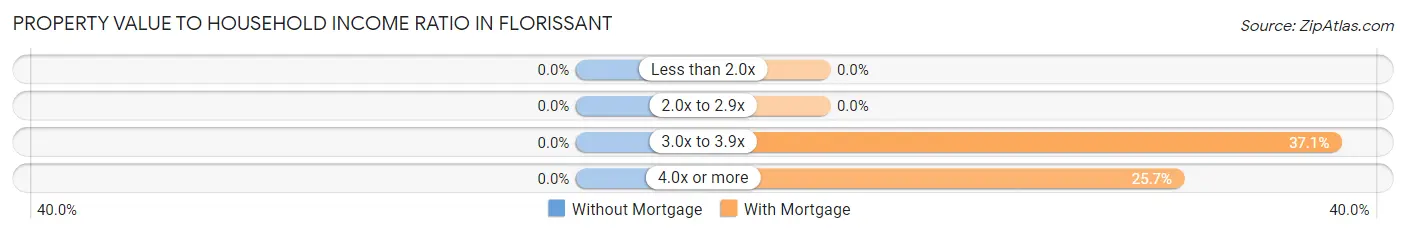
Property Value to Household Income Ratio in Florissant
| Value-to-Income Ratio | Without Mortgage | With Mortgage |
| Less than 2.0x | 0 (0.0%) | 0 (0.0%) |
| 2.0x to 2.9x | 0 (0.0%) | 0 (0.0%) |
| 3.0x to 3.9x | 0 (0.0%) | 13 (37.1%) |
| 4.0x or more | 0 (0.0%) | 9 (25.7%) |
| Total | 0 (0.0%) | 35 (100.0%) |
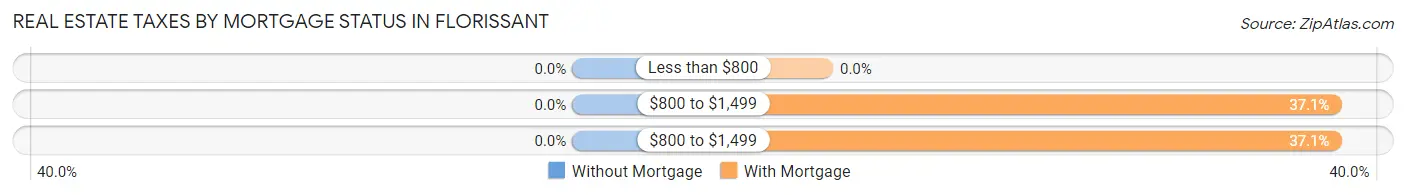
Real Estate Taxes by Mortgage Status in Florissant
| Property Taxes | Without Mortgage | With Mortgage |
| Less than $800 | 0 (0.0%) | 0 (0.0%) |
| $800 to $1,499 | 0 (0.0%) | 13 (37.1%) |
| $800 to $1,499 | 0 (0.0%) | 13 (37.1%) |
| Total | 0 (0.0%) | 35 (100.0%) |
Health & Disability in Florissant
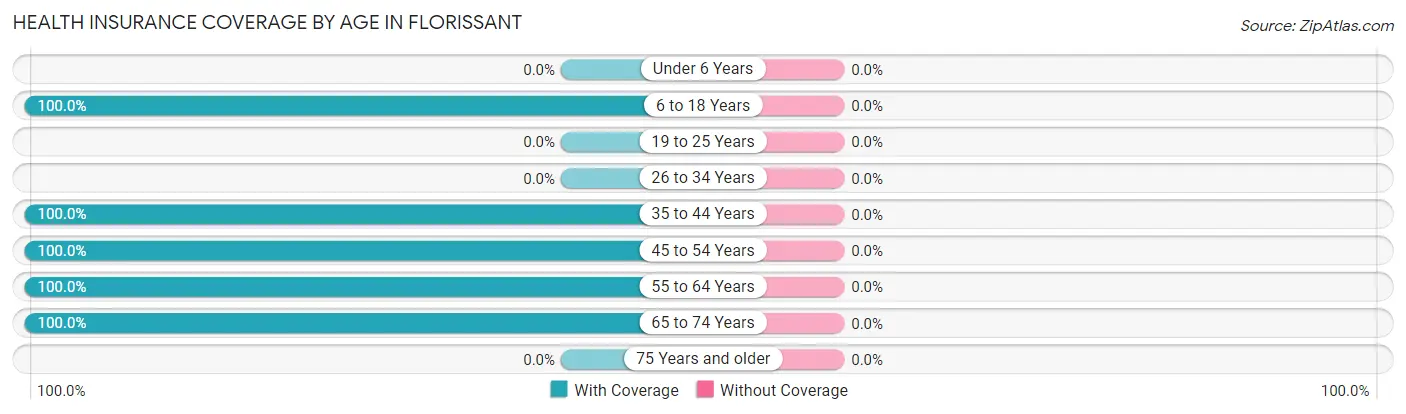
Health Insurance Coverage by Age in Florissant
| Age Bracket | With Coverage | Without Coverage |
| Under 6 Years | 0 (0.0%) | 0 (0.0%) |
| 6 to 18 Years | 54 (100.0%) | 0 (0.0%) |
| 19 to 25 Years | 0 (0.0%) | 0 (0.0%) |
| 26 to 34 Years | 0 (0.0%) | 0 (0.0%) |
| 35 to 44 Years | 15 (100.0%) | 0 (0.0%) |
| 45 to 54 Years | 62 (100.0%) | 0 (0.0%) |
| 55 to 64 Years | 7 (100.0%) | 0 (0.0%) |
| 65 to 74 Years | 35 (100.0%) | 0 (0.0%) |
| 75 Years and older | 0 (0.0%) | 0 (0.0%) |
| Total | 173 (100.0%) | 0 (0.0%) |
Health Insurance Coverage by Citizenship Status in Florissant
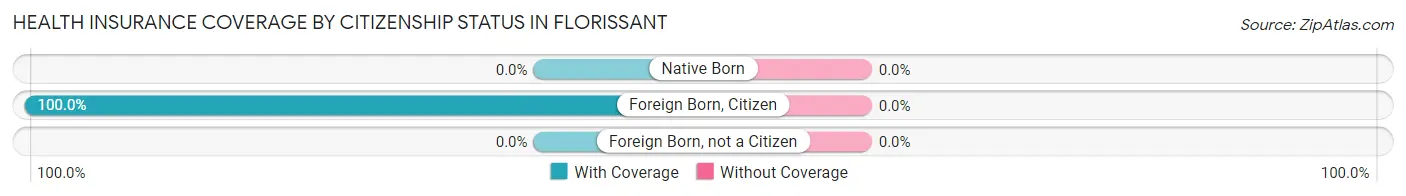
| Citizenship Status | With Coverage | Without Coverage |
| Native Born | 0 (0.0%) | 0 (0.0%) |
| Foreign Born, Citizen | 54 (100.0%) | 0 (0.0%) |
| Foreign Born, not a Citizen | 0 (0.0%) | 0 (0.0%) |
Health Insurance Coverage by Household Income in Florissant
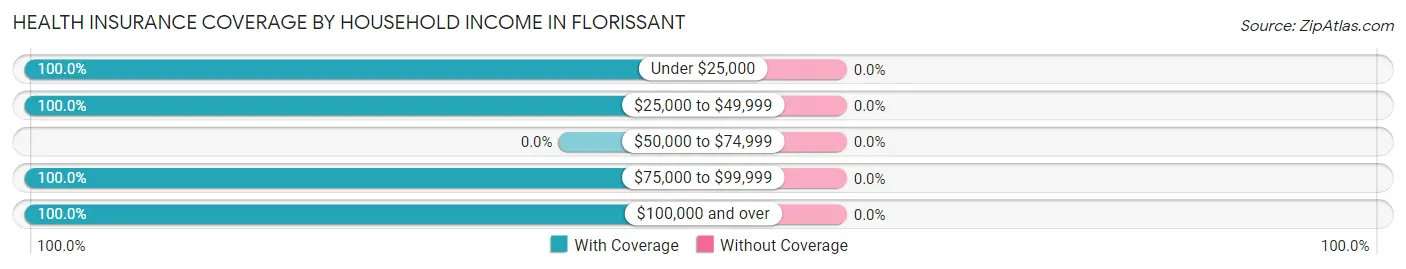
| Household Income | With Coverage | Without Coverage |
| Under $25,000 | 27 (100.0%) | 0 (0.0%) |
| $25,000 to $49,999 | 15 (100.0%) | 0 (0.0%) |
| $50,000 to $74,999 | 0 (0.0%) | 0 (0.0%) |
| $75,000 to $99,999 | 84 (100.0%) | 0 (0.0%) |
| $100,000 and over | 47 (100.0%) | 0 (0.0%) |
Public vs Private Health Insurance Coverage by Age in Florissant
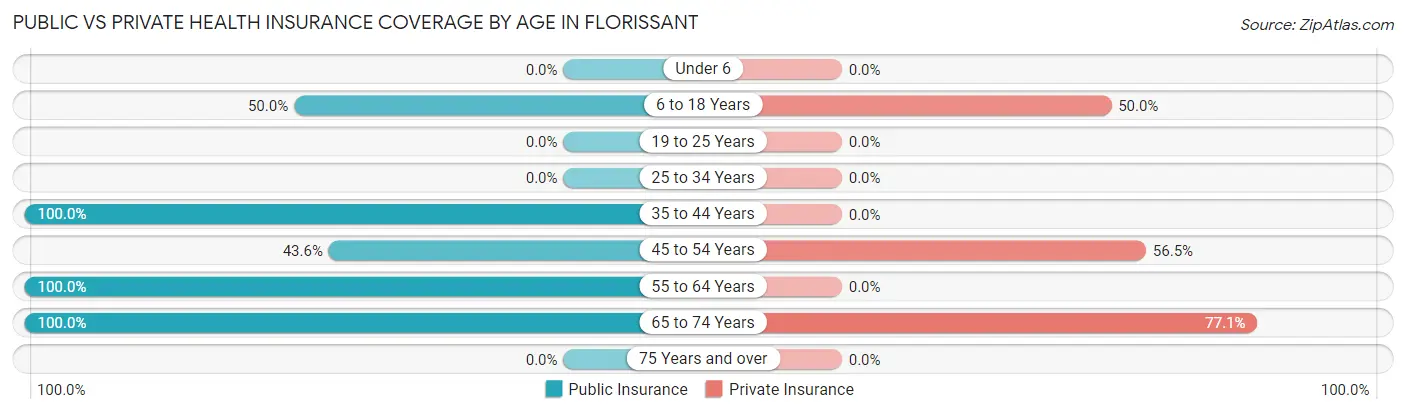
| Age Bracket | Public Insurance | Private Insurance |
| Under 6 | 0 (0.0%) | 0 (0.0%) |
| 6 to 18 Years | 27 (50.0%) | 27 (50.0%) |
| 19 to 25 Years | 0 (0.0%) | 0 (0.0%) |
| 25 to 34 Years | 0 (0.0%) | 0 (0.0%) |
| 35 to 44 Years | 15 (100.0%) | 0 (0.0%) |
| 45 to 54 Years | 27 (43.5%) | 35 (56.5%) |
| 55 to 64 Years | 7 (100.0%) | 0 (0.0%) |
| 65 to 74 Years | 35 (100.0%) | 27 (77.1%) |
| 75 Years and over | 0 (0.0%) | 0 (0.0%) |
| Total | 111 (64.2%) | 89 (51.4%) |
Disability Status by Sex by Age in Florissant
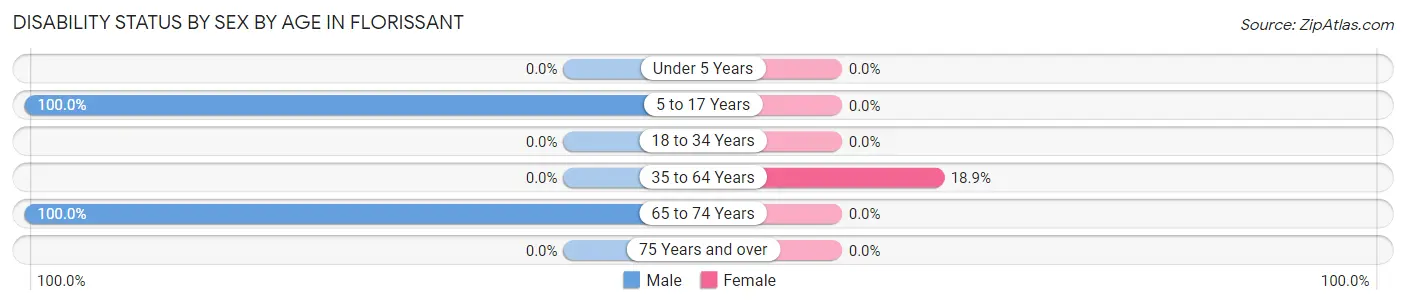
| Age Bracket | Male | Female |
| Under 5 Years | 0 (0.0%) | 0 (0.0%) |
| 5 to 17 Years | 17 (100.0%) | 0 (0.0%) |
| 18 to 34 Years | 0 (0.0%) | 0 (0.0%) |
| 35 to 64 Years | 0 (0.0%) | 7 (18.9%) |
| 65 to 74 Years | 22 (100.0%) | 0 (0.0%) |
| 75 Years and over | 0 (0.0%) | 0 (0.0%) |
Disability Class by Sex by Age in Florissant
Disability Class: Hearing Difficulty
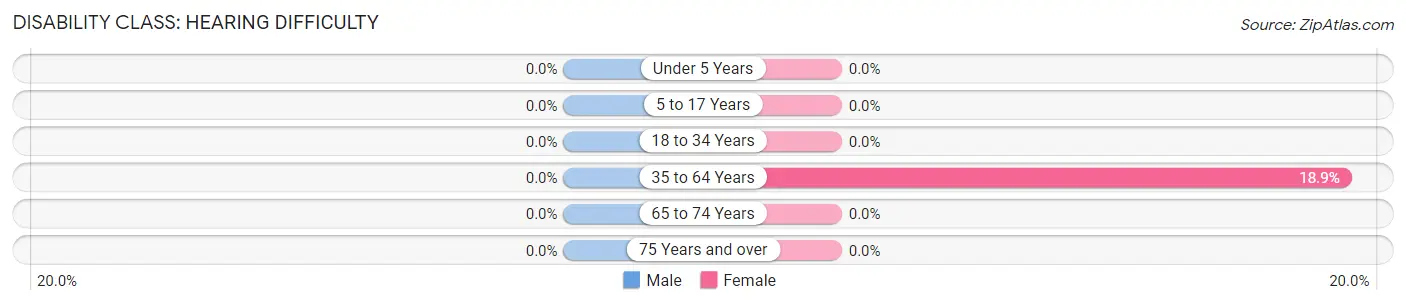
| Age Bracket | Male | Female |
| Under 5 Years | 0 (0.0%) | 0 (0.0%) |
| 5 to 17 Years | 0 (0.0%) | 0 (0.0%) |
| 18 to 34 Years | 0 (0.0%) | 0 (0.0%) |
| 35 to 64 Years | 0 (0.0%) | 7 (18.9%) |
| 65 to 74 Years | 0 (0.0%) | 0 (0.0%) |
| 75 Years and over | 0 (0.0%) | 0 (0.0%) |
Disability Class: Vision Difficulty
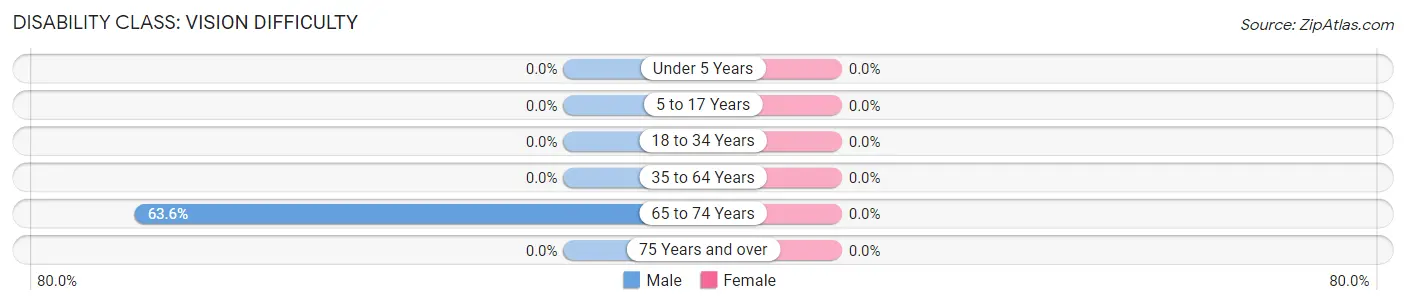
| Age Bracket | Male | Female |
| Under 5 Years | 0 (0.0%) | 0 (0.0%) |
| 5 to 17 Years | 0 (0.0%) | 0 (0.0%) |
| 18 to 34 Years | 0 (0.0%) | 0 (0.0%) |
| 35 to 64 Years | 0 (0.0%) | 0 (0.0%) |
| 65 to 74 Years | 14 (63.6%) | 0 (0.0%) |
| 75 Years and over | 0 (0.0%) | 0 (0.0%) |
Disability Class: Cognitive Difficulty
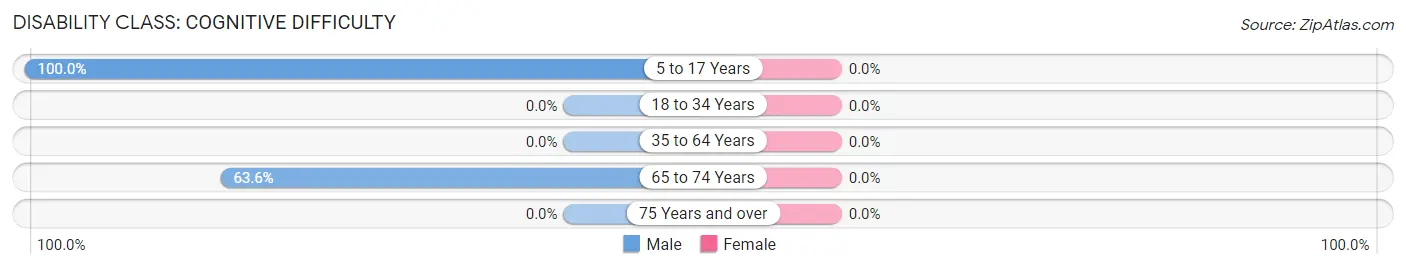
| Age Bracket | Male | Female |
| 5 to 17 Years | 17 (100.0%) | 0 (0.0%) |
| 18 to 34 Years | 0 (0.0%) | 0 (0.0%) |
| 35 to 64 Years | 0 (0.0%) | 0 (0.0%) |
| 65 to 74 Years | 14 (63.6%) | 0 (0.0%) |
| 75 Years and over | 0 (0.0%) | 0 (0.0%) |
Disability Class: Ambulatory Difficulty
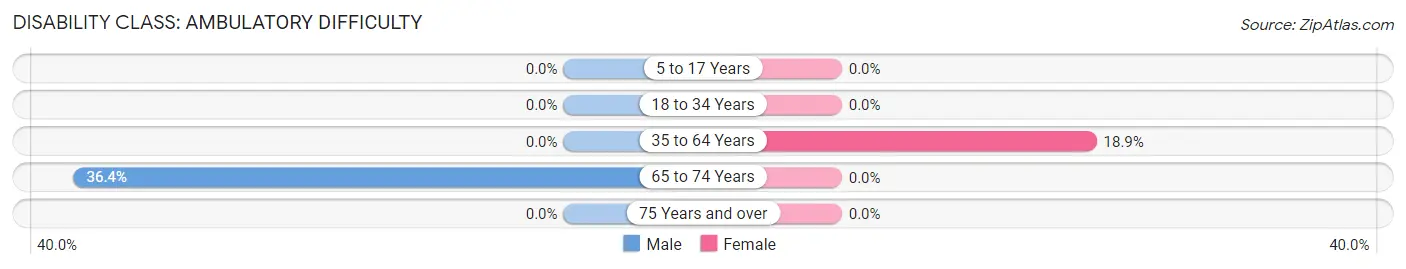
| Age Bracket | Male | Female |
| 5 to 17 Years | 0 (0.0%) | 0 (0.0%) |
| 18 to 34 Years | 0 (0.0%) | 0 (0.0%) |
| 35 to 64 Years | 0 (0.0%) | 7 (18.9%) |
| 65 to 74 Years | 8 (36.4%) | 0 (0.0%) |
| 75 Years and over | 0 (0.0%) | 0 (0.0%) |
Disability Class: Self-Care Difficulty
| Age Bracket | Male | Female |
| 5 to 17 Years | 0 (0.0%) | 0 (0.0%) |
| 18 to 34 Years | 0 (0.0%) | 0 (0.0%) |
| 35 to 64 Years | 0 (0.0%) | 0 (0.0%) |
| 65 to 74 Years | 0 (0.0%) | 0 (0.0%) |
| 75 Years and over | 0 (0.0%) | 0 (0.0%) |
Technology Access in Florissant
Computing Device Access in Florissant
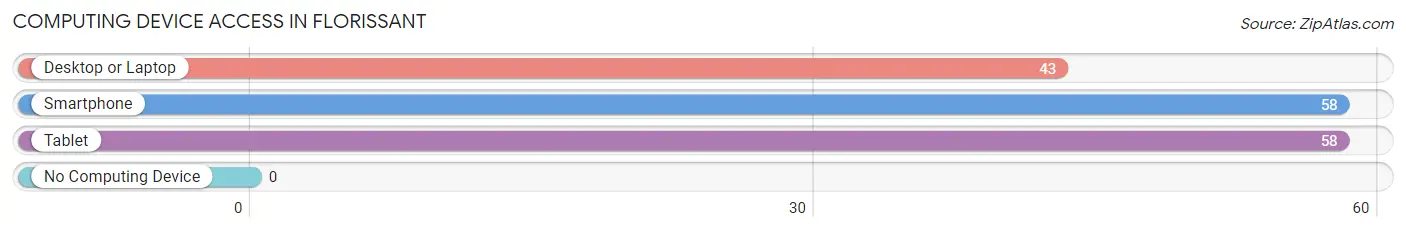
| Device Type | # Households | % Households |
| Desktop or Laptop | 43 | 74.1% |
| Smartphone | 58 | 100.0% |
| Tablet | 58 | 100.0% |
| No Computing Device | 0 | 0.0% |
| Total | 58 | 100.0% |
Internet Access in Florissant
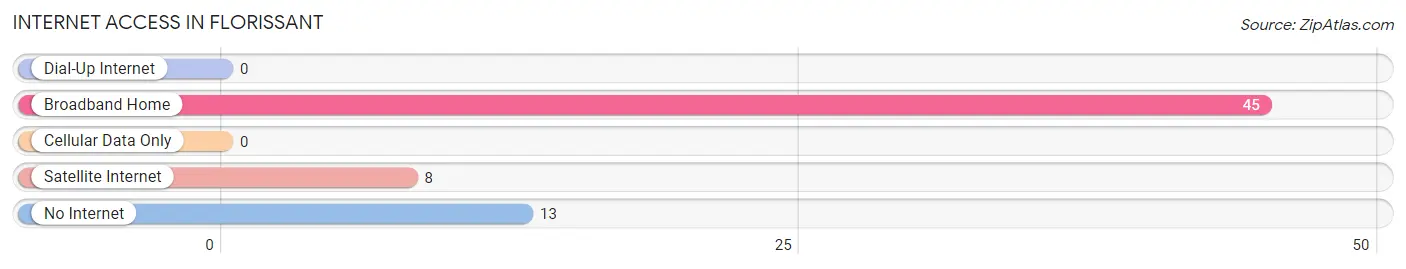
| Internet Type | # Households | % Households |
| Dial-Up Internet | 0 | 0.0% |
| Broadband Home | 45 | 77.6% |
| Cellular Data Only | 0 | 0.0% |
| Satellite Internet | 8 | 13.8% |
| No Internet | 13 | 22.4% |
| Total | 58 | 100.0% |
Florissant Summary
Floressant, Colorado is a small town located in Teller County, Colorado, United States. It is situated in the foothills of the Rocky Mountains, approximately 10 miles west of Colorado Springs. The town was founded in 1872 and is named after the nearby Florissant Fossil Beds National Monument. The town has a population of approximately 1,000 people and is known for its small-town charm and outdoor recreation opportunities.
History
The area around Florissant was first inhabited by the Ute Indians, who lived in the area for centuries before the arrival of European settlers. The first European settlers arrived in the area in the late 1860s, and the town of Florissant was officially founded in 1872. The town was named after the nearby Florissant Fossil Beds National Monument, which was established in 1969.
The town of Florissant was originally a mining town, and the area was home to several gold and silver mines. The town also had a thriving lumber industry, and the local sawmill was one of the largest in the state. The town was also home to several hotels, saloons, and other businesses.
Geography
Florissant is located in Teller County, Colorado, approximately 10 miles west of Colorado Springs. The town is situated in the foothills of the Rocky Mountains, and the area is known for its scenic beauty. The town is surrounded by mountains, forests, and meadows, and the nearby Florissant Fossil Beds National Monument is a popular tourist destination.
The town of Florissant is located at an elevation of 8,000 feet, and the climate is generally mild and dry. The average temperature in the summer is around 70 degrees Fahrenheit, and the average temperature in the winter is around 30 degrees Fahrenheit.
Economy
The economy of Florissant is largely based on tourism and outdoor recreation. The town is home to several tourist attractions, including the Florissant Fossil Beds National Monument, the Florissant Valley Historical Society, and the Florissant Valley Trail. The town is also home to several restaurants, shops, and other businesses.
The town is also home to several small businesses, including a sawmill, a lumberyard, and a general store. The town is also home to several farms, and the local farmers produce a variety of fruits and vegetables.
Demographics
As of the 2010 census, the population of Florissant was 1,000 people. The racial makeup of the town was 97.2% White, 0.7% Native American, 0.3% Asian, 0.2% from other races, and 1.6% from two or more races. The median household income in the town was $45,000, and the median family income was $50,000.
The town of Florissant is served by the Teller County School District, and the town is home to several schools, including Florissant Elementary School, Florissant Middle School, and Florissant High School. The town is also home to several churches, including the First Baptist Church of Florissant and the Church of Jesus Christ of Latter-day Saints.
Conclusion
Florissant, Colorado is a small town located in Teller County, Colorado, United States. It is situated in the foothills of the Rocky Mountains, approximately 10 miles west of Colorado Springs. The town was founded in 1872 and is named after the nearby Florissant Fossil Beds National Monument. The town has a population of approximately 1,000 people and is known for its small-town charm and outdoor recreation opportunities. The economy of Florissant is largely based on tourism and outdoor recreation, and the town is home to several tourist attractions, restaurants, shops, and other businesses. The town is also home to several small businesses, farms, and churches. The racial makeup of the town is 97.2% White, 0.7% Native American, 0.3% Asian, 0.2% from other races, and 1.6% from two or more races. The median household income in the town was $45,000, and the median family income was $50,000.
Common Questions
What is Per Capita Income in Florissant?
Per Capita income in Florissant is $23,598.
What is the Median Family Income in Florissant?
Median Family Income in Florissant is $89,135.
What is Inequality or Gini Index in Florissant?
Inequality or Gini Index in Florissant is 0.33.
What is the Total Population of Florissant?
Total Population of Florissant is 173.
What is the Total Male Population of Florissant?
Total Male Population of Florissant is 86.
What is the Total Female Population of Florissant?
Total Female Population of Florissant is 87.
What is the Ratio of Males per 100 Females in Florissant?
There are 98.85 Males per 100 Females in Florissant.
What is the Ratio of Females per 100 Males in Florissant?
There are 101.16 Females per 100 Males in Florissant.
What is the Median Population Age in Florissant?
Median Population Age in Florissant is 47.9 Years.
What is the Average Family Size in Florissant
Average Family Size in Florissant is 3.7 People.
What is the Average Household Size in Florissant
Average Household Size in Florissant is 3.0 People.
How Large is the Labor Force in Florissant?
There are 63 People in the Labor Forcein in Florissant.
What is the Percentage of People in the Labor Force in Florissant?
46.7% of People are in the Labor Force in Florissant.