Crested Butte, CO Map & Demographics
Crested Butte Map
Crested Butte Overview
$55,078
PER CAPITA INCOME
$162,596
AVG FAMILY INCOME
$67,625
AVG HOUSEHOLD INCOME
9.6%
WAGE / INCOME GAP [ % ]
90.4¢/ $1
WAGE / INCOME GAP [ $ ]
0.42
INEQUALITY / GINI INDEX
1,434
TOTAL POPULATION
797
MALE POPULATION
637
FEMALE POPULATION
125.12
MALES / 100 FEMALES
79.92
FEMALES / 100 MALES
41.5
MEDIAN AGE
3.0
AVG FAMILY SIZE
1.9
AVG HOUSEHOLD SIZE
948
LABOR FORCE [ PEOPLE ]
77.3%
PERCENT IN LABOR FORCE
6.1%
UNEMPLOYMENT RATE
Crested Butte Area Codes
Income in Crested Butte
Income Overview in Crested Butte
Per Capita Income in Crested Butte is $55,078, while median incomes of families and households are $162,596 and $67,625 respectively.
| Characteristic | Number | Measure |
| Per Capita Income | 1,434 | $55,078 |
| Median Family Income | 266 | $162,596 |
| Mean Family Income | 266 | $177,031 |
| Median Household Income | 759 | $67,625 |
| Mean Household Income | 759 | $105,164 |
| Income Deficit | 266 | $0 |
| Wage / Income Gap (%) | 1,434 | 9.58% |
| Wage / Income Gap ($) | 1,434 | 90.42¢ per $1 |
| Gini / Inequality Index | 1,434 | 0.42 |
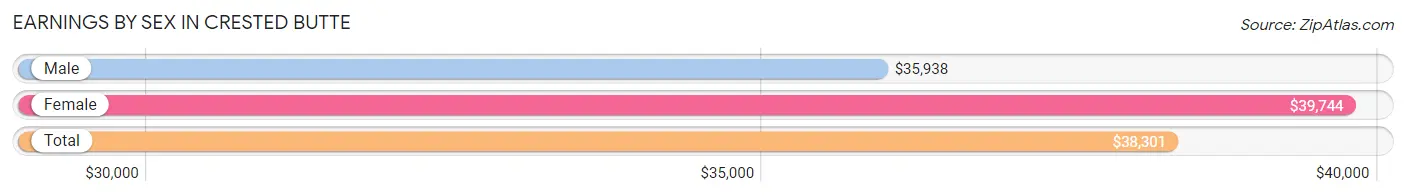
Earnings by Sex in Crested Butte
Average Earnings in Crested Butte are $38,301, $35,938 for men and $39,744 for women, a difference of 9.6%.
| Sex | Number | Average Earnings |
| Male | 587 (57.4%) | $35,938 |
| Female | 436 (42.6%) | $39,744 |
| Total | 1,023 (100.0%) | $38,301 |
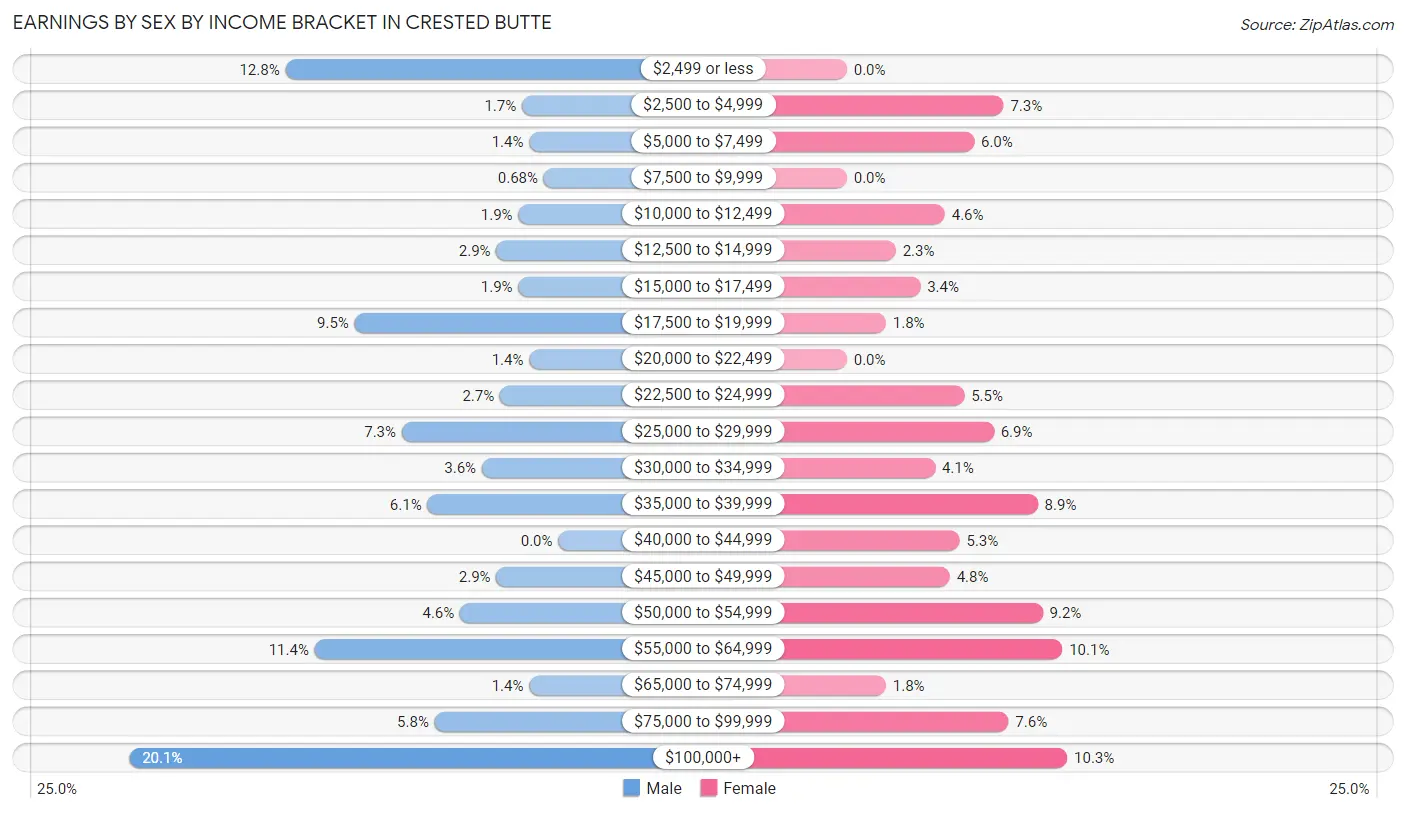
Earnings by Sex by Income Bracket in Crested Butte
The most common earnings brackets in Crested Butte are $100,000+ for men (118 | 20.1%) and $100,000+ for women (45 | 10.3%).
| Income | Male | Female |
| $2,499 or less | 75 (12.8%) | 0 (0.0%) |
| $2,500 to $4,999 | 10 (1.7%) | 32 (7.3%) |
| $5,000 to $7,499 | 8 (1.4%) | 26 (6.0%) |
| $7,500 to $9,999 | 4 (0.7%) | 0 (0.0%) |
| $10,000 to $12,499 | 11 (1.9%) | 20 (4.6%) |
| $12,500 to $14,999 | 17 (2.9%) | 10 (2.3%) |
| $15,000 to $17,499 | 11 (1.9%) | 15 (3.4%) |
| $17,500 to $19,999 | 56 (9.5%) | 8 (1.8%) |
| $20,000 to $22,499 | 8 (1.4%) | 0 (0.0%) |
| $22,500 to $24,999 | 16 (2.7%) | 24 (5.5%) |
| $25,000 to $29,999 | 43 (7.3%) | 30 (6.9%) |
| $30,000 to $34,999 | 21 (3.6%) | 18 (4.1%) |
| $35,000 to $39,999 | 36 (6.1%) | 39 (8.9%) |
| $40,000 to $44,999 | 0 (0.0%) | 23 (5.3%) |
| $45,000 to $49,999 | 17 (2.9%) | 21 (4.8%) |
| $50,000 to $54,999 | 27 (4.6%) | 40 (9.2%) |
| $55,000 to $64,999 | 67 (11.4%) | 44 (10.1%) |
| $65,000 to $74,999 | 8 (1.4%) | 8 (1.8%) |
| $75,000 to $99,999 | 34 (5.8%) | 33 (7.6%) |
| $100,000+ | 118 (20.1%) | 45 (10.3%) |
| Total | 587 (100.0%) | 436 (100.0%) |
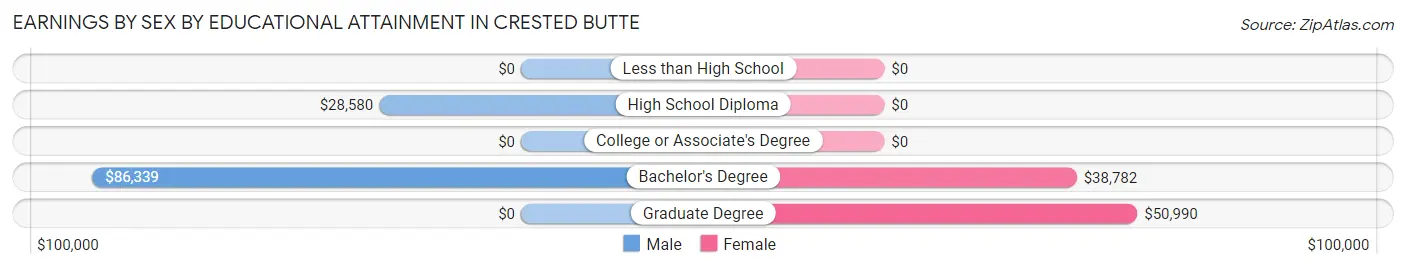
Earnings by Sex by Educational Attainment in Crested Butte
Average earnings in Crested Butte are $53,438 for men and $41,000 for women, a difference of 23.3%. Men with an educational attainment of bachelor's degree enjoy the highest average annual earnings of $86,339, while those with high school diploma education earn the least with $28,580. Women with an educational attainment of graduate degree earn the most with the average annual earnings of $50,990, while those with bachelor's degree education have the smallest earnings of $38,782.
| Educational Attainment | Male Income | Female Income |
| Less than High School | - | - |
| High School Diploma | $28,580 | $0 |
| College or Associate's Degree | - | - |
| Bachelor's Degree | $86,339 | $38,782 |
| Graduate Degree | - | - |
| Total | $53,438 | $41,000 |
Family Income in Crested Butte
Family Income Brackets in Crested Butte
According to the Crested Butte family income data, there are 94 families falling into the $200,000+ income range, which is the most common income bracket and makes up 35.3% of all families.
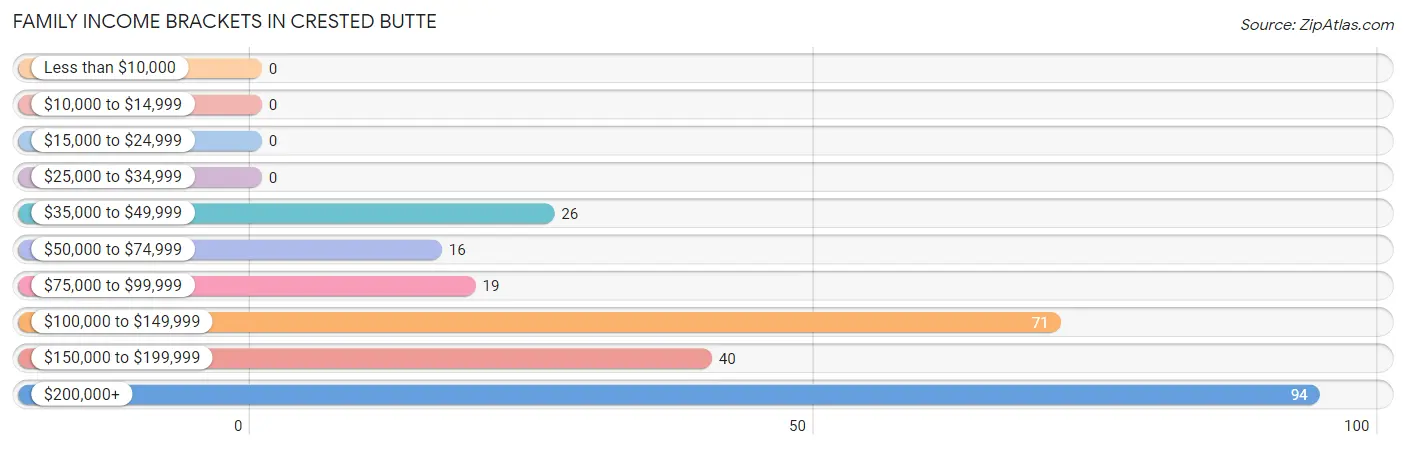
| Income Bracket | # Families | % Families |
| Less than $10,000 | 0 | 0.0% |
| $10,000 to $14,999 | 0 | 0.0% |
| $15,000 to $24,999 | 0 | 0.0% |
| $25,000 to $34,999 | 0 | 0.0% |
| $35,000 to $49,999 | 26 | 9.8% |
| $50,000 to $74,999 | 16 | 6.0% |
| $75,000 to $99,999 | 19 | 7.1% |
| $100,000 to $149,999 | 71 | 26.7% |
| $150,000 to $199,999 | 40 | 15.0% |
| $200,000+ | 94 | 35.3% |
Family Income by Famaliy Size in Crested Butte
2-person families (95 | 35.7%) account for the highest median family income in Crested Butte with $163,365 per family, while 2-person families (95 | 35.7%) have the highest median income of $81,682 per family member.
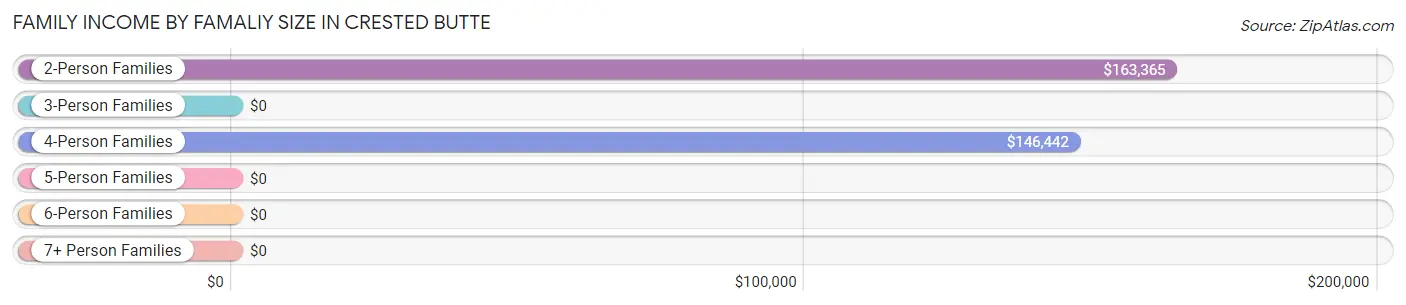
| Income Bracket | # Families | Median Income |
| 2-Person Families | 95 (35.7%) | $163,365 |
| 3-Person Families | 87 (32.7%) | $0 |
| 4-Person Families | 67 (25.2%) | $146,442 |
| 5-Person Families | 17 (6.4%) | $0 |
| 6-Person Families | 0 (0.0%) | $0 |
| 7+ Person Families | 0 (0.0%) | $0 |
| Total | 266 (100.0%) | $162,596 |
Family Income by Number of Earners in Crested Butte
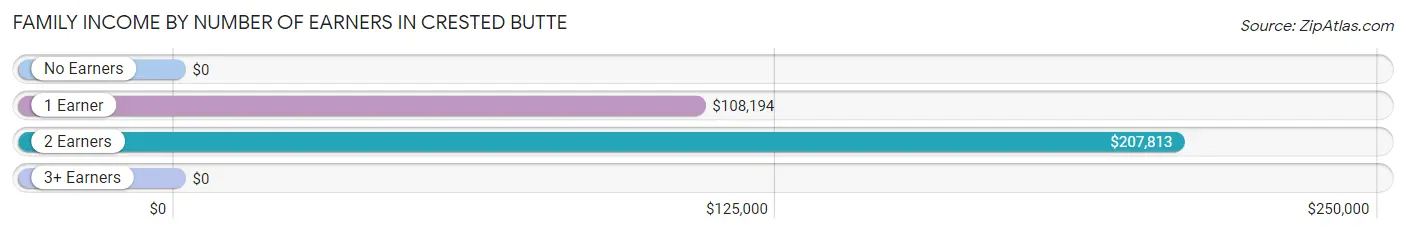
| Number of Earners | # Families | Median Income |
| No Earners | 13 (4.9%) | $0 |
| 1 Earner | 95 (35.7%) | $108,194 |
| 2 Earners | 142 (53.4%) | $207,813 |
| 3+ Earners | 16 (6.0%) | $0 |
| Total | 266 (100.0%) | $162,596 |
Household Income in Crested Butte
Household Income Brackets in Crested Butte
With 175 households falling in the category, the $50,000 to $74,999 income range is the most frequent in Crested Butte, accounting for 23.1% of all households.
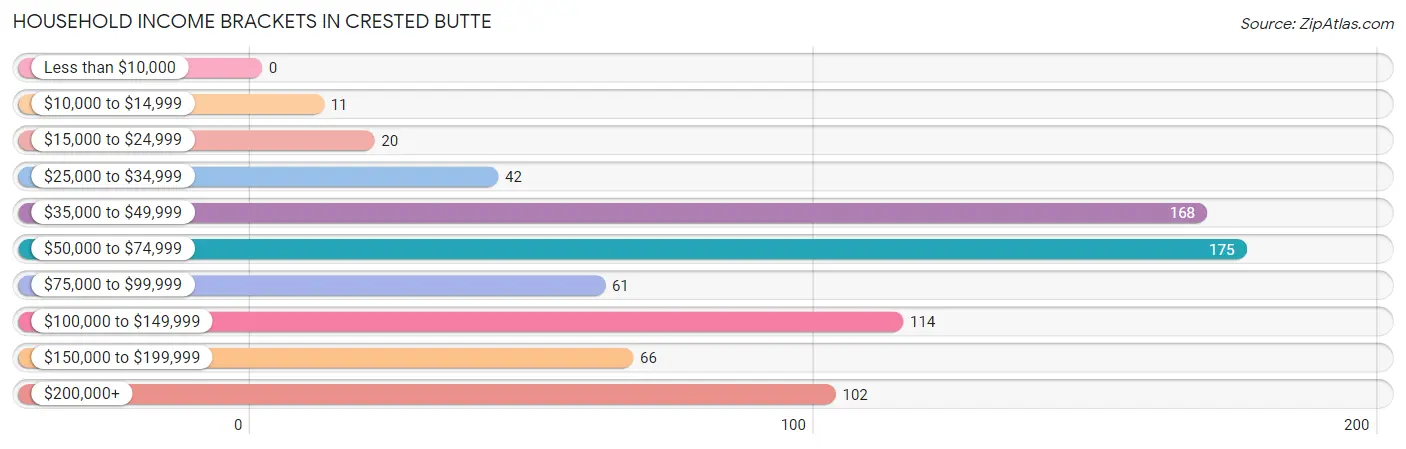
| Income Bracket | # Households | % Households |
| Less than $10,000 | 0 | 0.0% |
| $10,000 to $14,999 | 11 | 1.4% |
| $15,000 to $24,999 | 20 | 2.6% |
| $25,000 to $34,999 | 42 | 5.5% |
| $35,000 to $49,999 | 168 | 22.1% |
| $50,000 to $74,999 | 175 | 23.1% |
| $75,000 to $99,999 | 61 | 8.0% |
| $100,000 to $149,999 | 114 | 15.0% |
| $150,000 to $199,999 | 66 | 8.7% |
| $200,000+ | 102 | 13.4% |
Household Income by Householder Age in Crested Butte
The median household income in Crested Butte is $67,625, with the highest median household income of $107,778 found in the 45 to 64 years age bracket for the primary householder. A total of 344 households (45.3%) fall into this category. Meanwhile, the 15 to 24 years age bracket for the primary householder has the lowest median household income of $0, with 91 households (12.0%) in this group.
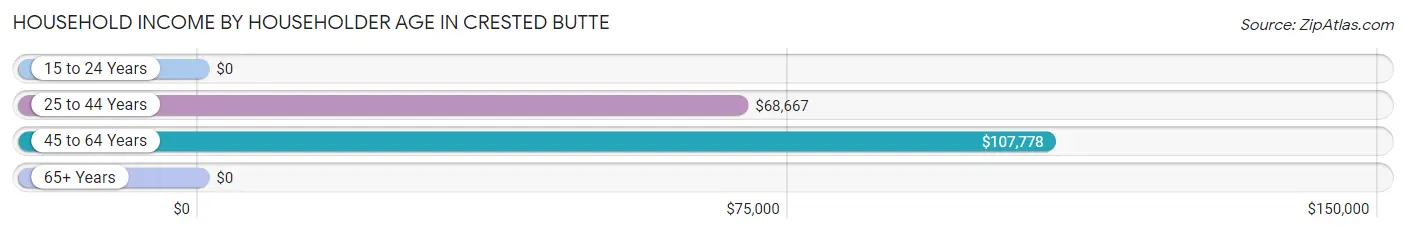
| Income Bracket | # Households | Median Income |
| 15 to 24 Years | 91 (12.0%) | $0 |
| 25 to 44 Years | 246 (32.4%) | $68,667 |
| 45 to 64 Years | 344 (45.3%) | $107,778 |
| 65+ Years | 78 (10.3%) | $0 |
| Total | 759 (100.0%) | $67,625 |
Poverty in Crested Butte
Income Below Poverty by Sex and Age in Crested Butte
With 9.0% poverty level for males and 1.6% for females among the residents of Crested Butte, 18 to 24 year old males and 35 to 44 year old females are the most vulnerable to poverty, with 49 males (45.8%) and 7 females (8.5%) in their respective age groups living below the poverty level.
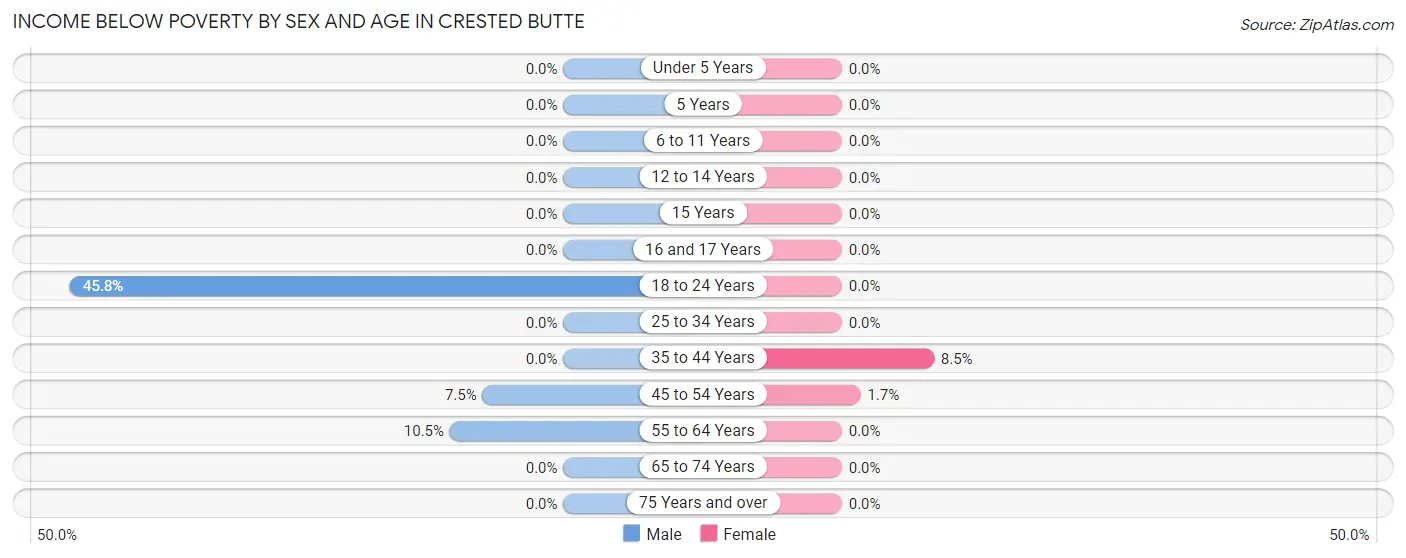
| Age Bracket | Male | Female |
| Under 5 Years | 0 (0.0%) | 0 (0.0%) |
| 5 Years | 0 (0.0%) | 0 (0.0%) |
| 6 to 11 Years | 0 (0.0%) | 0 (0.0%) |
| 12 to 14 Years | 0 (0.0%) | 0 (0.0%) |
| 15 Years | 0 (0.0%) | 0 (0.0%) |
| 16 and 17 Years | 0 (0.0%) | 0 (0.0%) |
| 18 to 24 Years | 49 (45.8%) | 0 (0.0%) |
| 25 to 34 Years | 0 (0.0%) | 0 (0.0%) |
| 35 to 44 Years | 0 (0.0%) | 7 (8.5%) |
| 45 to 54 Years | 15 (7.5%) | 3 (1.7%) |
| 55 to 64 Years | 8 (10.5%) | 0 (0.0%) |
| 65 to 74 Years | 0 (0.0%) | 0 (0.0%) |
| 75 Years and over | 0 (0.0%) | 0 (0.0%) |
| Total | 72 (9.0%) | 10 (1.6%) |
Income Above Poverty by Sex and Age in Crested Butte
According to the poverty statistics in Crested Butte, males aged under 5 years and females aged 5 years are the age groups that are most secure financially, with 100.0% of males and 100.0% of females in these age groups living above the poverty line.
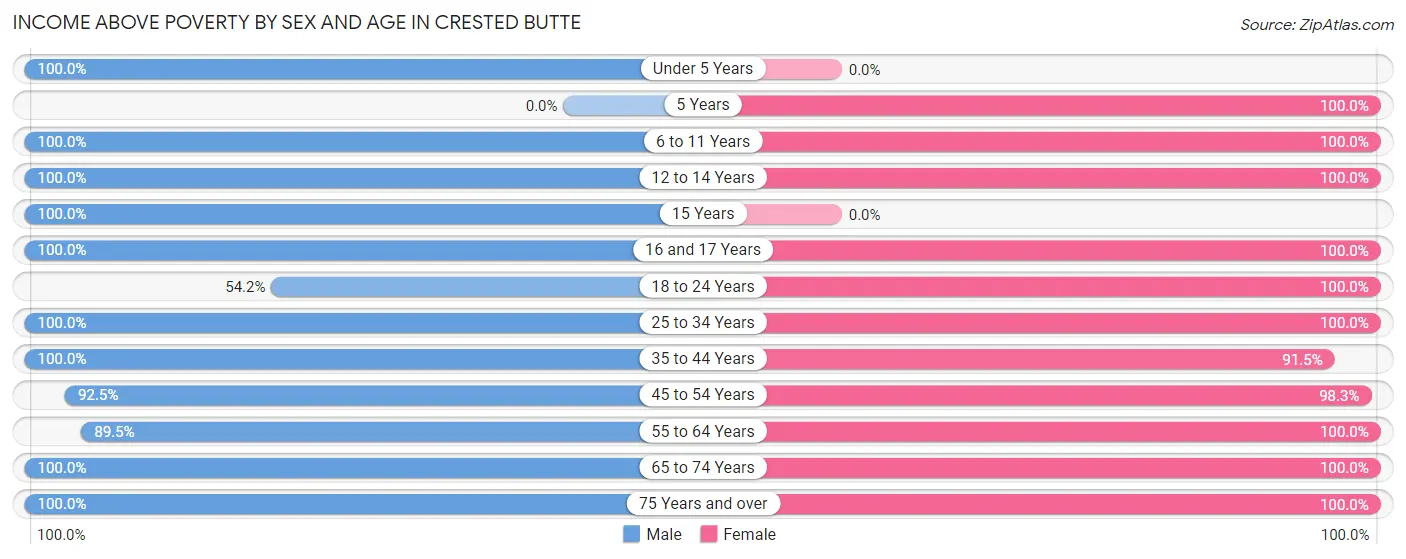
| Age Bracket | Male | Female |
| Under 5 Years | 24 (100.0%) | 0 (0.0%) |
| 5 Years | 0 (0.0%) | 11 (100.0%) |
| 6 to 11 Years | 72 (100.0%) | 49 (100.0%) |
| 12 to 14 Years | 23 (100.0%) | 17 (100.0%) |
| 15 Years | 11 (100.0%) | 0 (0.0%) |
| 16 and 17 Years | 16 (100.0%) | 67 (100.0%) |
| 18 to 24 Years | 58 (54.2%) | 35 (100.0%) |
| 25 to 34 Years | 125 (100.0%) | 104 (100.0%) |
| 35 to 44 Years | 58 (100.0%) | 75 (91.5%) |
| 45 to 54 Years | 185 (92.5%) | 170 (98.3%) |
| 55 to 64 Years | 68 (89.5%) | 54 (100.0%) |
| 65 to 74 Years | 72 (100.0%) | 35 (100.0%) |
| 75 Years and over | 13 (100.0%) | 10 (100.0%) |
| Total | 725 (91.0%) | 627 (98.4%) |
Income Below Poverty Among Married-Couple Families in Crested Butte
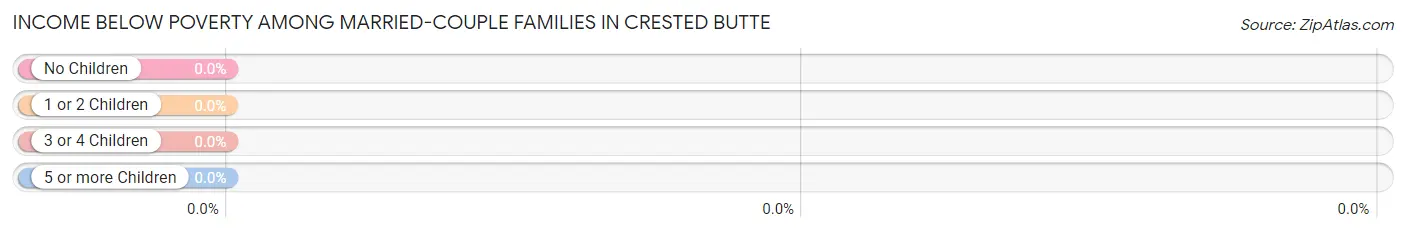
| Children | Above Poverty | Below Poverty |
| No Children | 79 (100.0%) | 0 (0.0%) |
| 1 or 2 Children | 144 (100.0%) | 0 (0.0%) |
| 3 or 4 Children | 17 (100.0%) | 0 (0.0%) |
| 5 or more Children | 0 (0.0%) | 0 (0.0%) |
| Total | 240 (100.0%) | 0 (0.0%) |
Income Below Poverty Among Single-Parent Households in Crested Butte
| Children | Single Father | Single Mother |
| No Children | 0 (0.0%) | 0 (0.0%) |
| 1 or 2 Children | 0 (0.0%) | 0 (0.0%) |
| 3 or 4 Children | 0 (0.0%) | 0 (0.0%) |
| 5 or more Children | 0 (0.0%) | 0 (0.0%) |
| Total | 0 (0.0%) | 0 (0.0%) |
Income Below Poverty Among Married-Couple vs Single-Parent Households in Crested Butte
| Children | Married-Couple Families | Single-Parent Households |
| No Children | 0 (0.0%) | 0 (0.0%) |
| 1 or 2 Children | 0 (0.0%) | 0 (0.0%) |
| 3 or 4 Children | 0 (0.0%) | 0 (0.0%) |
| 5 or more Children | 0 (0.0%) | 0 (0.0%) |
| Total | 0 (0.0%) | 0 (0.0%) |
Race in Crested Butte
The most populous races in Crested Butte are White / Caucasian (1,401 | 97.7%), Hispanic or Latino (73 | 5.1%), and Two or more Races (30 | 2.1%).
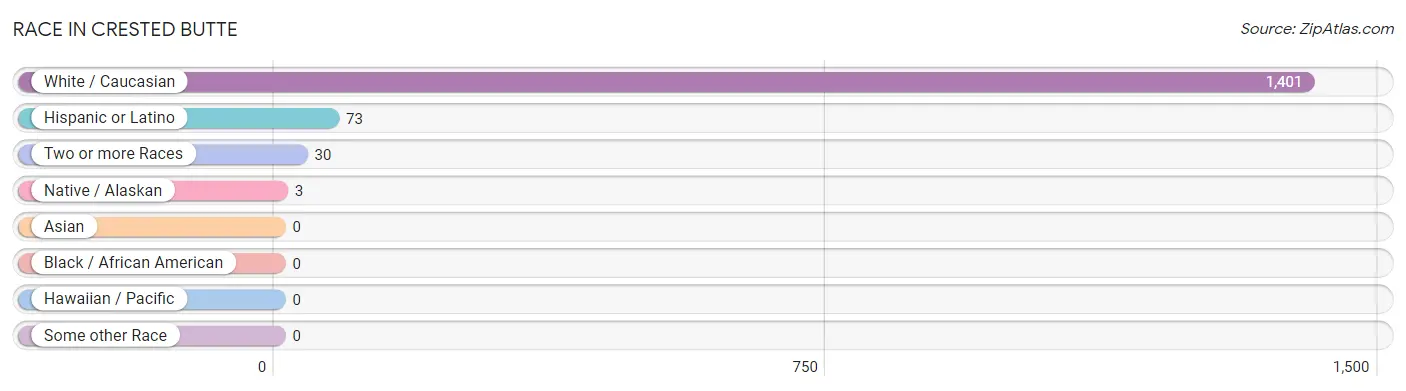
| Race | # Population | % Population |
| Asian | 0 | 0.0% |
| Black / African American | 0 | 0.0% |
| Hawaiian / Pacific | 0 | 0.0% |
| Hispanic or Latino | 73 | 5.1% |
| Native / Alaskan | 3 | 0.2% |
| White / Caucasian | 1,401 | 97.7% |
| Two or more Races | 30 | 2.1% |
| Some other Race | 0 | 0.0% |
| Total | 1,434 | 100.0% |
Ancestry in Crested Butte
The most populous ancestries reported in Crested Butte are German (406 | 28.3%), Irish (295 | 20.6%), English (235 | 16.4%), Norwegian (115 | 8.0%), and French (75 | 5.2%), together accounting for 78.5% of all Crested Butte residents.
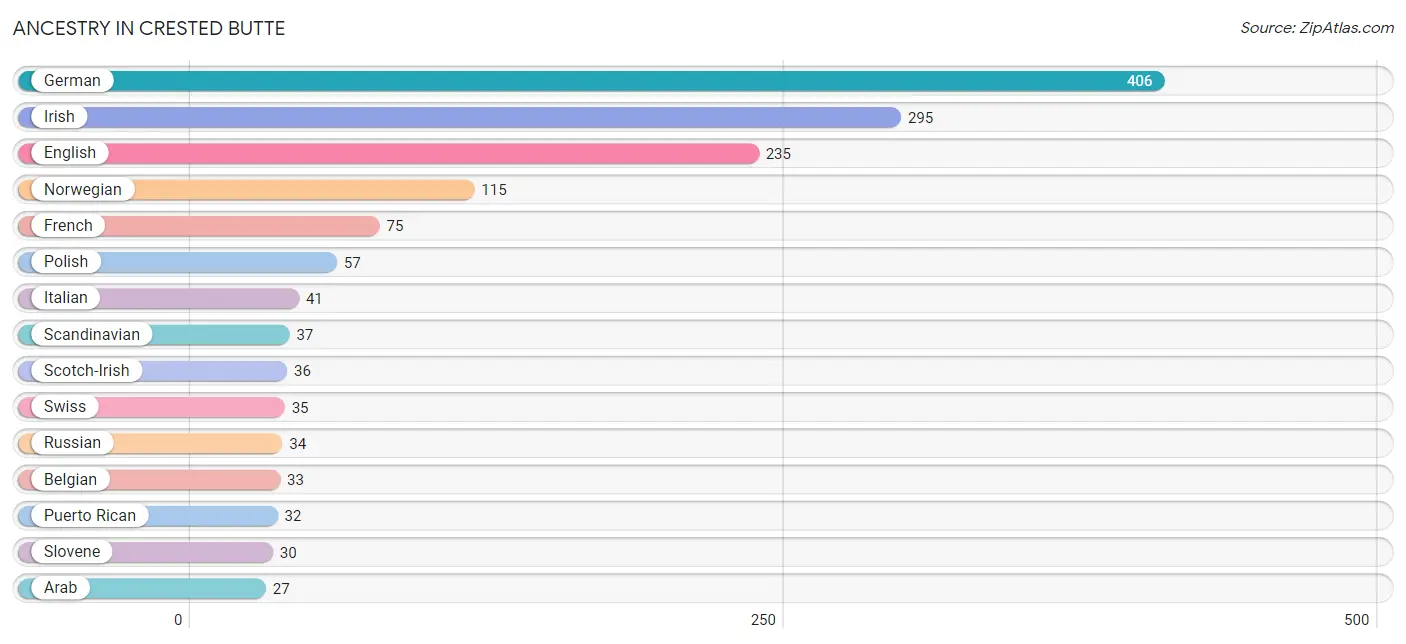
| Ancestry | # Population | % Population |
| American | 12 | 0.8% |
| Arab | 27 | 1.9% |
| Austrian | 21 | 1.5% |
| Belgian | 33 | 2.3% |
| Dutch | 8 | 0.6% |
| English | 235 | 16.4% |
| French | 75 | 5.2% |
| German | 406 | 28.3% |
| Greek | 5 | 0.4% |
| Hopi | 3 | 0.2% |
| Irish | 295 | 20.6% |
| Italian | 41 | 2.9% |
| Lebanese | 27 | 1.9% |
| Mexican | 25 | 1.7% |
| Northern European | 13 | 0.9% |
| Norwegian | 115 | 8.0% |
| Polish | 57 | 4.0% |
| Puerto Rican | 32 | 2.2% |
| Russian | 34 | 2.4% |
| Scandinavian | 37 | 2.6% |
| Scotch-Irish | 36 | 2.5% |
| Scottish | 16 | 1.1% |
| Slovene | 30 | 2.1% |
| Spaniard | 16 | 1.1% |
| Swedish | 25 | 1.7% |
| Swiss | 35 | 2.4% |
| Welsh | 10 | 0.7% | View All 27 Rows |
Immigrants in Crested Butte
The most numerous immigrant groups reported in Crested Butte came from Europe (18 | 1.3%), England (10 | 0.7%), Northern Europe (10 | 0.7%), Southern Europe (8 | 0.6%), and Spain (8 | 0.6%), together accounting for 3.8% of all Crested Butte residents.
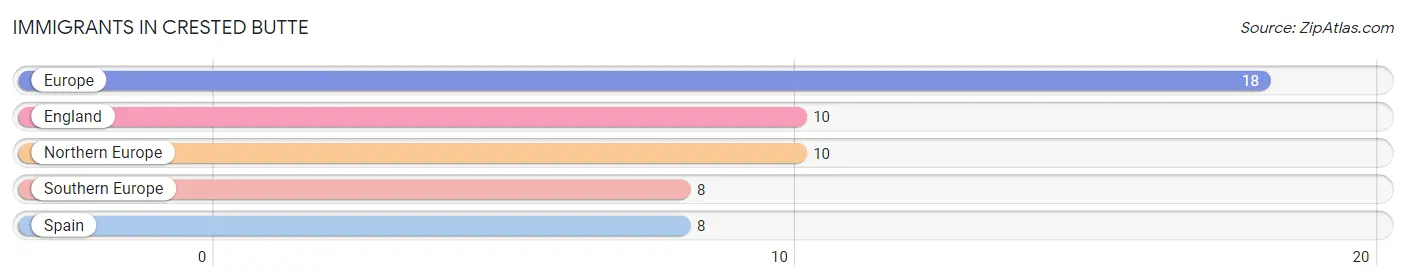
| Immigration Origin | # Population | % Population |
| England | 10 | 0.7% |
| Europe | 18 | 1.3% |
| Northern Europe | 10 | 0.7% |
| Southern Europe | 8 | 0.6% |
| Spain | 8 | 0.6% | View All 5 Rows |
Sex and Age in Crested Butte
Sex and Age in Crested Butte
The most populous age groups in Crested Butte are 45 to 49 Years (155 | 19.5%) for men and 50 to 54 Years (124 | 19.5%) for women.
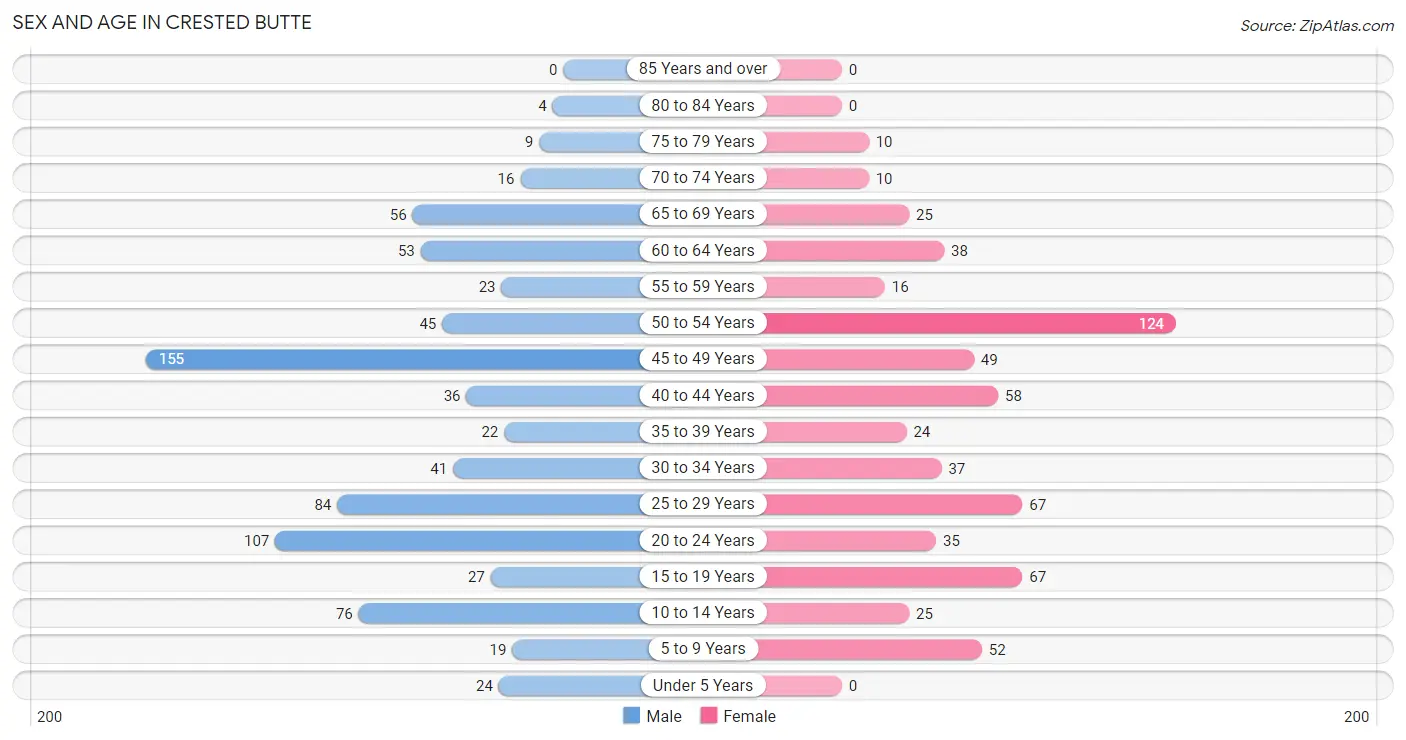
| Age Bracket | Male | Female |
| Under 5 Years | 24 (3.0%) | 0 (0.0%) |
| 5 to 9 Years | 19 (2.4%) | 52 (8.2%) |
| 10 to 14 Years | 76 (9.5%) | 25 (3.9%) |
| 15 to 19 Years | 27 (3.4%) | 67 (10.5%) |
| 20 to 24 Years | 107 (13.4%) | 35 (5.5%) |
| 25 to 29 Years | 84 (10.5%) | 67 (10.5%) |
| 30 to 34 Years | 41 (5.1%) | 37 (5.8%) |
| 35 to 39 Years | 22 (2.8%) | 24 (3.8%) |
| 40 to 44 Years | 36 (4.5%) | 58 (9.1%) |
| 45 to 49 Years | 155 (19.5%) | 49 (7.7%) |
| 50 to 54 Years | 45 (5.7%) | 124 (19.5%) |
| 55 to 59 Years | 23 (2.9%) | 16 (2.5%) |
| 60 to 64 Years | 53 (6.7%) | 38 (6.0%) |
| 65 to 69 Years | 56 (7.0%) | 25 (3.9%) |
| 70 to 74 Years | 16 (2.0%) | 10 (1.6%) |
| 75 to 79 Years | 9 (1.1%) | 10 (1.6%) |
| 80 to 84 Years | 4 (0.5%) | 0 (0.0%) |
| 85 Years and over | 0 (0.0%) | 0 (0.0%) |
| Total | 797 (100.0%) | 637 (100.0%) |
Families and Households in Crested Butte
Median Family Size in Crested Butte
The median family size in Crested Butte is 3.00 persons per family, with single male/father families (10 | 3.8%) accounting for the largest median family size of 3.6 persons per family. On the other hand, single female/mother families (16 | 6.0%) represent the smallest median family size with 1.81 persons per family.
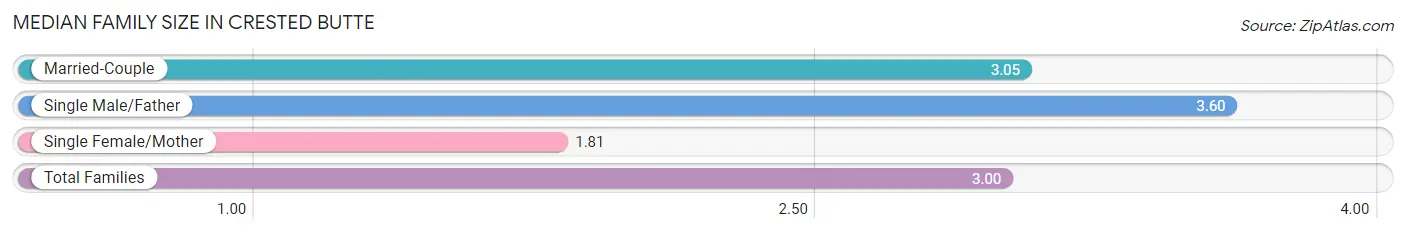
| Family Type | # Families | Family Size |
| Married-Couple | 240 (90.2%) | 3.05 |
| Single Male/Father | 10 (3.8%) | 3.60 |
| Single Female/Mother | 16 (6.0%) | 1.81 |
| Total Families | 266 (100.0%) | 3.00 |
Median Household Size in Crested Butte
The median household size in Crested Butte is 1.89 persons per household, with single male/father households (10 | 1.3%) accounting for the largest median household size of 4.4 persons per household. non-family households (493 | 64.9%) represent the smallest median household size with 1.26 persons per household.
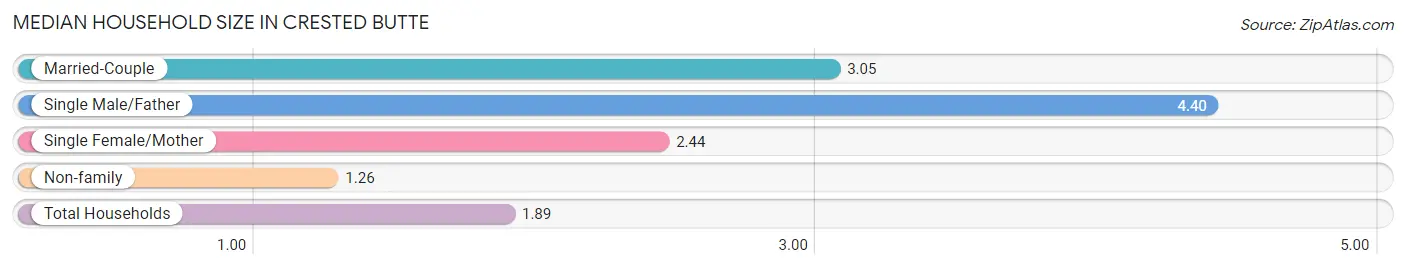
| Household Type | # Households | Household Size |
| Married-Couple | 240 (31.6%) | 3.05 |
| Single Male/Father | 10 (1.3%) | 4.40 |
| Single Female/Mother | 16 (2.1%) | 2.44 |
| Non-family | 493 (64.9%) | 1.26 |
| Total Households | 759 (100.0%) | 1.89 |
Household Size by Marriage Status in Crested Butte
Out of a total of 759 households in Crested Butte, 266 (35.0%) are family households, while 493 (64.9%) are nonfamily households. The most numerous type of family households are 3-person households, comprising 97, and the most common type of nonfamily households are 1-person households, comprising 276.
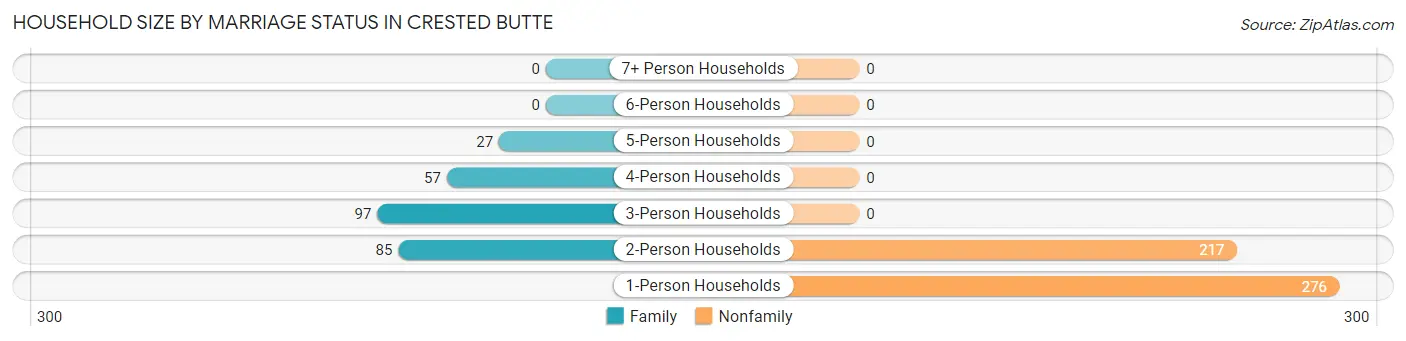
| Household Size | Family Households | Nonfamily Households |
| 1-Person Households | - | 276 (36.4%) |
| 2-Person Households | 85 (11.2%) | 217 (28.6%) |
| 3-Person Households | 97 (12.8%) | 0 (0.0%) |
| 4-Person Households | 57 (7.5%) | 0 (0.0%) |
| 5-Person Households | 27 (3.6%) | 0 (0.0%) |
| 6-Person Households | 0 (0.0%) | 0 (0.0%) |
| 7+ Person Households | 0 (0.0%) | 0 (0.0%) |
| Total | 266 (35.0%) | 493 (64.9%) |
Female Fertility in Crested Butte
Fertility by Age in Crested Butte
Average fertility rate in Crested Butte is 57.0 births per 1,000 women. Women in the age bracket of 20 to 34 years have the highest fertility rate with 158.0 births per 1,000 women. Women in the age bracket of 20 to 34 years acount for 100.0% of all women with births.
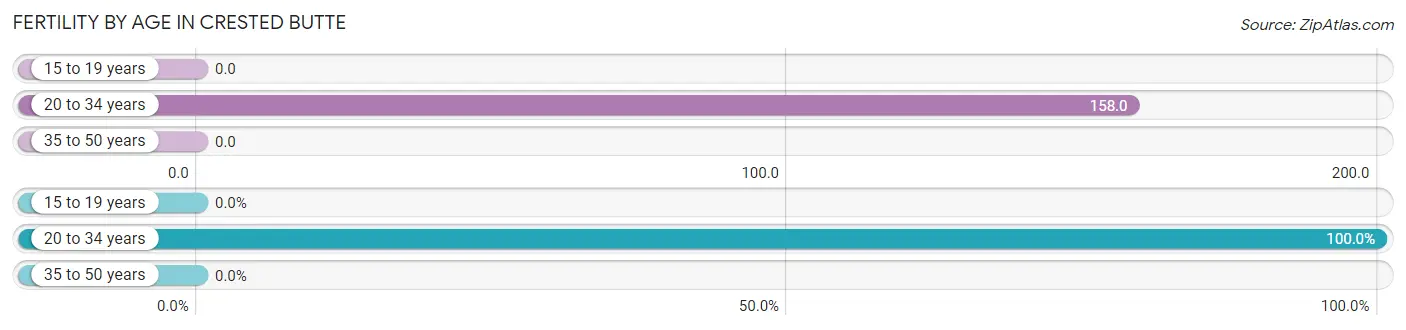
| Age Bracket | Women with Births | Births / 1,000 Women |
| 15 to 19 years | 0 (0.0%) | 0.0 |
| 20 to 34 years | 22 (100.0%) | 158.0 |
| 35 to 50 years | 0 (0.0%) | 0.0 |
| Total | 22 (100.0%) | 57.0 |
Fertility by Age by Marriage Status in Crested Butte
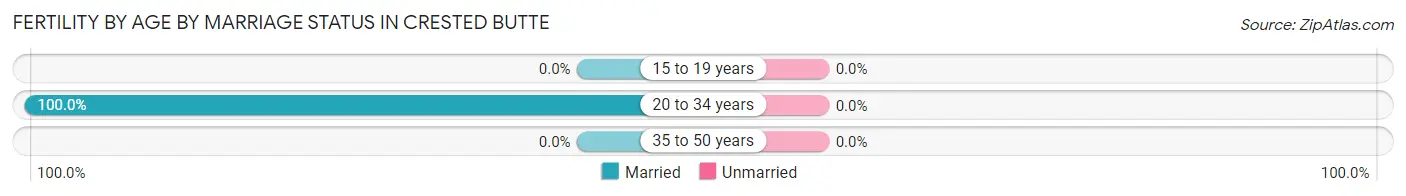
| Age Bracket | Married | Unmarried |
| 15 to 19 years | 0 (0.0%) | 0 (0.0%) |
| 20 to 34 years | 22 (100.0%) | 0 (0.0%) |
| 35 to 50 years | 0 (0.0%) | 0 (0.0%) |
| Total | 22 (100.0%) | 0 (0.0%) |
Fertility by Education in Crested Butte
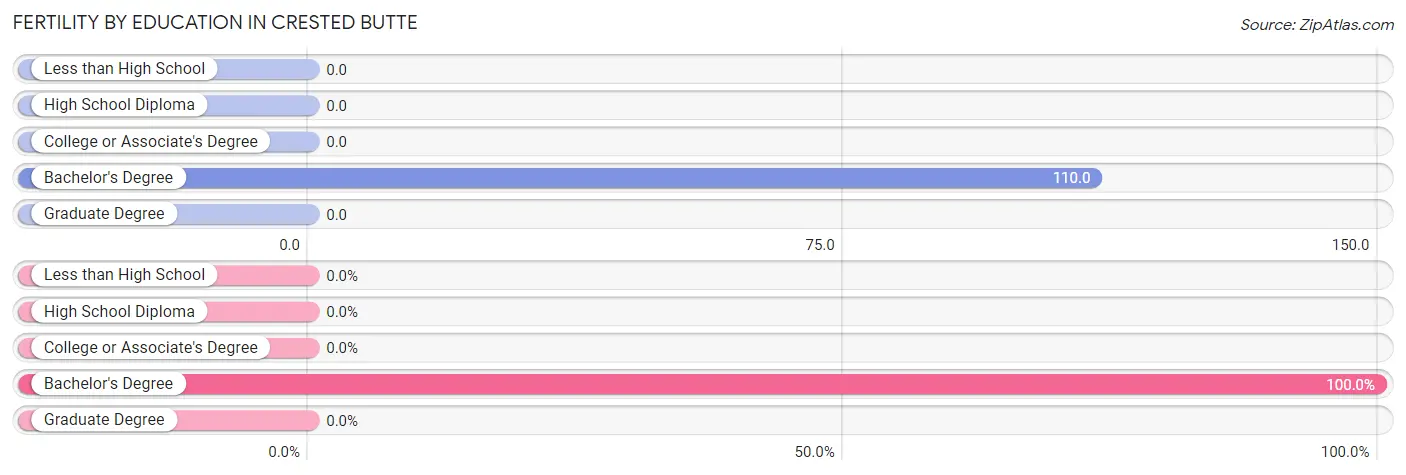
| Educational Attainment | Women with Births | Births / 1,000 Women |
| Less than High School | 0 (0.0%) | 0.0 |
| High School Diploma | 0 (0.0%) | 0.0 |
| College or Associate's Degree | 0 (0.0%) | 0.0 |
| Bachelor's Degree | 22 (100.0%) | 110.0 |
| Graduate Degree | 0 (0.0%) | 0.0 |
| Total | 22 (100.0%) | 57.0 |
Fertility by Education by Marriage Status in Crested Butte
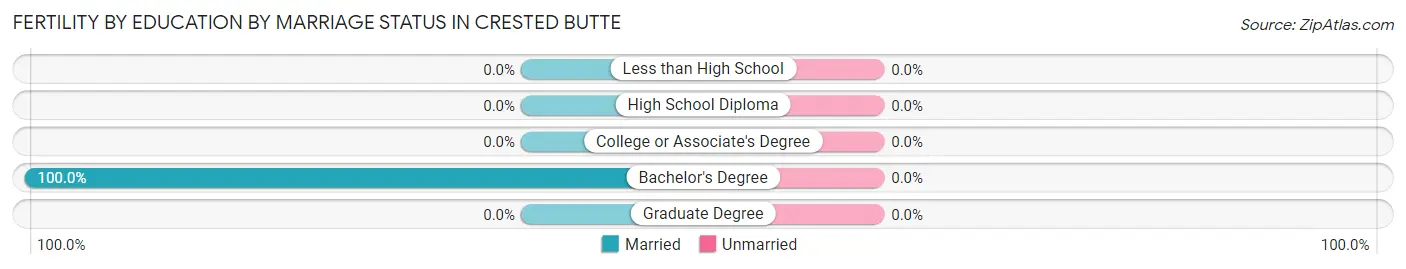
| Educational Attainment | Married | Unmarried |
| Less than High School | 0 (0.0%) | 0 (0.0%) |
| High School Diploma | 0 (0.0%) | 0 (0.0%) |
| College or Associate's Degree | 0 (0.0%) | 0 (0.0%) |
| Bachelor's Degree | 22 (100.0%) | 0 (0.0%) |
| Graduate Degree | 0 (0.0%) | 0 (0.0%) |
| Total | 22 (100.0%) | 0 (0.0%) |
Employment Characteristics in Crested Butte
Employment by Class of Employer in Crested Butte
Among the 808 employed individuals in Crested Butte, private company employees (415 | 51.4%), self-employed (not incorporated) (114 | 14.1%), and self-employed (incorporated) (110 | 13.6%) make up the most common classes of employment.
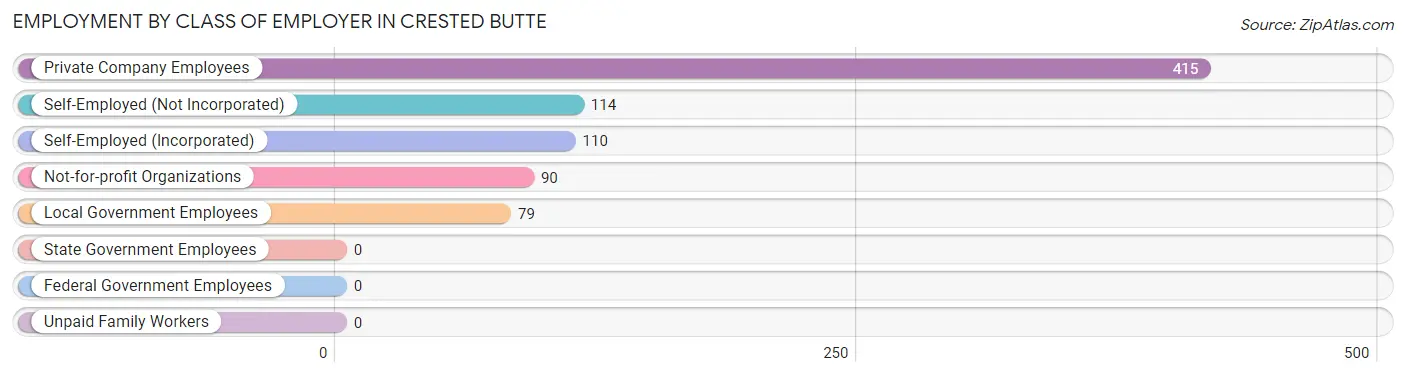
| Employer Class | # Employees | % Employees |
| Private Company Employees | 415 | 51.4% |
| Self-Employed (Incorporated) | 110 | 13.6% |
| Self-Employed (Not Incorporated) | 114 | 14.1% |
| Not-for-profit Organizations | 90 | 11.1% |
| Local Government Employees | 79 | 9.8% |
| State Government Employees | 0 | 0.0% |
| Federal Government Employees | 0 | 0.0% |
| Unpaid Family Workers | 0 | 0.0% |
| Total | 808 | 100.0% |
Employment Status by Age in Crested Butte
According to the labor force statistics for Crested Butte, out of the total population over 16 years of age (1,227), 77.3% or 948 individuals are in the labor force, with 6.1% or 58 of them unemployed. The age group with the highest labor force participation rate is 25 to 29 years, with 100.0% or 151 individuals in the labor force. Within the labor force, the 65 to 74 years age range has the highest percentage of unemployed individuals, with 39.0% or 16 of them being unemployed.
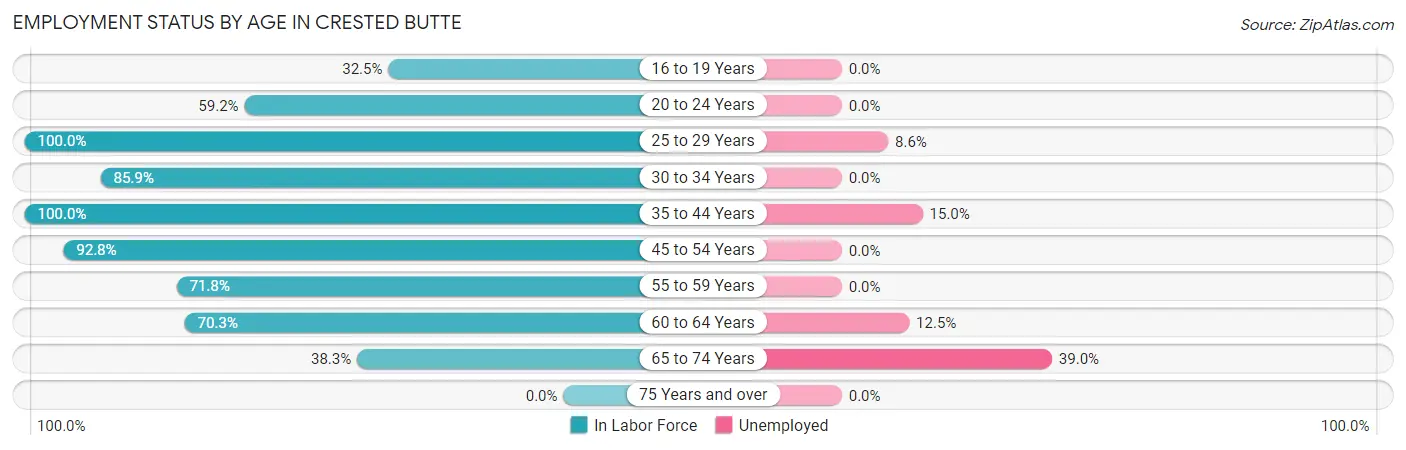
| Age Bracket | In Labor Force | Unemployed |
| 16 to 19 Years | 27 (32.5%) | 0 (0.0%) |
| 20 to 24 Years | 84 (59.2%) | 0 (0.0%) |
| 25 to 29 Years | 151 (100.0%) | 13 (8.6%) |
| 30 to 34 Years | 67 (85.9%) | 0 (0.0%) |
| 35 to 44 Years | 140 (100.0%) | 21 (15.0%) |
| 45 to 54 Years | 346 (92.8%) | 0 (0.0%) |
| 55 to 59 Years | 28 (71.8%) | 0 (0.0%) |
| 60 to 64 Years | 64 (70.3%) | 8 (12.5%) |
| 65 to 74 Years | 41 (38.3%) | 16 (39.0%) |
| 75 Years and over | 0 (0.0%) | 0 (0.0%) |
| Total | 948 (77.3%) | 58 (6.1%) |
Employment Status by Educational Attainment in Crested Butte
According to labor force statistics for Crested Butte, 91.3% of individuals (796) out of the total population between 25 and 64 years of age (872) are in the labor force, with 5.3% or 42 of them being unemployed. The group with the highest labor force participation rate are those with the educational attainment of less than high school, with 100.0% or 8 individuals in the labor force. Within the labor force, individuals with bachelor's degree or higher education have the highest percentage of unemployment, with 7.1% or 42 of them being unemployed.
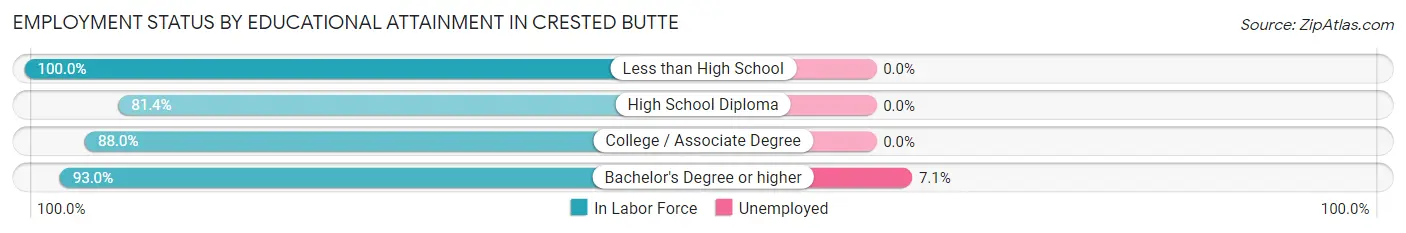
| Educational Attainment | In Labor Force | Unemployed |
| Less than High School | 8 (100.0%) | 0 (0.0%) |
| High School Diploma | 48 (81.4%) | 0 (0.0%) |
| College / Associate Degree | 146 (88.0%) | 0 (0.0%) |
| Bachelor's Degree or higher | 594 (93.0%) | 45 (7.1%) |
| Total | 796 (91.3%) | 46 (5.3%) |
Employment Occupations by Sex in Crested Butte
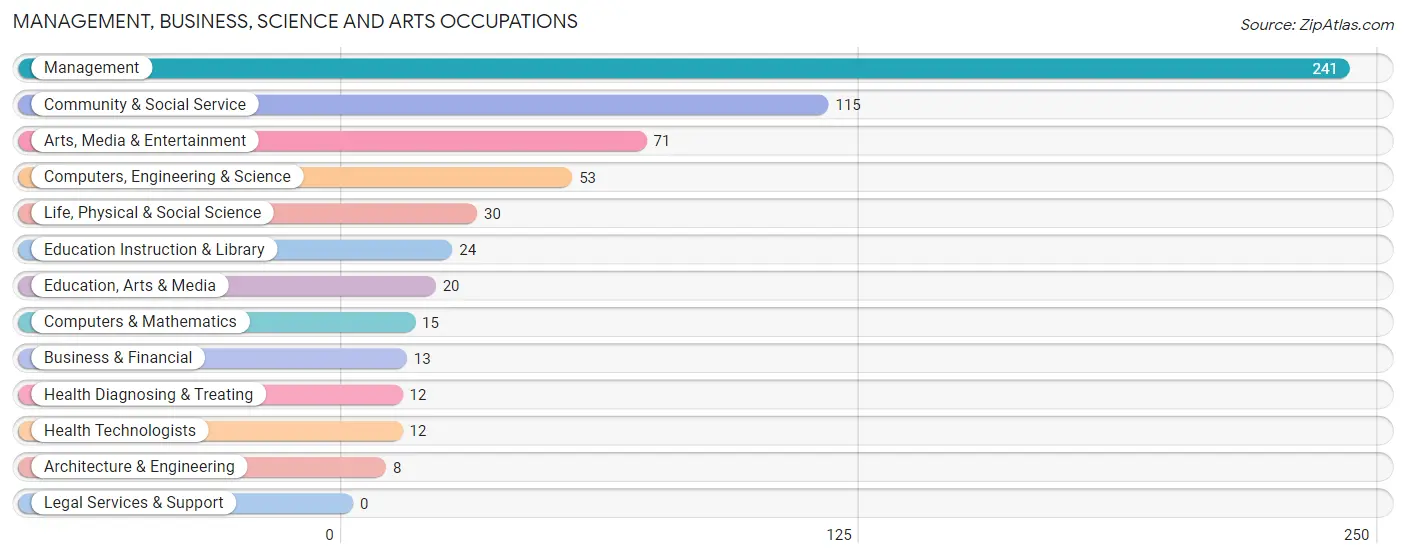
Management, Business, Science and Arts Occupations
The most common Management, Business, Science and Arts occupations in Crested Butte are Management (241 | 27.1%), Community & Social Service (115 | 12.9%), Arts, Media & Entertainment (71 | 8.0%), Computers, Engineering & Science (53 | 6.0%), and Life, Physical & Social Science (30 | 3.4%).
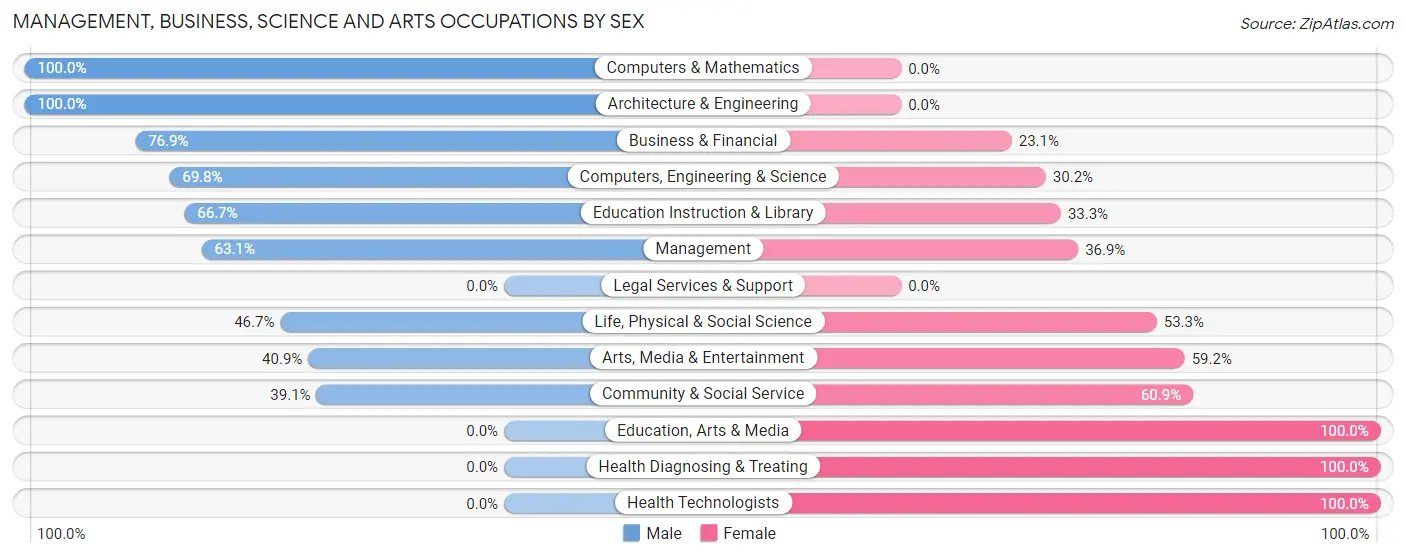
Management, Business, Science and Arts Occupations by Sex
Within the Management, Business, Science and Arts occupations in Crested Butte, the most male-oriented occupations are Computers & Mathematics (100.0%), Architecture & Engineering (100.0%), and Business & Financial (76.9%), while the most female-oriented occupations are Education, Arts & Media (100.0%), Health Diagnosing & Treating (100.0%), and Health Technologists (100.0%).
| Occupation | Male | Female |
| Management | 152 (63.1%) | 89 (36.9%) |
| Business & Financial | 10 (76.9%) | 3 (23.1%) |
| Computers, Engineering & Science | 37 (69.8%) | 16 (30.2%) |
| Computers & Mathematics | 15 (100.0%) | 0 (0.0%) |
| Architecture & Engineering | 8 (100.0%) | 0 (0.0%) |
| Life, Physical & Social Science | 14 (46.7%) | 16 (53.3%) |
| Community & Social Service | 45 (39.1%) | 70 (60.9%) |
| Education, Arts & Media | 0 (0.0%) | 20 (100.0%) |
| Legal Services & Support | 0 (0.0%) | 0 (0.0%) |
| Education Instruction & Library | 16 (66.7%) | 8 (33.3%) |
| Arts, Media & Entertainment | 29 (40.8%) | 42 (59.2%) |
| Health Diagnosing & Treating | 0 (0.0%) | 12 (100.0%) |
| Health Technologists | 0 (0.0%) | 12 (100.0%) |
| Total (Category) | 244 (56.2%) | 190 (43.8%) |
| Total (Overall) | 467 (52.5%) | 423 (47.5%) |
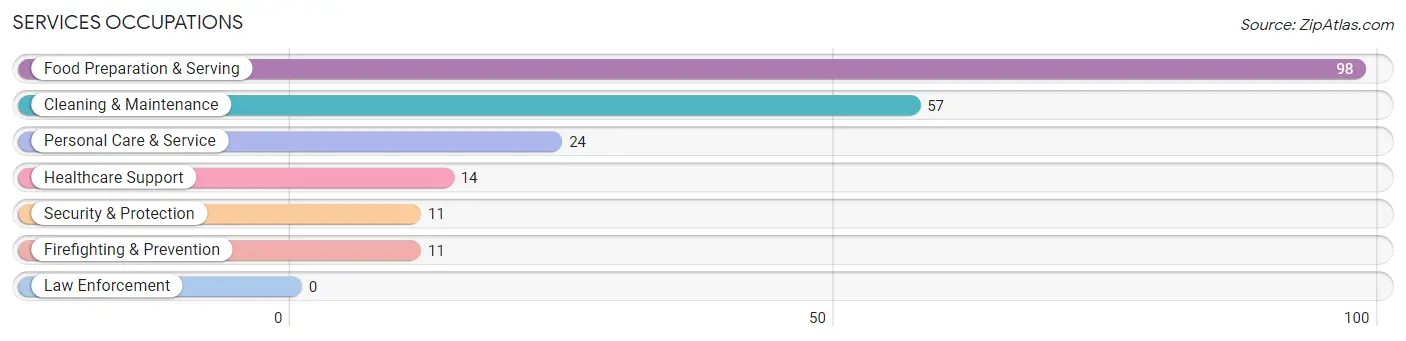
Services Occupations
The most common Services occupations in Crested Butte are Food Preparation & Serving (98 | 11.0%), Cleaning & Maintenance (57 | 6.4%), Personal Care & Service (24 | 2.7%), Healthcare Support (14 | 1.6%), and Security & Protection (11 | 1.2%).
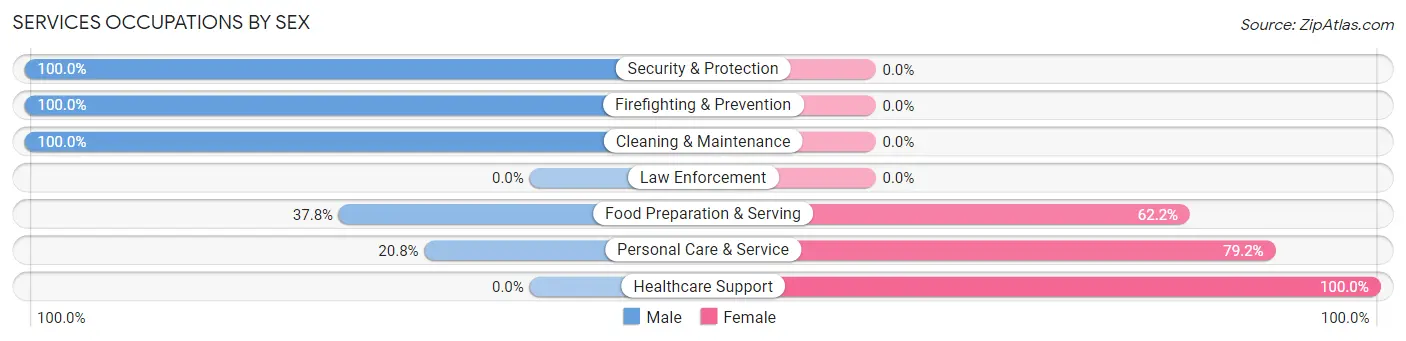
Services Occupations by Sex
Within the Services occupations in Crested Butte, the most male-oriented occupations are Security & Protection (100.0%), Firefighting & Prevention (100.0%), and Cleaning & Maintenance (100.0%), while the most female-oriented occupations are Healthcare Support (100.0%), Personal Care & Service (79.2%), and Food Preparation & Serving (62.2%).
| Occupation | Male | Female |
| Healthcare Support | 0 (0.0%) | 14 (100.0%) |
| Security & Protection | 11 (100.0%) | 0 (0.0%) |
| Firefighting & Prevention | 11 (100.0%) | 0 (0.0%) |
| Law Enforcement | 0 (0.0%) | 0 (0.0%) |
| Food Preparation & Serving | 37 (37.8%) | 61 (62.2%) |
| Cleaning & Maintenance | 57 (100.0%) | 0 (0.0%) |
| Personal Care & Service | 5 (20.8%) | 19 (79.2%) |
| Total (Category) | 110 (53.9%) | 94 (46.1%) |
| Total (Overall) | 467 (52.5%) | 423 (47.5%) |
Sales and Office Occupations
The most common Sales and Office occupations in Crested Butte are Office & Administration (77 | 8.6%), and Sales & Related (73 | 8.2%).
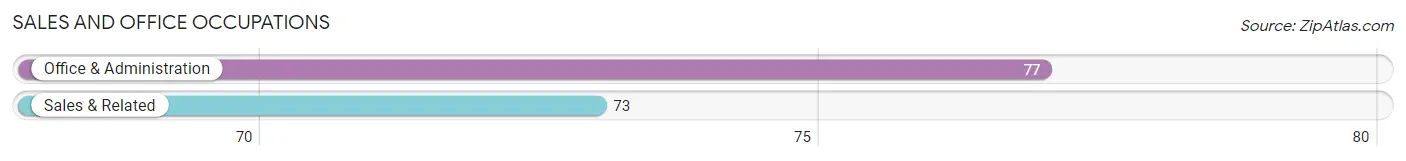
Sales and Office Occupations by Sex
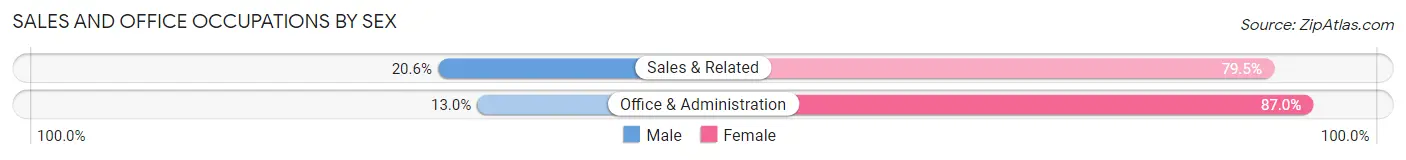
| Occupation | Male | Female |
| Sales & Related | 15 (20.5%) | 58 (79.4%) |
| Office & Administration | 10 (13.0%) | 67 (87.0%) |
| Total (Category) | 25 (16.7%) | 125 (83.3%) |
| Total (Overall) | 467 (52.5%) | 423 (47.5%) |
Natural Resources, Construction and Maintenance Occupations
The most common Natural Resources, Construction and Maintenance occupations in Crested Butte are Construction & Extraction (53 | 6.0%), and Installation, Maintenance & Repair (3 | 0.3%).
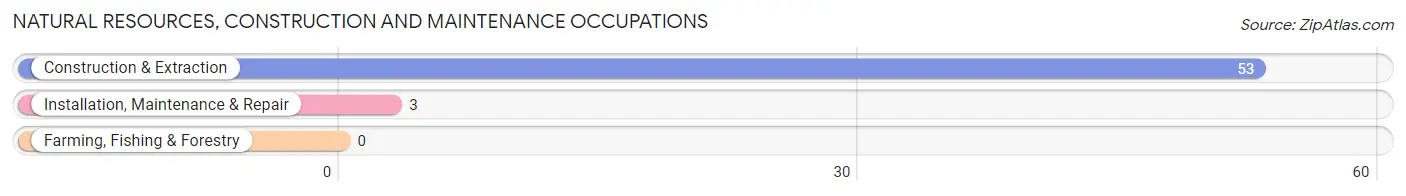
Natural Resources, Construction and Maintenance Occupations by Sex
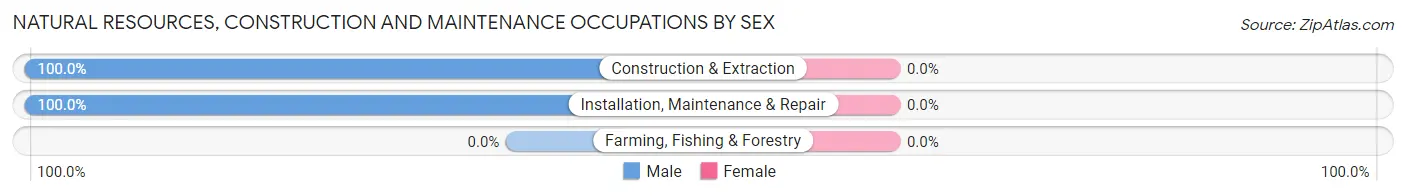
| Occupation | Male | Female |
| Farming, Fishing & Forestry | 0 (0.0%) | 0 (0.0%) |
| Construction & Extraction | 53 (100.0%) | 0 (0.0%) |
| Installation, Maintenance & Repair | 3 (100.0%) | 0 (0.0%) |
| Total (Category) | 56 (100.0%) | 0 (0.0%) |
| Total (Overall) | 467 (52.5%) | 423 (47.5%) |
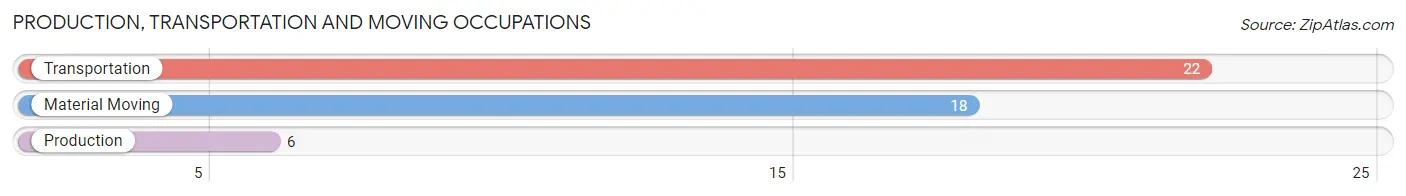
Production, Transportation and Moving Occupations
The most common Production, Transportation and Moving occupations in Crested Butte are Transportation (22 | 2.5%), Material Moving (18 | 2.0%), and Production (6 | 0.7%).
Production, Transportation and Moving Occupations by Sex
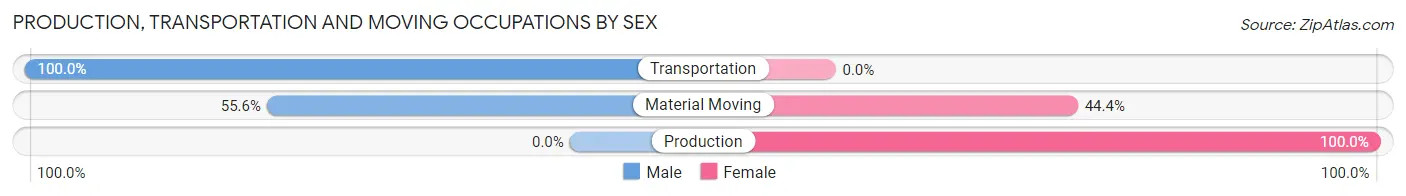
| Occupation | Male | Female |
| Production | 0 (0.0%) | 6 (100.0%) |
| Transportation | 22 (100.0%) | 0 (0.0%) |
| Material Moving | 10 (55.6%) | 8 (44.4%) |
| Total (Category) | 32 (69.6%) | 14 (30.4%) |
| Total (Overall) | 467 (52.5%) | 423 (47.5%) |
Employment Industries by Sex in Crested Butte
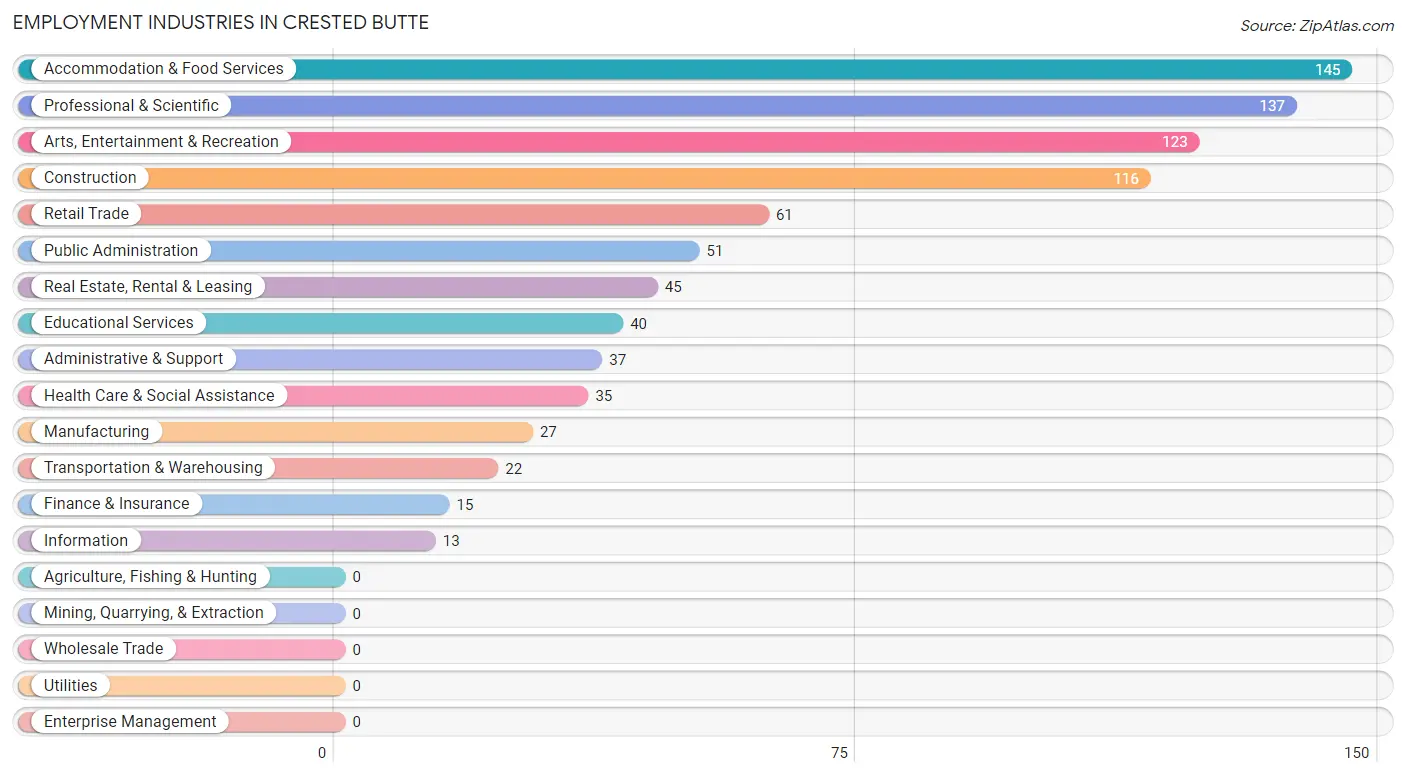
Employment Industries in Crested Butte
The major employment industries in Crested Butte include Accommodation & Food Services (145 | 16.3%), Professional & Scientific (137 | 15.4%), Arts, Entertainment & Recreation (123 | 13.8%), Construction (116 | 13.0%), and Retail Trade (61 | 6.9%).
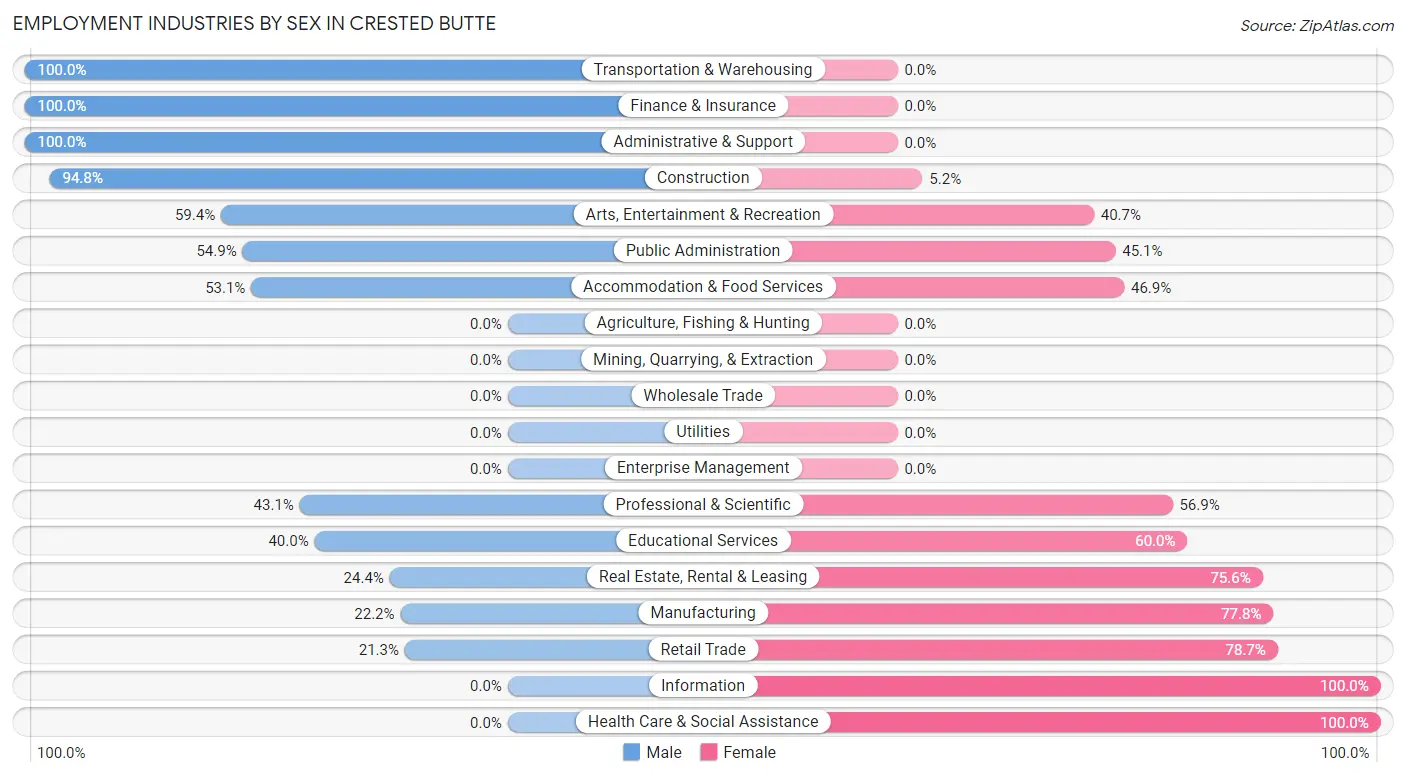
Employment Industries by Sex in Crested Butte
The Crested Butte industries that see more men than women are Transportation & Warehousing (100.0%), Finance & Insurance (100.0%), and Administrative & Support (100.0%), whereas the industries that tend to have a higher number of women are Information (100.0%), Health Care & Social Assistance (100.0%), and Retail Trade (78.7%).
| Industry | Male | Female |
| Agriculture, Fishing & Hunting | 0 (0.0%) | 0 (0.0%) |
| Mining, Quarrying, & Extraction | 0 (0.0%) | 0 (0.0%) |
| Construction | 110 (94.8%) | 6 (5.2%) |
| Manufacturing | 6 (22.2%) | 21 (77.8%) |
| Wholesale Trade | 0 (0.0%) | 0 (0.0%) |
| Retail Trade | 13 (21.3%) | 48 (78.7%) |
| Transportation & Warehousing | 22 (100.0%) | 0 (0.0%) |
| Utilities | 0 (0.0%) | 0 (0.0%) |
| Information | 0 (0.0%) | 13 (100.0%) |
| Finance & Insurance | 15 (100.0%) | 0 (0.0%) |
| Real Estate, Rental & Leasing | 11 (24.4%) | 34 (75.6%) |
| Professional & Scientific | 59 (43.1%) | 78 (56.9%) |
| Enterprise Management | 0 (0.0%) | 0 (0.0%) |
| Administrative & Support | 37 (100.0%) | 0 (0.0%) |
| Educational Services | 16 (40.0%) | 24 (60.0%) |
| Health Care & Social Assistance | 0 (0.0%) | 35 (100.0%) |
| Arts, Entertainment & Recreation | 73 (59.4%) | 50 (40.6%) |
| Accommodation & Food Services | 77 (53.1%) | 68 (46.9%) |
| Public Administration | 28 (54.9%) | 23 (45.1%) |
| Total | 467 (52.5%) | 423 (47.5%) |
Education in Crested Butte
School Enrollment in Crested Butte
The most common levels of schooling among the 321 students in Crested Butte are middle school (101 | 31.5%), high school (94 | 29.3%), and elementary school (60 | 18.7%).
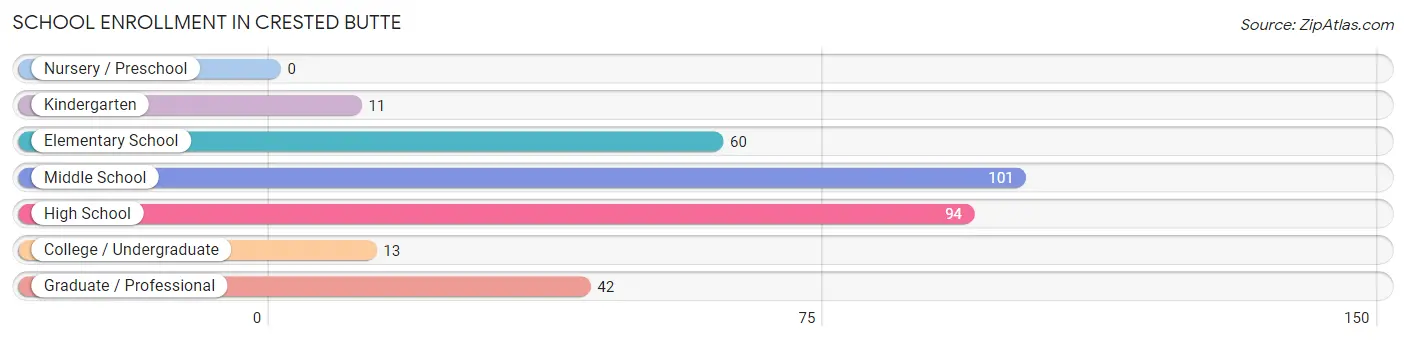
| School Level | # Students | % Students |
| Nursery / Preschool | 0 | 0.0% |
| Kindergarten | 11 | 3.4% |
| Elementary School | 60 | 18.7% |
| Middle School | 101 | 31.5% |
| High School | 94 | 29.3% |
| College / Undergraduate | 13 | 4.1% |
| Graduate / Professional | 42 | 13.1% |
| Total | 321 | 100.0% |
School Enrollment by Age by Funding Source in Crested Butte
Out of a total of 321 students who are enrolled in schools in Crested Butte, 70 (21.8%) attend a private institution, while the remaining 251 (78.2%) are enrolled in public schools. The age group of 20 to 24 year olds has the highest likelihood of being enrolled in private schools, with 42 (100.0% in the age bracket) enrolled. Conversely, the age group of 5 to 9 year old has the lowest likelihood of being enrolled in a private school, with 71 (100.0% in the age bracket) attending a public institution.
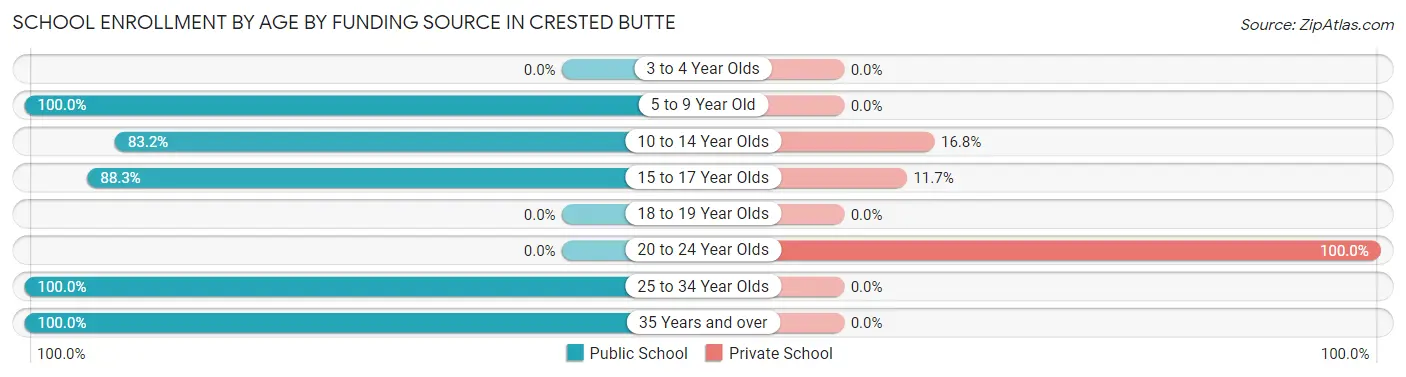
| Age Bracket | Public School | Private School |
| 3 to 4 Year Olds | 0 (0.0%) | 0 (0.0%) |
| 5 to 9 Year Old | 71 (100.0%) | 0 (0.0%) |
| 10 to 14 Year Olds | 84 (83.2%) | 17 (16.8%) |
| 15 to 17 Year Olds | 83 (88.3%) | 11 (11.7%) |
| 18 to 19 Year Olds | 0 (0.0%) | 0 (0.0%) |
| 20 to 24 Year Olds | 0 (0.0%) | 42 (100.0%) |
| 25 to 34 Year Olds | 5 (100.0%) | 0 (0.0%) |
| 35 Years and over | 8 (100.0%) | 0 (0.0%) |
| Total | 251 (78.2%) | 70 (21.8%) |
Educational Attainment by Field of Study in Crested Butte
Business (167 | 21.2%), visual & performing arts (81 | 10.3%), social sciences (80 | 10.2%), bio, nature & agricultural (76 | 9.7%), and communications (62 | 7.9%) are the most common fields of study among 786 individuals in Crested Butte who have obtained a bachelor's degree or higher.
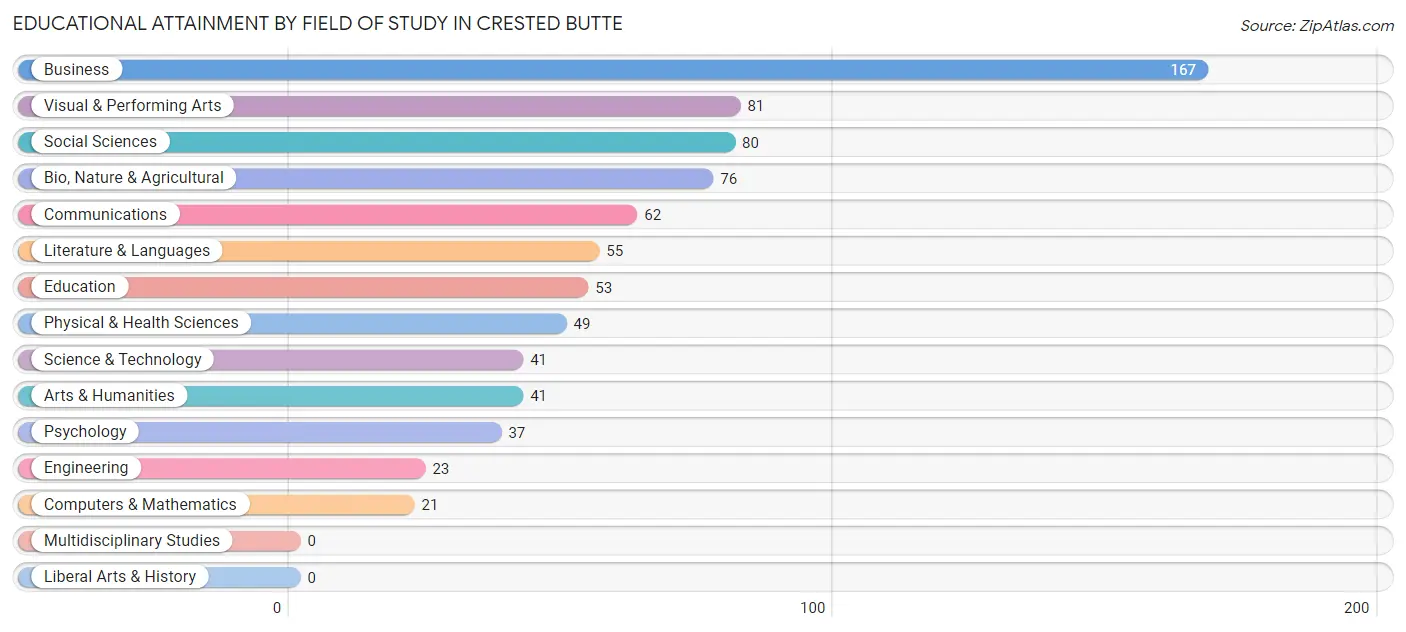
| Field of Study | # Graduates | % Graduates |
| Computers & Mathematics | 21 | 2.7% |
| Bio, Nature & Agricultural | 76 | 9.7% |
| Physical & Health Sciences | 49 | 6.2% |
| Psychology | 37 | 4.7% |
| Social Sciences | 80 | 10.2% |
| Engineering | 23 | 2.9% |
| Multidisciplinary Studies | 0 | 0.0% |
| Science & Technology | 41 | 5.2% |
| Business | 167 | 21.2% |
| Education | 53 | 6.7% |
| Literature & Languages | 55 | 7.0% |
| Liberal Arts & History | 0 | 0.0% |
| Visual & Performing Arts | 81 | 10.3% |
| Communications | 62 | 7.9% |
| Arts & Humanities | 41 | 5.2% |
| Total | 786 | 100.0% |
Transportation & Commute in Crested Butte
Vehicle Availability by Sex in Crested Butte
The most prevalent vehicle ownership categories in Crested Butte are males with 2 vehicles (192, accounting for 46.7%) and females with 2 vehicles (185, making up 48.4%).
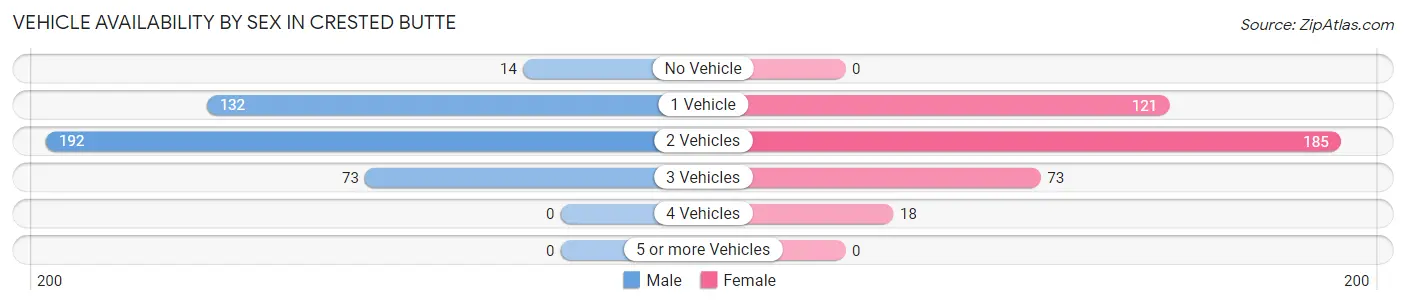
| Vehicles Available | Male | Female |
| No Vehicle | 14 (3.4%) | 0 (0.0%) |
| 1 Vehicle | 132 (32.1%) | 121 (30.5%) |
| 2 Vehicles | 192 (46.7%) | 185 (46.6%) |
| 3 Vehicles | 73 (17.8%) | 73 (18.4%) |
| 4 Vehicles | 0 (0.0%) | 18 (4.5%) |
| 5 or more Vehicles | 0 (0.0%) | 0 (0.0%) |
| Total | 411 (100.0%) | 397 (100.0%) |
Commute Time in Crested Butte
The most frequently occuring commute durations in Crested Butte are less than 5 minutes (289 commuters, 41.3%), 5 to 9 minutes (175 commuters, 25.0%), and 10 to 14 minutes (139 commuters, 19.9%).
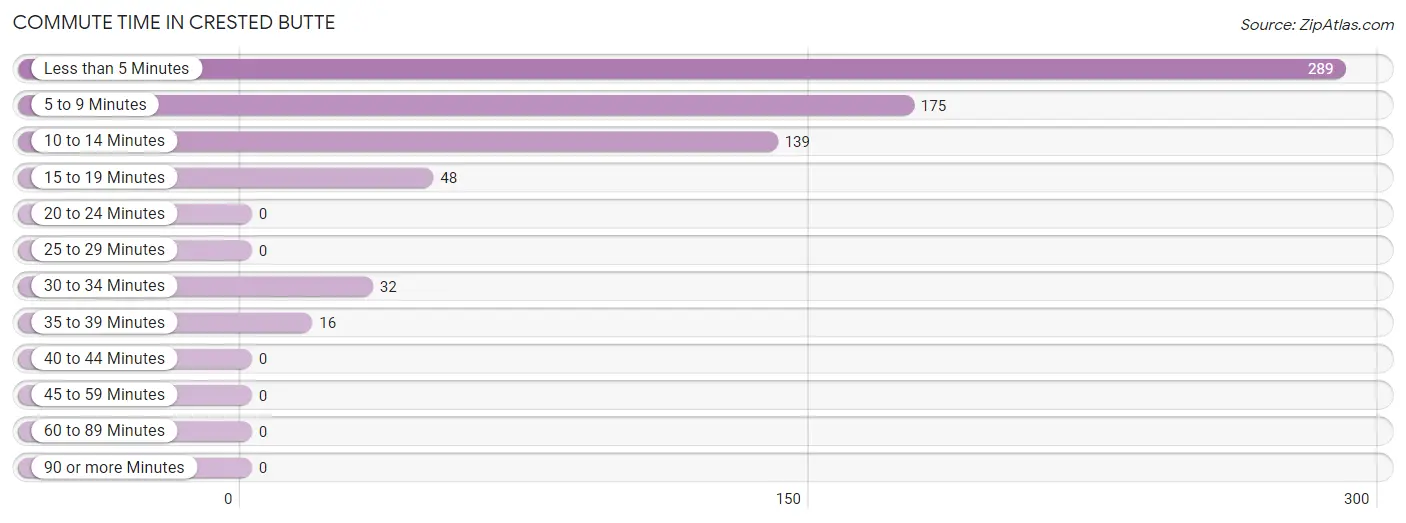
| Commute Time | # Commuters | % Commuters |
| Less than 5 Minutes | 289 | 41.3% |
| 5 to 9 Minutes | 175 | 25.0% |
| 10 to 14 Minutes | 139 | 19.9% |
| 15 to 19 Minutes | 48 | 6.9% |
| 20 to 24 Minutes | 0 | 0.0% |
| 25 to 29 Minutes | 0 | 0.0% |
| 30 to 34 Minutes | 32 | 4.6% |
| 35 to 39 Minutes | 16 | 2.3% |
| 40 to 44 Minutes | 0 | 0.0% |
| 45 to 59 Minutes | 0 | 0.0% |
| 60 to 89 Minutes | 0 | 0.0% |
| 90 or more Minutes | 0 | 0.0% |
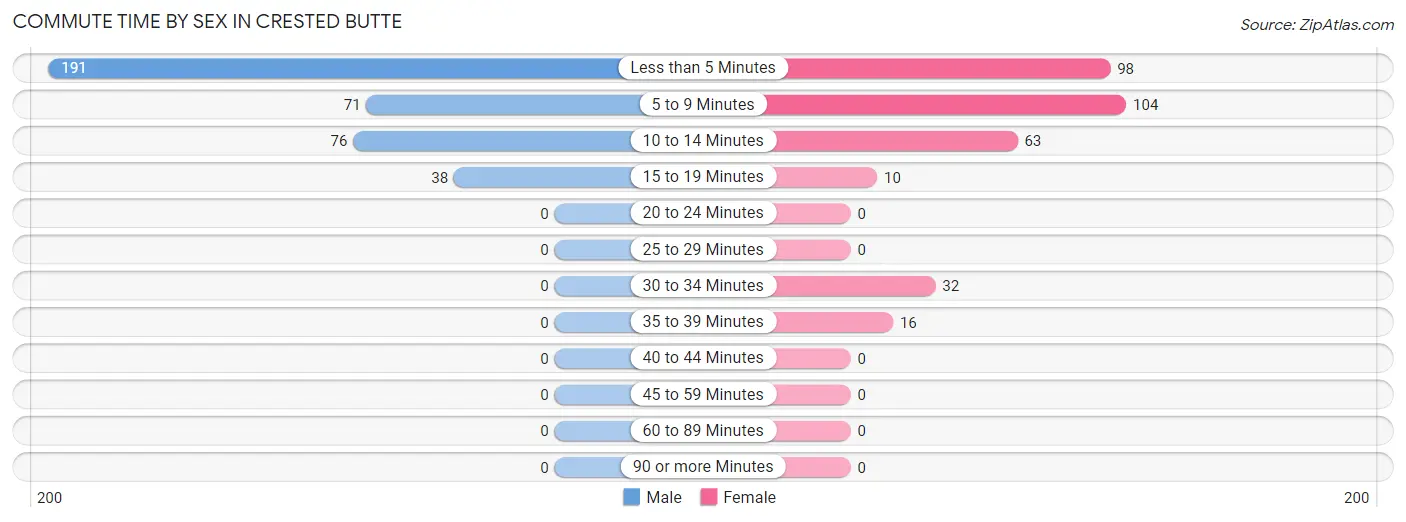
Commute Time by Sex in Crested Butte
The most common commute times in Crested Butte are less than 5 minutes (191 commuters, 50.8%) for males and 5 to 9 minutes (104 commuters, 32.2%) for females.
| Commute Time | Male | Female |
| Less than 5 Minutes | 191 (50.8%) | 98 (30.3%) |
| 5 to 9 Minutes | 71 (18.9%) | 104 (32.2%) |
| 10 to 14 Minutes | 76 (20.2%) | 63 (19.5%) |
| 15 to 19 Minutes | 38 (10.1%) | 10 (3.1%) |
| 20 to 24 Minutes | 0 (0.0%) | 0 (0.0%) |
| 25 to 29 Minutes | 0 (0.0%) | 0 (0.0%) |
| 30 to 34 Minutes | 0 (0.0%) | 32 (9.9%) |
| 35 to 39 Minutes | 0 (0.0%) | 16 (5.0%) |
| 40 to 44 Minutes | 0 (0.0%) | 0 (0.0%) |
| 45 to 59 Minutes | 0 (0.0%) | 0 (0.0%) |
| 60 to 89 Minutes | 0 (0.0%) | 0 (0.0%) |
| 90 or more Minutes | 0 (0.0%) | 0 (0.0%) |
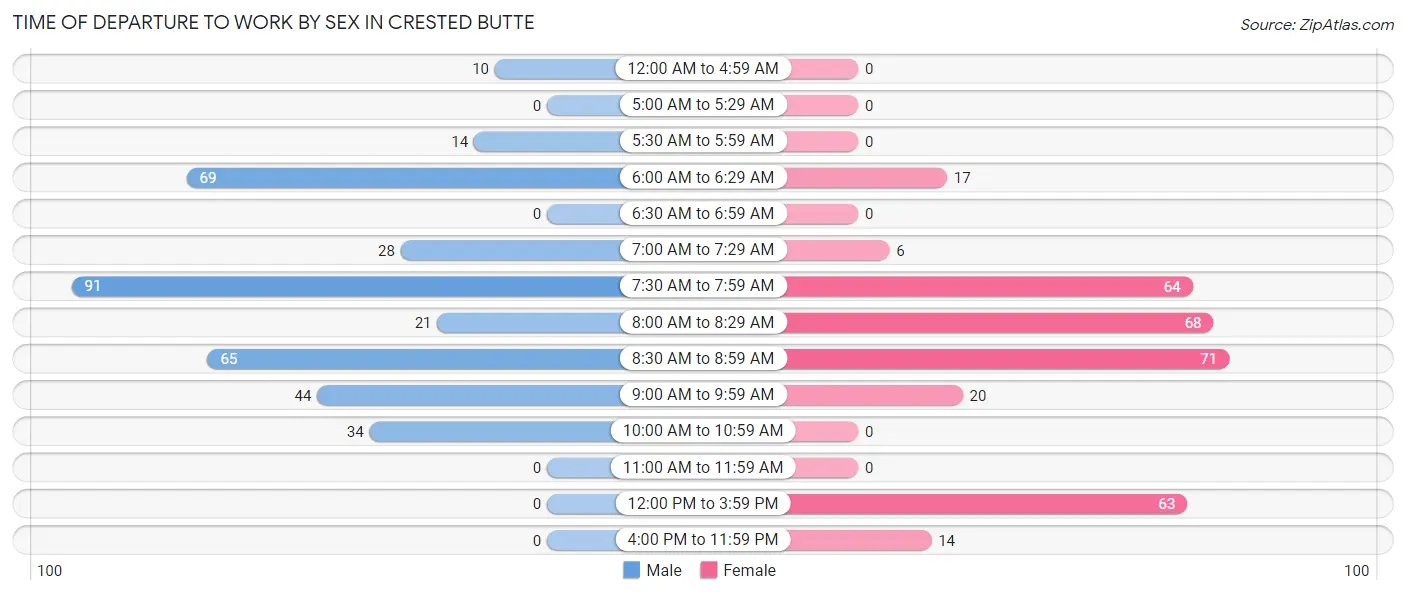
Time of Departure to Work by Sex in Crested Butte
The most frequent times of departure to work in Crested Butte are 7:30 AM to 7:59 AM (91, 24.2%) for males and 8:30 AM to 8:59 AM (71, 22.0%) for females.
| Time of Departure | Male | Female |
| 12:00 AM to 4:59 AM | 10 (2.7%) | 0 (0.0%) |
| 5:00 AM to 5:29 AM | 0 (0.0%) | 0 (0.0%) |
| 5:30 AM to 5:59 AM | 14 (3.7%) | 0 (0.0%) |
| 6:00 AM to 6:29 AM | 69 (18.3%) | 17 (5.3%) |
| 6:30 AM to 6:59 AM | 0 (0.0%) | 0 (0.0%) |
| 7:00 AM to 7:29 AM | 28 (7.4%) | 6 (1.9%) |
| 7:30 AM to 7:59 AM | 91 (24.2%) | 64 (19.8%) |
| 8:00 AM to 8:29 AM | 21 (5.6%) | 68 (21.0%) |
| 8:30 AM to 8:59 AM | 65 (17.3%) | 71 (22.0%) |
| 9:00 AM to 9:59 AM | 44 (11.7%) | 20 (6.2%) |
| 10:00 AM to 10:59 AM | 34 (9.0%) | 0 (0.0%) |
| 11:00 AM to 11:59 AM | 0 (0.0%) | 0 (0.0%) |
| 12:00 PM to 3:59 PM | 0 (0.0%) | 63 (19.5%) |
| 4:00 PM to 11:59 PM | 0 (0.0%) | 14 (4.3%) |
| Total | 376 (100.0%) | 323 (100.0%) |
Housing Occupancy in Crested Butte
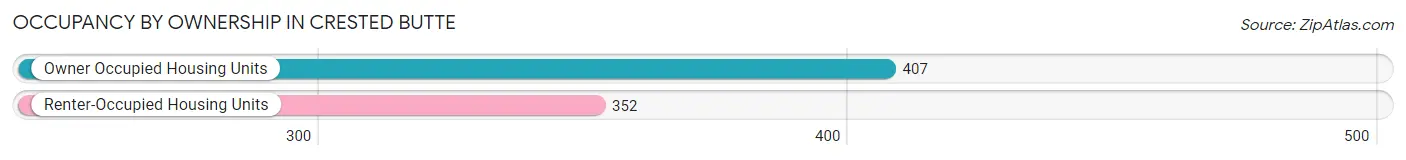
Occupancy by Ownership in Crested Butte
Of the total 759 dwellings in Crested Butte, owner-occupied units account for 407 (53.6%), while renter-occupied units make up 352 (46.4%).
| Occupancy | # Housing Units | % Housing Units |
| Owner Occupied Housing Units | 407 | 53.6% |
| Renter-Occupied Housing Units | 352 | 46.4% |
| Total Occupied Housing Units | 759 | 100.0% |
Occupancy by Household Size in Crested Butte
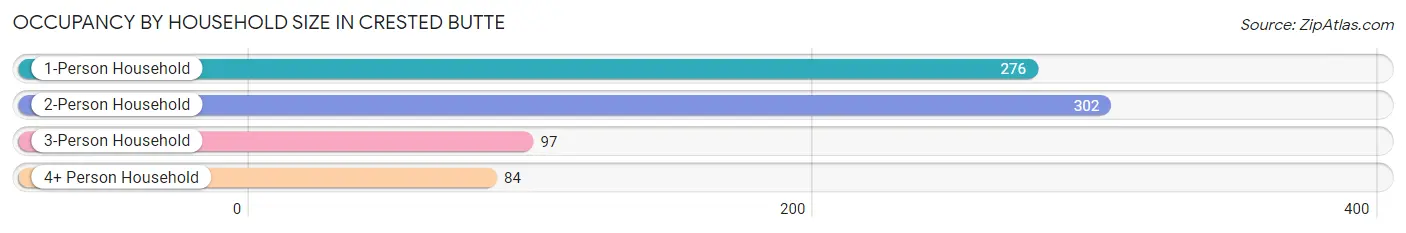
| Household Size | # Housing Units | % Housing Units |
| 1-Person Household | 276 | 36.4% |
| 2-Person Household | 302 | 39.8% |
| 3-Person Household | 97 | 12.8% |
| 4+ Person Household | 84 | 11.1% |
| Total Housing Units | 759 | 100.0% |
Occupancy by Ownership by Household Size in Crested Butte
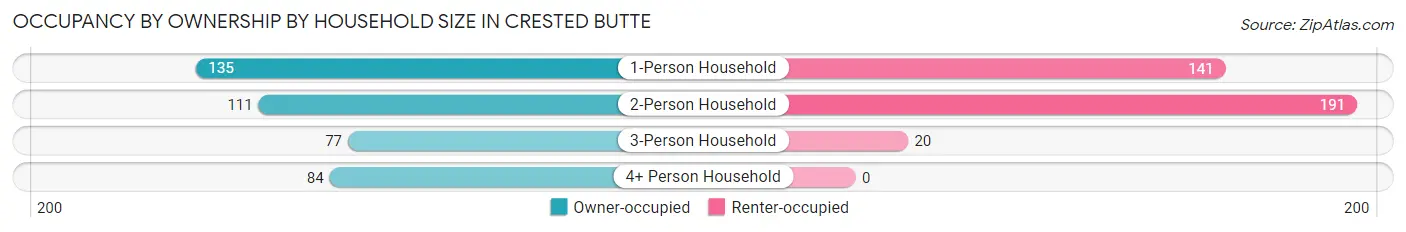
| Household Size | Owner-occupied | Renter-occupied |
| 1-Person Household | 135 (48.9%) | 141 (51.1%) |
| 2-Person Household | 111 (36.7%) | 191 (63.2%) |
| 3-Person Household | 77 (79.4%) | 20 (20.6%) |
| 4+ Person Household | 84 (100.0%) | 0 (0.0%) |
| Total Housing Units | 407 (53.6%) | 352 (46.4%) |
Occupancy by Educational Attainment in Crested Butte
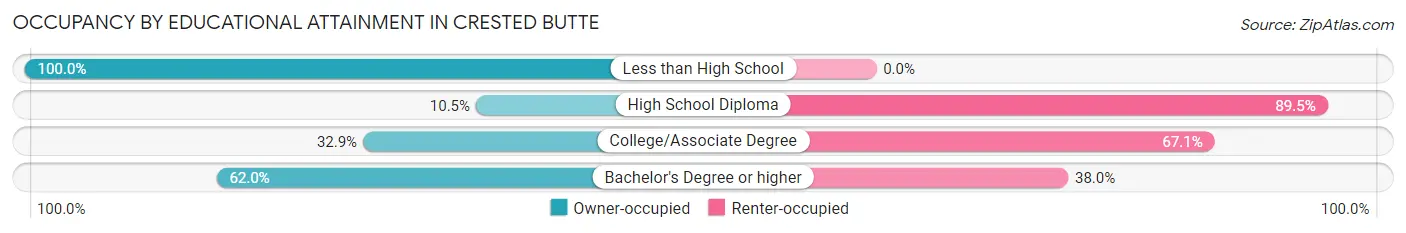
| Household Size | Owner-occupied | Renter-occupied |
| Less than High School | 8 (100.0%) | 0 (0.0%) |
| High School Diploma | 4 (10.5%) | 34 (89.5%) |
| College/Associate Degree | 53 (32.9%) | 108 (67.1%) |
| Bachelor's Degree or higher | 342 (62.0%) | 210 (38.0%) |
Occupancy by Age of Householder in Crested Butte
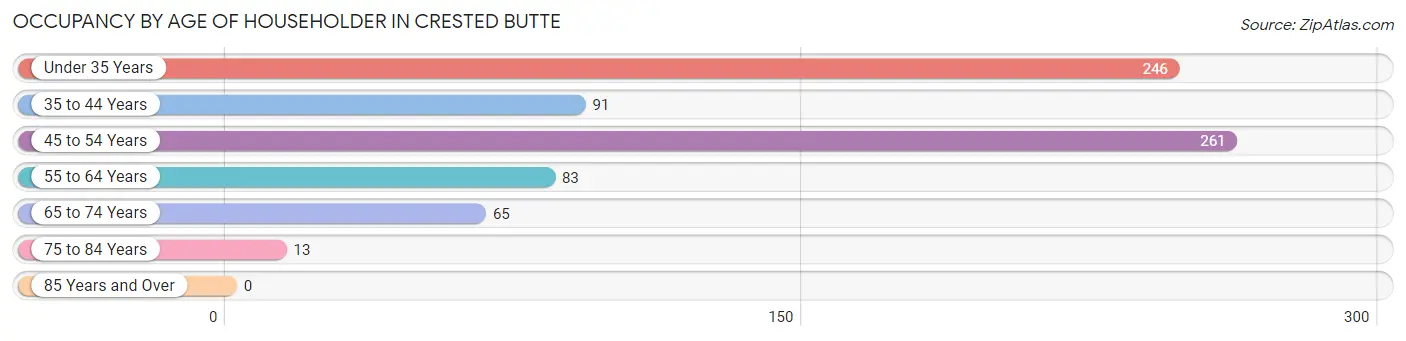
| Age Bracket | # Households | % Households |
| Under 35 Years | 246 | 32.4% |
| 35 to 44 Years | 91 | 12.0% |
| 45 to 54 Years | 261 | 34.4% |
| 55 to 64 Years | 83 | 10.9% |
| 65 to 74 Years | 65 | 8.6% |
| 75 to 84 Years | 13 | 1.7% |
| 85 Years and Over | 0 | 0.0% |
| Total | 759 | 100.0% |
Housing Finances in Crested Butte
Median Income by Occupancy in Crested Butte
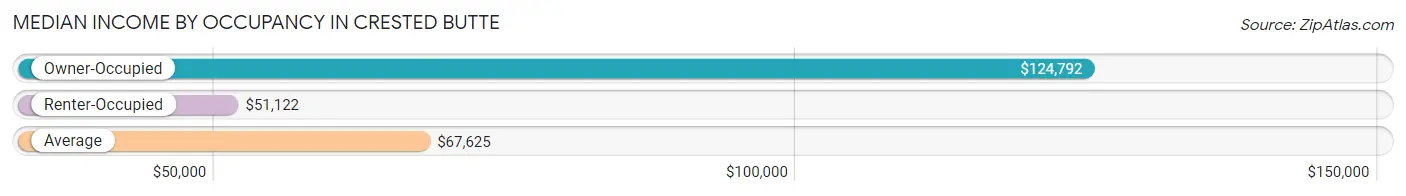
| Occupancy Type | # Households | Median Income |
| Owner-Occupied | 407 (53.6%) | $124,792 |
| Renter-Occupied | 352 (46.4%) | $51,122 |
| Average | 759 (100.0%) | $67,625 |
Occupancy by Householder Income Bracket in Crested Butte
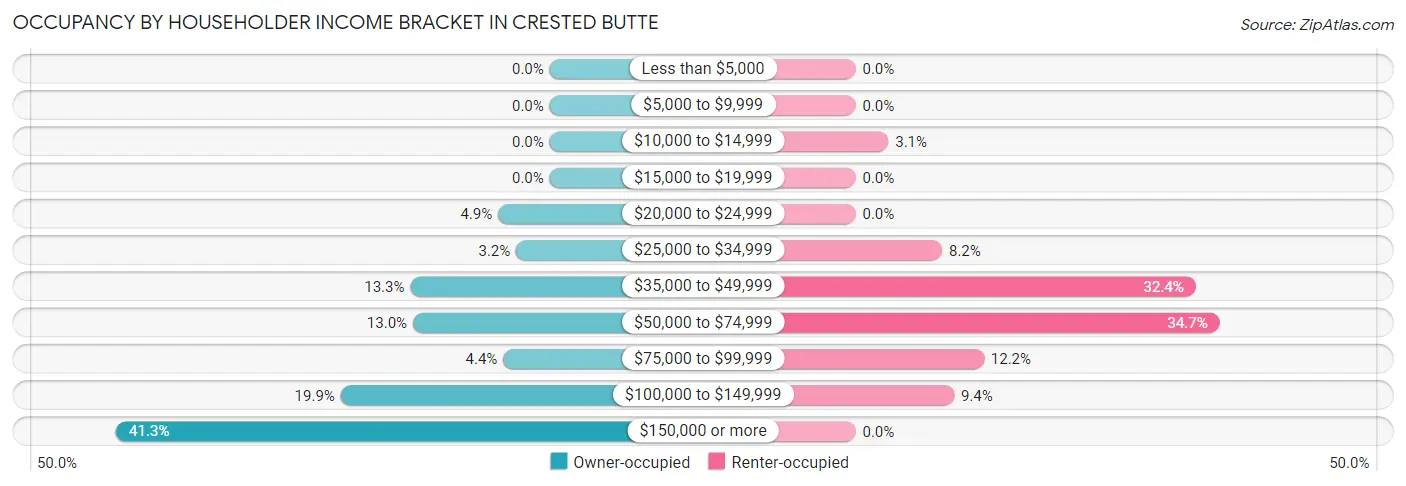
| Income Bracket | Owner-occupied | Renter-occupied |
| Less than $5,000 | 0 (0.0%) | 0 (0.0%) |
| $5,000 to $9,999 | 0 (0.0%) | 0 (0.0%) |
| $10,000 to $14,999 | 0 (0.0%) | 11 (3.1%) |
| $15,000 to $19,999 | 0 (0.0%) | 0 (0.0%) |
| $20,000 to $24,999 | 20 (4.9%) | 0 (0.0%) |
| $25,000 to $34,999 | 13 (3.2%) | 29 (8.2%) |
| $35,000 to $49,999 | 54 (13.3%) | 114 (32.4%) |
| $50,000 to $74,999 | 53 (13.0%) | 122 (34.7%) |
| $75,000 to $99,999 | 18 (4.4%) | 43 (12.2%) |
| $100,000 to $149,999 | 81 (19.9%) | 33 (9.4%) |
| $150,000 or more | 168 (41.3%) | 0 (0.0%) |
| Total | 407 (100.0%) | 352 (100.0%) |
Monthly Housing Cost Tiers in Crested Butte
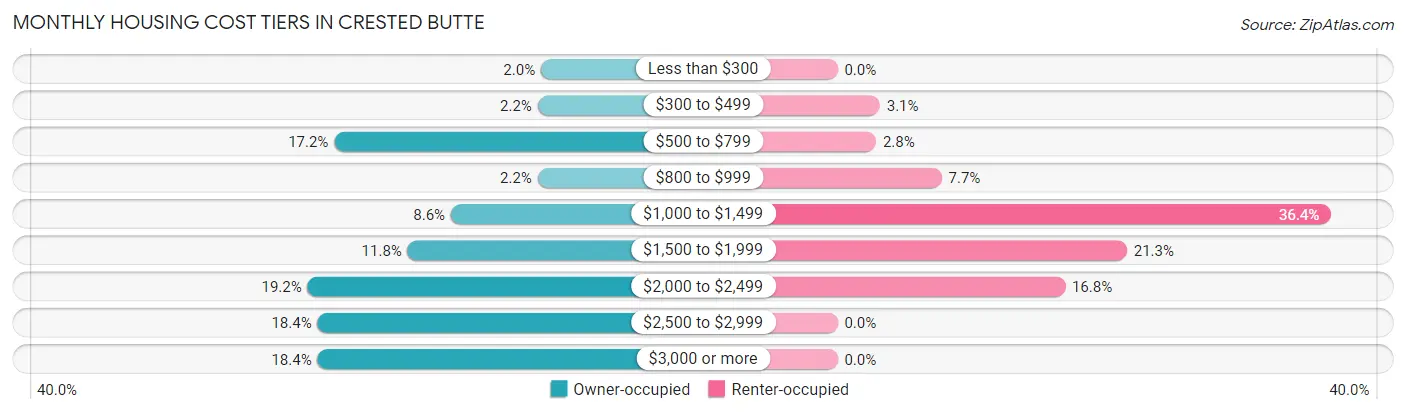
| Monthly Cost | Owner-occupied | Renter-occupied |
| Less than $300 | 8 (2.0%) | 0 (0.0%) |
| $300 to $499 | 9 (2.2%) | 11 (3.1%) |
| $500 to $799 | 70 (17.2%) | 10 (2.8%) |
| $800 to $999 | 9 (2.2%) | 27 (7.7%) |
| $1,000 to $1,499 | 35 (8.6%) | 128 (36.4%) |
| $1,500 to $1,999 | 48 (11.8%) | 75 (21.3%) |
| $2,000 to $2,499 | 78 (19.2%) | 59 (16.8%) |
| $2,500 to $2,999 | 75 (18.4%) | 0 (0.0%) |
| $3,000 or more | 75 (18.4%) | 0 (0.0%) |
| Total | 407 (100.0%) | 352 (100.0%) |
Physical Housing Characteristics in Crested Butte
Housing Structures in Crested Butte
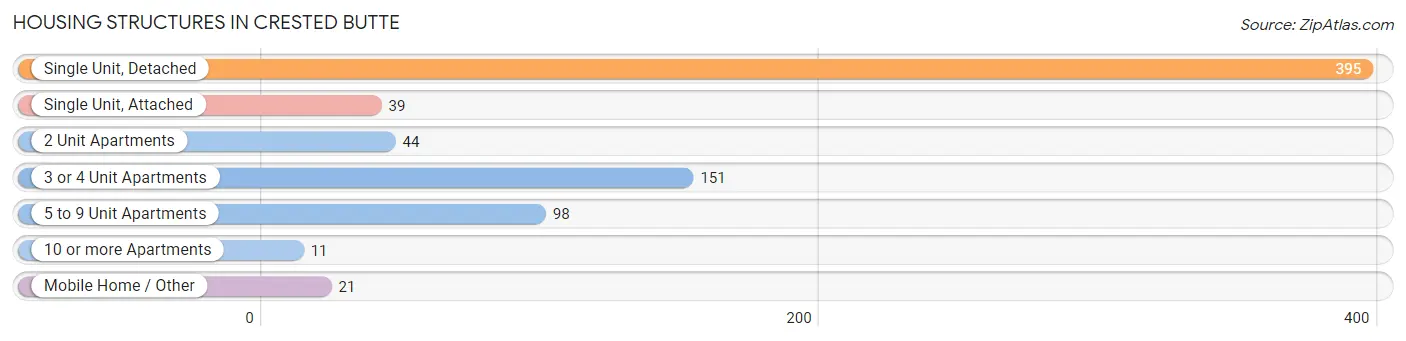
| Structure Type | # Housing Units | % Housing Units |
| Single Unit, Detached | 395 | 52.0% |
| Single Unit, Attached | 39 | 5.1% |
| 2 Unit Apartments | 44 | 5.8% |
| 3 or 4 Unit Apartments | 151 | 19.9% |
| 5 to 9 Unit Apartments | 98 | 12.9% |
| 10 or more Apartments | 11 | 1.5% |
| Mobile Home / Other | 21 | 2.8% |
| Total | 759 | 100.0% |
Housing Structures by Occupancy in Crested Butte
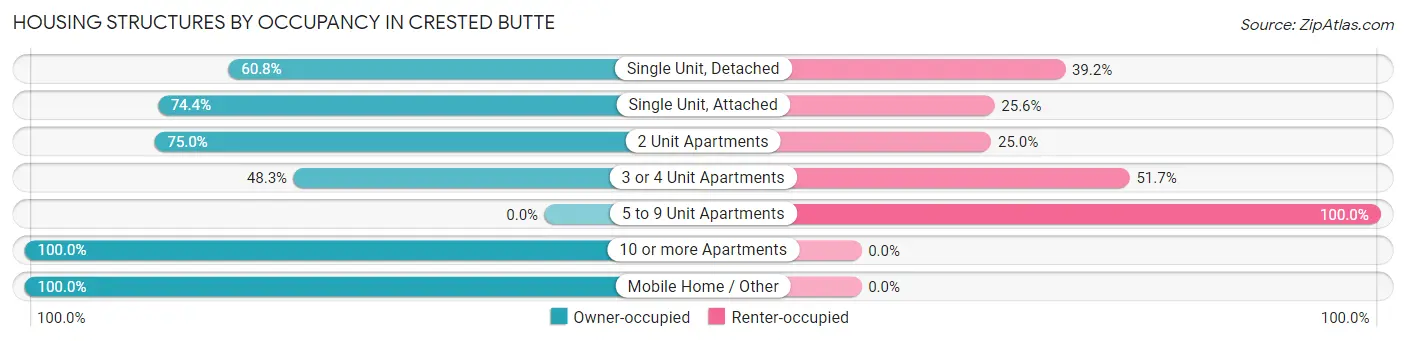
| Structure Type | Owner-occupied | Renter-occupied |
| Single Unit, Detached | 240 (60.8%) | 155 (39.2%) |
| Single Unit, Attached | 29 (74.4%) | 10 (25.6%) |
| 2 Unit Apartments | 33 (75.0%) | 11 (25.0%) |
| 3 or 4 Unit Apartments | 73 (48.3%) | 78 (51.7%) |
| 5 to 9 Unit Apartments | 0 (0.0%) | 98 (100.0%) |
| 10 or more Apartments | 11 (100.0%) | 0 (0.0%) |
| Mobile Home / Other | 21 (100.0%) | 0 (0.0%) |
| Total | 407 (53.6%) | 352 (46.4%) |
Housing Structures by Number of Rooms in Crested Butte
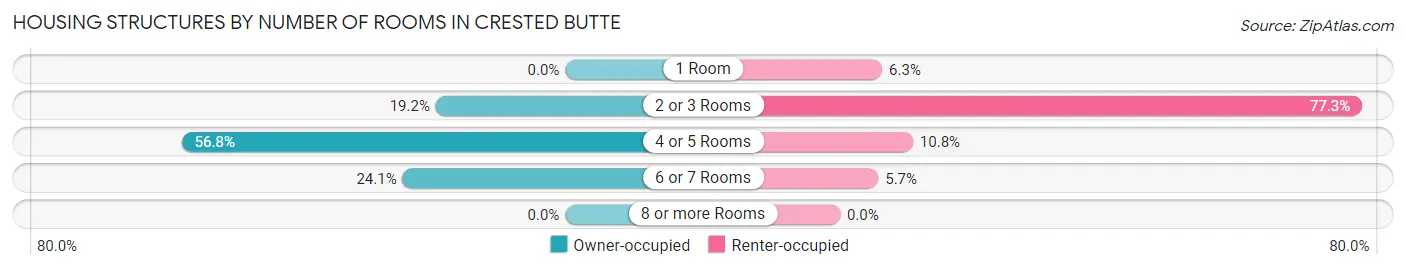
| Number of Rooms | Owner-occupied | Renter-occupied |
| 1 Room | 0 (0.0%) | 22 (6.2%) |
| 2 or 3 Rooms | 78 (19.2%) | 272 (77.3%) |
| 4 or 5 Rooms | 231 (56.8%) | 38 (10.8%) |
| 6 or 7 Rooms | 98 (24.1%) | 20 (5.7%) |
| 8 or more Rooms | 0 (0.0%) | 0 (0.0%) |
| Total | 407 (100.0%) | 352 (100.0%) |
Housing Structure by Heating Type in Crested Butte
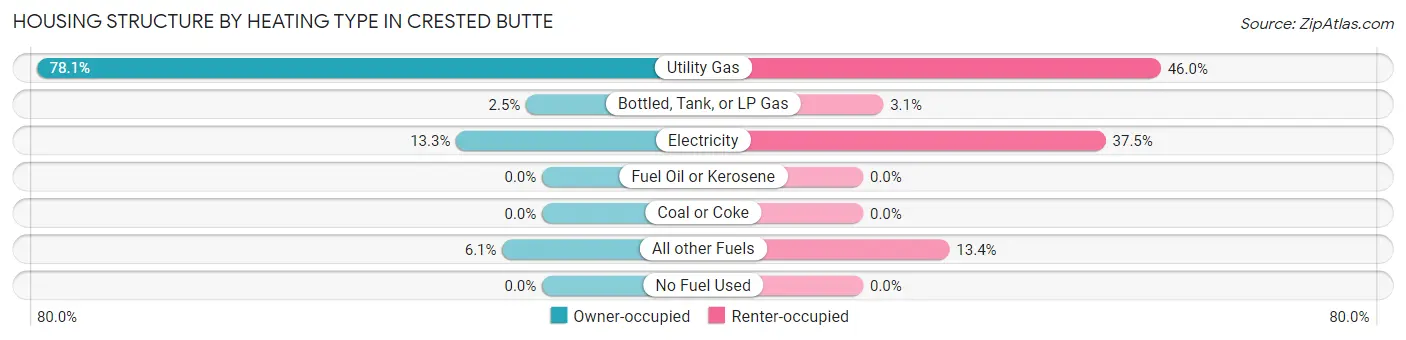
| Heating Type | Owner-occupied | Renter-occupied |
| Utility Gas | 318 (78.1%) | 162 (46.0%) |
| Bottled, Tank, or LP Gas | 10 (2.5%) | 11 (3.1%) |
| Electricity | 54 (13.3%) | 132 (37.5%) |
| Fuel Oil or Kerosene | 0 (0.0%) | 0 (0.0%) |
| Coal or Coke | 0 (0.0%) | 0 (0.0%) |
| All other Fuels | 25 (6.1%) | 47 (13.4%) |
| No Fuel Used | 0 (0.0%) | 0 (0.0%) |
| Total | 407 (100.0%) | 352 (100.0%) |
Household Vehicle Usage in Crested Butte
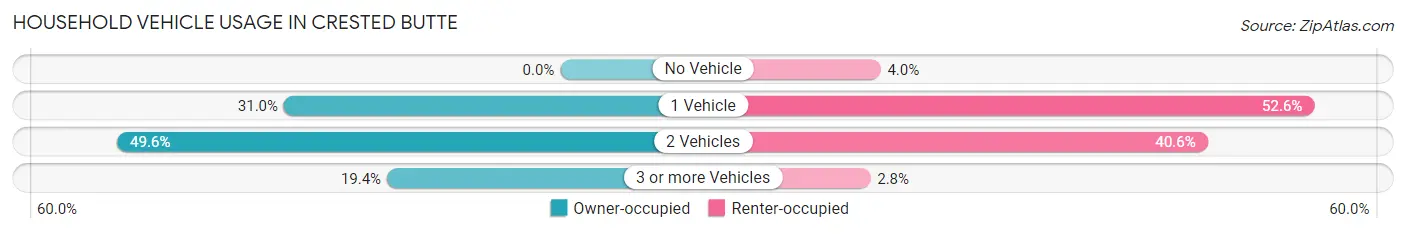
| Vehicles per Household | Owner-occupied | Renter-occupied |
| No Vehicle | 0 (0.0%) | 14 (4.0%) |
| 1 Vehicle | 126 (31.0%) | 185 (52.6%) |
| 2 Vehicles | 202 (49.6%) | 143 (40.6%) |
| 3 or more Vehicles | 79 (19.4%) | 10 (2.8%) |
| Total | 407 (100.0%) | 352 (100.0%) |
Real Estate & Mortgages in Crested Butte
Real Estate and Mortgage Overview in Crested Butte
| Characteristic | Without Mortgage | With Mortgage |
| Housing Units | 110 | 297 |
| Median Property Value | $583,300 | $1,163,500 |
| Median Household Income | $56,889 | $151 |
| Monthly Housing Costs | $715 | $75 |
| Real Estate Taxes | $2,440 | $0 |
Property Value by Mortgage Status in Crested Butte
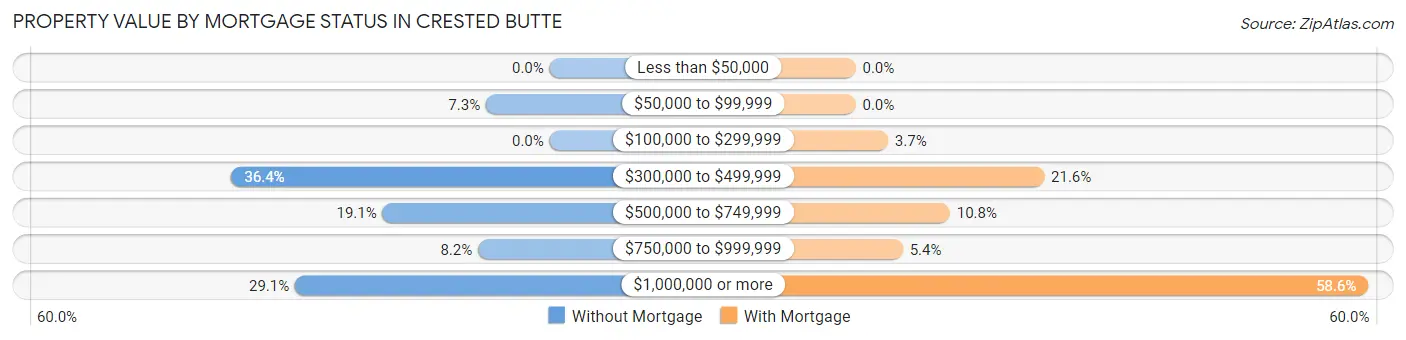
| Property Value | Without Mortgage | With Mortgage |
| Less than $50,000 | 0 (0.0%) | 0 (0.0%) |
| $50,000 to $99,999 | 8 (7.3%) | 0 (0.0%) |
| $100,000 to $299,999 | 0 (0.0%) | 11 (3.7%) |
| $300,000 to $499,999 | 40 (36.4%) | 64 (21.5%) |
| $500,000 to $749,999 | 21 (19.1%) | 32 (10.8%) |
| $750,000 to $999,999 | 9 (8.2%) | 16 (5.4%) |
| $1,000,000 or more | 32 (29.1%) | 174 (58.6%) |
| Total | 110 (100.0%) | 297 (100.0%) |
Household Income by Mortgage Status in Crested Butte
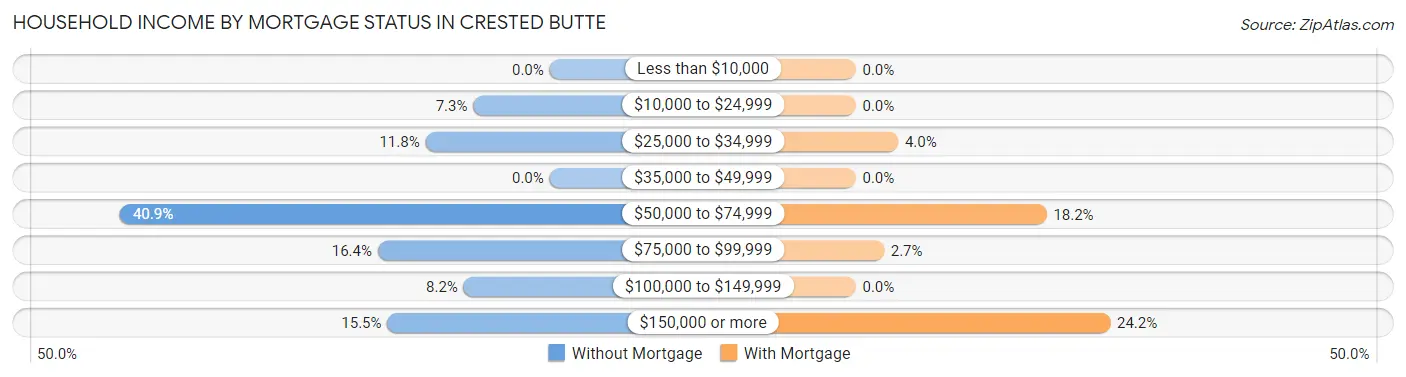
| Household Income | Without Mortgage | With Mortgage |
| Less than $10,000 | 0 (0.0%) | 0 (0.0%) |
| $10,000 to $24,999 | 8 (7.3%) | 0 (0.0%) |
| $25,000 to $34,999 | 13 (11.8%) | 12 (4.0%) |
| $35,000 to $49,999 | 0 (0.0%) | 0 (0.0%) |
| $50,000 to $74,999 | 45 (40.9%) | 54 (18.2%) |
| $75,000 to $99,999 | 18 (16.4%) | 8 (2.7%) |
| $100,000 to $149,999 | 9 (8.2%) | 0 (0.0%) |
| $150,000 or more | 17 (15.4%) | 72 (24.2%) |
| Total | 110 (100.0%) | 297 (100.0%) |
Property Value to Household Income Ratio in Crested Butte
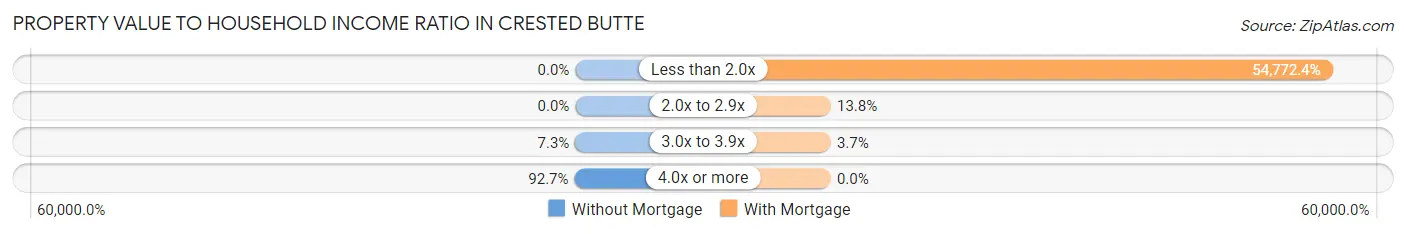
| Value-to-Income Ratio | Without Mortgage | With Mortgage |
| Less than 2.0x | 0 (0.0%) | 162,674 (54,772.4%) |
| 2.0x to 2.9x | 0 (0.0%) | 41 (13.8%) |
| 3.0x to 3.9x | 8 (7.3%) | 11 (3.7%) |
| 4.0x or more | 102 (92.7%) | 0 (0.0%) |
| Total | 110 (100.0%) | 297 (100.0%) |
Real Estate Taxes by Mortgage Status in Crested Butte
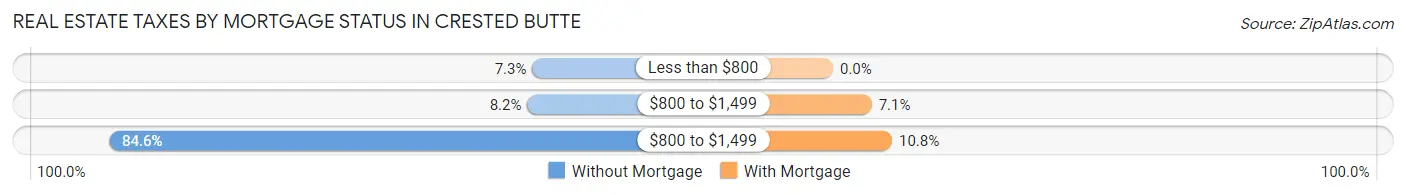
| Property Taxes | Without Mortgage | With Mortgage |
| Less than $800 | 8 (7.3%) | 0 (0.0%) |
| $800 to $1,499 | 9 (8.2%) | 21 (7.1%) |
| $800 to $1,499 | 93 (84.6%) | 32 (10.8%) |
| Total | 110 (100.0%) | 297 (100.0%) |
Health & Disability in Crested Butte
Health Insurance Coverage by Age in Crested Butte
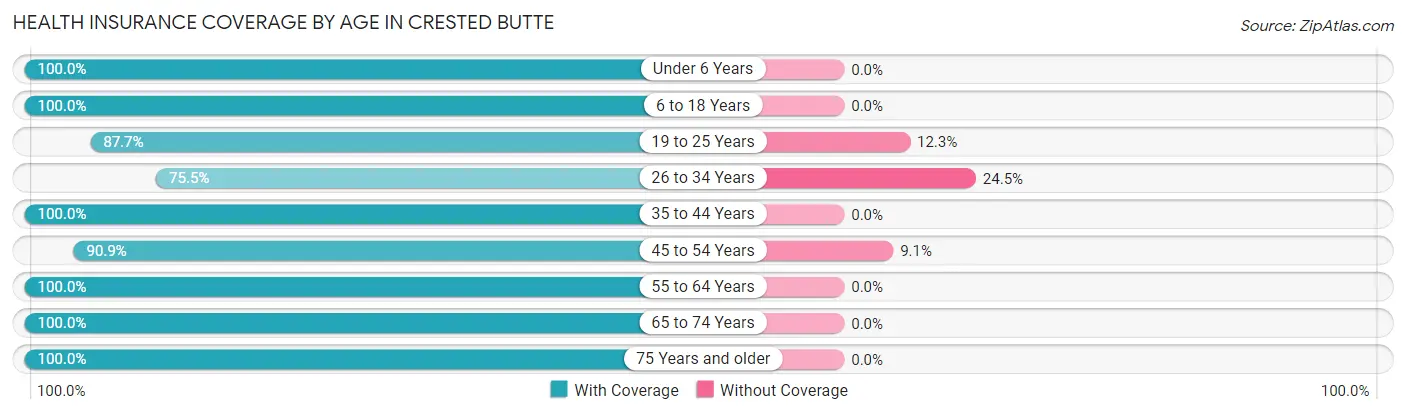
| Age Bracket | With Coverage | Without Coverage |
| Under 6 Years | 35 (100.0%) | 0 (0.0%) |
| 6 to 18 Years | 255 (100.0%) | 0 (0.0%) |
| 19 to 25 Years | 136 (87.7%) | 19 (12.3%) |
| 26 to 34 Years | 163 (75.5%) | 53 (24.5%) |
| 35 to 44 Years | 140 (100.0%) | 0 (0.0%) |
| 45 to 54 Years | 339 (90.9%) | 34 (9.1%) |
| 55 to 64 Years | 130 (100.0%) | 0 (0.0%) |
| 65 to 74 Years | 107 (100.0%) | 0 (0.0%) |
| 75 Years and older | 23 (100.0%) | 0 (0.0%) |
| Total | 1,328 (92.6%) | 106 (7.4%) |
Health Insurance Coverage by Citizenship Status in Crested Butte
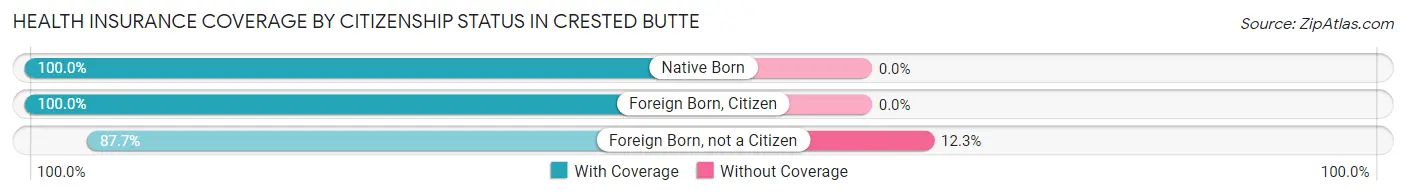
| Citizenship Status | With Coverage | Without Coverage |
| Native Born | 35 (100.0%) | 0 (0.0%) |
| Foreign Born, Citizen | 255 (100.0%) | 0 (0.0%) |
| Foreign Born, not a Citizen | 136 (87.7%) | 19 (12.3%) |
Health Insurance Coverage by Household Income in Crested Butte
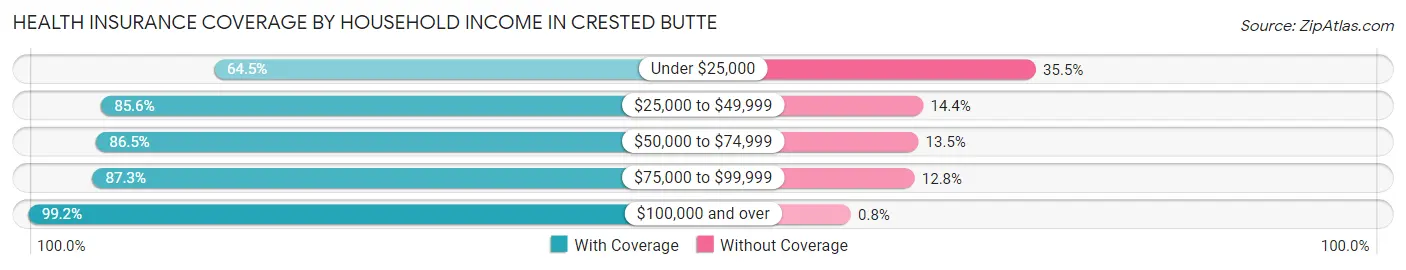
| Household Income | With Coverage | Without Coverage |
| Under $25,000 | 20 (64.5%) | 11 (35.5%) |
| $25,000 to $49,999 | 250 (85.6%) | 42 (14.4%) |
| $50,000 to $74,999 | 180 (86.5%) | 28 (13.5%) |
| $75,000 to $99,999 | 130 (87.3%) | 19 (12.8%) |
| $100,000 and over | 748 (99.2%) | 6 (0.8%) |
Public vs Private Health Insurance Coverage by Age in Crested Butte
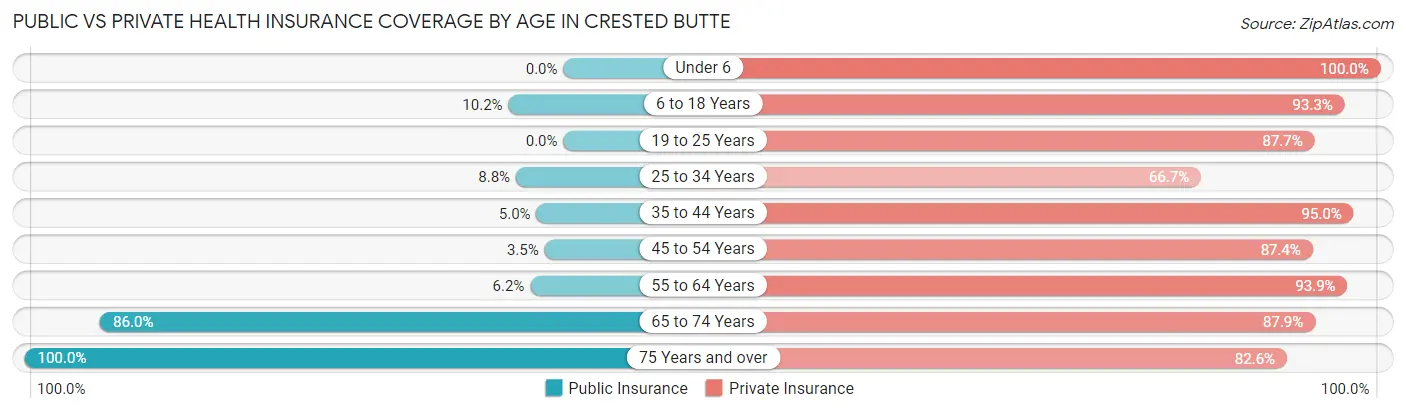
| Age Bracket | Public Insurance | Private Insurance |
| Under 6 | 0 (0.0%) | 35 (100.0%) |
| 6 to 18 Years | 26 (10.2%) | 238 (93.3%) |
| 19 to 25 Years | 0 (0.0%) | 136 (87.7%) |
| 25 to 34 Years | 19 (8.8%) | 144 (66.7%) |
| 35 to 44 Years | 7 (5.0%) | 133 (95.0%) |
| 45 to 54 Years | 13 (3.5%) | 326 (87.4%) |
| 55 to 64 Years | 8 (6.1%) | 122 (93.9%) |
| 65 to 74 Years | 92 (86.0%) | 94 (87.8%) |
| 75 Years and over | 23 (100.0%) | 19 (82.6%) |
| Total | 188 (13.1%) | 1,247 (87.0%) |
Disability Status by Sex by Age in Crested Butte
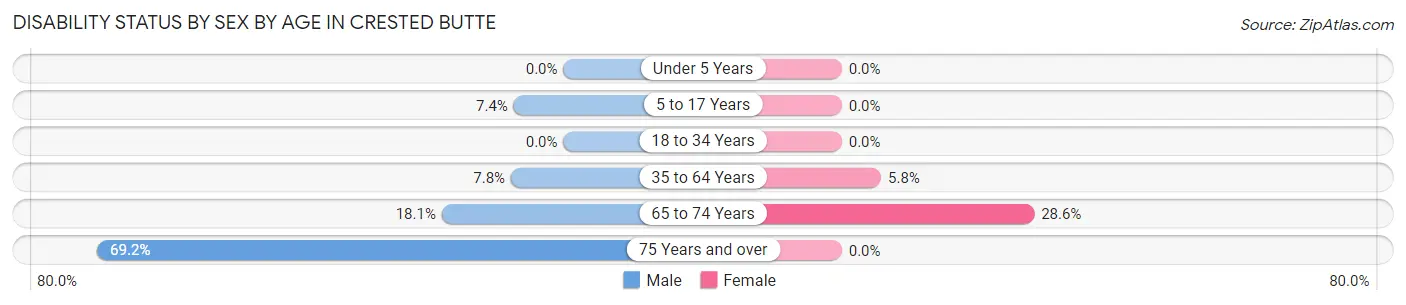
| Age Bracket | Male | Female |
| Under 5 Years | 0 (0.0%) | 0 (0.0%) |
| 5 to 17 Years | 9 (7.4%) | 0 (0.0%) |
| 18 to 34 Years | 0 (0.0%) | 0 (0.0%) |
| 35 to 64 Years | 26 (7.8%) | 18 (5.8%) |
| 65 to 74 Years | 13 (18.1%) | 10 (28.6%) |
| 75 Years and over | 9 (69.2%) | 0 (0.0%) |
Disability Class by Sex by Age in Crested Butte
Disability Class: Hearing Difficulty
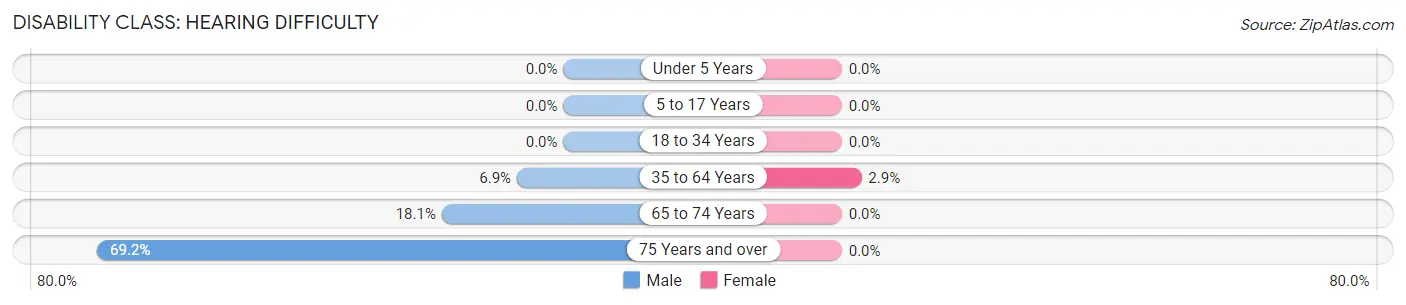
| Age Bracket | Male | Female |
| Under 5 Years | 0 (0.0%) | 0 (0.0%) |
| 5 to 17 Years | 0 (0.0%) | 0 (0.0%) |
| 18 to 34 Years | 0 (0.0%) | 0 (0.0%) |
| 35 to 64 Years | 23 (6.9%) | 9 (2.9%) |
| 65 to 74 Years | 13 (18.1%) | 0 (0.0%) |
| 75 Years and over | 9 (69.2%) | 0 (0.0%) |
Disability Class: Vision Difficulty
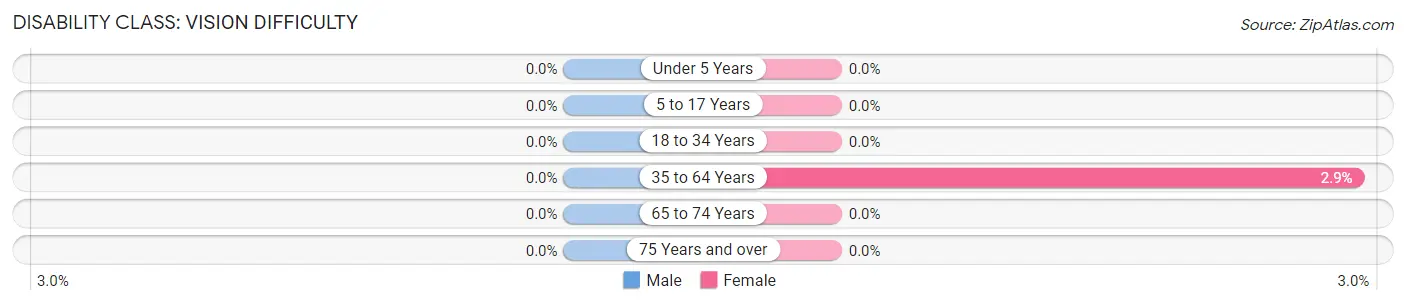
| Age Bracket | Male | Female |
| Under 5 Years | 0 (0.0%) | 0 (0.0%) |
| 5 to 17 Years | 0 (0.0%) | 0 (0.0%) |
| 18 to 34 Years | 0 (0.0%) | 0 (0.0%) |
| 35 to 64 Years | 0 (0.0%) | 9 (2.9%) |
| 65 to 74 Years | 0 (0.0%) | 0 (0.0%) |
| 75 Years and over | 0 (0.0%) | 0 (0.0%) |
Disability Class: Cognitive Difficulty
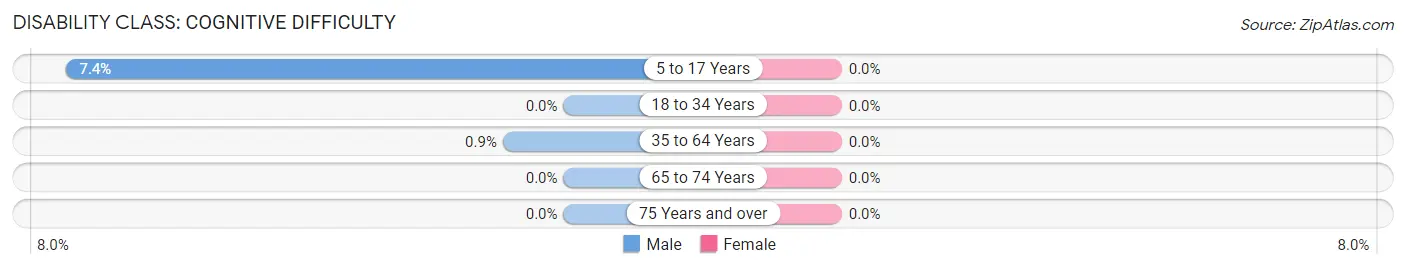
| Age Bracket | Male | Female |
| 5 to 17 Years | 9 (7.4%) | 0 (0.0%) |
| 18 to 34 Years | 0 (0.0%) | 0 (0.0%) |
| 35 to 64 Years | 3 (0.9%) | 0 (0.0%) |
| 65 to 74 Years | 0 (0.0%) | 0 (0.0%) |
| 75 Years and over | 0 (0.0%) | 0 (0.0%) |
Disability Class: Ambulatory Difficulty
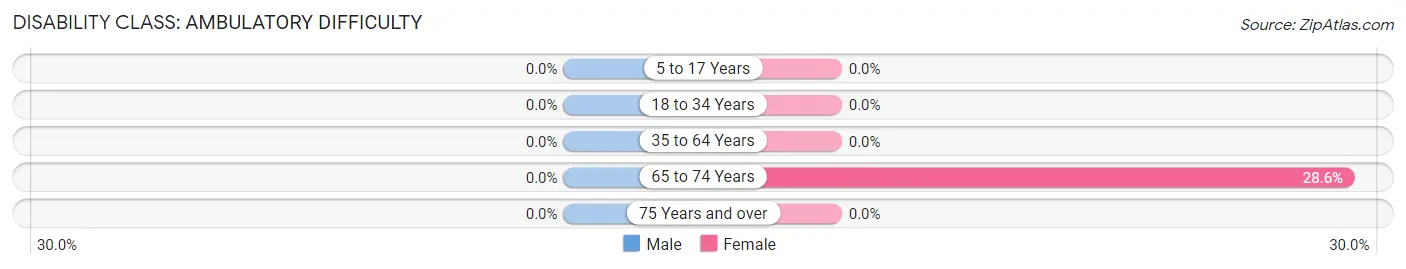
| Age Bracket | Male | Female |
| 5 to 17 Years | 0 (0.0%) | 0 (0.0%) |
| 18 to 34 Years | 0 (0.0%) | 0 (0.0%) |
| 35 to 64 Years | 0 (0.0%) | 0 (0.0%) |
| 65 to 74 Years | 0 (0.0%) | 10 (28.6%) |
| 75 Years and over | 0 (0.0%) | 0 (0.0%) |
Disability Class: Self-Care Difficulty
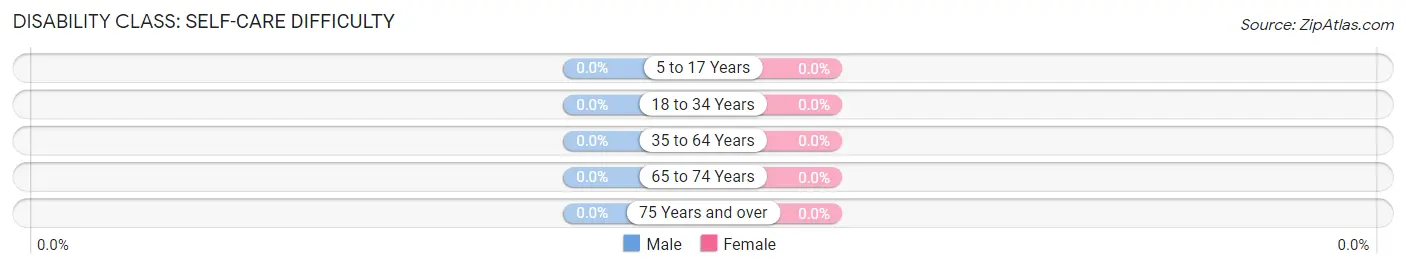
| Age Bracket | Male | Female |
| 5 to 17 Years | 0 (0.0%) | 0 (0.0%) |
| 18 to 34 Years | 0 (0.0%) | 0 (0.0%) |
| 35 to 64 Years | 0 (0.0%) | 0 (0.0%) |
| 65 to 74 Years | 0 (0.0%) | 0 (0.0%) |
| 75 Years and over | 0 (0.0%) | 0 (0.0%) |
Technology Access in Crested Butte
Computing Device Access in Crested Butte
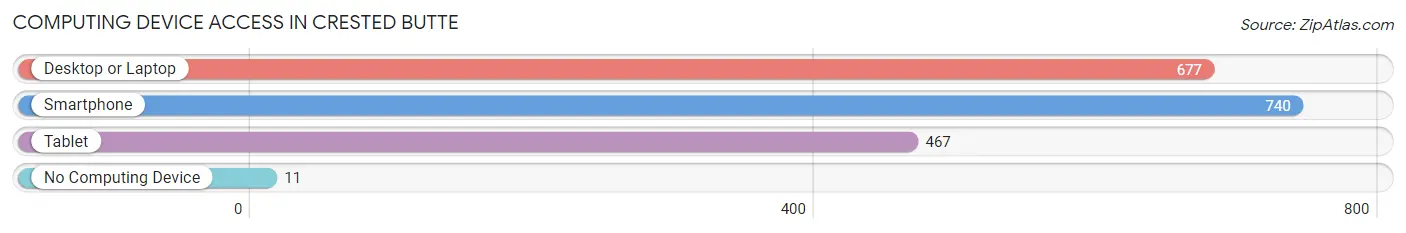
| Device Type | # Households | % Households |
| Desktop or Laptop | 677 | 89.2% |
| Smartphone | 740 | 97.5% |
| Tablet | 467 | 61.5% |
| No Computing Device | 11 | 1.5% |
| Total | 759 | 100.0% |
Internet Access in Crested Butte
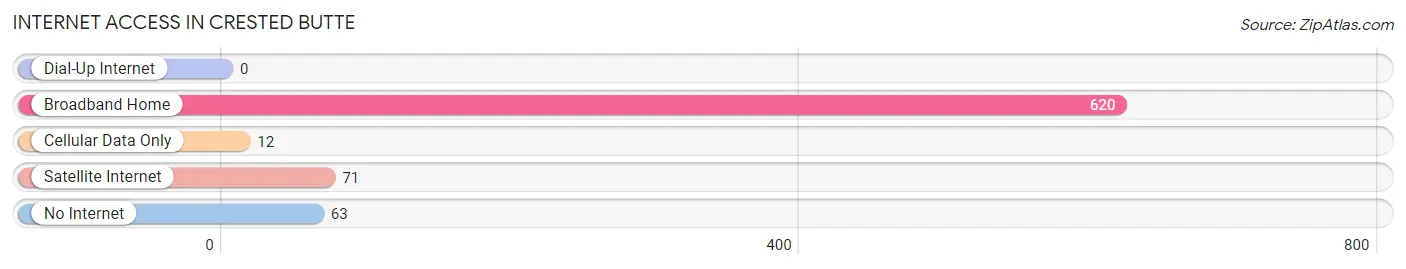
| Internet Type | # Households | % Households |
| Dial-Up Internet | 0 | 0.0% |
| Broadband Home | 620 | 81.7% |
| Cellular Data Only | 12 | 1.6% |
| Satellite Internet | 71 | 9.3% |
| No Internet | 63 | 8.3% |
| Total | 759 | 100.0% |
Crested Butte Summary
Crested Butte, Colorado is a small mountain town located in Gunnison County in the Rocky Mountains of Colorado. It is known for its stunning scenery, outdoor recreation opportunities, and vibrant culture. The town has a population of approximately 1,487 people, and is located at an elevation of 8,885 feet.
History
Crested Butte was founded in 1880 by miners who were drawn to the area by the promise of gold and silver. The town was originally called “Gunnison City” after the nearby Gunnison River, but the name was changed to Crested Butte in 1883. The name was chosen to reflect the town’s location at the base of a mountain with a distinctive crest.
The town quickly grew as miners flocked to the area, and by 1885 it had a population of over 1,000 people. The town was incorporated in 1887, and the first mayor was elected in 1888.
In the late 1800s, Crested Butte was a bustling mining town, with several large mines in operation. The town was also home to a number of saloons, hotels, and other businesses.
In the early 1900s, the mining industry began to decline, and the town’s population began to dwindle. By the 1950s, the town was nearly abandoned.
In the 1960s, the town began to experience a resurgence as people began to move to the area for its outdoor recreation opportunities. The town was designated a National Historic District in 1977, and in the 1980s it became a popular destination for skiers and snowboarders.
Geography
Crested Butte is located in the Rocky Mountains of Colorado, in Gunnison County. The town is situated at an elevation of 8,885 feet, and is surrounded by mountains and forests. The town is located near the headwaters of the Gunnison River, and is close to several ski resorts, including Crested Butte Mountain Resort and Monarch Mountain.
The town is located in a valley, and is surrounded by several mountain peaks, including Crested Butte Mountain, Mount Emmons, and Mount Axtell. The town is also close to several lakes, including Lake Irwin, Lake Irwin Reservoir, and Lake Irwin National Wildlife Refuge.
Economy
Crested Butte’s economy is largely based on tourism and outdoor recreation. The town is home to several ski resorts, including Crested Butte Mountain Resort and Monarch Mountain. The town is also home to several restaurants, bars, and shops.
The town is also home to several businesses that cater to the outdoor recreation industry, including bike shops, outdoor gear stores, and guide services. The town is also home to several art galleries, and is a popular destination for art lovers.
Demographics
As of the 2010 census, the population of Crested Butte was 1,487. The town is predominantly white, with 91.3% of the population identifying as white. The town also has a small Hispanic population, with 4.3% of the population identifying as Hispanic or Latino.
The median household income in Crested Butte is $50,938, and the median home value is $521,400. The town has a high cost of living, with the cost of living index being 132.7, which is higher than the national average of 100.
Conclusion
Crested Butte, Colorado is a small mountain town located in Gunnison County in the Rocky Mountains of Colorado. It is known for its stunning scenery, outdoor recreation opportunities, and vibrant culture. The town has a population of approximately 1,487 people, and is located at an elevation of 8,885 feet. The town’s economy is largely based on tourism and outdoor recreation, and the town is home to several ski resorts, restaurants, bars, and shops. The town is predominantly white, with 91.3% of the population identifying as white. The median household income in Crested Butte is $50,938, and the median home value is $521,400.
Common Questions
What is Per Capita Income in Crested Butte?
Per Capita income in Crested Butte is $55,078.
What is the Median Family Income in Crested Butte?
Median Family Income in Crested Butte is $162,596.
What is the Median Household income in Crested Butte?
Median Household Income in Crested Butte is $67,625.
What is Income or Wage Gap in Crested Butte?
Income or Wage Gap in Crested Butte is 9.6%.
Women in Crested Butte earn 90.4 cents for every dollar earned by a man.
What is Inequality or Gini Index in Crested Butte?
Inequality or Gini Index in Crested Butte is 0.42.
What is the Total Population of Crested Butte?
Total Population of Crested Butte is 1,434.
What is the Total Male Population of Crested Butte?
Total Male Population of Crested Butte is 797.
What is the Total Female Population of Crested Butte?
Total Female Population of Crested Butte is 637.
What is the Ratio of Males per 100 Females in Crested Butte?
There are 125.12 Males per 100 Females in Crested Butte.
What is the Ratio of Females per 100 Males in Crested Butte?
There are 79.92 Females per 100 Males in Crested Butte.
What is the Median Population Age in Crested Butte?
Median Population Age in Crested Butte is 41.5 Years.
What is the Average Family Size in Crested Butte
Average Family Size in Crested Butte is 3.0 People.
What is the Average Household Size in Crested Butte
Average Household Size in Crested Butte is 1.9 People.
How Large is the Labor Force in Crested Butte?
There are 948 People in the Labor Forcein in Crested Butte.
What is the Percentage of People in the Labor Force in Crested Butte?
77.3% of People are in the Labor Force in Crested Butte.
What is the Unemployment Rate in Crested Butte?
Unemployment Rate in Crested Butte is 6.1%.