Federal Heights, CO Map & Demographics
Federal Heights Map
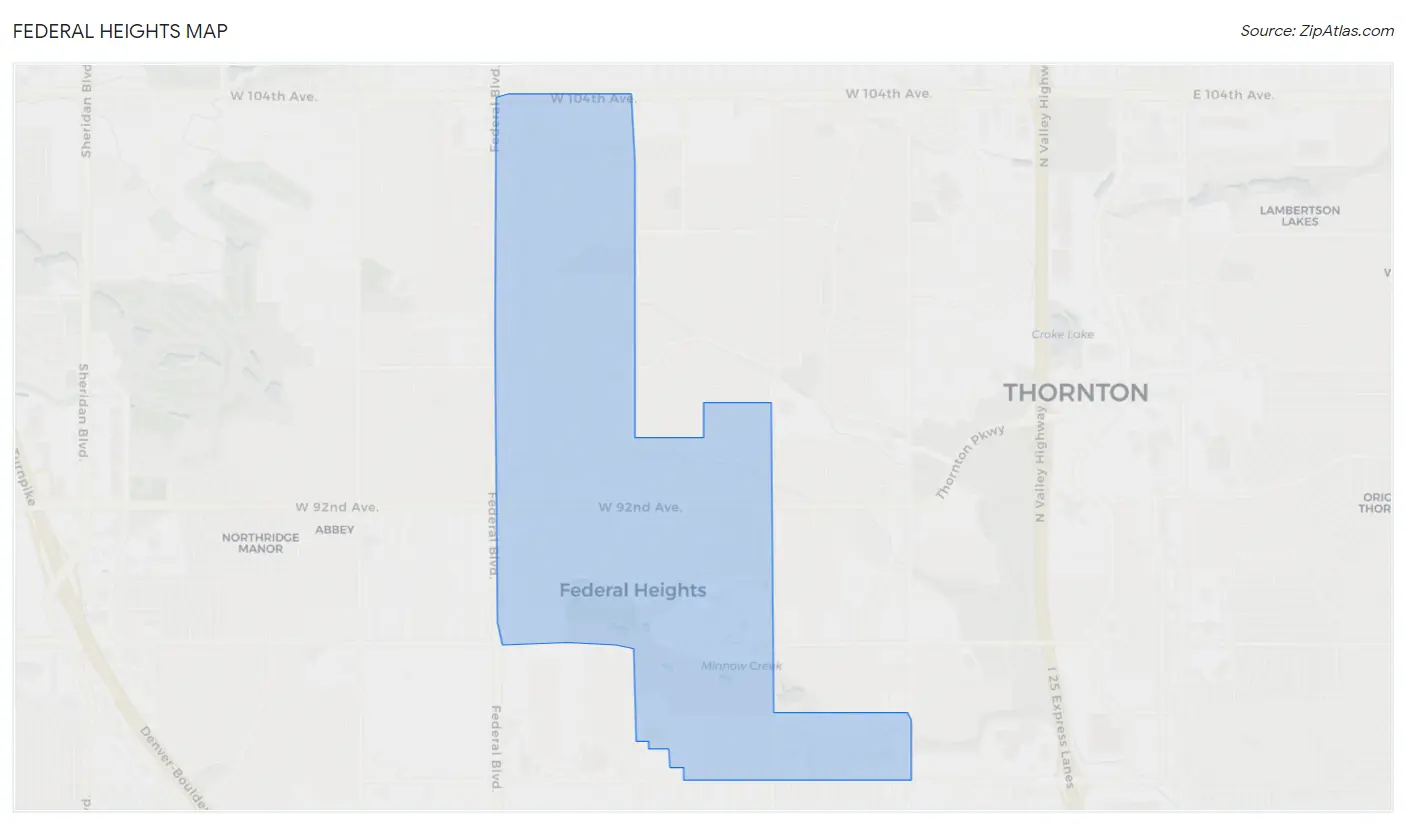
Federal Heights Overview
$24,263
PER CAPITA INCOME
$65,283
AVG FAMILY INCOME
$56,316
AVG HOUSEHOLD INCOME
25.2%
WAGE / INCOME GAP [ % ]
74.8¢/ $1
WAGE / INCOME GAP [ $ ]
$14,318
FAMILY INCOME DEFICIT
0.38
INEQUALITY / GINI INDEX
14,173
TOTAL POPULATION
7,595
MALE POPULATION
6,578
FEMALE POPULATION
115.46
MALES / 100 FEMALES
86.61
FEMALES / 100 MALES
31.7
MEDIAN AGE
3.5
AVG FAMILY SIZE
2.8
AVG HOUSEHOLD SIZE
7,243
LABOR FORCE [ PEOPLE ]
69.9%
PERCENT IN LABOR FORCE
3.8%
UNEMPLOYMENT RATE
Income in Federal Heights
Income Overview in Federal Heights
Per Capita Income in Federal Heights is $24,263, while median incomes of families and households are $65,283 and $56,316 respectively.
| Characteristic | Number | Measure |
| Per Capita Income | 14,173 | $24,263 |
| Median Family Income | 3,224 | $65,283 |
| Mean Family Income | 3,224 | $72,392 |
| Median Household Income | 5,092 | $56,316 |
| Mean Household Income | 5,092 | $65,767 |
| Income Deficit | 3,224 | $14,318 |
| Wage / Income Gap (%) | 14,173 | 25.23% |
| Wage / Income Gap ($) | 14,173 | 74.77¢ per $1 |
| Gini / Inequality Index | 14,173 | 0.38 |
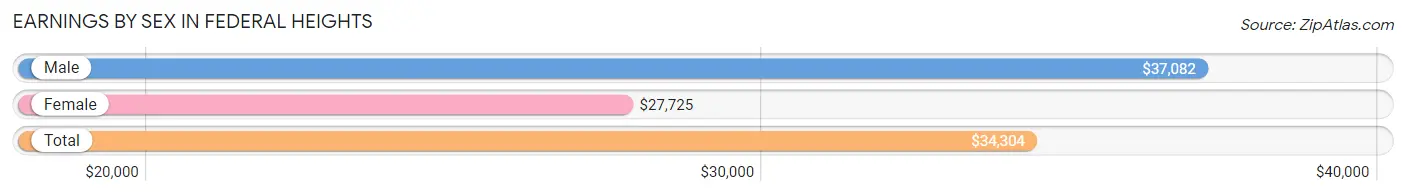
Earnings by Sex in Federal Heights
Average Earnings in Federal Heights are $34,304, $37,082 for men and $27,725 for women, a difference of 25.2%.
| Sex | Number | Average Earnings |
| Male | 4,349 (58.3%) | $37,082 |
| Female | 3,112 (41.7%) | $27,725 |
| Total | 7,461 (100.0%) | $34,304 |
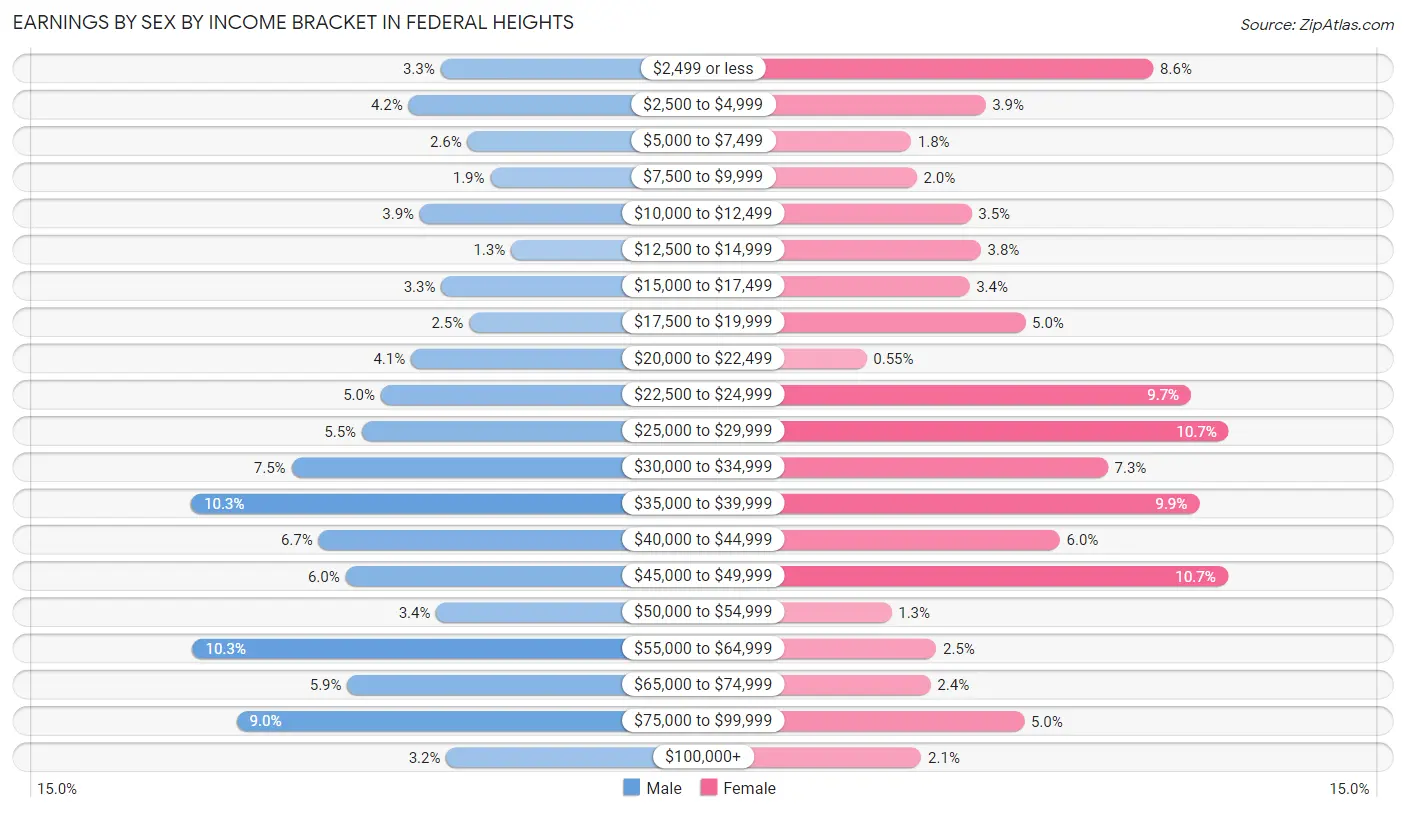
Earnings by Sex by Income Bracket in Federal Heights
The most common earnings brackets in Federal Heights are $35,000 to $39,999 for men (449 | 10.3%) and $25,000 to $29,999 for women (334 | 10.7%).
| Income | Male | Female |
| $2,499 or less | 144 (3.3%) | 268 (8.6%) |
| $2,500 to $4,999 | 183 (4.2%) | 121 (3.9%) |
| $5,000 to $7,499 | 111 (2.5%) | 56 (1.8%) |
| $7,500 to $9,999 | 83 (1.9%) | 61 (2.0%) |
| $10,000 to $12,499 | 169 (3.9%) | 109 (3.5%) |
| $12,500 to $14,999 | 58 (1.3%) | 117 (3.8%) |
| $15,000 to $17,499 | 143 (3.3%) | 107 (3.4%) |
| $17,500 to $19,999 | 109 (2.5%) | 156 (5.0%) |
| $20,000 to $22,499 | 180 (4.1%) | 17 (0.5%) |
| $22,500 to $24,999 | 217 (5.0%) | 301 (9.7%) |
| $25,000 to $29,999 | 240 (5.5%) | 334 (10.7%) |
| $30,000 to $34,999 | 326 (7.5%) | 228 (7.3%) |
| $35,000 to $39,999 | 449 (10.3%) | 308 (9.9%) |
| $40,000 to $44,999 | 293 (6.7%) | 186 (6.0%) |
| $45,000 to $49,999 | 260 (6.0%) | 333 (10.7%) |
| $50,000 to $54,999 | 149 (3.4%) | 39 (1.3%) |
| $55,000 to $64,999 | 447 (10.3%) | 78 (2.5%) |
| $65,000 to $74,999 | 258 (5.9%) | 73 (2.4%) |
| $75,000 to $99,999 | 393 (9.0%) | 155 (5.0%) |
| $100,000+ | 137 (3.2%) | 65 (2.1%) |
| Total | 4,349 (100.0%) | 3,112 (100.0%) |
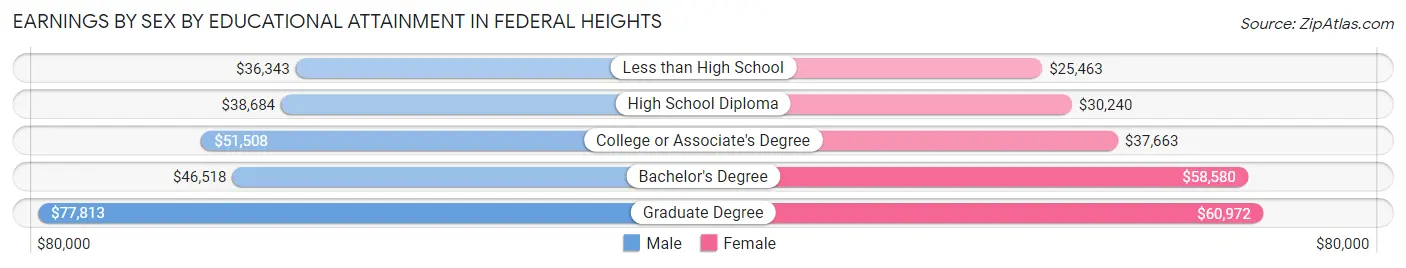
Earnings by Sex by Educational Attainment in Federal Heights
Average earnings in Federal Heights are $40,706 for men and $30,391 for women, a difference of 25.3%. Men with an educational attainment of graduate degree enjoy the highest average annual earnings of $77,813, while those with less than high school education earn the least with $36,343. Women with an educational attainment of graduate degree earn the most with the average annual earnings of $60,972, while those with less than high school education have the smallest earnings of $25,463.
| Educational Attainment | Male Income | Female Income |
| Less than High School | $36,343 | $25,463 |
| High School Diploma | $38,684 | $30,240 |
| College or Associate's Degree | $51,508 | $37,663 |
| Bachelor's Degree | $46,518 | $58,580 |
| Graduate Degree | $77,813 | $60,972 |
| Total | $40,706 | $30,391 |
Family Income in Federal Heights
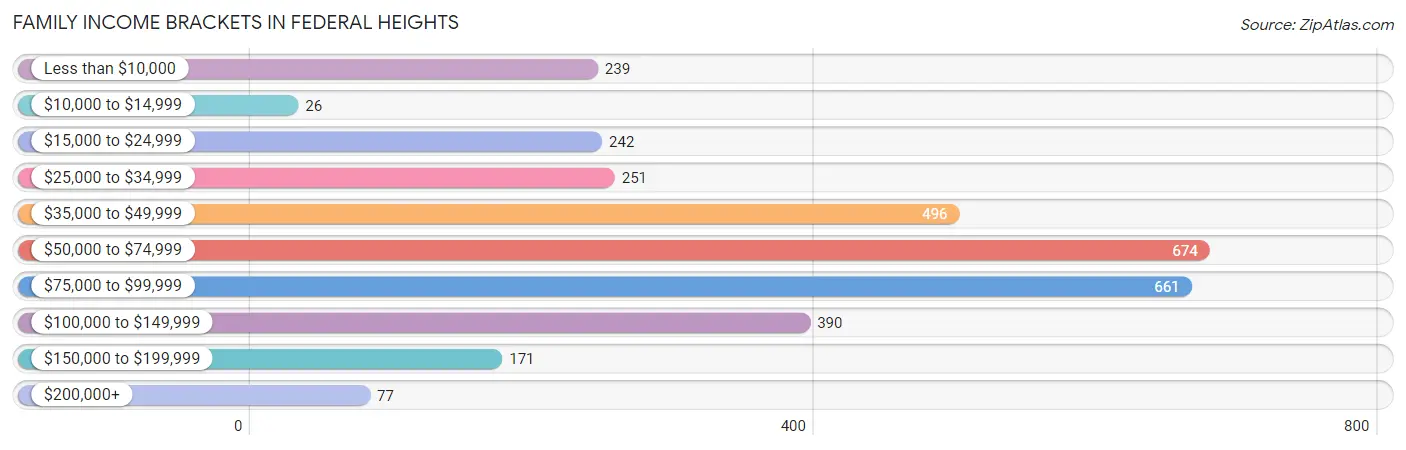
Family Income Brackets in Federal Heights
According to the Federal Heights family income data, there are 674 families falling into the $50,000 to $74,999 income range, which is the most common income bracket and makes up 20.9% of all families. Conversely, the $10,000 to $14,999 income bracket is the least frequent group with only 26 families (0.8%) belonging to this category.
| Income Bracket | # Families | % Families |
| Less than $10,000 | 239 | 7.4% |
| $10,000 to $14,999 | 26 | 0.8% |
| $15,000 to $24,999 | 242 | 7.5% |
| $25,000 to $34,999 | 251 | 7.8% |
| $35,000 to $49,999 | 496 | 15.4% |
| $50,000 to $74,999 | 674 | 20.9% |
| $75,000 to $99,999 | 661 | 20.5% |
| $100,000 to $149,999 | 390 | 12.1% |
| $150,000 to $199,999 | 171 | 5.3% |
| $200,000+ | 77 | 2.4% |
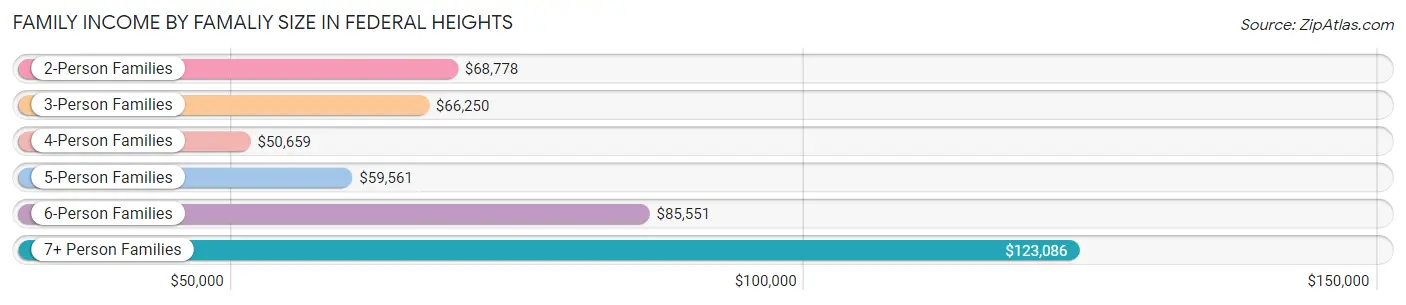
Family Income by Famaliy Size in Federal Heights
7+ person families (49 | 1.5%) account for the highest median family income in Federal Heights with $123,086 per family, while 2-person families (1,245 | 38.6%) have the highest median income of $34,389 per family member.
| Income Bracket | # Families | Median Income |
| 2-Person Families | 1,245 (38.6%) | $68,778 |
| 3-Person Families | 653 (20.3%) | $66,250 |
| 4-Person Families | 689 (21.4%) | $50,659 |
| 5-Person Families | 307 (9.5%) | $59,561 |
| 6-Person Families | 281 (8.7%) | $85,551 |
| 7+ Person Families | 49 (1.5%) | $123,086 |
| Total | 3,224 (100.0%) | $65,283 |
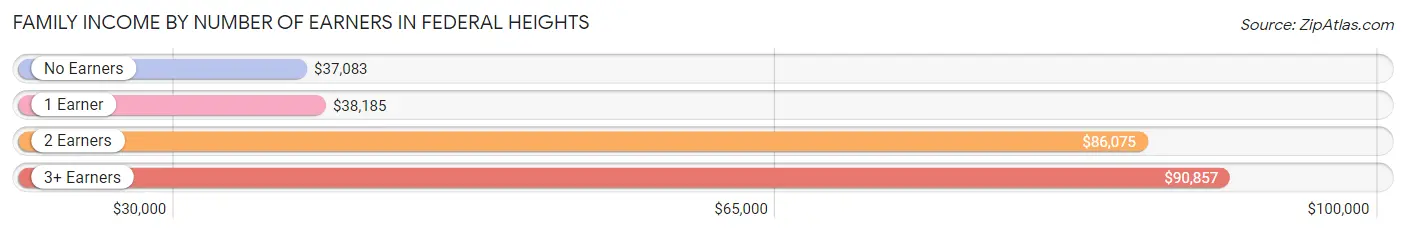
Family Income by Number of Earners in Federal Heights
The median family income in Federal Heights is $65,283, with families comprising 3+ earners (536) having the highest median family income of $90,857, while families with no earners (345) have the lowest median family income of $37,083, accounting for 16.6% and 10.7% of families, respectively.
| Number of Earners | # Families | Median Income |
| No Earners | 345 (10.7%) | $37,083 |
| 1 Earner | 1,397 (43.3%) | $38,185 |
| 2 Earners | 946 (29.3%) | $86,075 |
| 3+ Earners | 536 (16.6%) | $90,857 |
| Total | 3,224 (100.0%) | $65,283 |
Household Income in Federal Heights
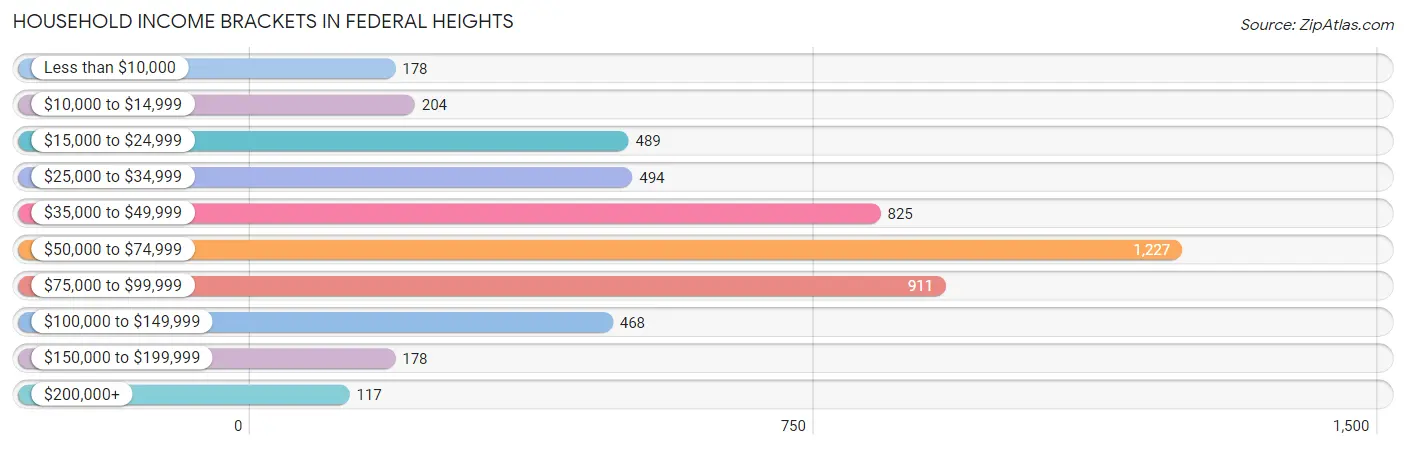
Household Income Brackets in Federal Heights
With 1,227 households falling in the category, the $50,000 to $74,999 income range is the most frequent in Federal Heights, accounting for 24.1% of all households. In contrast, only 117 households (2.3%) fall into the $200,000+ income bracket, making it the least populous group.
| Income Bracket | # Households | % Households |
| Less than $10,000 | 178 | 3.5% |
| $10,000 to $14,999 | 204 | 4.0% |
| $15,000 to $24,999 | 489 | 9.6% |
| $25,000 to $34,999 | 494 | 9.7% |
| $35,000 to $49,999 | 825 | 16.2% |
| $50,000 to $74,999 | 1,227 | 24.1% |
| $75,000 to $99,999 | 911 | 17.9% |
| $100,000 to $149,999 | 468 | 9.2% |
| $150,000 to $199,999 | 178 | 3.5% |
| $200,000+ | 117 | 2.3% |
Household Income by Householder Age in Federal Heights
The median household income in Federal Heights is $56,316, with the highest median household income of $64,883 found in the 25 to 44 years age bracket for the primary householder. A total of 2,329 households (45.7%) fall into this category. Meanwhile, the 65+ years age bracket for the primary householder has the lowest median household income of $49,271, with 1,104 households (21.7%) in this group.
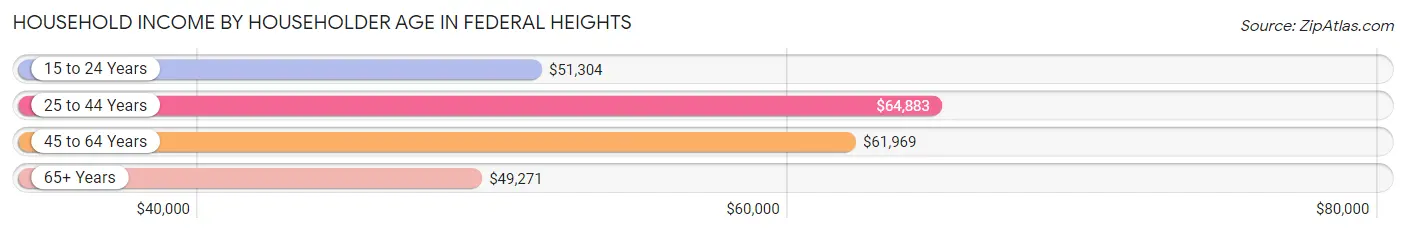
| Income Bracket | # Households | Median Income |
| 15 to 24 Years | 306 (6.0%) | $51,304 |
| 25 to 44 Years | 2,329 (45.7%) | $64,883 |
| 45 to 64 Years | 1,353 (26.6%) | $61,969 |
| 65+ Years | 1,104 (21.7%) | $49,271 |
| Total | 5,092 (100.0%) | $56,316 |
Poverty in Federal Heights
Income Below Poverty by Sex and Age in Federal Heights
With 16.5% poverty level for males and 18.7% for females among the residents of Federal Heights, 5 year old males and under 5 year old females are the most vulnerable to poverty, with 12 males (100.0%) and 218 females (35.8%) in their respective age groups living below the poverty level.
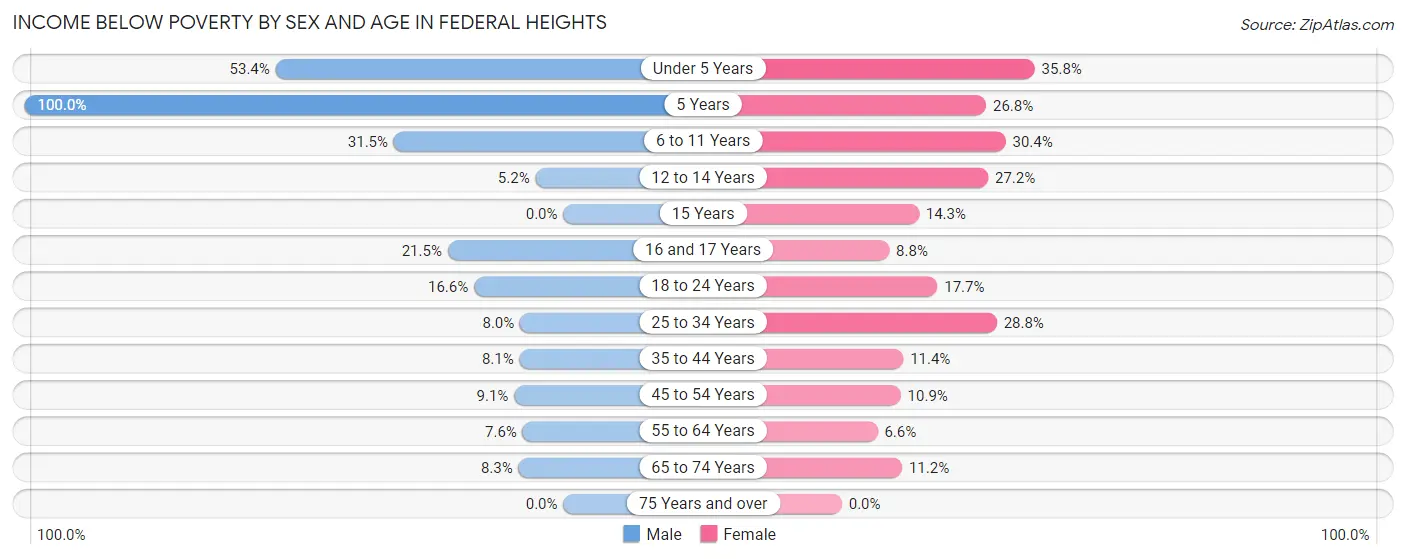
| Age Bracket | Male | Female |
| Under 5 Years | 392 (53.4%) | 218 (35.8%) |
| 5 Years | 12 (100.0%) | 34 (26.8%) |
| 6 to 11 Years | 297 (31.5%) | 169 (30.4%) |
| 12 to 14 Years | 15 (5.2%) | 79 (27.2%) |
| 15 Years | 0 (0.0%) | 23 (14.3%) |
| 16 and 17 Years | 44 (21.5%) | 8 (8.8%) |
| 18 to 24 Years | 135 (16.6%) | 89 (17.7%) |
| 25 to 34 Years | 116 (8.0%) | 337 (28.7%) |
| 35 to 44 Years | 87 (8.1%) | 91 (11.4%) |
| 45 to 54 Years | 59 (9.1%) | 59 (10.9%) |
| 55 to 64 Years | 45 (7.5%) | 55 (6.6%) |
| 65 to 74 Years | 48 (8.3%) | 69 (11.2%) |
| 75 Years and over | 0 (0.0%) | 0 (0.0%) |
| Total | 1,250 (16.5%) | 1,231 (18.7%) |
Income Above Poverty by Sex and Age in Federal Heights
According to the poverty statistics in Federal Heights, males aged 15 years and females aged 75 years and over are the age groups that are most secure financially, with 100.0% of males and 100.0% of females in these age groups living above the poverty line.
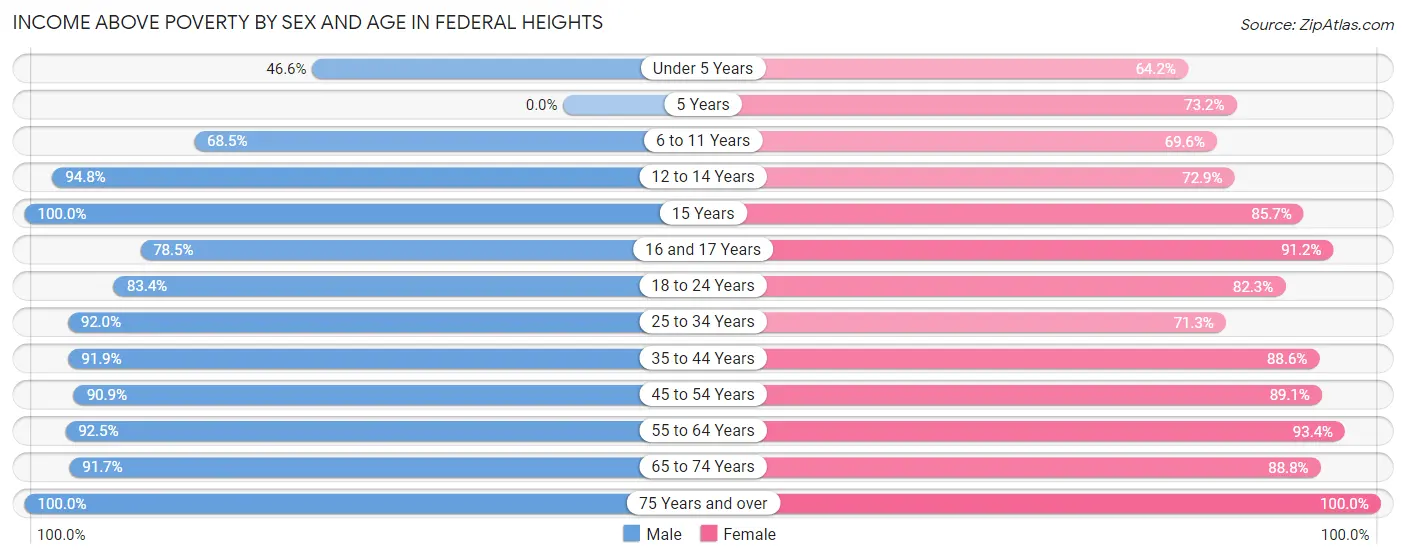
| Age Bracket | Male | Female |
| Under 5 Years | 342 (46.6%) | 391 (64.2%) |
| 5 Years | 0 (0.0%) | 93 (73.2%) |
| 6 to 11 Years | 647 (68.5%) | 387 (69.6%) |
| 12 to 14 Years | 275 (94.8%) | 212 (72.9%) |
| 15 Years | 87 (100.0%) | 138 (85.7%) |
| 16 and 17 Years | 161 (78.5%) | 83 (91.2%) |
| 18 to 24 Years | 679 (83.4%) | 413 (82.3%) |
| 25 to 34 Years | 1,330 (92.0%) | 835 (71.3%) |
| 35 to 44 Years | 983 (91.9%) | 707 (88.6%) |
| 45 to 54 Years | 587 (90.9%) | 481 (89.1%) |
| 55 to 64 Years | 551 (92.4%) | 776 (93.4%) |
| 65 to 74 Years | 529 (91.7%) | 549 (88.8%) |
| 75 Years and over | 174 (100.0%) | 282 (100.0%) |
| Total | 6,345 (83.5%) | 5,347 (81.3%) |
Income Below Poverty Among Married-Couple Families in Federal Heights
The poverty statistics for married-couple families in Federal Heights show that 8.1% or 141 of the total 1,735 families live below the poverty line. Families with 5 or more children have the highest poverty rate of 84.6%, comprising of 11 families. On the other hand, families with no children have the lowest poverty rate of 3.2%, which includes 29 families.
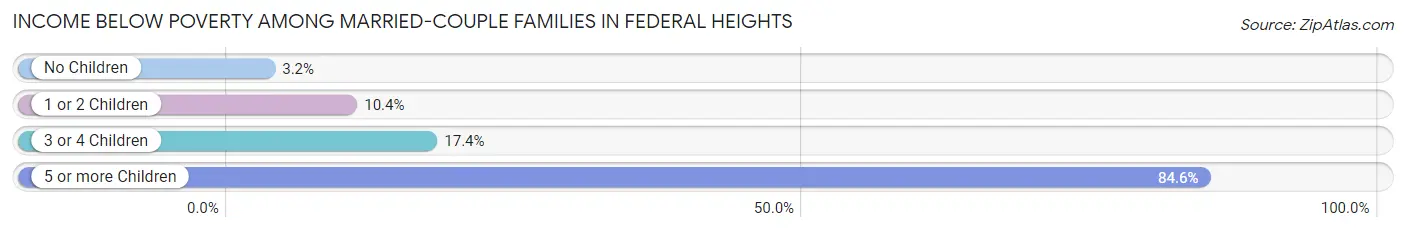
| Children | Above Poverty | Below Poverty |
| No Children | 867 (96.8%) | 29 (3.2%) |
| 1 or 2 Children | 544 (89.6%) | 63 (10.4%) |
| 3 or 4 Children | 181 (82.7%) | 38 (17.3%) |
| 5 or more Children | 2 (15.4%) | 11 (84.6%) |
| Total | 1,594 (91.9%) | 141 (8.1%) |
Income Below Poverty Among Single-Parent Households in Federal Heights
According to the poverty data in Federal Heights, 9.3% or 65 single-father households and 37.9% or 301 single-mother households are living below the poverty line. Among single-father households, those with 3 or 4 children have the highest poverty rate, with 49 households (17.7%) experiencing poverty. Likewise, among single-mother households, those with 1 or 2 children have the highest poverty rate, with 231 households (53.5%) falling below the poverty line.
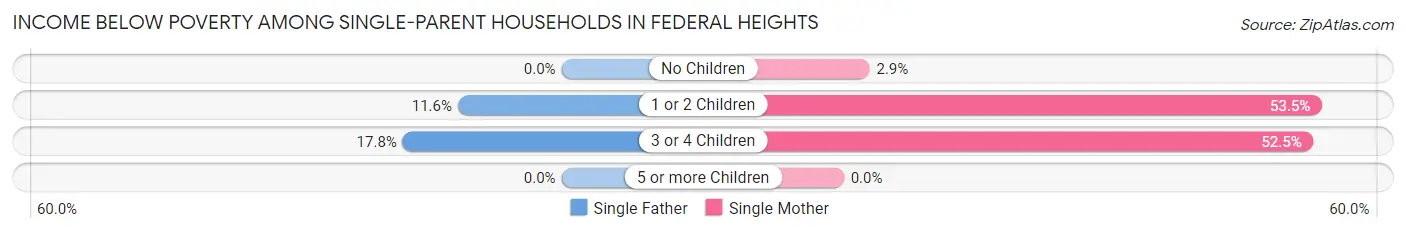
| Children | Single Father | Single Mother |
| No Children | 0 (0.0%) | 7 (2.9%) |
| 1 or 2 Children | 16 (11.6%) | 231 (53.5%) |
| 3 or 4 Children | 49 (17.7%) | 63 (52.5%) |
| 5 or more Children | 0 (0.0%) | 0 (0.0%) |
| Total | 65 (9.3%) | 301 (37.9%) |
Income Below Poverty Among Married-Couple vs Single-Parent Households in Federal Heights
The poverty data for Federal Heights shows that 141 of the married-couple family households (8.1%) and 366 of the single-parent households (24.6%) are living below the poverty level. Within the married-couple family households, those with 5 or more children have the highest poverty rate, with 11 households (84.6%) falling below the poverty line. Among the single-parent households, those with 1 or 2 children have the highest poverty rate, with 247 household (43.3%) living below poverty.
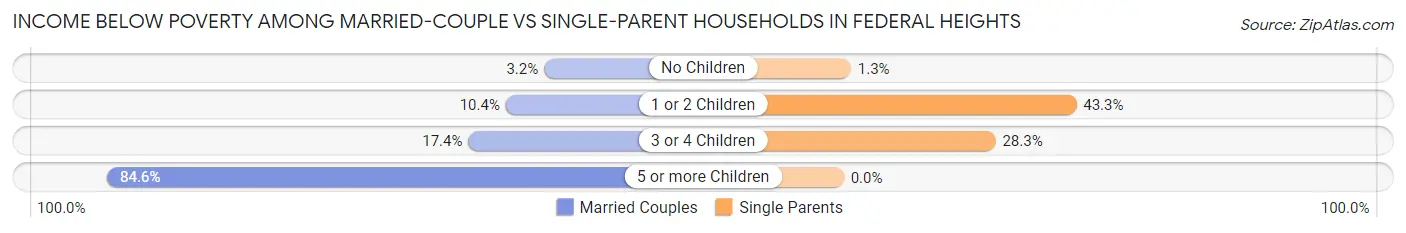
| Children | Married-Couple Families | Single-Parent Households |
| No Children | 29 (3.2%) | 7 (1.3%) |
| 1 or 2 Children | 63 (10.4%) | 247 (43.3%) |
| 3 or 4 Children | 38 (17.3%) | 112 (28.3%) |
| 5 or more Children | 11 (84.6%) | 0 (0.0%) |
| Total | 141 (8.1%) | 366 (24.6%) |
Race in Federal Heights
The most populous races in Federal Heights are White / Caucasian (8,704 | 61.4%), Hispanic or Latino (8,562 | 60.4%), and Two or more Races (3,024 | 21.3%).
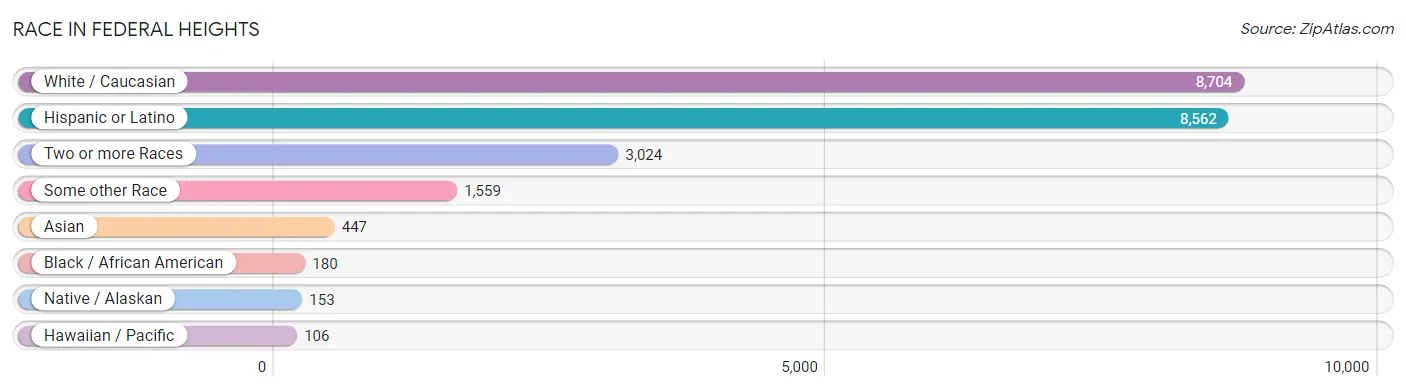
| Race | # Population | % Population |
| Asian | 447 | 3.2% |
| Black / African American | 180 | 1.3% |
| Hawaiian / Pacific | 106 | 0.7% |
| Hispanic or Latino | 8,562 | 60.4% |
| Native / Alaskan | 153 | 1.1% |
| White / Caucasian | 8,704 | 61.4% |
| Two or more Races | 3,024 | 21.3% |
| Some other Race | 1,559 | 11.0% |
| Total | 14,173 | 100.0% |
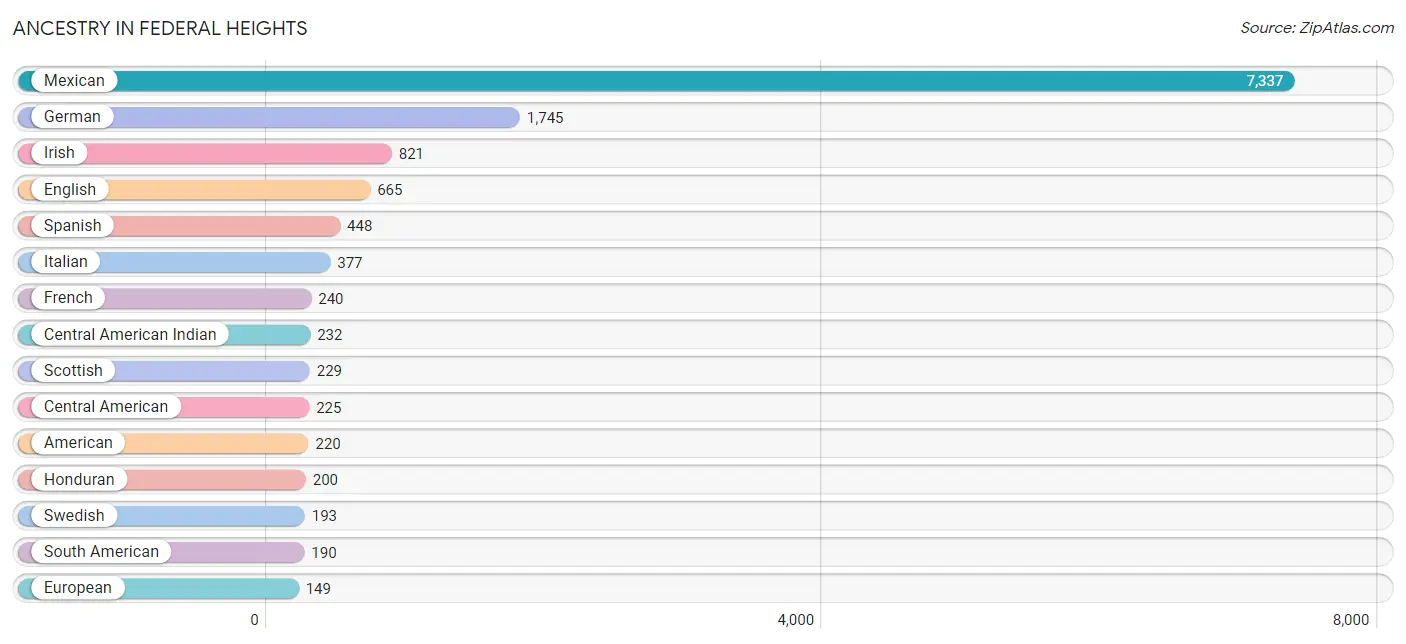
Ancestry in Federal Heights
The most populous ancestries reported in Federal Heights are Mexican (7,337 | 51.8%), German (1,745 | 12.3%), Irish (821 | 5.8%), English (665 | 4.7%), and Spanish (448 | 3.2%), together accounting for 77.7% of all Federal Heights residents.
| Ancestry | # Population | % Population |
| African | 82 | 0.6% |
| Alaska Native | 4 | 0.0% |
| American | 220 | 1.5% |
| Austrian | 6 | 0.0% |
| Bolivian | 104 | 0.7% |
| British | 120 | 0.9% |
| Burmese | 70 | 0.5% |
| Central American | 225 | 1.6% |
| Central American Indian | 232 | 1.6% |
| Cherokee | 15 | 0.1% |
| Chippewa | 17 | 0.1% |
| Colombian | 23 | 0.2% |
| Costa Rican | 8 | 0.1% |
| Czech | 18 | 0.1% |
| Danish | 27 | 0.2% |
| Dutch | 90 | 0.6% |
| Ecuadorian | 16 | 0.1% |
| English | 665 | 4.7% |
| European | 149 | 1.1% |
| French | 240 | 1.7% |
| French Canadian | 36 | 0.3% |
| German | 1,745 | 12.3% |
| German Russian | 8 | 0.1% |
| Greek | 37 | 0.3% |
| Honduran | 200 | 1.4% |
| Hungarian | 9 | 0.1% |
| Indian (Asian) | 96 | 0.7% |
| Irish | 821 | 5.8% |
| Italian | 377 | 2.7% |
| Jamaican | 22 | 0.2% |
| Korean | 36 | 0.3% |
| Lithuanian | 67 | 0.5% |
| Malaysian | 123 | 0.9% |
| Mexican | 7,337 | 51.8% |
| Northern European | 4 | 0.0% |
| Norwegian | 67 | 0.5% |
| Pennsylvania German | 6 | 0.0% |
| Peruvian | 47 | 0.3% |
| Polish | 60 | 0.4% |
| Pueblo | 22 | 0.2% |
| Puerto Rican | 28 | 0.2% |
| Romanian | 53 | 0.4% |
| Russian | 14 | 0.1% |
| Salvadoran | 17 | 0.1% |
| Scandinavian | 52 | 0.4% |
| Scotch-Irish | 98 | 0.7% |
| Scottish | 229 | 1.6% |
| Serbian | 15 | 0.1% |
| Sioux | 26 | 0.2% |
| South American | 190 | 1.3% |
| Spaniard | 65 | 0.5% |
| Spanish | 448 | 3.2% |
| Subsaharan African | 82 | 0.6% |
| Swedish | 193 | 1.4% |
| Swiss | 16 | 0.1% |
| Ukrainian | 40 | 0.3% |
| Welsh | 81 | 0.6% | View All 57 Rows |
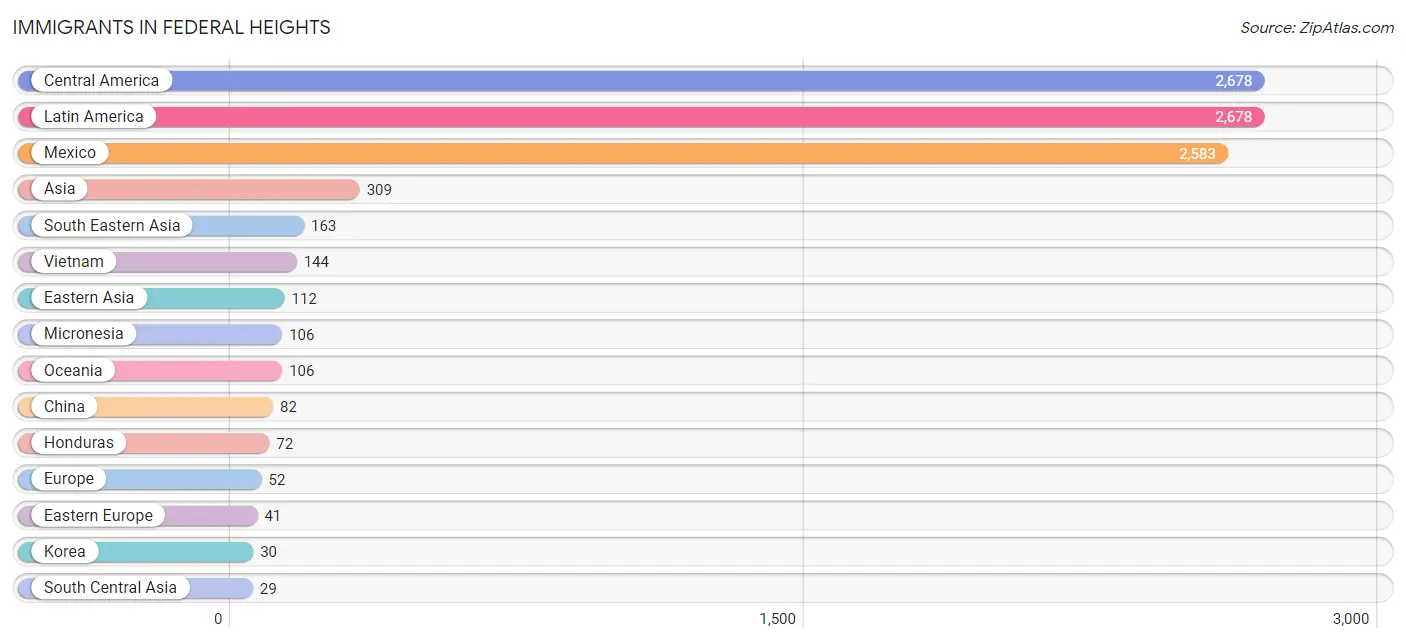
Immigrants in Federal Heights
The most numerous immigrant groups reported in Federal Heights came from Central America (2,678 | 18.9%), Latin America (2,678 | 18.9%), Mexico (2,583 | 18.2%), Asia (309 | 2.2%), and South Eastern Asia (163 | 1.1%), together accounting for 59.4% of all Federal Heights residents.
| Immigration Origin | # Population | % Population |
| Asia | 309 | 2.2% |
| Central America | 2,678 | 18.9% |
| China | 82 | 0.6% |
| Costa Rica | 8 | 0.1% |
| Czechoslovakia | 18 | 0.1% |
| Eastern Asia | 112 | 0.8% |
| Eastern Europe | 41 | 0.3% |
| El Salvador | 15 | 0.1% |
| Europe | 52 | 0.4% |
| Germany | 11 | 0.1% |
| Honduras | 72 | 0.5% |
| Hungary | 9 | 0.1% |
| Kazakhstan | 12 | 0.1% |
| Korea | 30 | 0.2% |
| Latin America | 2,678 | 18.9% |
| Mexico | 2,583 | 18.2% |
| Micronesia | 106 | 0.7% |
| Moldova | 14 | 0.1% |
| Nepal | 17 | 0.1% |
| Oceania | 106 | 0.7% |
| Philippines | 19 | 0.1% |
| South Central Asia | 29 | 0.2% |
| South Eastern Asia | 163 | 1.1% |
| Vietnam | 144 | 1.0% |
| Western Europe | 11 | 0.1% | View All 25 Rows |
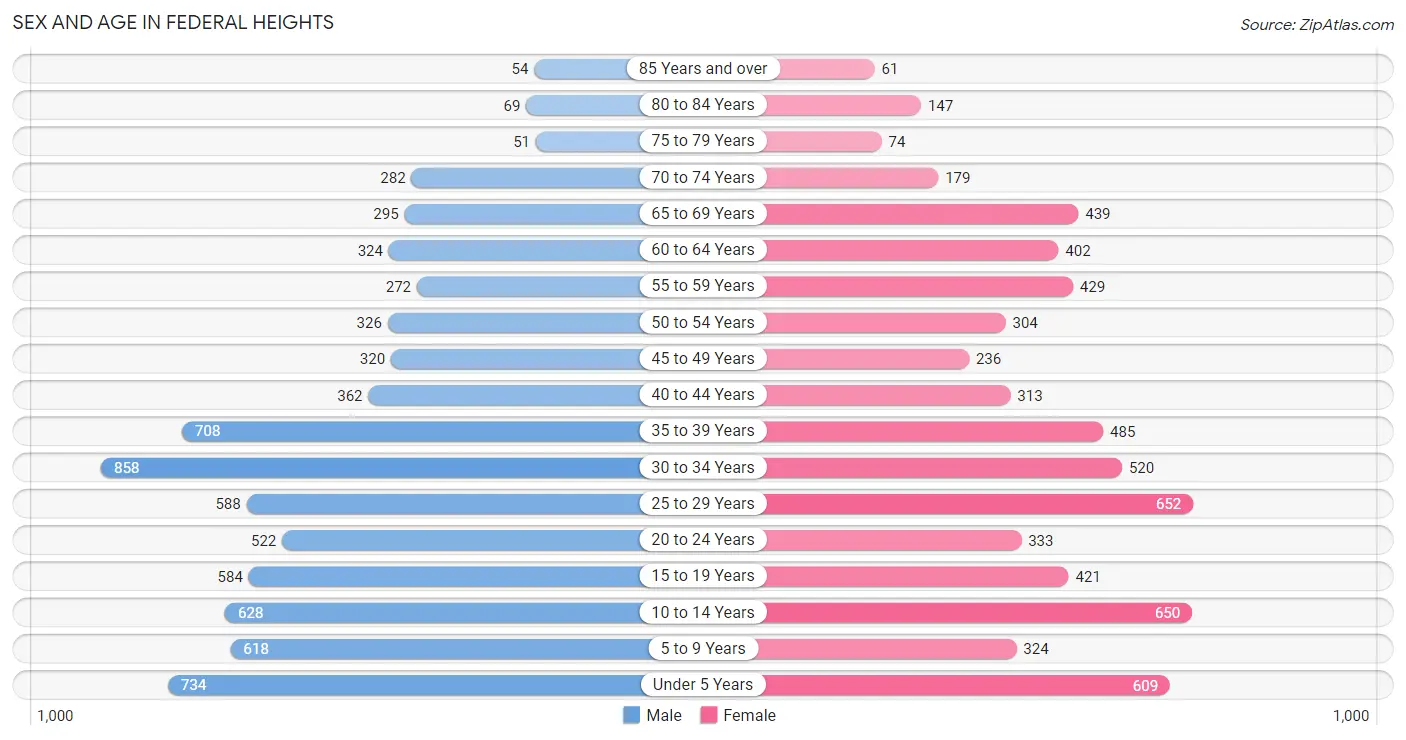
Sex and Age in Federal Heights
Sex and Age in Federal Heights
The most populous age groups in Federal Heights are 30 to 34 Years (858 | 11.3%) for men and 25 to 29 Years (652 | 9.9%) for women.
| Age Bracket | Male | Female |
| Under 5 Years | 734 (9.7%) | 609 (9.3%) |
| 5 to 9 Years | 618 (8.1%) | 324 (4.9%) |
| 10 to 14 Years | 628 (8.3%) | 650 (9.9%) |
| 15 to 19 Years | 584 (7.7%) | 421 (6.4%) |
| 20 to 24 Years | 522 (6.9%) | 333 (5.1%) |
| 25 to 29 Years | 588 (7.7%) | 652 (9.9%) |
| 30 to 34 Years | 858 (11.3%) | 520 (7.9%) |
| 35 to 39 Years | 708 (9.3%) | 485 (7.4%) |
| 40 to 44 Years | 362 (4.8%) | 313 (4.8%) |
| 45 to 49 Years | 320 (4.2%) | 236 (3.6%) |
| 50 to 54 Years | 326 (4.3%) | 304 (4.6%) |
| 55 to 59 Years | 272 (3.6%) | 429 (6.5%) |
| 60 to 64 Years | 324 (4.3%) | 402 (6.1%) |
| 65 to 69 Years | 295 (3.9%) | 439 (6.7%) |
| 70 to 74 Years | 282 (3.7%) | 179 (2.7%) |
| 75 to 79 Years | 51 (0.7%) | 74 (1.1%) |
| 80 to 84 Years | 69 (0.9%) | 147 (2.2%) |
| 85 Years and over | 54 (0.7%) | 61 (0.9%) |
| Total | 7,595 (100.0%) | 6,578 (100.0%) |
Families and Households in Federal Heights
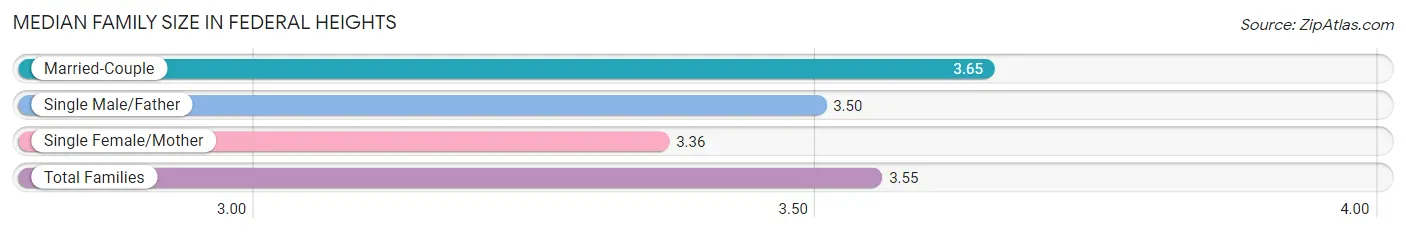
Median Family Size in Federal Heights
The median family size in Federal Heights is 3.55 persons per family, with married-couple families (1,735 | 53.8%) accounting for the largest median family size of 3.65 persons per family. On the other hand, single female/mother families (794 | 24.6%) represent the smallest median family size with 3.36 persons per family.
| Family Type | # Families | Family Size |
| Married-Couple | 1,735 (53.8%) | 3.65 |
| Single Male/Father | 695 (21.6%) | 3.50 |
| Single Female/Mother | 794 (24.6%) | 3.36 |
| Total Families | 3,224 (100.0%) | 3.55 |
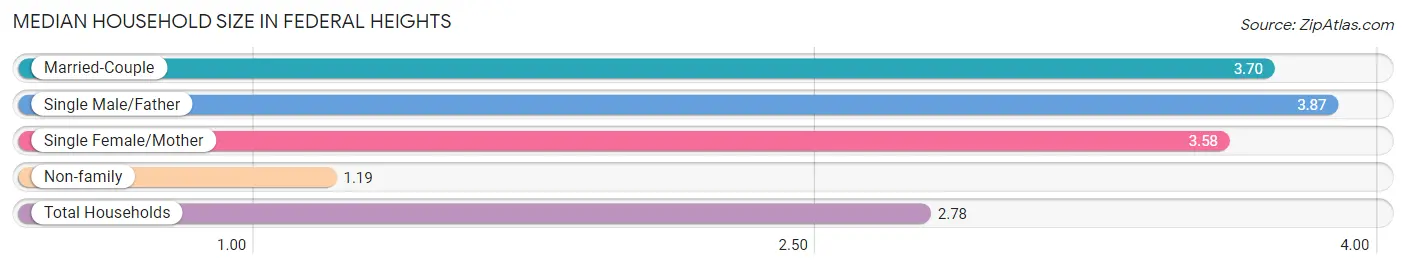
Median Household Size in Federal Heights
The median household size in Federal Heights is 2.78 persons per household, with single male/father households (695 | 13.7%) accounting for the largest median household size of 3.87 persons per household. non-family households (1,868 | 36.7%) represent the smallest median household size with 1.19 persons per household.
| Household Type | # Households | Household Size |
| Married-Couple | 1,735 (34.1%) | 3.70 |
| Single Male/Father | 695 (13.7%) | 3.87 |
| Single Female/Mother | 794 (15.6%) | 3.58 |
| Non-family | 1,868 (36.7%) | 1.19 |
| Total Households | 5,092 (100.0%) | 2.78 |
Household Size by Marriage Status in Federal Heights
Out of a total of 5,092 households in Federal Heights, 3,224 (63.3%) are family households, while 1,868 (36.7%) are nonfamily households. The most numerous type of family households are 2-person households, comprising 1,128, and the most common type of nonfamily households are 1-person households, comprising 1,515.
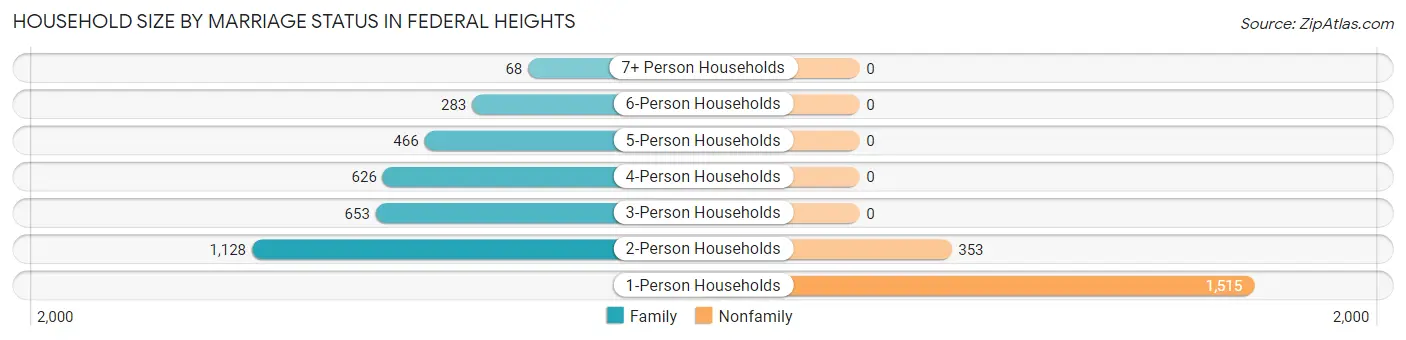
| Household Size | Family Households | Nonfamily Households |
| 1-Person Households | - | 1,515 (29.7%) |
| 2-Person Households | 1,128 (22.2%) | 353 (6.9%) |
| 3-Person Households | 653 (12.8%) | 0 (0.0%) |
| 4-Person Households | 626 (12.3%) | 0 (0.0%) |
| 5-Person Households | 466 (9.1%) | 0 (0.0%) |
| 6-Person Households | 283 (5.6%) | 0 (0.0%) |
| 7+ Person Households | 68 (1.3%) | 0 (0.0%) |
| Total | 3,224 (63.3%) | 1,868 (36.7%) |
Female Fertility in Federal Heights
Fertility by Age in Federal Heights
Average fertility rate in Federal Heights is 85.0 births per 1,000 women. Women in the age bracket of 20 to 34 years have the highest fertility rate with 145.0 births per 1,000 women. Women in the age bracket of 20 to 34 years acount for 85.2% of all women with births.
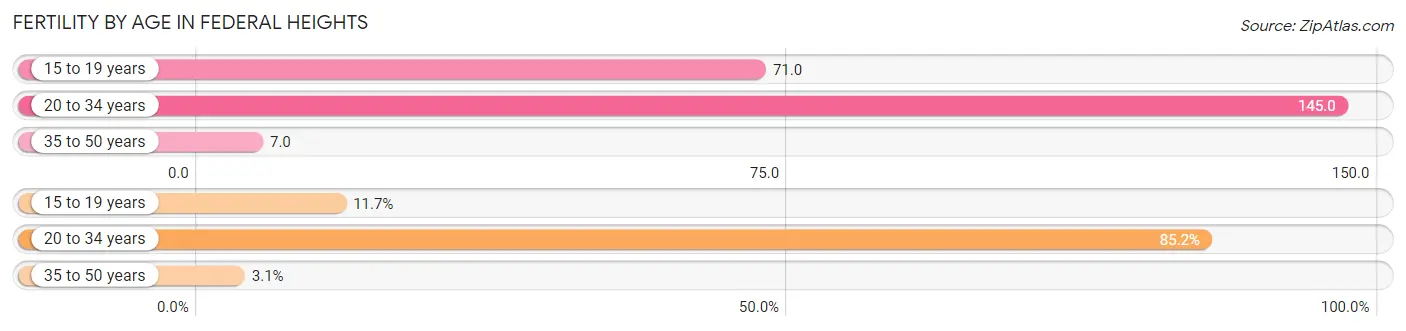
| Age Bracket | Women with Births | Births / 1,000 Women |
| 15 to 19 years | 30 (11.7%) | 71.0 |
| 20 to 34 years | 218 (85.2%) | 145.0 |
| 35 to 50 years | 8 (3.1%) | 7.0 |
| Total | 256 (100.0%) | 85.0 |
Fertility by Age by Marriage Status in Federal Heights
52.0% of women with births (256) in Federal Heights are married. The highest percentage of unmarried women with births falls into 15 to 19 years age bracket with 100.0% of them unmarried at the time of birth, while the lowest percentage of unmarried women with births belong to 20 to 34 years age bracket with 39.0% of them unmarried.
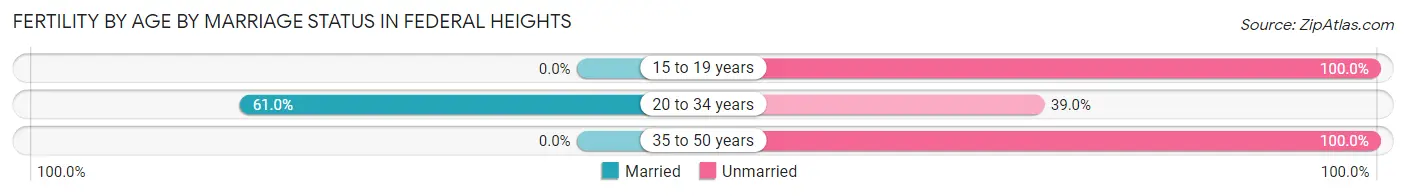
| Age Bracket | Married | Unmarried |
| 15 to 19 years | 0 (0.0%) | 30 (100.0%) |
| 20 to 34 years | 133 (61.0%) | 85 (39.0%) |
| 35 to 50 years | 0 (0.0%) | 8 (100.0%) |
| Total | 133 (51.9%) | 123 (48.0%) |
Fertility by Education in Federal Heights
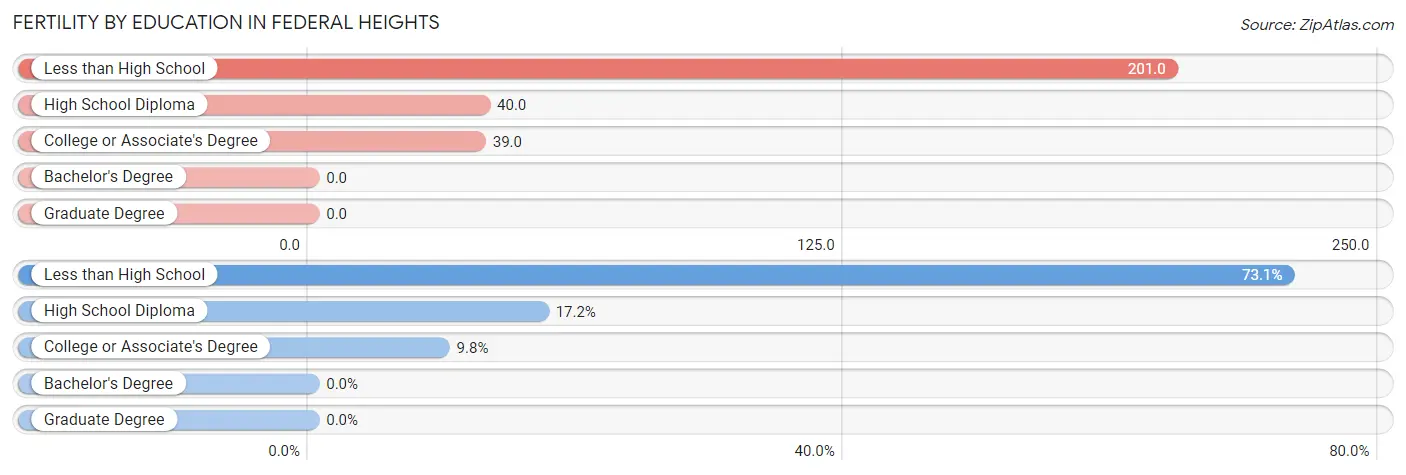
| Educational Attainment | Women with Births | Births / 1,000 Women |
| Less than High School | 187 (73.1%) | 201.0 |
| High School Diploma | 44 (17.2%) | 40.0 |
| College or Associate's Degree | 25 (9.8%) | 39.0 |
| Bachelor's Degree | 0 (0.0%) | 0.0 |
| Graduate Degree | 0 (0.0%) | 0.0 |
| Total | 256 (100.0%) | 85.0 |
Fertility by Education by Marriage Status in Federal Heights
48.0% of women with births in Federal Heights are unmarried. Women with the educational attainment of high school diploma are most likely to be married with 88.6% of them married at childbirth, while women with the educational attainment of college or associate's degree are least likely to be married with 72.0% of them unmarried at childbirth.
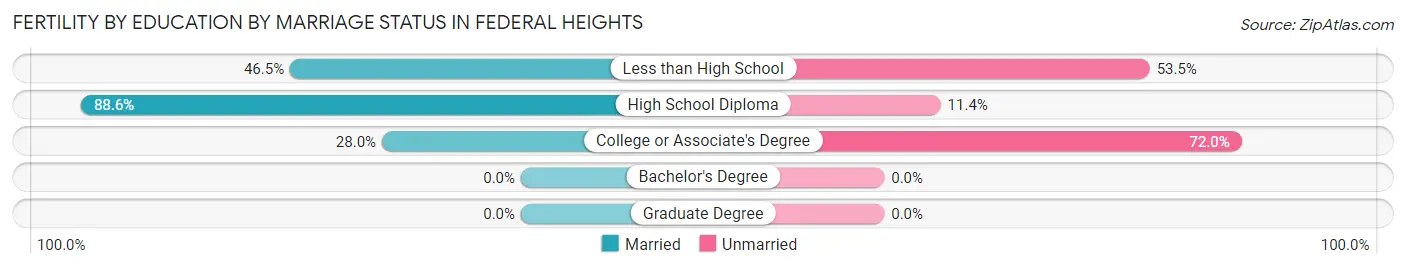
| Educational Attainment | Married | Unmarried |
| Less than High School | 87 (46.5%) | 100 (53.5%) |
| High School Diploma | 39 (88.6%) | 5 (11.4%) |
| College or Associate's Degree | 7 (28.0%) | 18 (72.0%) |
| Bachelor's Degree | 0 (0.0%) | 0 (0.0%) |
| Graduate Degree | 0 (0.0%) | 0 (0.0%) |
| Total | 133 (51.9%) | 123 (48.0%) |
Employment Characteristics in Federal Heights
Employment by Class of Employer in Federal Heights
Among the 6,905 employed individuals in Federal Heights, private company employees (5,565 | 80.6%), local government employees (338 | 4.9%), and self-employed (not incorporated) (317 | 4.6%) make up the most common classes of employment.
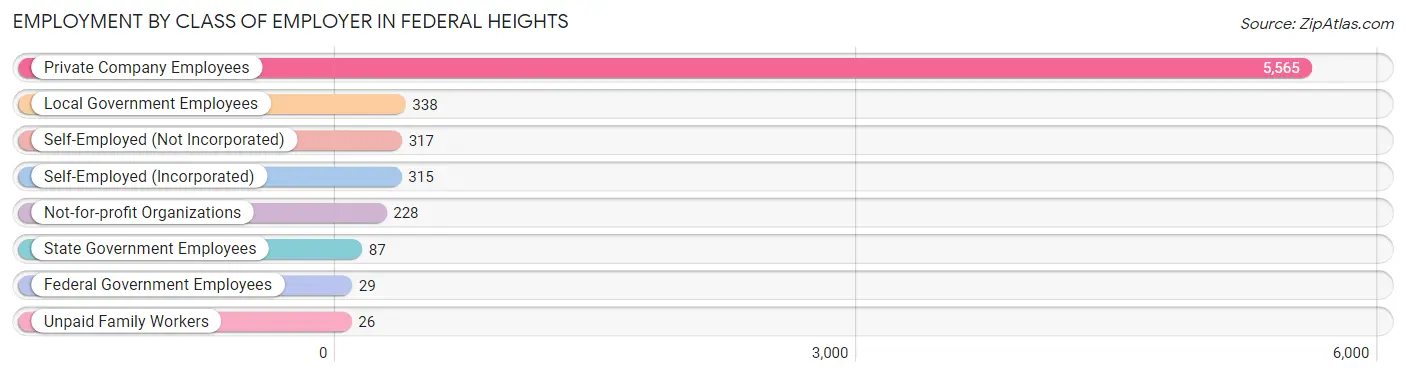
| Employer Class | # Employees | % Employees |
| Private Company Employees | 5,565 | 80.6% |
| Self-Employed (Incorporated) | 315 | 4.6% |
| Self-Employed (Not Incorporated) | 317 | 4.6% |
| Not-for-profit Organizations | 228 | 3.3% |
| Local Government Employees | 338 | 4.9% |
| State Government Employees | 87 | 1.3% |
| Federal Government Employees | 29 | 0.4% |
| Unpaid Family Workers | 26 | 0.4% |
| Total | 6,905 | 100.0% |
Employment Status by Age in Federal Heights
According to the labor force statistics for Federal Heights, out of the total population over 16 years of age (10,362), 69.9% or 7,243 individuals are in the labor force, with 3.8% or 275 of them unemployed. The age group with the highest labor force participation rate is 20 to 24 years, with 86.8% or 742 individuals in the labor force. Within the labor force, the 75 years and over age range has the highest percentage of unemployed individuals, with 22.2% or 6 of them being unemployed.
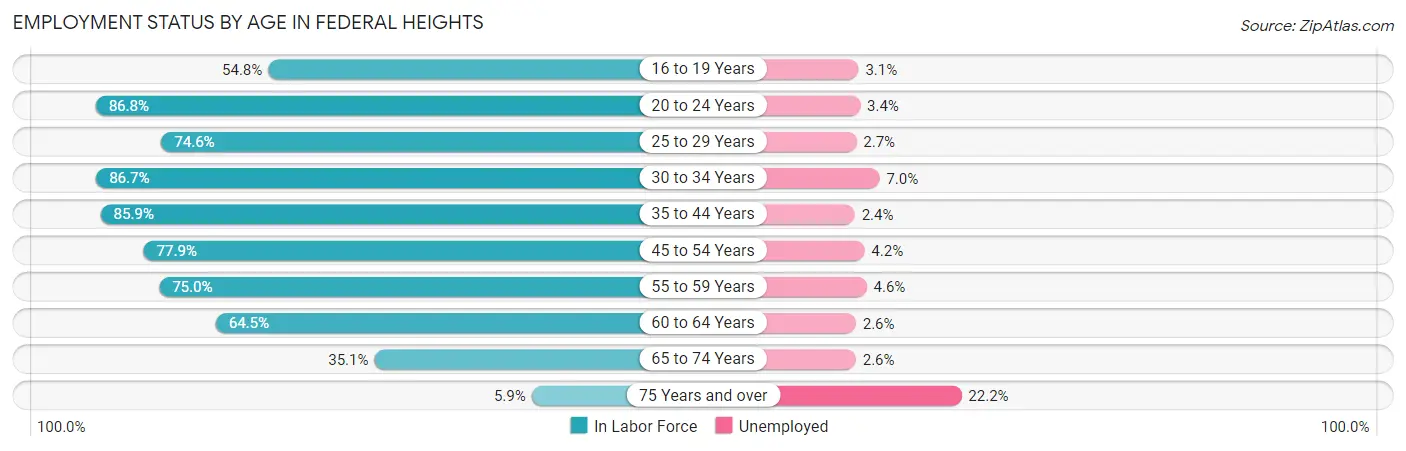
| Age Bracket | In Labor Force | Unemployed |
| 16 to 19 Years | 415 (54.8%) | 13 (3.1%) |
| 20 to 24 Years | 742 (86.8%) | 25 (3.4%) |
| 25 to 29 Years | 925 (74.6%) | 25 (2.7%) |
| 30 to 34 Years | 1,195 (86.7%) | 84 (7.0%) |
| 35 to 44 Years | 1,605 (85.9%) | 39 (2.4%) |
| 45 to 54 Years | 924 (77.9%) | 39 (4.2%) |
| 55 to 59 Years | 526 (75.0%) | 24 (4.6%) |
| 60 to 64 Years | 468 (64.5%) | 12 (2.6%) |
| 65 to 74 Years | 419 (35.1%) | 11 (2.6%) |
| 75 Years and over | 27 (5.9%) | 6 (22.2%) |
| Total | 7,243 (69.9%) | 275 (3.8%) |
Employment Status by Educational Attainment in Federal Heights
According to labor force statistics for Federal Heights, 79.5% of individuals (5,644) out of the total population between 25 and 64 years of age (7,099) are in the labor force, with 4.0% or 226 of them being unemployed. The group with the highest labor force participation rate are those with the educational attainment of bachelor's degree or higher, with 83.9% or 848 individuals in the labor force. Within the labor force, individuals with bachelor's degree or higher education have the highest percentage of unemployment, with 13.4% or 114 of them being unemployed.
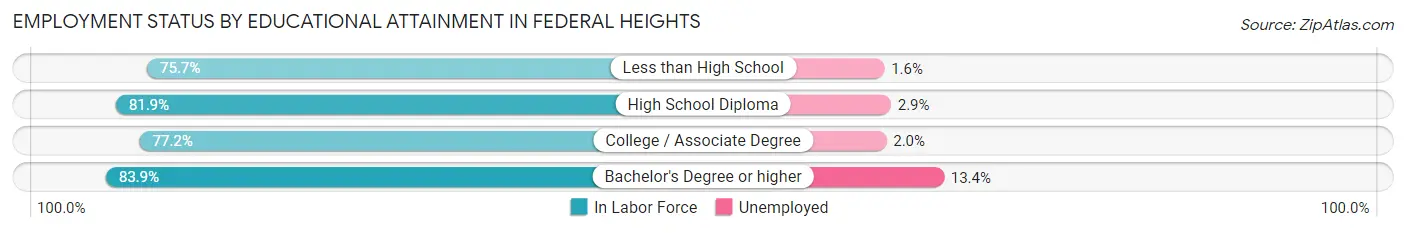
| Educational Attainment | In Labor Force | Unemployed |
| Less than High School | 1,449 (75.7%) | 31 (1.6%) |
| High School Diploma | 2,165 (81.9%) | 77 (2.9%) |
| College / Associate Degree | 1,182 (77.2%) | 31 (2.0%) |
| Bachelor's Degree or higher | 848 (83.9%) | 135 (13.4%) |
| Total | 5,644 (79.5%) | 284 (4.0%) |
Employment Occupations by Sex in Federal Heights
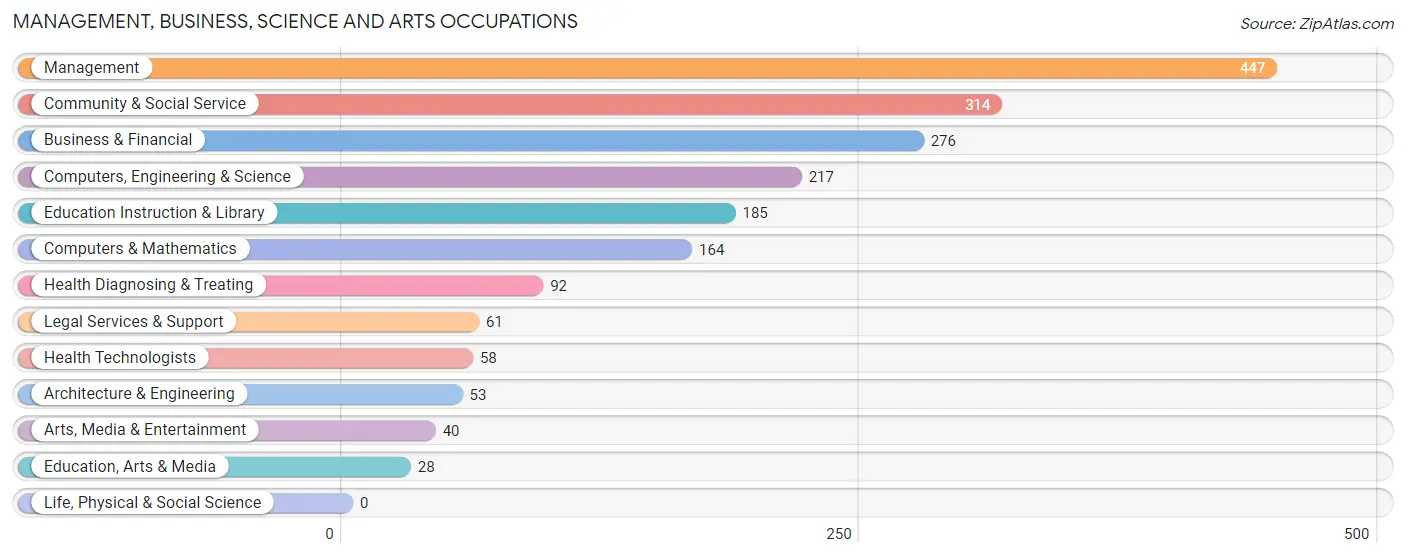
Management, Business, Science and Arts Occupations
The most common Management, Business, Science and Arts occupations in Federal Heights are Management (447 | 6.4%), Community & Social Service (314 | 4.5%), Business & Financial (276 | 4.0%), Computers, Engineering & Science (217 | 3.1%), and Education Instruction & Library (185 | 2.6%).
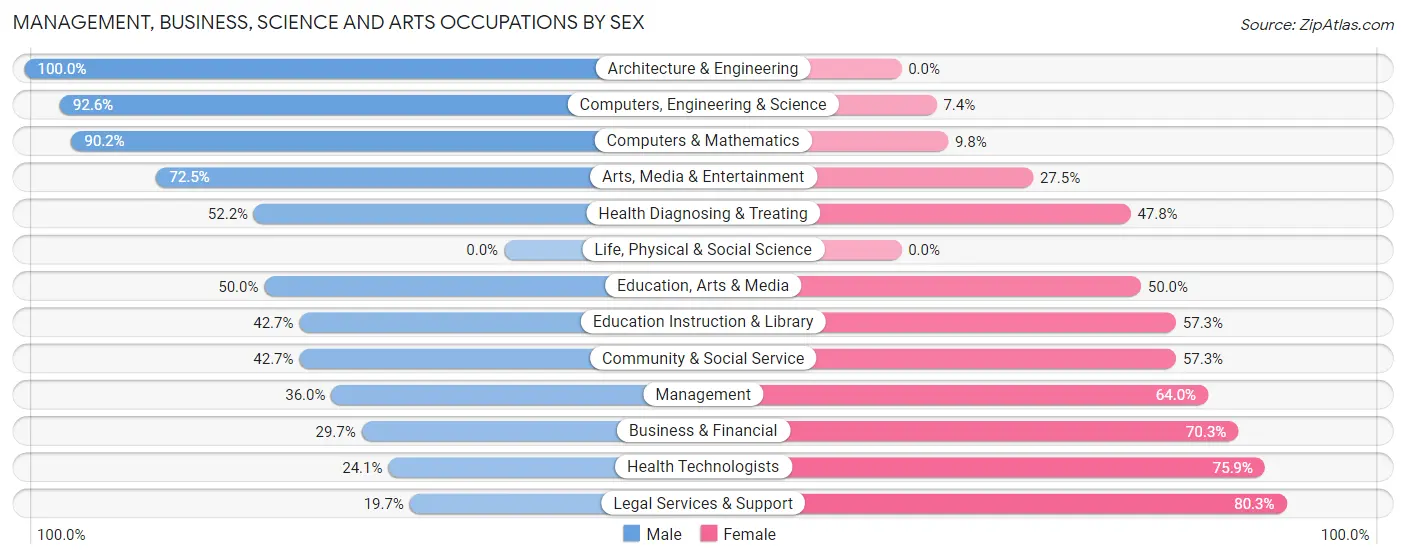
Management, Business, Science and Arts Occupations by Sex
Within the Management, Business, Science and Arts occupations in Federal Heights, the most male-oriented occupations are Architecture & Engineering (100.0%), Computers, Engineering & Science (92.6%), and Computers & Mathematics (90.2%), while the most female-oriented occupations are Legal Services & Support (80.3%), Health Technologists (75.9%), and Business & Financial (70.3%).
| Occupation | Male | Female |
| Management | 161 (36.0%) | 286 (64.0%) |
| Business & Financial | 82 (29.7%) | 194 (70.3%) |
| Computers, Engineering & Science | 201 (92.6%) | 16 (7.4%) |
| Computers & Mathematics | 148 (90.2%) | 16 (9.8%) |
| Architecture & Engineering | 53 (100.0%) | 0 (0.0%) |
| Life, Physical & Social Science | 0 (0.0%) | 0 (0.0%) |
| Community & Social Service | 134 (42.7%) | 180 (57.3%) |
| Education, Arts & Media | 14 (50.0%) | 14 (50.0%) |
| Legal Services & Support | 12 (19.7%) | 49 (80.3%) |
| Education Instruction & Library | 79 (42.7%) | 106 (57.3%) |
| Arts, Media & Entertainment | 29 (72.5%) | 11 (27.5%) |
| Health Diagnosing & Treating | 48 (52.2%) | 44 (47.8%) |
| Health Technologists | 14 (24.1%) | 44 (75.9%) |
| Total (Category) | 626 (46.5%) | 720 (53.5%) |
| Total (Overall) | 4,171 (59.9%) | 2,798 (40.2%) |
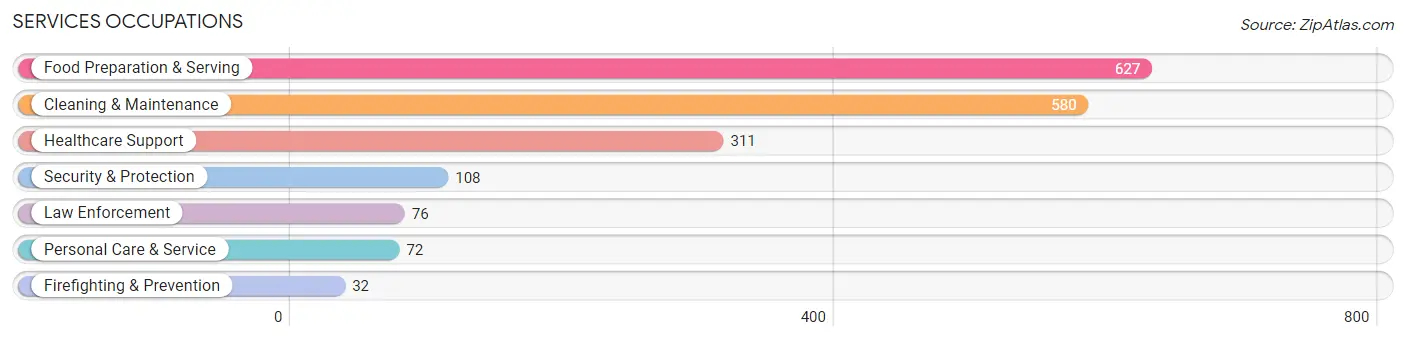
Services Occupations
The most common Services occupations in Federal Heights are Food Preparation & Serving (627 | 9.0%), Cleaning & Maintenance (580 | 8.3%), Healthcare Support (311 | 4.5%), Security & Protection (108 | 1.5%), and Law Enforcement (76 | 1.1%).
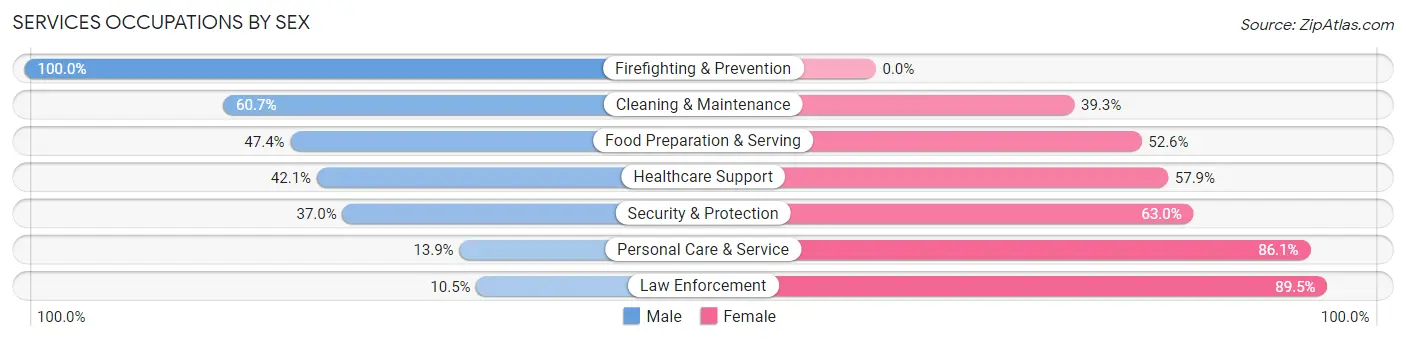
Services Occupations by Sex
Within the Services occupations in Federal Heights, the most male-oriented occupations are Firefighting & Prevention (100.0%), Cleaning & Maintenance (60.7%), and Food Preparation & Serving (47.4%), while the most female-oriented occupations are Law Enforcement (89.5%), Personal Care & Service (86.1%), and Security & Protection (63.0%).
| Occupation | Male | Female |
| Healthcare Support | 131 (42.1%) | 180 (57.9%) |
| Security & Protection | 40 (37.0%) | 68 (63.0%) |
| Firefighting & Prevention | 32 (100.0%) | 0 (0.0%) |
| Law Enforcement | 8 (10.5%) | 68 (89.5%) |
| Food Preparation & Serving | 297 (47.4%) | 330 (52.6%) |
| Cleaning & Maintenance | 352 (60.7%) | 228 (39.3%) |
| Personal Care & Service | 10 (13.9%) | 62 (86.1%) |
| Total (Category) | 830 (48.9%) | 868 (51.1%) |
| Total (Overall) | 4,171 (59.9%) | 2,798 (40.2%) |
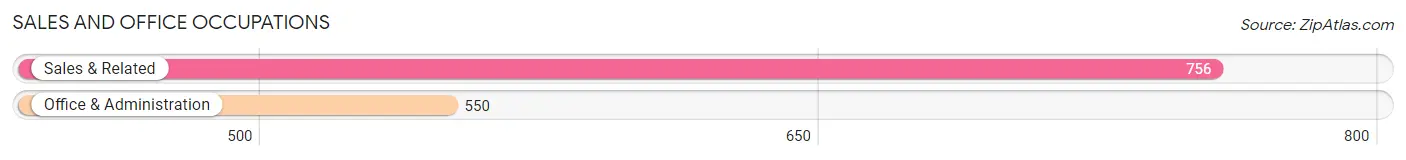
Sales and Office Occupations
The most common Sales and Office occupations in Federal Heights are Sales & Related (756 | 10.8%), and Office & Administration (550 | 7.9%).
Sales and Office Occupations by Sex
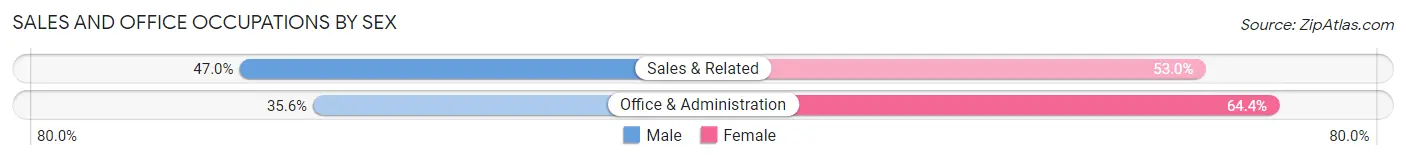
| Occupation | Male | Female |
| Sales & Related | 355 (47.0%) | 401 (53.0%) |
| Office & Administration | 196 (35.6%) | 354 (64.4%) |
| Total (Category) | 551 (42.2%) | 755 (57.8%) |
| Total (Overall) | 4,171 (59.9%) | 2,798 (40.2%) |
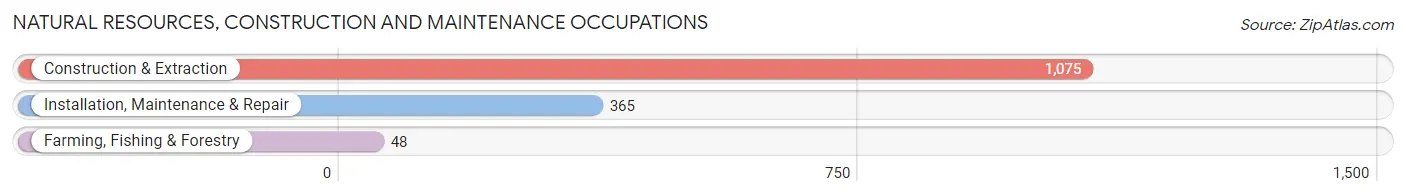
Natural Resources, Construction and Maintenance Occupations
The most common Natural Resources, Construction and Maintenance occupations in Federal Heights are Construction & Extraction (1,075 | 15.4%), Installation, Maintenance & Repair (365 | 5.2%), and Farming, Fishing & Forestry (48 | 0.7%).
Natural Resources, Construction and Maintenance Occupations by Sex
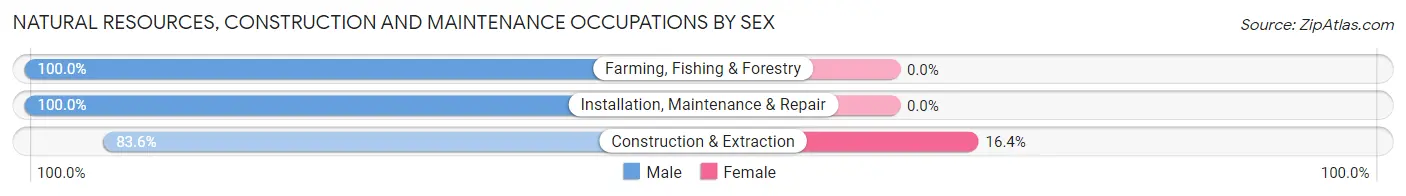
| Occupation | Male | Female |
| Farming, Fishing & Forestry | 48 (100.0%) | 0 (0.0%) |
| Construction & Extraction | 899 (83.6%) | 176 (16.4%) |
| Installation, Maintenance & Repair | 365 (100.0%) | 0 (0.0%) |
| Total (Category) | 1,312 (88.2%) | 176 (11.8%) |
| Total (Overall) | 4,171 (59.9%) | 2,798 (40.2%) |
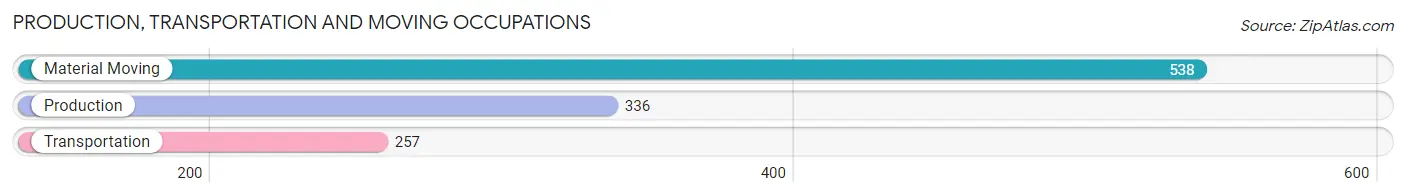
Production, Transportation and Moving Occupations
The most common Production, Transportation and Moving occupations in Federal Heights are Material Moving (538 | 7.7%), Production (336 | 4.8%), and Transportation (257 | 3.7%).
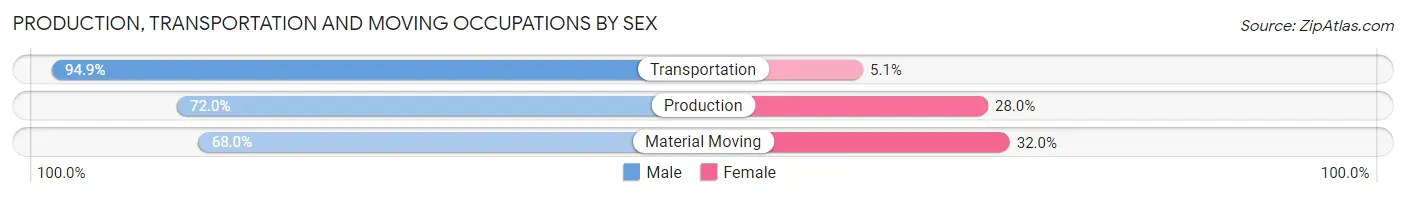
Production, Transportation and Moving Occupations by Sex
| Occupation | Male | Female |
| Production | 242 (72.0%) | 94 (28.0%) |
| Transportation | 244 (94.9%) | 13 (5.1%) |
| Material Moving | 366 (68.0%) | 172 (32.0%) |
| Total (Category) | 852 (75.3%) | 279 (24.7%) |
| Total (Overall) | 4,171 (59.9%) | 2,798 (40.2%) |
Employment Industries by Sex in Federal Heights
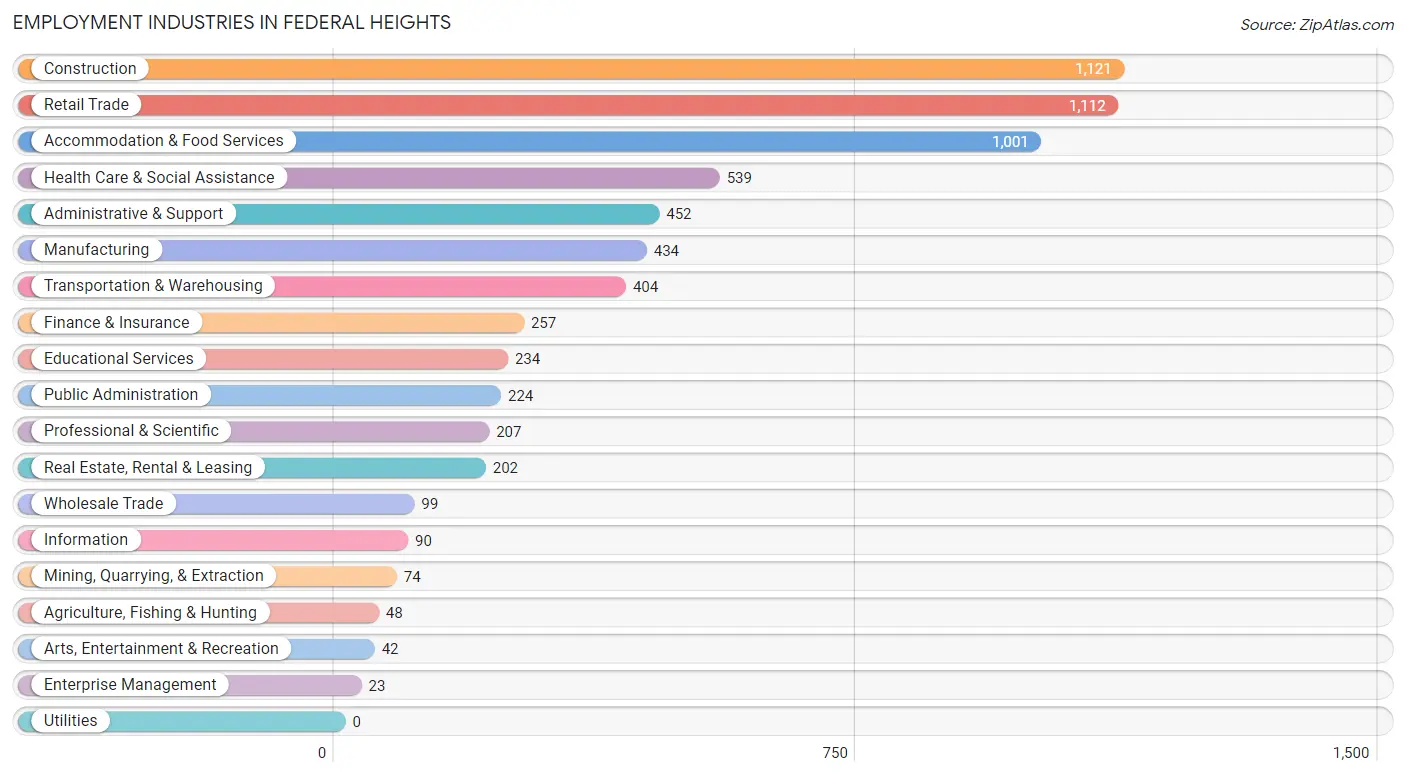
Employment Industries in Federal Heights
The major employment industries in Federal Heights include Construction (1,121 | 16.1%), Retail Trade (1,112 | 16.0%), Accommodation & Food Services (1,001 | 14.4%), Health Care & Social Assistance (539 | 7.7%), and Administrative & Support (452 | 6.5%).
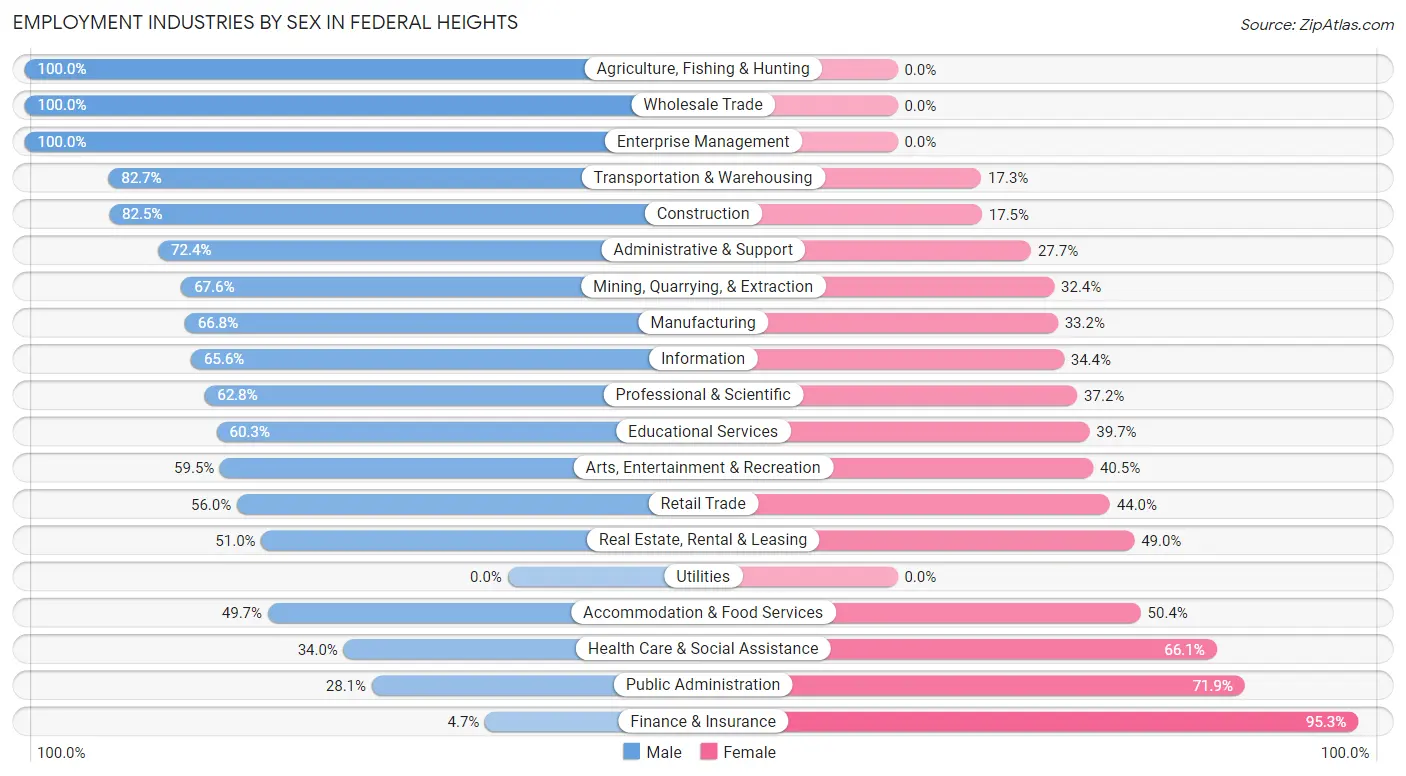
Employment Industries by Sex in Federal Heights
The Federal Heights industries that see more men than women are Agriculture, Fishing & Hunting (100.0%), Wholesale Trade (100.0%), and Enterprise Management (100.0%), whereas the industries that tend to have a higher number of women are Finance & Insurance (95.3%), Public Administration (71.9%), and Health Care & Social Assistance (66.0%).
| Industry | Male | Female |
| Agriculture, Fishing & Hunting | 48 (100.0%) | 0 (0.0%) |
| Mining, Quarrying, & Extraction | 50 (67.6%) | 24 (32.4%) |
| Construction | 925 (82.5%) | 196 (17.5%) |
| Manufacturing | 290 (66.8%) | 144 (33.2%) |
| Wholesale Trade | 99 (100.0%) | 0 (0.0%) |
| Retail Trade | 623 (56.0%) | 489 (44.0%) |
| Transportation & Warehousing | 334 (82.7%) | 70 (17.3%) |
| Utilities | 0 (0.0%) | 0 (0.0%) |
| Information | 59 (65.6%) | 31 (34.4%) |
| Finance & Insurance | 12 (4.7%) | 245 (95.3%) |
| Real Estate, Rental & Leasing | 103 (51.0%) | 99 (49.0%) |
| Professional & Scientific | 130 (62.8%) | 77 (37.2%) |
| Enterprise Management | 23 (100.0%) | 0 (0.0%) |
| Administrative & Support | 327 (72.4%) | 125 (27.7%) |
| Educational Services | 141 (60.3%) | 93 (39.7%) |
| Health Care & Social Assistance | 183 (34.0%) | 356 (66.0%) |
| Arts, Entertainment & Recreation | 25 (59.5%) | 17 (40.5%) |
| Accommodation & Food Services | 497 (49.6%) | 504 (50.3%) |
| Public Administration | 63 (28.1%) | 161 (71.9%) |
| Total | 4,171 (59.9%) | 2,798 (40.2%) |
Education in Federal Heights
School Enrollment in Federal Heights
The most common levels of schooling among the 3,358 students in Federal Heights are elementary school (1,018 | 30.3%), middle school (948 | 28.2%), and high school (739 | 22.0%).
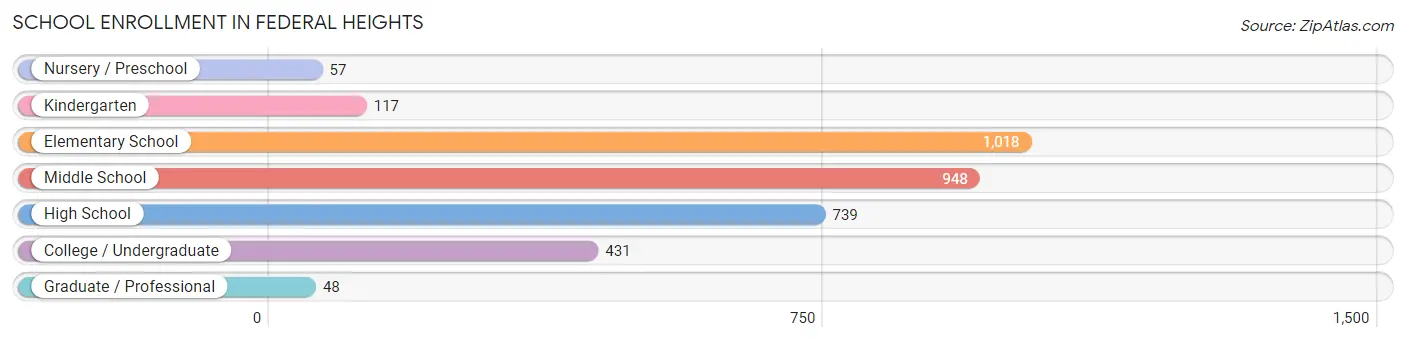
| School Level | # Students | % Students |
| Nursery / Preschool | 57 | 1.7% |
| Kindergarten | 117 | 3.5% |
| Elementary School | 1,018 | 30.3% |
| Middle School | 948 | 28.2% |
| High School | 739 | 22.0% |
| College / Undergraduate | 431 | 12.8% |
| Graduate / Professional | 48 | 1.4% |
| Total | 3,358 | 100.0% |
School Enrollment by Age by Funding Source in Federal Heights
Out of a total of 3,358 students who are enrolled in schools in Federal Heights, 238 (7.1%) attend a private institution, while the remaining 3,120 (92.9%) are enrolled in public schools. The age group of 25 to 34 year olds has the highest likelihood of being enrolled in private schools, with 77 (69.4% in the age bracket) enrolled. Conversely, the age group of 3 to 4 year olds has the lowest likelihood of being enrolled in a private school, with 30 (100.0% in the age bracket) attending a public institution.
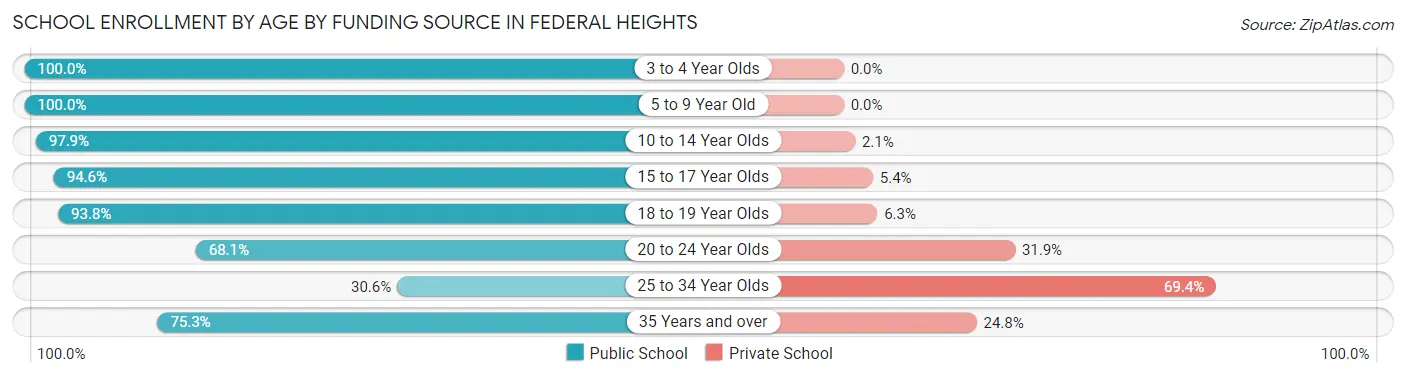
| Age Bracket | Public School | Private School |
| 3 to 4 Year Olds | 30 (100.0%) | 0 (0.0%) |
| 5 to 9 Year Old | 860 (100.0%) | 0 (0.0%) |
| 10 to 14 Year Olds | 1,251 (97.9%) | 27 (2.1%) |
| 15 to 17 Year Olds | 469 (94.6%) | 27 (5.4%) |
| 18 to 19 Year Olds | 255 (93.8%) | 17 (6.2%) |
| 20 to 24 Year Olds | 143 (68.1%) | 67 (31.9%) |
| 25 to 34 Year Olds | 34 (30.6%) | 77 (69.4%) |
| 35 Years and over | 76 (75.2%) | 25 (24.7%) |
| Total | 3,120 (92.9%) | 238 (7.1%) |
Educational Attainment by Field of Study in Federal Heights
Business (259 | 20.2%), social sciences (178 | 13.9%), communications (113 | 8.8%), arts & humanities (104 | 8.1%), and education (94 | 7.3%) are the most common fields of study among 1,280 individuals in Federal Heights who have obtained a bachelor's degree or higher.
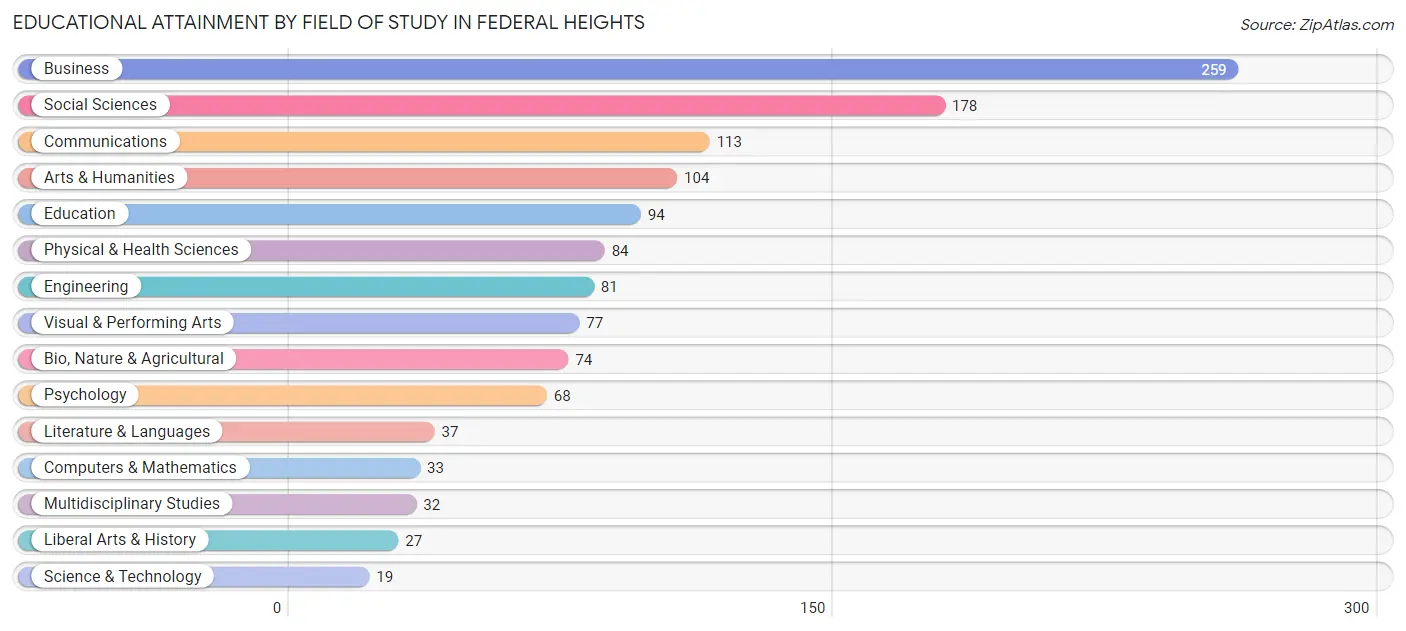
| Field of Study | # Graduates | % Graduates |
| Computers & Mathematics | 33 | 2.6% |
| Bio, Nature & Agricultural | 74 | 5.8% |
| Physical & Health Sciences | 84 | 6.6% |
| Psychology | 68 | 5.3% |
| Social Sciences | 178 | 13.9% |
| Engineering | 81 | 6.3% |
| Multidisciplinary Studies | 32 | 2.5% |
| Science & Technology | 19 | 1.5% |
| Business | 259 | 20.2% |
| Education | 94 | 7.3% |
| Literature & Languages | 37 | 2.9% |
| Liberal Arts & History | 27 | 2.1% |
| Visual & Performing Arts | 77 | 6.0% |
| Communications | 113 | 8.8% |
| Arts & Humanities | 104 | 8.1% |
| Total | 1,280 | 100.0% |
Transportation & Commute in Federal Heights
Vehicle Availability by Sex in Federal Heights
The most prevalent vehicle ownership categories in Federal Heights are males with 2 vehicles (1,707, accounting for 41.0%) and females with 2 vehicles (1,049, making up 62.3%).
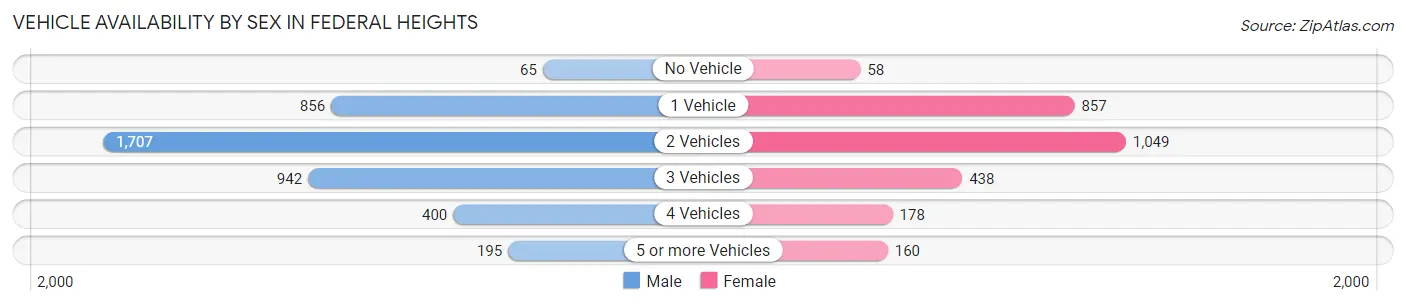
| Vehicles Available | Male | Female |
| No Vehicle | 65 (1.6%) | 58 (2.1%) |
| 1 Vehicle | 856 (20.5%) | 857 (31.3%) |
| 2 Vehicles | 1,707 (41.0%) | 1,049 (38.3%) |
| 3 Vehicles | 942 (22.6%) | 438 (16.0%) |
| 4 Vehicles | 400 (9.6%) | 178 (6.5%) |
| 5 or more Vehicles | 195 (4.7%) | 160 (5.8%) |
| Total | 4,165 (100.0%) | 2,740 (100.0%) |
Commute Time in Federal Heights
The most frequently occuring commute durations in Federal Heights are 30 to 34 minutes (1,242 commuters, 19.1%), 45 to 59 minutes (915 commuters, 14.1%), and 10 to 14 minutes (884 commuters, 13.6%).
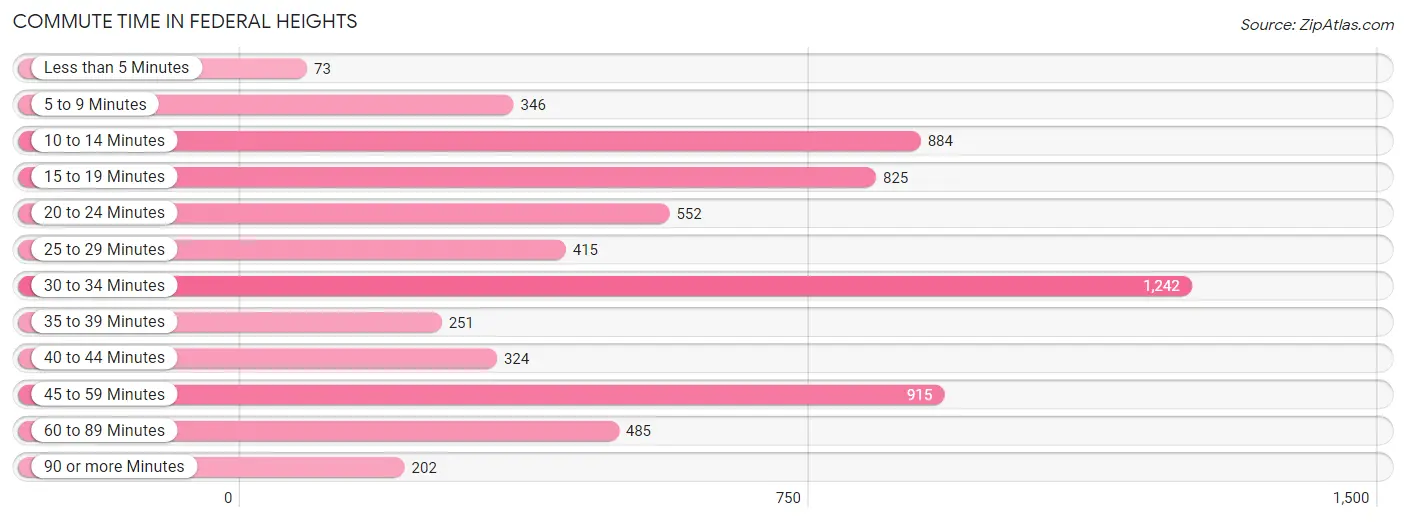
| Commute Time | # Commuters | % Commuters |
| Less than 5 Minutes | 73 | 1.1% |
| 5 to 9 Minutes | 346 | 5.3% |
| 10 to 14 Minutes | 884 | 13.6% |
| 15 to 19 Minutes | 825 | 12.7% |
| 20 to 24 Minutes | 552 | 8.5% |
| 25 to 29 Minutes | 415 | 6.4% |
| 30 to 34 Minutes | 1,242 | 19.1% |
| 35 to 39 Minutes | 251 | 3.8% |
| 40 to 44 Minutes | 324 | 5.0% |
| 45 to 59 Minutes | 915 | 14.1% |
| 60 to 89 Minutes | 485 | 7.4% |
| 90 or more Minutes | 202 | 3.1% |
Commute Time by Sex in Federal Heights
The most common commute times in Federal Heights are 30 to 34 minutes (701 commuters, 17.5%) for males and 30 to 34 minutes (541 commuters, 21.5%) for females.
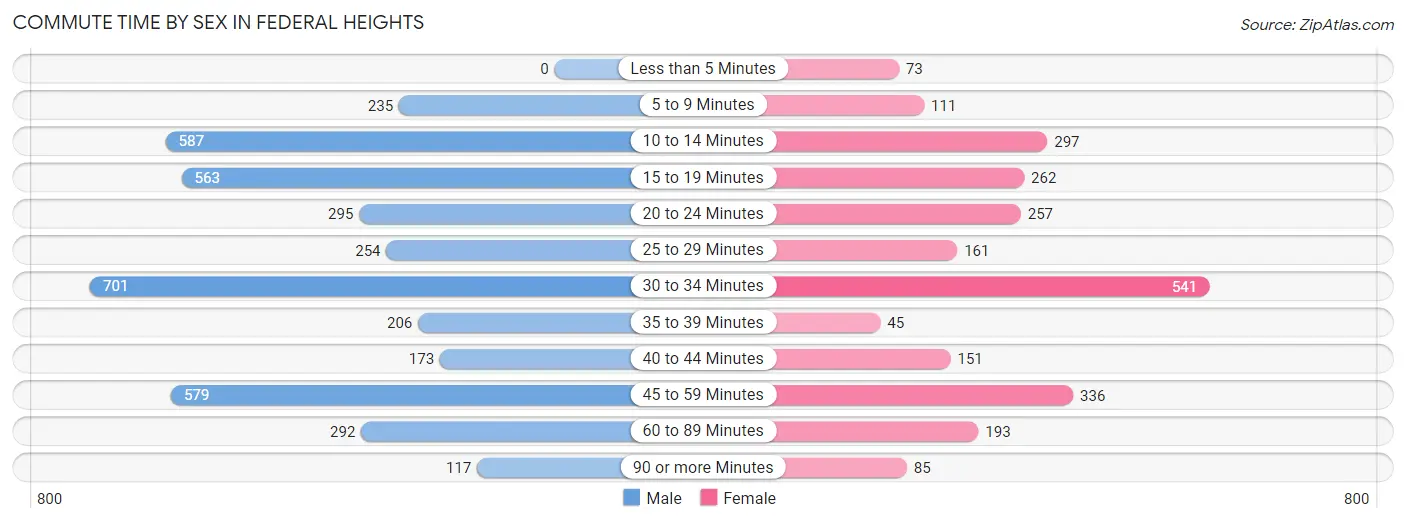
| Commute Time | Male | Female |
| Less than 5 Minutes | 0 (0.0%) | 73 (2.9%) |
| 5 to 9 Minutes | 235 (5.9%) | 111 (4.4%) |
| 10 to 14 Minutes | 587 (14.7%) | 297 (11.8%) |
| 15 to 19 Minutes | 563 (14.1%) | 262 (10.4%) |
| 20 to 24 Minutes | 295 (7.4%) | 257 (10.2%) |
| 25 to 29 Minutes | 254 (6.4%) | 161 (6.4%) |
| 30 to 34 Minutes | 701 (17.5%) | 541 (21.5%) |
| 35 to 39 Minutes | 206 (5.1%) | 45 (1.8%) |
| 40 to 44 Minutes | 173 (4.3%) | 151 (6.0%) |
| 45 to 59 Minutes | 579 (14.5%) | 336 (13.4%) |
| 60 to 89 Minutes | 292 (7.3%) | 193 (7.7%) |
| 90 or more Minutes | 117 (2.9%) | 85 (3.4%) |
Time of Departure to Work by Sex in Federal Heights
The most frequent times of departure to work in Federal Heights are 6:00 AM to 6:29 AM (645, 16.1%) for males and 7:30 AM to 7:59 AM (449, 17.9%) for females.
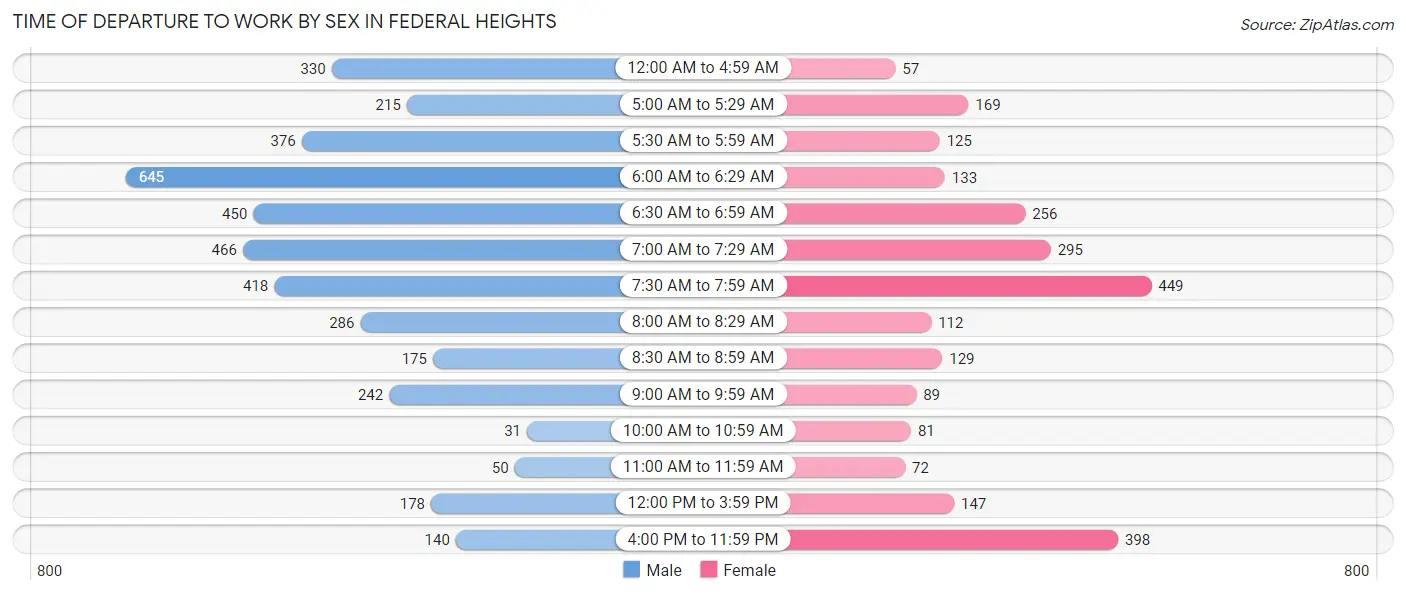
| Time of Departure | Male | Female |
| 12:00 AM to 4:59 AM | 330 (8.3%) | 57 (2.3%) |
| 5:00 AM to 5:29 AM | 215 (5.4%) | 169 (6.7%) |
| 5:30 AM to 5:59 AM | 376 (9.4%) | 125 (5.0%) |
| 6:00 AM to 6:29 AM | 645 (16.1%) | 133 (5.3%) |
| 6:30 AM to 6:59 AM | 450 (11.2%) | 256 (10.2%) |
| 7:00 AM to 7:29 AM | 466 (11.6%) | 295 (11.7%) |
| 7:30 AM to 7:59 AM | 418 (10.4%) | 449 (17.9%) |
| 8:00 AM to 8:29 AM | 286 (7.1%) | 112 (4.5%) |
| 8:30 AM to 8:59 AM | 175 (4.4%) | 129 (5.1%) |
| 9:00 AM to 9:59 AM | 242 (6.0%) | 89 (3.5%) |
| 10:00 AM to 10:59 AM | 31 (0.8%) | 81 (3.2%) |
| 11:00 AM to 11:59 AM | 50 (1.3%) | 72 (2.9%) |
| 12:00 PM to 3:59 PM | 178 (4.4%) | 147 (5.9%) |
| 4:00 PM to 11:59 PM | 140 (3.5%) | 398 (15.8%) |
| Total | 4,002 (100.0%) | 2,512 (100.0%) |
Housing Occupancy in Federal Heights
Occupancy by Ownership in Federal Heights
Of the total 5,092 dwellings in Federal Heights, owner-occupied units account for 2,872 (56.4%), while renter-occupied units make up 2,220 (43.6%).
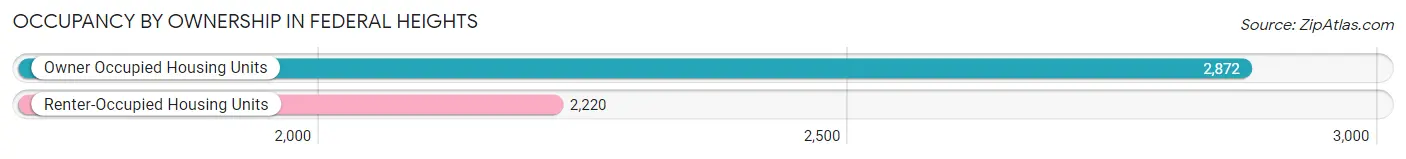
| Occupancy | # Housing Units | % Housing Units |
| Owner Occupied Housing Units | 2,872 | 56.4% |
| Renter-Occupied Housing Units | 2,220 | 43.6% |
| Total Occupied Housing Units | 5,092 | 100.0% |
Occupancy by Household Size in Federal Heights
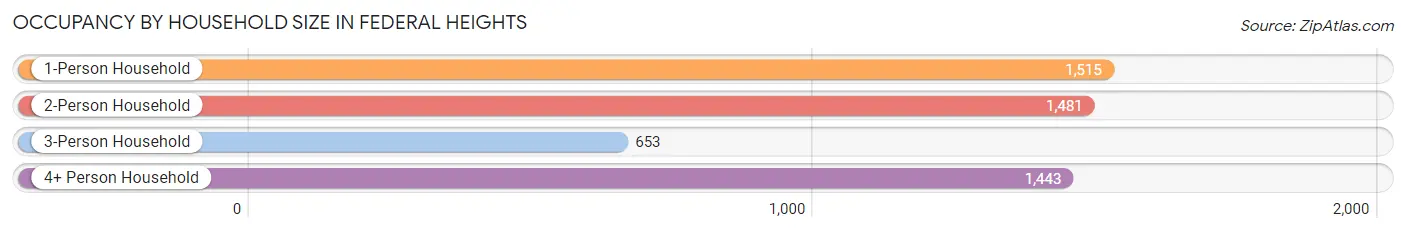
| Household Size | # Housing Units | % Housing Units |
| 1-Person Household | 1,515 | 29.7% |
| 2-Person Household | 1,481 | 29.1% |
| 3-Person Household | 653 | 12.8% |
| 4+ Person Household | 1,443 | 28.3% |
| Total Housing Units | 5,092 | 100.0% |
Occupancy by Ownership by Household Size in Federal Heights
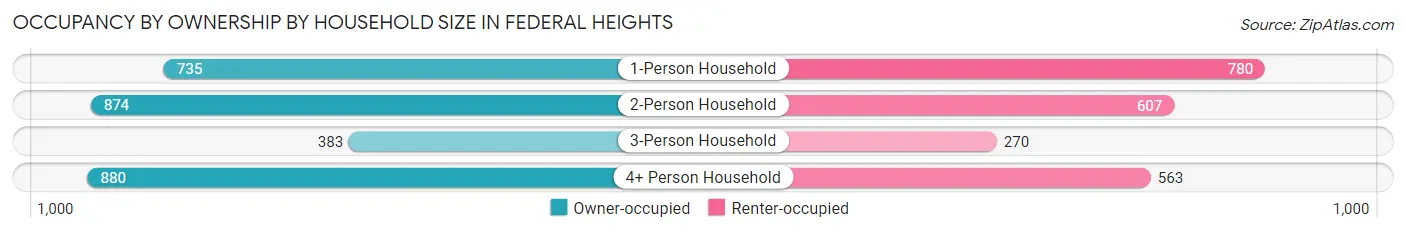
| Household Size | Owner-occupied | Renter-occupied |
| 1-Person Household | 735 (48.5%) | 780 (51.5%) |
| 2-Person Household | 874 (59.0%) | 607 (41.0%) |
| 3-Person Household | 383 (58.7%) | 270 (41.3%) |
| 4+ Person Household | 880 (61.0%) | 563 (39.0%) |
| Total Housing Units | 2,872 (56.4%) | 2,220 (43.6%) |
Occupancy by Educational Attainment in Federal Heights
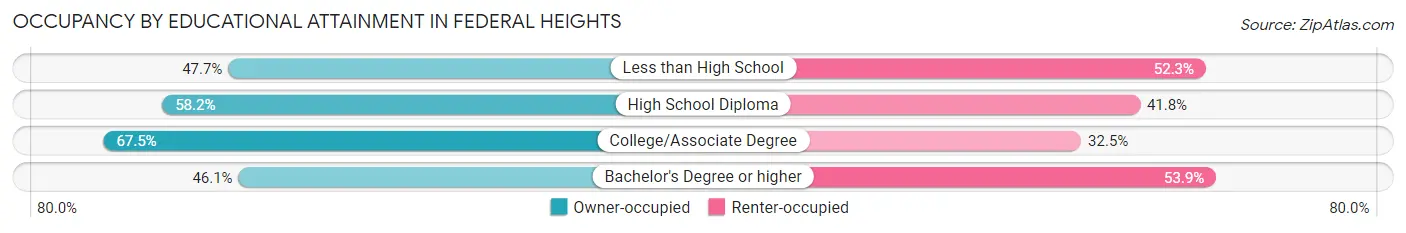
| Household Size | Owner-occupied | Renter-occupied |
| Less than High School | 521 (47.7%) | 571 (52.3%) |
| High School Diploma | 948 (58.2%) | 682 (41.8%) |
| College/Associate Degree | 980 (67.5%) | 472 (32.5%) |
| Bachelor's Degree or higher | 423 (46.1%) | 495 (53.9%) |
Occupancy by Age of Householder in Federal Heights
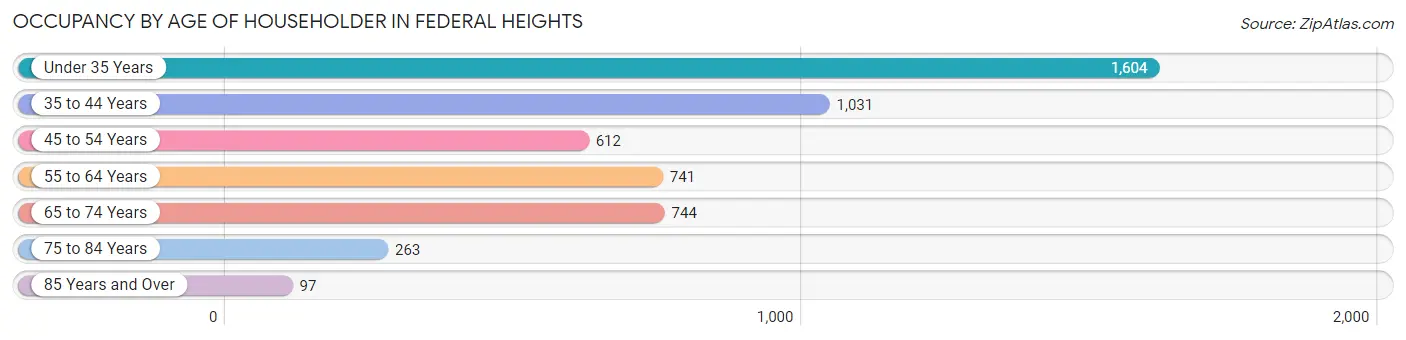
| Age Bracket | # Households | % Households |
| Under 35 Years | 1,604 | 31.5% |
| 35 to 44 Years | 1,031 | 20.3% |
| 45 to 54 Years | 612 | 12.0% |
| 55 to 64 Years | 741 | 14.5% |
| 65 to 74 Years | 744 | 14.6% |
| 75 to 84 Years | 263 | 5.2% |
| 85 Years and Over | 97 | 1.9% |
| Total | 5,092 | 100.0% |
Housing Finances in Federal Heights
Median Income by Occupancy in Federal Heights
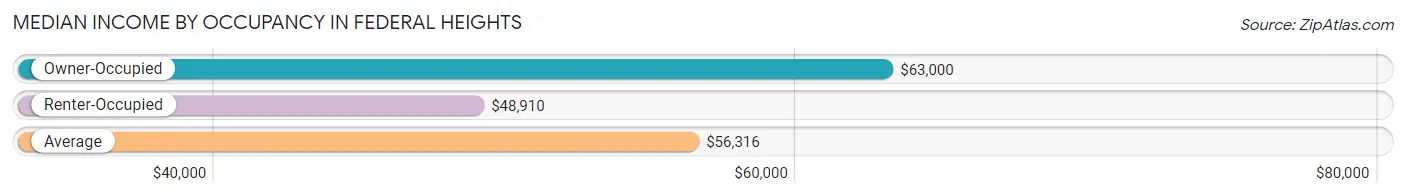
| Occupancy Type | # Households | Median Income |
| Owner-Occupied | 2,872 (56.4%) | $63,000 |
| Renter-Occupied | 2,220 (43.6%) | $48,910 |
| Average | 5,092 (100.0%) | $56,316 |
Occupancy by Householder Income Bracket in Federal Heights
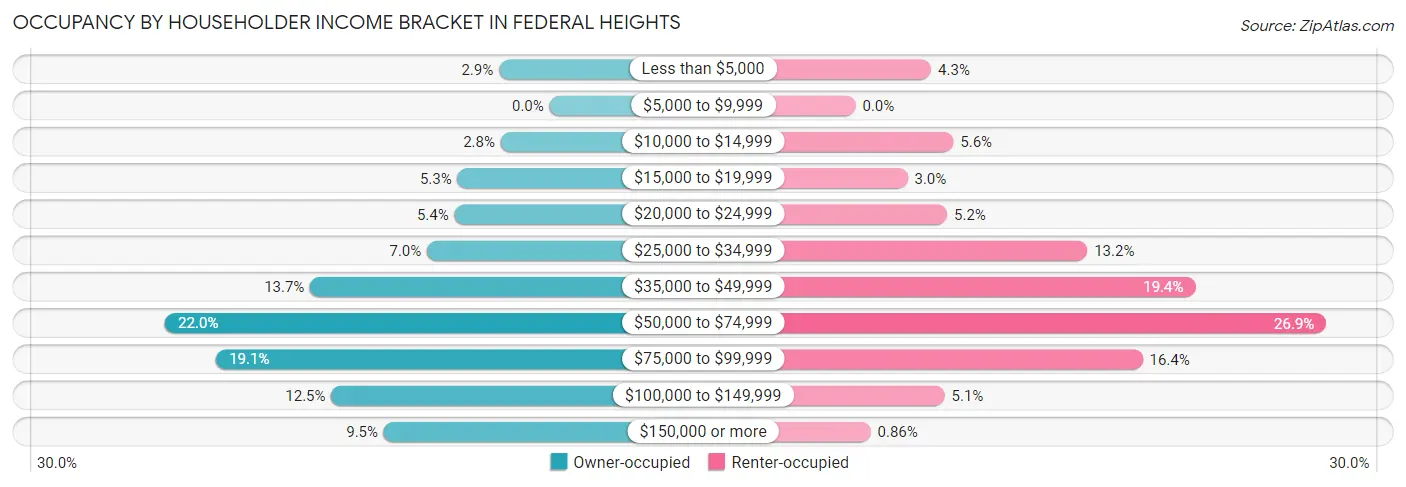
| Income Bracket | Owner-occupied | Renter-occupied |
| Less than $5,000 | 83 (2.9%) | 96 (4.3%) |
| $5,000 to $9,999 | 0 (0.0%) | 0 (0.0%) |
| $10,000 to $14,999 | 80 (2.8%) | 124 (5.6%) |
| $15,000 to $19,999 | 151 (5.3%) | 66 (3.0%) |
| $20,000 to $24,999 | 156 (5.4%) | 116 (5.2%) |
| $25,000 to $34,999 | 201 (7.0%) | 294 (13.2%) |
| $35,000 to $49,999 | 393 (13.7%) | 431 (19.4%) |
| $50,000 to $74,999 | 631 (22.0%) | 597 (26.9%) |
| $75,000 to $99,999 | 547 (19.1%) | 364 (16.4%) |
| $100,000 to $149,999 | 358 (12.5%) | 113 (5.1%) |
| $150,000 or more | 272 (9.5%) | 19 (0.9%) |
| Total | 2,872 (100.0%) | 2,220 (100.0%) |
Monthly Housing Cost Tiers in Federal Heights
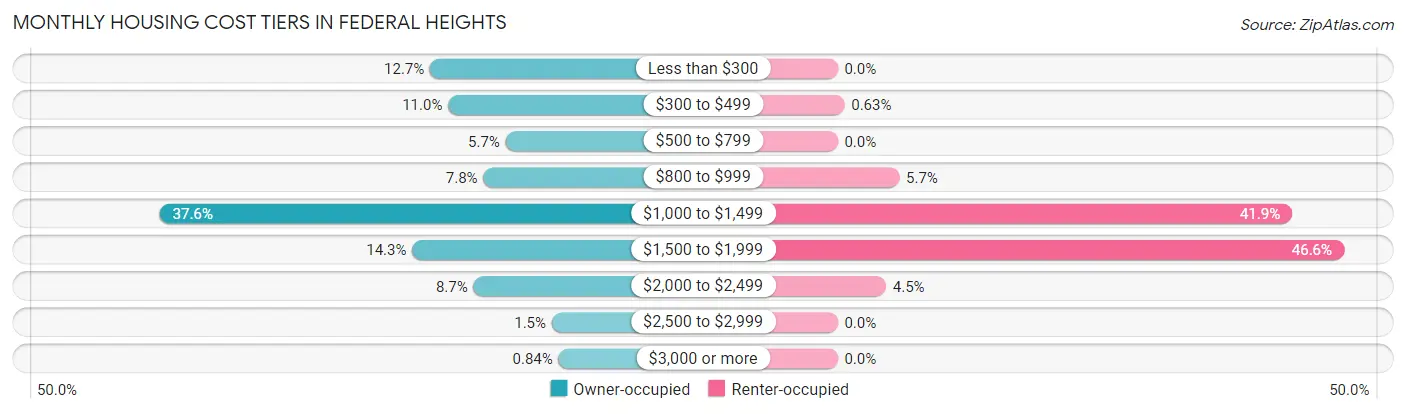
| Monthly Cost | Owner-occupied | Renter-occupied |
| Less than $300 | 364 (12.7%) | 0 (0.0%) |
| $300 to $499 | 316 (11.0%) | 14 (0.6%) |
| $500 to $799 | 164 (5.7%) | 0 (0.0%) |
| $800 to $999 | 223 (7.8%) | 126 (5.7%) |
| $1,000 to $1,499 | 1,079 (37.6%) | 929 (41.8%) |
| $1,500 to $1,999 | 411 (14.3%) | 1,035 (46.6%) |
| $2,000 to $2,499 | 249 (8.7%) | 99 (4.5%) |
| $2,500 to $2,999 | 42 (1.5%) | 0 (0.0%) |
| $3,000 or more | 24 (0.8%) | 0 (0.0%) |
| Total | 2,872 (100.0%) | 2,220 (100.0%) |
Physical Housing Characteristics in Federal Heights
Housing Structures in Federal Heights
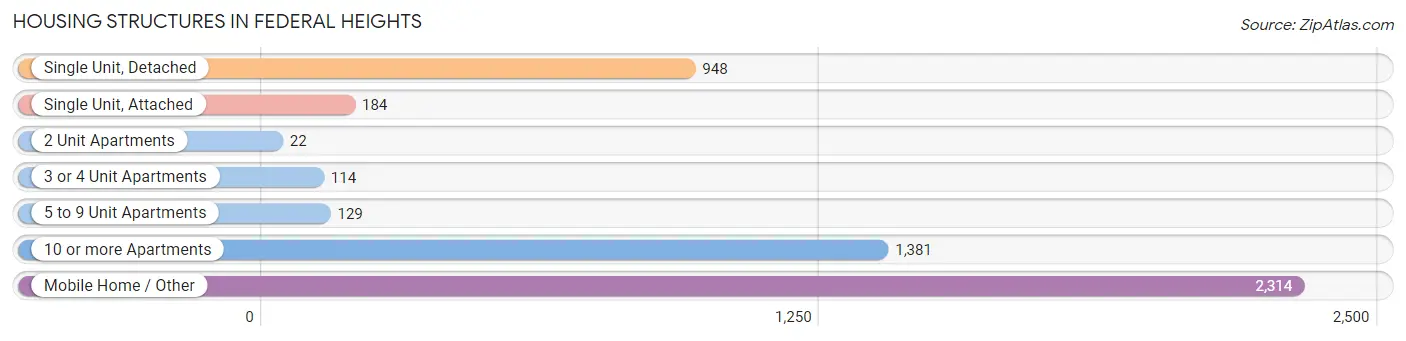
| Structure Type | # Housing Units | % Housing Units |
| Single Unit, Detached | 948 | 18.6% |
| Single Unit, Attached | 184 | 3.6% |
| 2 Unit Apartments | 22 | 0.4% |
| 3 or 4 Unit Apartments | 114 | 2.2% |
| 5 to 9 Unit Apartments | 129 | 2.5% |
| 10 or more Apartments | 1,381 | 27.1% |
| Mobile Home / Other | 2,314 | 45.4% |
| Total | 5,092 | 100.0% |
Housing Structures by Occupancy in Federal Heights
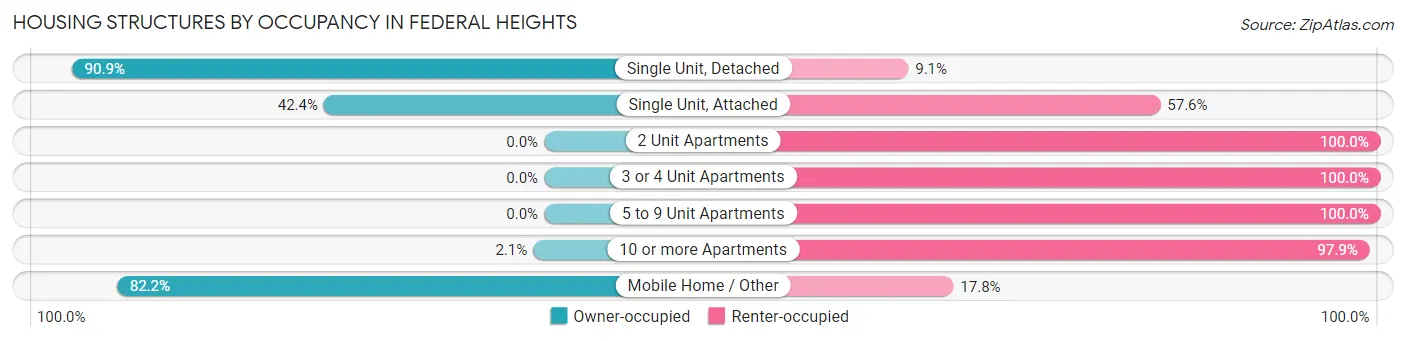
| Structure Type | Owner-occupied | Renter-occupied |
| Single Unit, Detached | 862 (90.9%) | 86 (9.1%) |
| Single Unit, Attached | 78 (42.4%) | 106 (57.6%) |
| 2 Unit Apartments | 0 (0.0%) | 22 (100.0%) |
| 3 or 4 Unit Apartments | 0 (0.0%) | 114 (100.0%) |
| 5 to 9 Unit Apartments | 0 (0.0%) | 129 (100.0%) |
| 10 or more Apartments | 29 (2.1%) | 1,352 (97.9%) |
| Mobile Home / Other | 1,903 (82.2%) | 411 (17.8%) |
| Total | 2,872 (56.4%) | 2,220 (43.6%) |
Housing Structures by Number of Rooms in Federal Heights
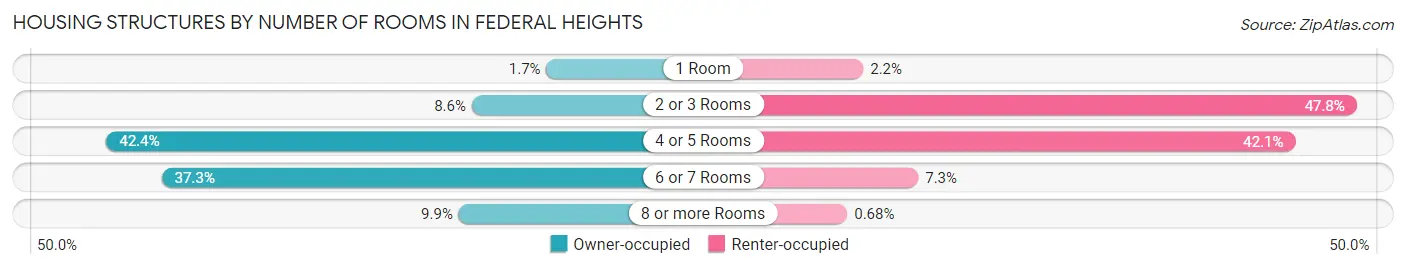
| Number of Rooms | Owner-occupied | Renter-occupied |
| 1 Room | 50 (1.7%) | 48 (2.2%) |
| 2 or 3 Rooms | 248 (8.6%) | 1,061 (47.8%) |
| 4 or 5 Rooms | 1,219 (42.4%) | 935 (42.1%) |
| 6 or 7 Rooms | 1,072 (37.3%) | 161 (7.2%) |
| 8 or more Rooms | 283 (9.9%) | 15 (0.7%) |
| Total | 2,872 (100.0%) | 2,220 (100.0%) |
Housing Structure by Heating Type in Federal Heights
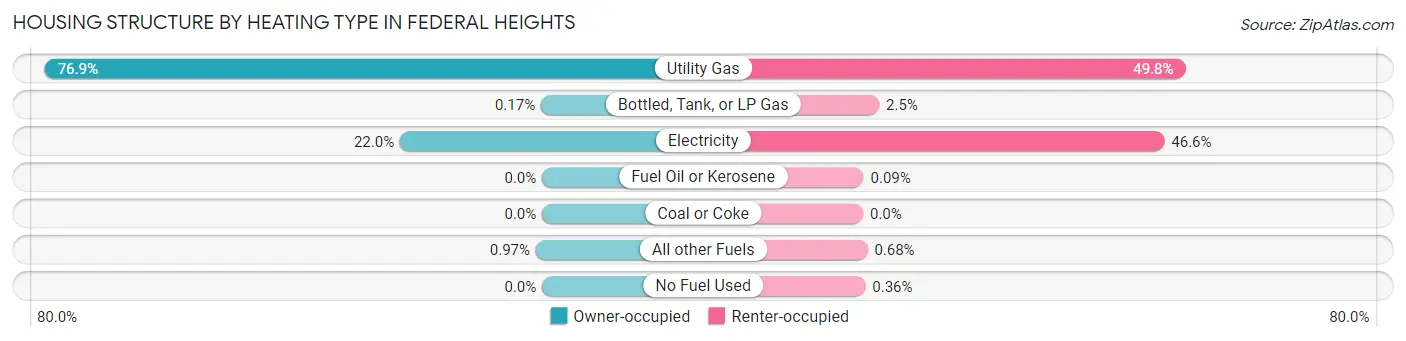
| Heating Type | Owner-occupied | Renter-occupied |
| Utility Gas | 2,208 (76.9%) | 1,106 (49.8%) |
| Bottled, Tank, or LP Gas | 5 (0.2%) | 55 (2.5%) |
| Electricity | 631 (22.0%) | 1,034 (46.6%) |
| Fuel Oil or Kerosene | 0 (0.0%) | 2 (0.1%) |
| Coal or Coke | 0 (0.0%) | 0 (0.0%) |
| All other Fuels | 28 (1.0%) | 15 (0.7%) |
| No Fuel Used | 0 (0.0%) | 8 (0.4%) |
| Total | 2,872 (100.0%) | 2,220 (100.0%) |
Household Vehicle Usage in Federal Heights
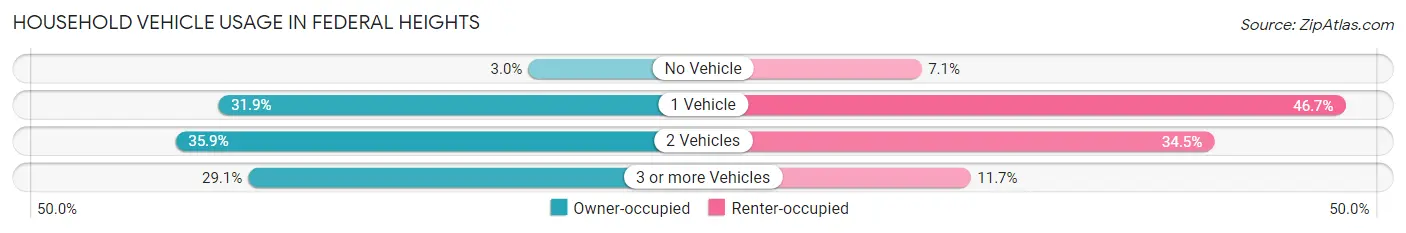
| Vehicles per Household | Owner-occupied | Renter-occupied |
| No Vehicle | 86 (3.0%) | 158 (7.1%) |
| 1 Vehicle | 917 (31.9%) | 1,037 (46.7%) |
| 2 Vehicles | 1,032 (35.9%) | 765 (34.5%) |
| 3 or more Vehicles | 837 (29.1%) | 260 (11.7%) |
| Total | 2,872 (100.0%) | 2,220 (100.0%) |
Real Estate & Mortgages in Federal Heights
Real Estate and Mortgage Overview in Federal Heights
| Characteristic | Without Mortgage | With Mortgage |
| Housing Units | 1,795 | 1,077 |
| Median Property Value | $70,700 | $312,800 |
| Median Household Income | $52,620 | $236 |
| Monthly Housing Costs | $966 | $24 |
| Real Estate Taxes | $314 | $36 |
Property Value by Mortgage Status in Federal Heights
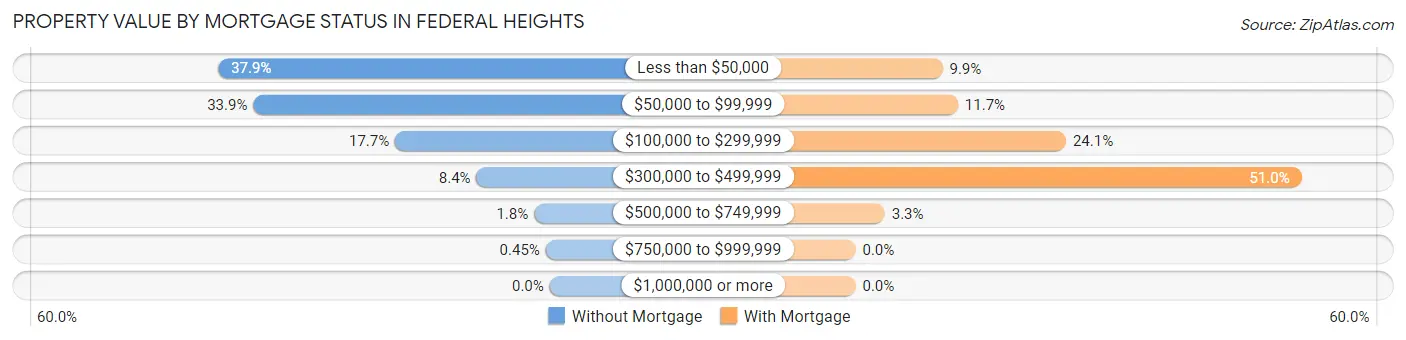
| Property Value | Without Mortgage | With Mortgage |
| Less than $50,000 | 680 (37.9%) | 107 (9.9%) |
| $50,000 to $99,999 | 608 (33.9%) | 126 (11.7%) |
| $100,000 to $299,999 | 317 (17.7%) | 259 (24.0%) |
| $300,000 to $499,999 | 150 (8.4%) | 549 (51.0%) |
| $500,000 to $749,999 | 32 (1.8%) | 36 (3.3%) |
| $750,000 to $999,999 | 8 (0.4%) | 0 (0.0%) |
| $1,000,000 or more | 0 (0.0%) | 0 (0.0%) |
| Total | 1,795 (100.0%) | 1,077 (100.0%) |
Household Income by Mortgage Status in Federal Heights
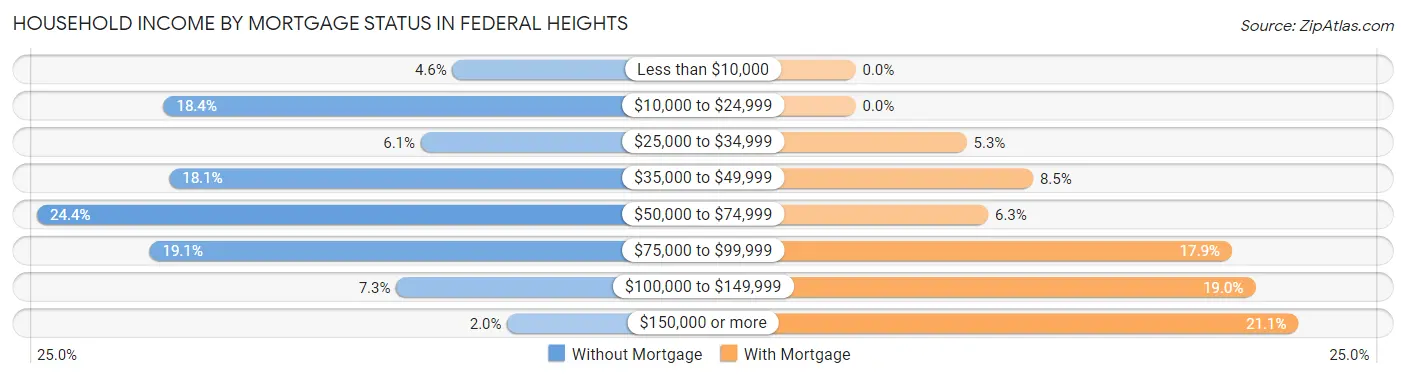
| Household Income | Without Mortgage | With Mortgage |
| Less than $10,000 | 83 (4.6%) | 0 (0.0%) |
| $10,000 to $24,999 | 330 (18.4%) | 0 (0.0%) |
| $25,000 to $34,999 | 110 (6.1%) | 57 (5.3%) |
| $35,000 to $49,999 | 325 (18.1%) | 91 (8.5%) |
| $50,000 to $74,999 | 438 (24.4%) | 68 (6.3%) |
| $75,000 to $99,999 | 342 (19.1%) | 193 (17.9%) |
| $100,000 to $149,999 | 131 (7.3%) | 205 (19.0%) |
| $150,000 or more | 36 (2.0%) | 227 (21.1%) |
| Total | 1,795 (100.0%) | 1,077 (100.0%) |
Property Value to Household Income Ratio in Federal Heights
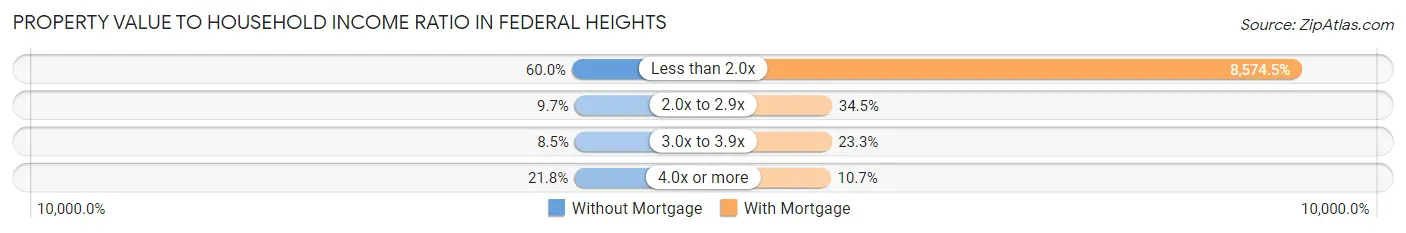
| Value-to-Income Ratio | Without Mortgage | With Mortgage |
| Less than 2.0x | 1,077 (60.0%) | 92,347 (8,574.5%) |
| 2.0x to 2.9x | 174 (9.7%) | 372 (34.5%) |
| 3.0x to 3.9x | 152 (8.5%) | 251 (23.3%) |
| 4.0x or more | 392 (21.8%) | 115 (10.7%) |
| Total | 1,795 (100.0%) | 1,077 (100.0%) |
Real Estate Taxes by Mortgage Status in Federal Heights
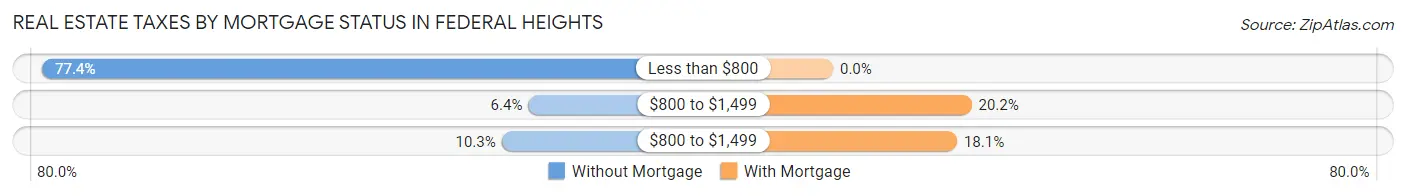
| Property Taxes | Without Mortgage | With Mortgage |
| Less than $800 | 1,390 (77.4%) | 0 (0.0%) |
| $800 to $1,499 | 115 (6.4%) | 218 (20.2%) |
| $800 to $1,499 | 185 (10.3%) | 195 (18.1%) |
| Total | 1,795 (100.0%) | 1,077 (100.0%) |
Health & Disability in Federal Heights
Health Insurance Coverage by Age in Federal Heights
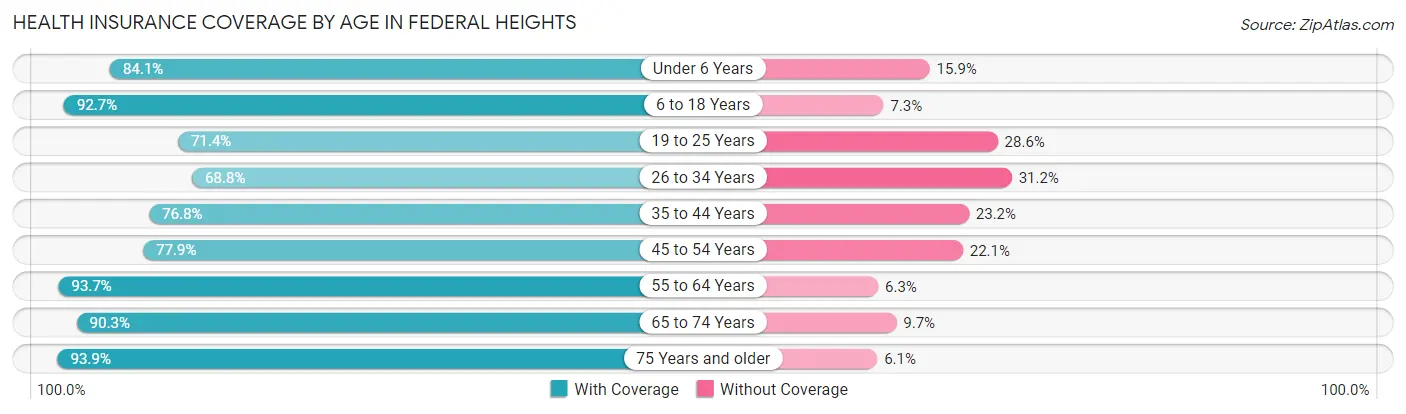
| Age Bracket | With Coverage | Without Coverage |
| Under 6 Years | 1,246 (84.1%) | 236 (15.9%) |
| 6 to 18 Years | 2,664 (92.7%) | 210 (7.3%) |
| 19 to 25 Years | 1,051 (71.4%) | 421 (28.6%) |
| 26 to 34 Years | 1,522 (68.8%) | 691 (31.2%) |
| 35 to 44 Years | 1,434 (76.8%) | 434 (23.2%) |
| 45 to 54 Years | 924 (77.9%) | 262 (22.1%) |
| 55 to 64 Years | 1,337 (93.7%) | 90 (6.3%) |
| 65 to 74 Years | 1,079 (90.3%) | 116 (9.7%) |
| 75 Years and older | 428 (93.9%) | 28 (6.1%) |
| Total | 11,685 (82.5%) | 2,488 (17.5%) |
Health Insurance Coverage by Citizenship Status in Federal Heights
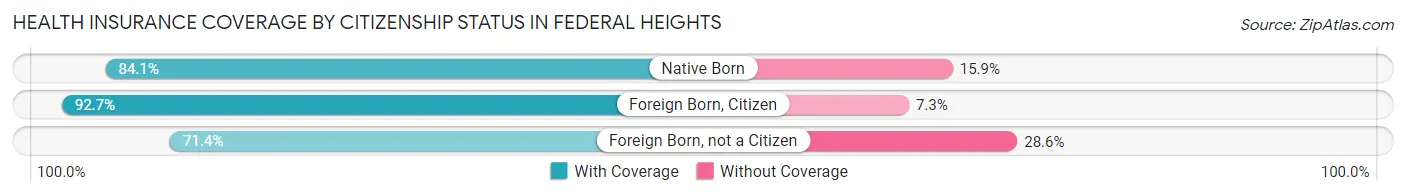
| Citizenship Status | With Coverage | Without Coverage |
| Native Born | 1,246 (84.1%) | 236 (15.9%) |
| Foreign Born, Citizen | 2,664 (92.7%) | 210 (7.3%) |
| Foreign Born, not a Citizen | 1,051 (71.4%) | 421 (28.6%) |
Health Insurance Coverage by Household Income in Federal Heights
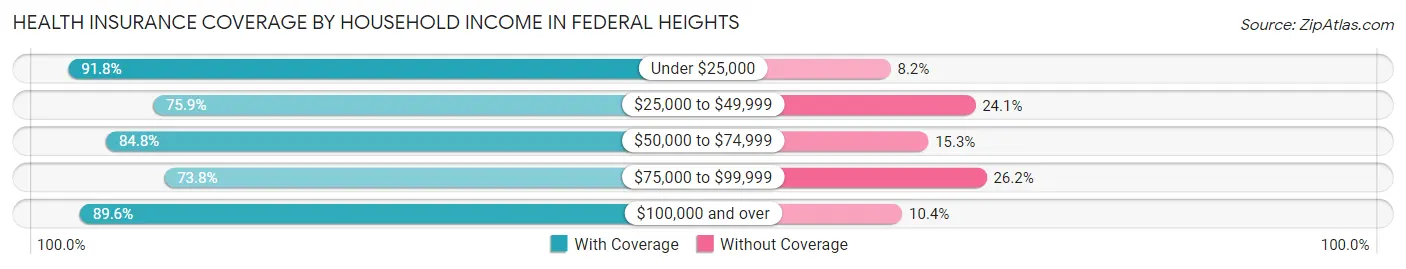
| Household Income | With Coverage | Without Coverage |
| Under $25,000 | 1,951 (91.8%) | 174 (8.2%) |
| $25,000 to $49,999 | 2,244 (75.9%) | 711 (24.1%) |
| $50,000 to $74,999 | 2,712 (84.8%) | 488 (15.2%) |
| $75,000 to $99,999 | 2,356 (73.8%) | 835 (26.2%) |
| $100,000 and over | 2,422 (89.6%) | 280 (10.4%) |
Public vs Private Health Insurance Coverage by Age in Federal Heights
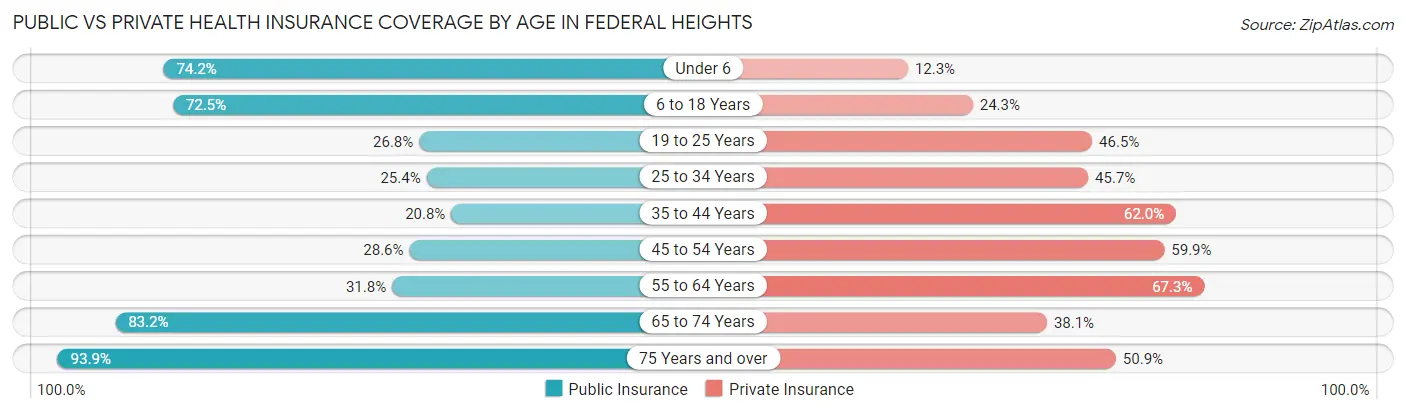
| Age Bracket | Public Insurance | Private Insurance |
| Under 6 | 1,100 (74.2%) | 182 (12.3%) |
| 6 to 18 Years | 2,083 (72.5%) | 699 (24.3%) |
| 19 to 25 Years | 394 (26.8%) | 684 (46.5%) |
| 25 to 34 Years | 562 (25.4%) | 1,012 (45.7%) |
| 35 to 44 Years | 389 (20.8%) | 1,159 (62.0%) |
| 45 to 54 Years | 339 (28.6%) | 710 (59.9%) |
| 55 to 64 Years | 454 (31.8%) | 960 (67.3%) |
| 65 to 74 Years | 994 (83.2%) | 455 (38.1%) |
| 75 Years and over | 428 (93.9%) | 232 (50.9%) |
| Total | 6,743 (47.6%) | 6,093 (43.0%) |
Disability Status by Sex by Age in Federal Heights
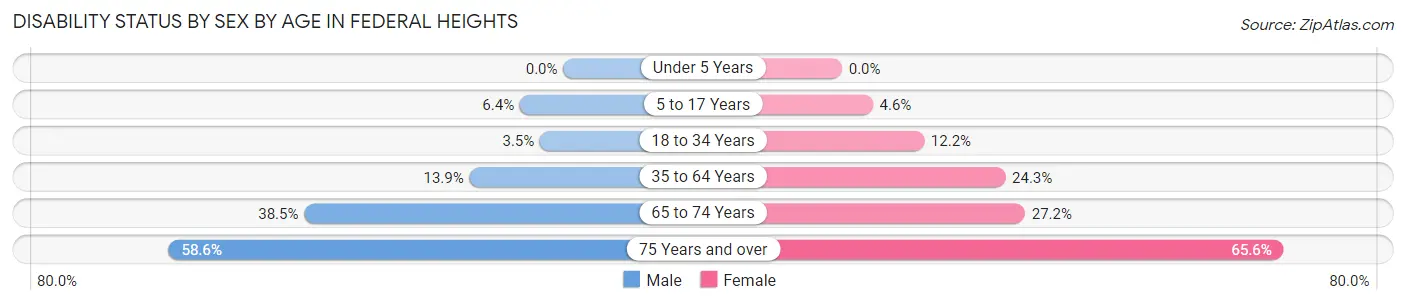
| Age Bracket | Male | Female |
| Under 5 Years | 0 (0.0%) | 0 (0.0%) |
| 5 to 17 Years | 99 (6.4%) | 56 (4.6%) |
| 18 to 34 Years | 78 (3.5%) | 204 (12.2%) |
| 35 to 64 Years | 322 (13.9%) | 526 (24.2%) |
| 65 to 74 Years | 222 (38.5%) | 168 (27.2%) |
| 75 Years and over | 102 (58.6%) | 185 (65.6%) |
Disability Class by Sex by Age in Federal Heights
Disability Class: Hearing Difficulty
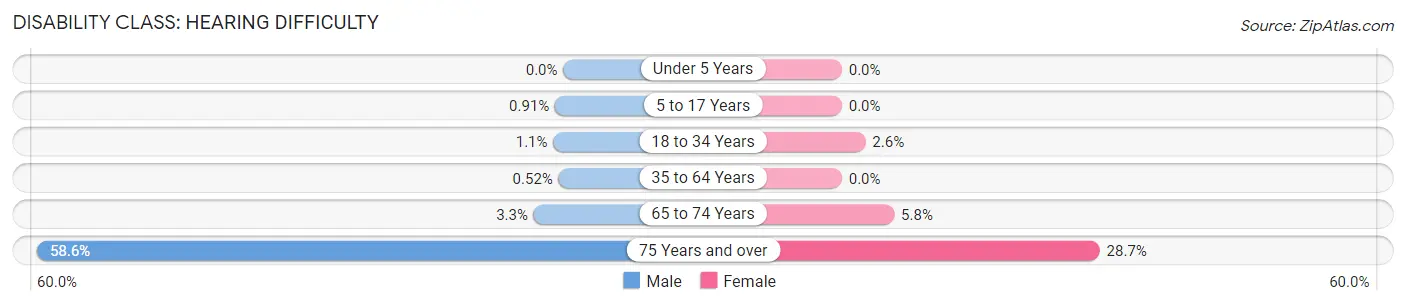
| Age Bracket | Male | Female |
| Under 5 Years | 0 (0.0%) | 0 (0.0%) |
| 5 to 17 Years | 14 (0.9%) | 0 (0.0%) |
| 18 to 34 Years | 25 (1.1%) | 44 (2.6%) |
| 35 to 64 Years | 12 (0.5%) | 0 (0.0%) |
| 65 to 74 Years | 19 (3.3%) | 36 (5.8%) |
| 75 Years and over | 102 (58.6%) | 81 (28.7%) |
Disability Class: Vision Difficulty
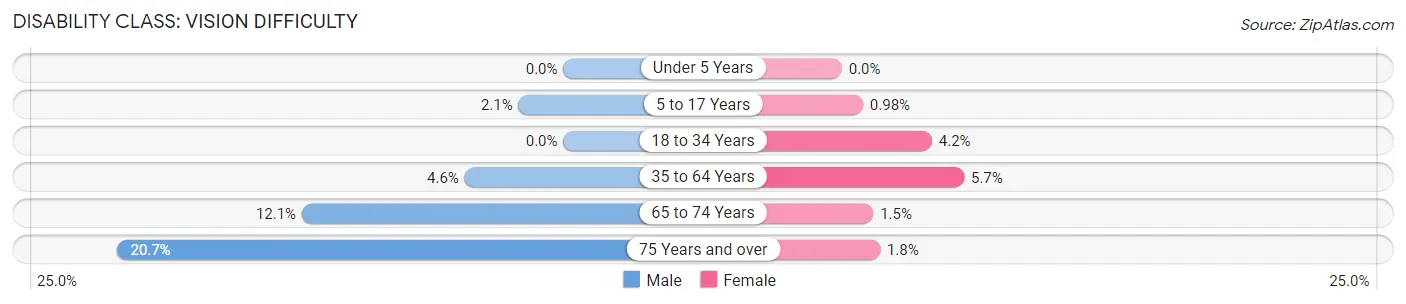
| Age Bracket | Male | Female |
| Under 5 Years | 0 (0.0%) | 0 (0.0%) |
| 5 to 17 Years | 32 (2.1%) | 12 (1.0%) |
| 18 to 34 Years | 0 (0.0%) | 70 (4.2%) |
| 35 to 64 Years | 106 (4.6%) | 123 (5.7%) |
| 65 to 74 Years | 70 (12.1%) | 9 (1.5%) |
| 75 Years and over | 36 (20.7%) | 5 (1.8%) |
Disability Class: Cognitive Difficulty
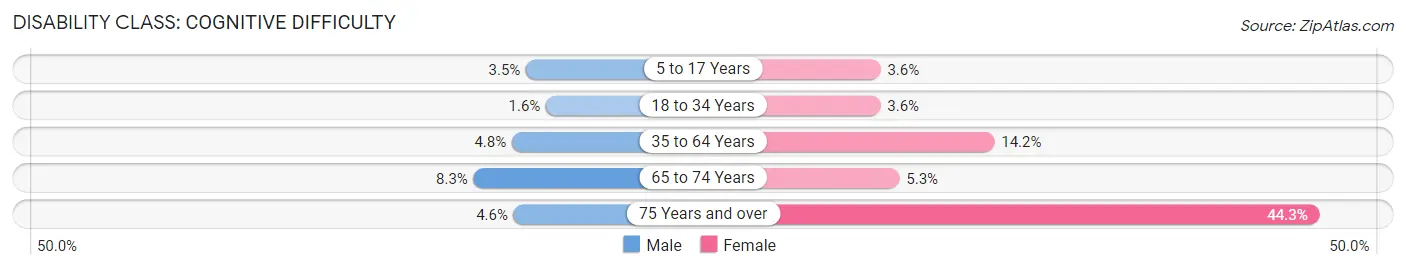
| Age Bracket | Male | Female |
| 5 to 17 Years | 53 (3.5%) | 44 (3.6%) |
| 18 to 34 Years | 36 (1.6%) | 60 (3.6%) |
| 35 to 64 Years | 110 (4.8%) | 307 (14.1%) |
| 65 to 74 Years | 48 (8.3%) | 33 (5.3%) |
| 75 Years and over | 8 (4.6%) | 125 (44.3%) |
Disability Class: Ambulatory Difficulty
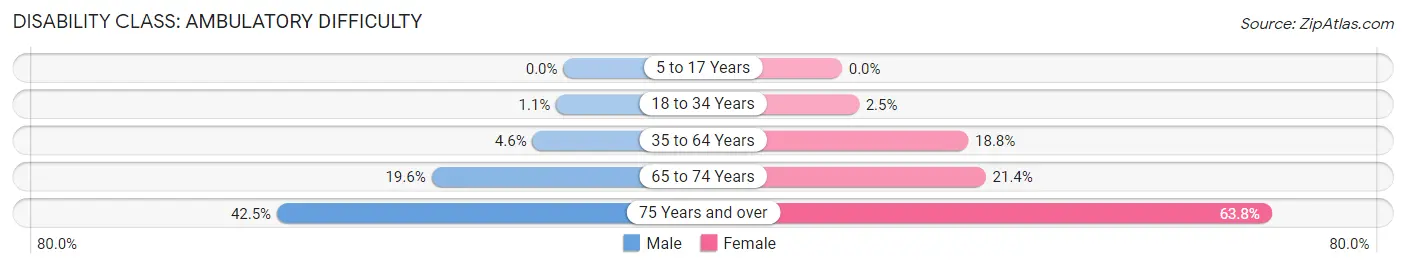
| Age Bracket | Male | Female |
| 5 to 17 Years | 0 (0.0%) | 0 (0.0%) |
| 18 to 34 Years | 24 (1.1%) | 42 (2.5%) |
| 35 to 64 Years | 106 (4.6%) | 407 (18.8%) |
| 65 to 74 Years | 113 (19.6%) | 132 (21.4%) |
| 75 Years and over | 74 (42.5%) | 180 (63.8%) |
Disability Class: Self-Care Difficulty
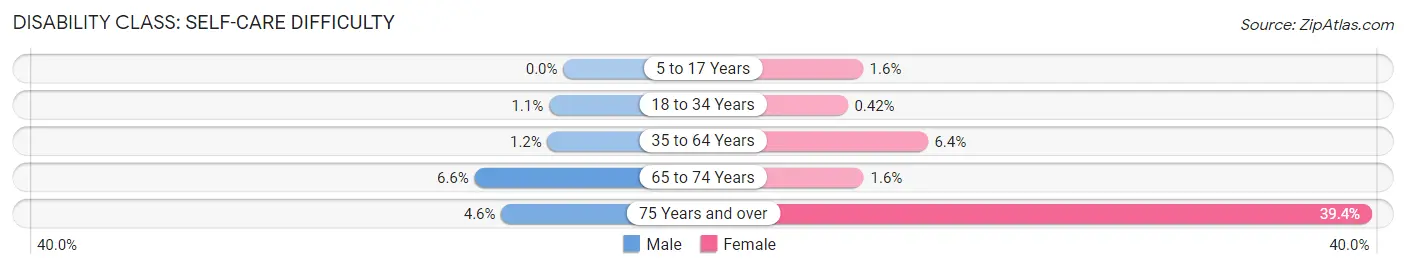
| Age Bracket | Male | Female |
| 5 to 17 Years | 0 (0.0%) | 19 (1.5%) |
| 18 to 34 Years | 24 (1.1%) | 7 (0.4%) |
| 35 to 64 Years | 27 (1.2%) | 138 (6.4%) |
| 65 to 74 Years | 38 (6.6%) | 10 (1.6%) |
| 75 Years and over | 8 (4.6%) | 111 (39.4%) |
Technology Access in Federal Heights
Computing Device Access in Federal Heights
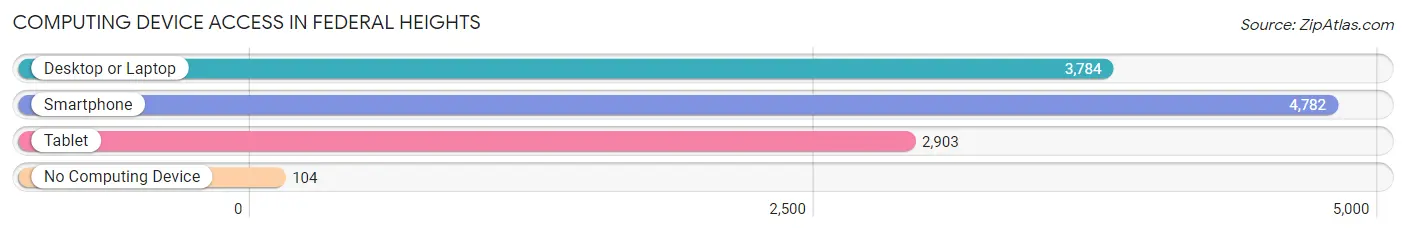
| Device Type | # Households | % Households |
| Desktop or Laptop | 3,784 | 74.3% |
| Smartphone | 4,782 | 93.9% |
| Tablet | 2,903 | 57.0% |
| No Computing Device | 104 | 2.0% |
| Total | 5,092 | 100.0% |
Internet Access in Federal Heights
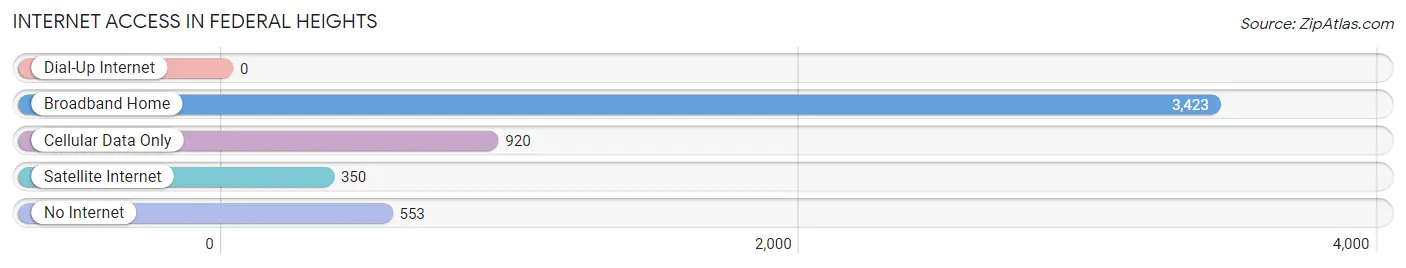
| Internet Type | # Households | % Households |
| Dial-Up Internet | 0 | 0.0% |
| Broadband Home | 3,423 | 67.2% |
| Cellular Data Only | 920 | 18.1% |
| Satellite Internet | 350 | 6.9% |
| No Internet | 553 | 10.9% |
| Total | 5,092 | 100.0% |
Federal Heights Summary
History
Federal Heights is a city located in Adams County, Colorado, United States. It is a suburb of Denver and is located just north of the city. The city was incorporated in 1951 and has a population of approximately 11,000 people.
The area that is now Federal Heights was originally inhabited by the Arapaho and Cheyenne Native American tribes. The first settlers in the area were miners who arrived in the late 1800s. The area was originally known as “Federal” and was named after the Federal Land Company, which owned much of the land in the area.
In the early 1900s, the area began to develop as a residential community. The first homes were built in the area in the 1920s and 1930s. The city was officially incorporated in 1951 and was named Federal Heights.
Geography
Federal Heights is located in Adams County, Colorado, just north of Denver. The city is situated at an elevation of 5,400 feet above sea level. The city covers an area of 4.2 square miles and is bordered by the cities of Westminster, Northglenn, Thornton, and Denver.
The city is located in the South Platte River Valley and is surrounded by rolling hills and open plains. The city has a semi-arid climate with hot summers and cold winters. The average annual temperature is around 50 degrees Fahrenheit.
Economy
The economy of Federal Heights is largely based on the service industry. The city is home to a variety of retail stores, restaurants, and other businesses. The city is also home to several industrial parks, which provide employment opportunities for many of the city’s residents.
The city is also home to several large employers, including the University of Colorado Health Sciences Center, the University of Colorado Hospital, and the Denver Federal Center.
Demographics
As of the 2010 census, the population of Federal Heights was 11,067. The racial makeup of the city was 79.3% White, 8.2% African American, 0.7% Native American, 2.2% Asian, 0.1% Pacific Islander, 6.2% from other races, and 3.3% from two or more races. Hispanic or Latino of any race were 16.2% of the population.
The median income for a household in the city was $45,945, and the median income for a family was $51,945. The per capita income for the city was $20,945. About 8.2% of families and 10.2% of the population were below the poverty line, including 14.2% of those under age 18 and 6.2% of those age 65 or over.
Conclusion
Federal Heights is a city located in Adams County, Colorado, just north of Denver. The city was incorporated in 1951 and has a population of approximately 11,000 people. The economy of Federal Heights is largely based on the service industry, and the city is home to several large employers. The racial makeup of the city is 79.3% White, 8.2% African American, 0.7% Native American, 2.2% Asian, 0.1% Pacific Islander, 6.2% from other races, and 3.3% from two or more races. The median income for a household in the city was $45,945, and the median income for a family was $51,945.
Common Questions
What is Per Capita Income in Federal Heights?
Per Capita income in Federal Heights is $24,263.
What is the Median Family Income in Federal Heights?
Median Family Income in Federal Heights is $65,283.
What is the Median Household income in Federal Heights?
Median Household Income in Federal Heights is $56,316.
What is Income or Wage Gap in Federal Heights?
Income or Wage Gap in Federal Heights is 25.2%.
Women in Federal Heights earn 74.8 cents for every dollar earned by a man.
What is Family Income Deficit in Federal Heights?
Family Income Deficit in Federal Heights is $14,318.
Families that are below poverty line in Federal Heights earn $14,318 less on average than the poverty threshold level.
What is Inequality or Gini Index in Federal Heights?
Inequality or Gini Index in Federal Heights is 0.38.
What is the Total Population of Federal Heights?
Total Population of Federal Heights is 14,173.
What is the Total Male Population of Federal Heights?
Total Male Population of Federal Heights is 7,595.
What is the Total Female Population of Federal Heights?
Total Female Population of Federal Heights is 6,578.
What is the Ratio of Males per 100 Females in Federal Heights?
There are 115.46 Males per 100 Females in Federal Heights.
What is the Ratio of Females per 100 Males in Federal Heights?
There are 86.61 Females per 100 Males in Federal Heights.
What is the Median Population Age in Federal Heights?
Median Population Age in Federal Heights is 31.7 Years.
What is the Average Family Size in Federal Heights
Average Family Size in Federal Heights is 3.5 People.
What is the Average Household Size in Federal Heights
Average Household Size in Federal Heights is 2.8 People.
How Large is the Labor Force in Federal Heights?
There are 7,243 People in the Labor Forcein in Federal Heights.
What is the Percentage of People in the Labor Force in Federal Heights?
69.9% of People are in the Labor Force in Federal Heights.
What is the Unemployment Rate in Federal Heights?
Unemployment Rate in Federal Heights is 3.8%.