San Luis, CO Map & Demographics
San Luis Map
San Luis Overview
$20,321
PER CAPITA INCOME
$38,068
AVG FAMILY INCOME
$27,895
AVG HOUSEHOLD INCOME
28.0%
WAGE / INCOME GAP [ % ]
72.0¢/ $1
WAGE / INCOME GAP [ $ ]
0.44
INEQUALITY / GINI INDEX
603
TOTAL POPULATION
301
MALE POPULATION
302
FEMALE POPULATION
99.67
MALES / 100 FEMALES
100.33
FEMALES / 100 MALES
47.1
MEDIAN AGE
2.7
AVG FAMILY SIZE
2.1
AVG HOUSEHOLD SIZE
267
LABOR FORCE [ PEOPLE ]
52.9%
PERCENT IN LABOR FORCE
3.4%
UNEMPLOYMENT RATE
San Luis Zip Codes
San Luis Area Codes
Income in San Luis
Income Overview in San Luis
Per Capita Income in San Luis is $20,321, while median incomes of families and households are $38,068 and $27,895 respectively.
| Characteristic | Number | Measure |
| Per Capita Income | 603 | $20,321 |
| Median Family Income | 169 | $38,068 |
| Mean Family Income | 169 | $51,074 |
| Median Household Income | 276 | $27,895 |
| Mean Household Income | 276 | $40,273 |
| Income Deficit | 169 | $0 |
| Wage / Income Gap (%) | 603 | 27.97% |
| Wage / Income Gap ($) | 603 | 72.03¢ per $1 |
| Gini / Inequality Index | 603 | 0.44 |
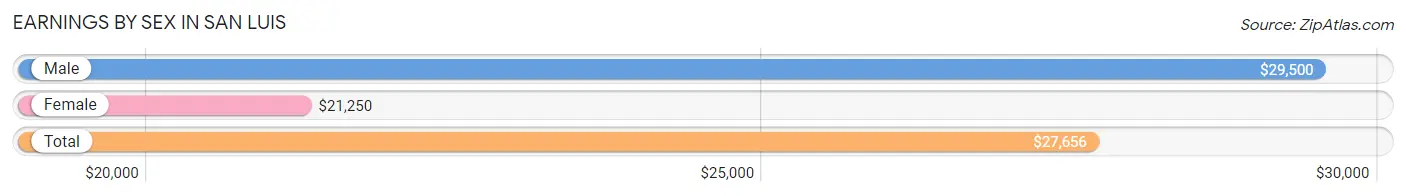
Earnings by Sex in San Luis
Average Earnings in San Luis are $27,656, $29,500 for men and $21,250 for women, a difference of 28.0%.
| Sex | Number | Average Earnings |
| Male | 146 (49.7%) | $29,500 |
| Female | 148 (50.3%) | $21,250 |
| Total | 294 (100.0%) | $27,656 |
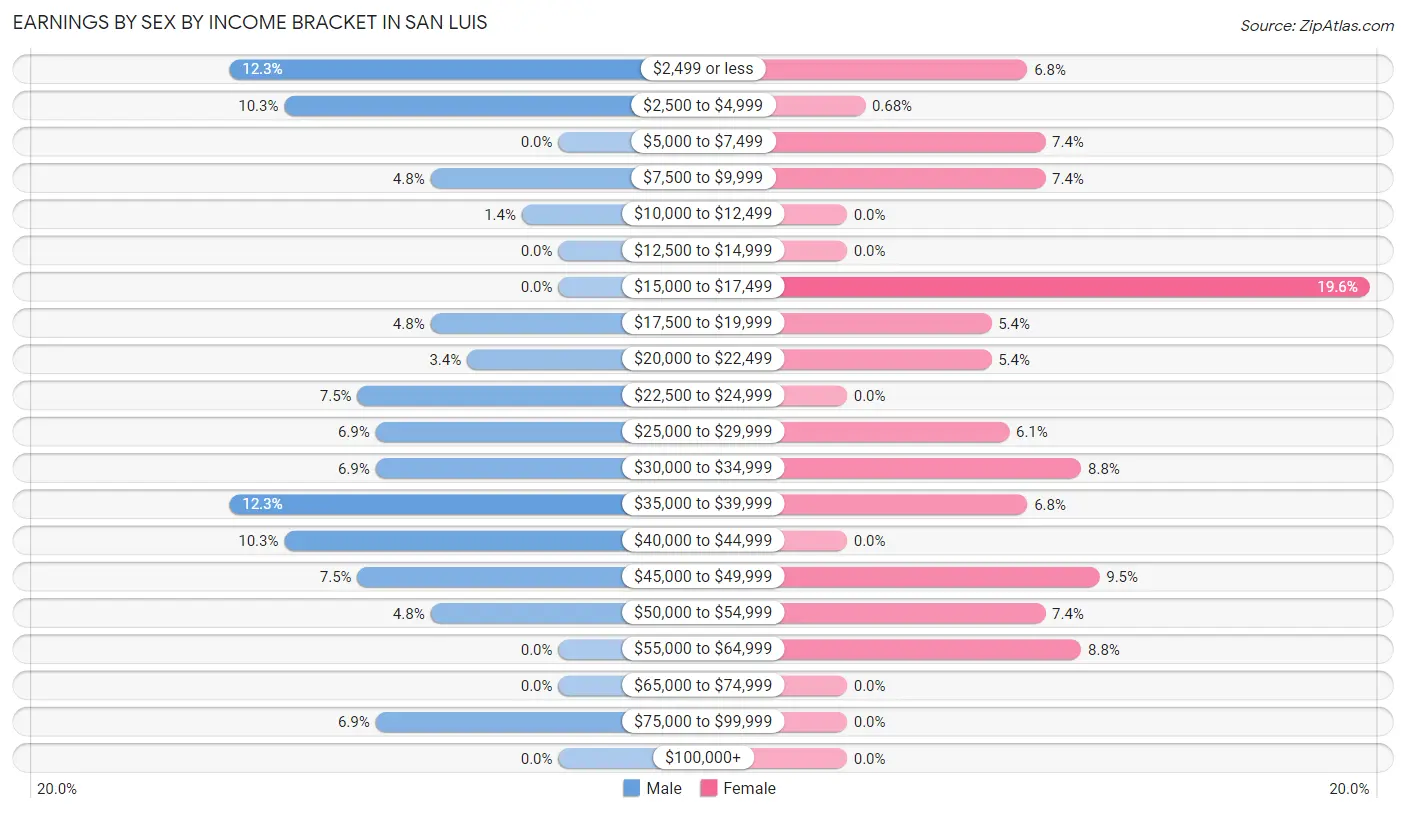
Earnings by Sex by Income Bracket in San Luis
The most common earnings brackets in San Luis are $2,499 or less for men (18 | 12.3%) and $15,000 to $17,499 for women (29 | 19.6%).
| Income | Male | Female |
| $2,499 or less | 18 (12.3%) | 10 (6.8%) |
| $2,500 to $4,999 | 15 (10.3%) | 1 (0.7%) |
| $5,000 to $7,499 | 0 (0.0%) | 11 (7.4%) |
| $7,500 to $9,999 | 7 (4.8%) | 11 (7.4%) |
| $10,000 to $12,499 | 2 (1.4%) | 0 (0.0%) |
| $12,500 to $14,999 | 0 (0.0%) | 0 (0.0%) |
| $15,000 to $17,499 | 0 (0.0%) | 29 (19.6%) |
| $17,500 to $19,999 | 7 (4.8%) | 8 (5.4%) |
| $20,000 to $22,499 | 5 (3.4%) | 8 (5.4%) |
| $22,500 to $24,999 | 11 (7.5%) | 0 (0.0%) |
| $25,000 to $29,999 | 10 (6.9%) | 9 (6.1%) |
| $30,000 to $34,999 | 10 (6.9%) | 13 (8.8%) |
| $35,000 to $39,999 | 18 (12.3%) | 10 (6.8%) |
| $40,000 to $44,999 | 15 (10.3%) | 0 (0.0%) |
| $45,000 to $49,999 | 11 (7.5%) | 14 (9.5%) |
| $50,000 to $54,999 | 7 (4.8%) | 11 (7.4%) |
| $55,000 to $64,999 | 0 (0.0%) | 13 (8.8%) |
| $65,000 to $74,999 | 0 (0.0%) | 0 (0.0%) |
| $75,000 to $99,999 | 10 (6.9%) | 0 (0.0%) |
| $100,000+ | 0 (0.0%) | 0 (0.0%) |
| Total | 146 (100.0%) | 148 (100.0%) |
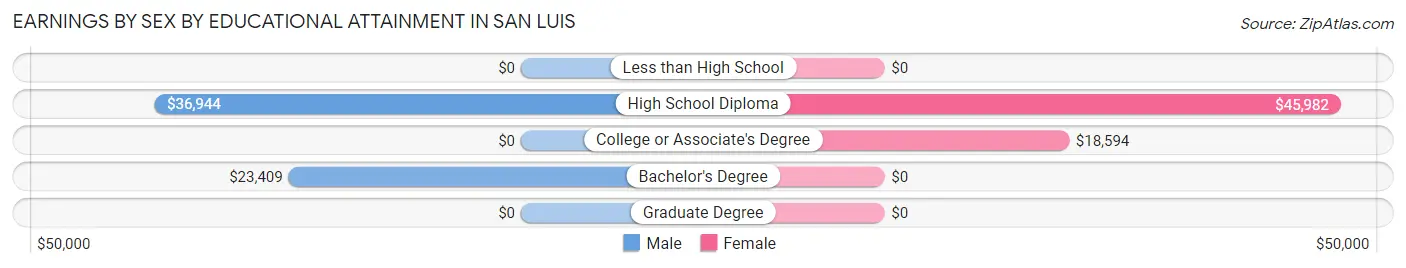
Earnings by Sex by Educational Attainment in San Luis
Average earnings in San Luis are $35,625 for men and $26,667 for women, a difference of 25.2%. Men with an educational attainment of high school diploma enjoy the highest average annual earnings of $36,944, while those with bachelor's degree education earn the least with $23,409. Women with an educational attainment of high school diploma earn the most with the average annual earnings of $45,982, while those with college or associate's degree education have the smallest earnings of $18,594.
| Educational Attainment | Male Income | Female Income |
| Less than High School | - | - |
| High School Diploma | $36,944 | $45,982 |
| College or Associate's Degree | - | - |
| Bachelor's Degree | $23,409 | $0 |
| Graduate Degree | - | - |
| Total | $35,625 | $26,667 |
Family Income in San Luis
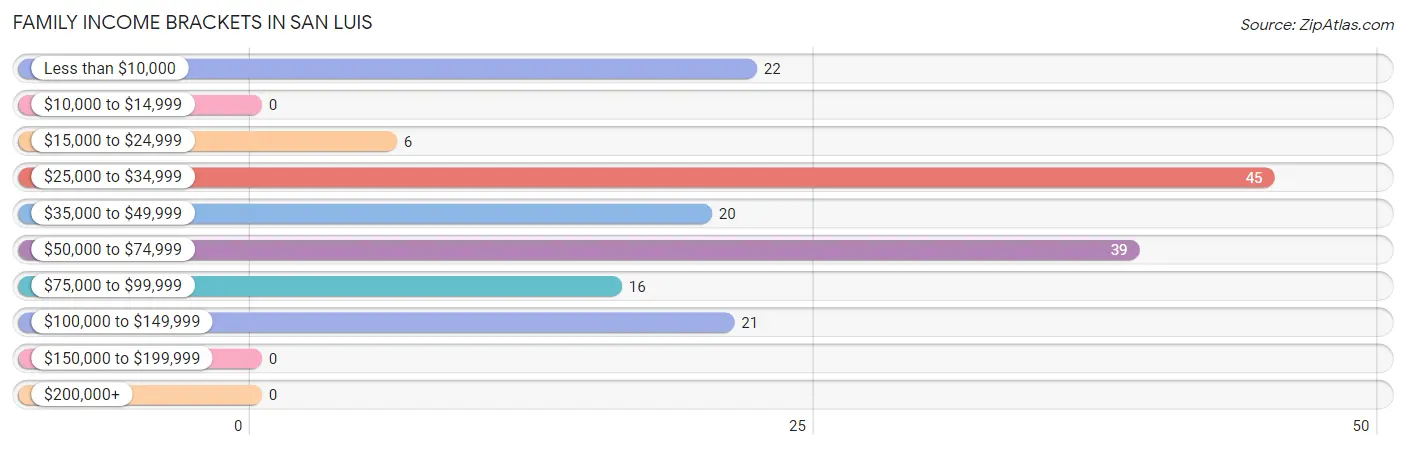
Family Income Brackets in San Luis
According to the San Luis family income data, there are 45 families falling into the $25,000 to $34,999 income range, which is the most common income bracket and makes up 26.6% of all families.
| Income Bracket | # Families | % Families |
| Less than $10,000 | 22 | 13.0% |
| $10,000 to $14,999 | 0 | 0.0% |
| $15,000 to $24,999 | 6 | 3.6% |
| $25,000 to $34,999 | 45 | 26.6% |
| $35,000 to $49,999 | 20 | 11.8% |
| $50,000 to $74,999 | 39 | 23.1% |
| $75,000 to $99,999 | 16 | 9.5% |
| $100,000 to $149,999 | 21 | 12.4% |
| $150,000 to $199,999 | 0 | 0.0% |
| $200,000+ | 0 | 0.0% |
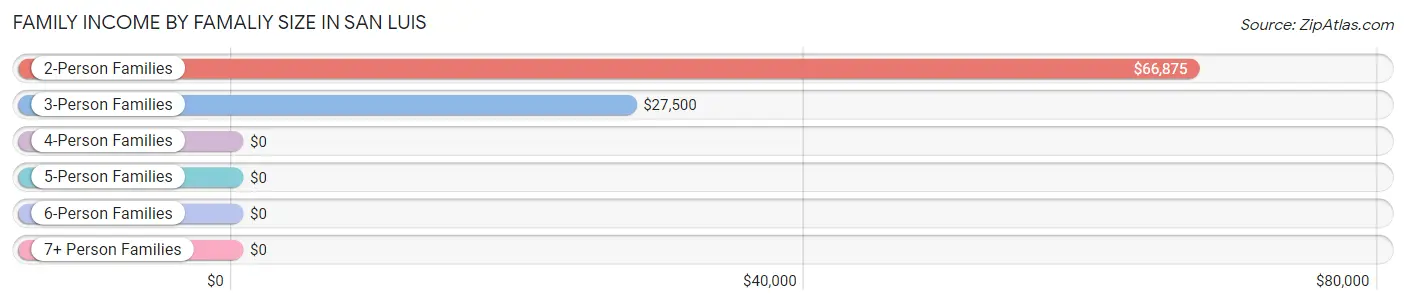
Family Income by Famaliy Size in San Luis
2-person families (91 | 53.8%) account for the highest median family income in San Luis with $66,875 per family, while 2-person families (91 | 53.8%) have the highest median income of $33,438 per family member.
| Income Bracket | # Families | Median Income |
| 2-Person Families | 91 (53.8%) | $66,875 |
| 3-Person Families | 68 (40.2%) | $27,500 |
| 4-Person Families | 0 (0.0%) | $0 |
| 5-Person Families | 10 (5.9%) | $0 |
| 6-Person Families | 0 (0.0%) | $0 |
| 7+ Person Families | 0 (0.0%) | $0 |
| Total | 169 (100.0%) | $38,068 |
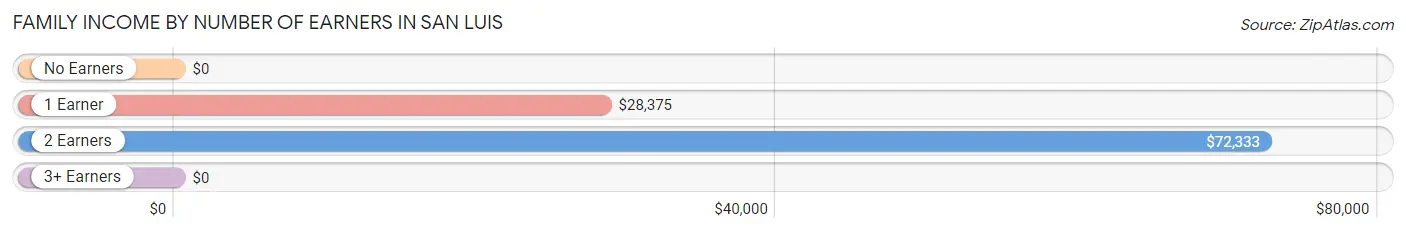
Family Income by Number of Earners in San Luis
| Number of Earners | # Families | Median Income |
| No Earners | 27 (16.0%) | $0 |
| 1 Earner | 75 (44.4%) | $28,375 |
| 2 Earners | 58 (34.3%) | $72,333 |
| 3+ Earners | 9 (5.3%) | $0 |
| Total | 169 (100.0%) | $38,068 |
Household Income in San Luis
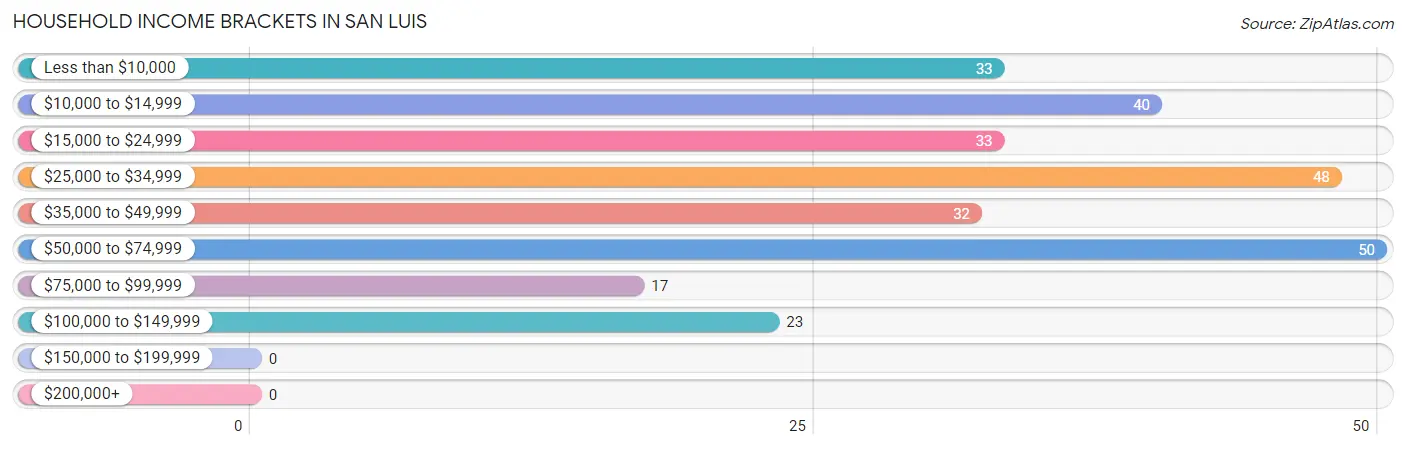
Household Income Brackets in San Luis
With 50 households falling in the category, the $50,000 to $74,999 income range is the most frequent in San Luis, accounting for 18.1% of all households.
| Income Bracket | # Households | % Households |
| Less than $10,000 | 33 | 12.0% |
| $10,000 to $14,999 | 40 | 14.5% |
| $15,000 to $24,999 | 33 | 12.0% |
| $25,000 to $34,999 | 48 | 17.4% |
| $35,000 to $49,999 | 32 | 11.6% |
| $50,000 to $74,999 | 50 | 18.1% |
| $75,000 to $99,999 | 17 | 6.2% |
| $100,000 to $149,999 | 23 | 8.3% |
| $150,000 to $199,999 | 0 | 0.0% |
| $200,000+ | 0 | 0.0% |
Household Income by Householder Age in San Luis
The median household income in San Luis is $27,895, with the highest median household income of $25,625 found in the 65+ years age bracket for the primary householder. A total of 86 households (31.2%) fall into this category. Meanwhile, the 15 to 24 years age bracket for the primary householder has the lowest median household income of $0, with 3 households (1.1%) in this group.
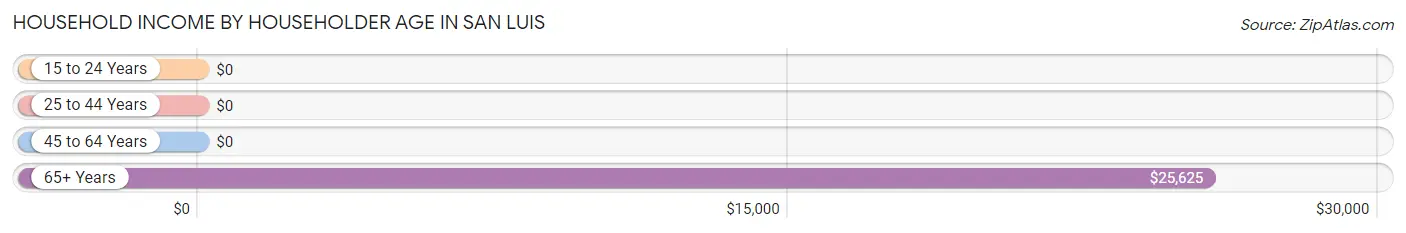
| Income Bracket | # Households | Median Income |
| 15 to 24 Years | 3 (1.1%) | $0 |
| 25 to 44 Years | 54 (19.6%) | $0 |
| 45 to 64 Years | 133 (48.2%) | $0 |
| 65+ Years | 86 (31.2%) | $25,625 |
| Total | 276 (100.0%) | $27,895 |
Poverty in San Luis
Income Below Poverty by Sex and Age in San Luis
With 32.0% poverty level for males and 28.0% for females among the residents of San Luis, 35 to 44 year old males and under 5 year old females are the most vulnerable to poverty, with 24 males (82.8%) and 8 females (100.0%) in their respective age groups living below the poverty level.
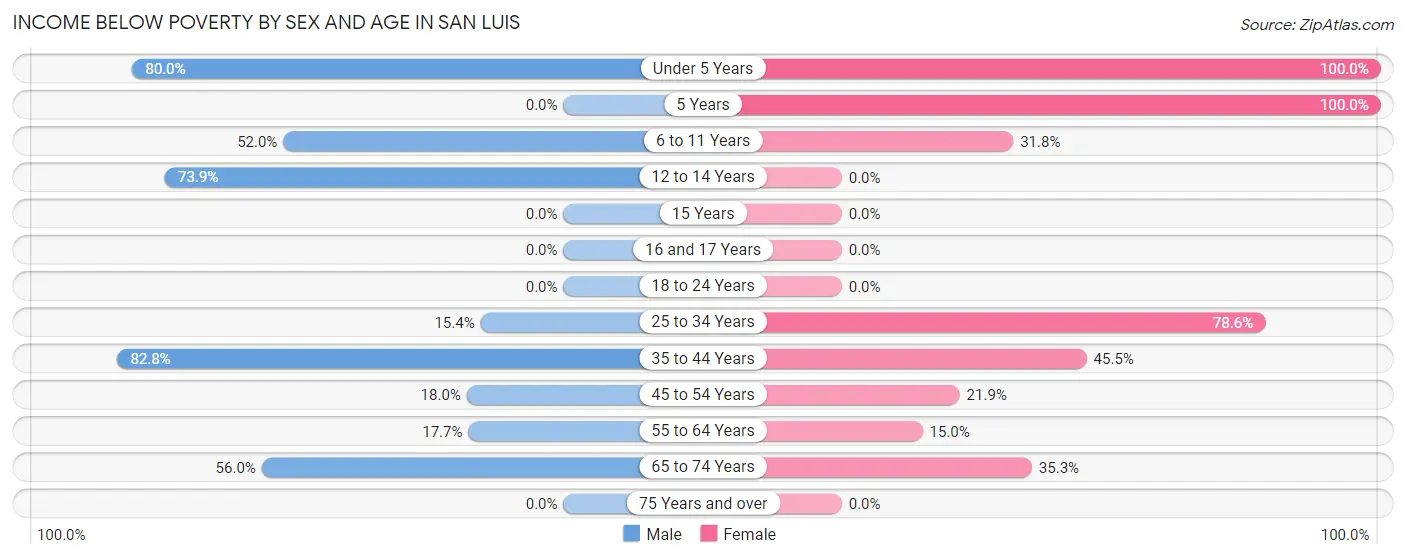
| Age Bracket | Male | Female |
| Under 5 Years | 8 (80.0%) | 8 (100.0%) |
| 5 Years | 0 (0.0%) | 10 (100.0%) |
| 6 to 11 Years | 13 (52.0%) | 7 (31.8%) |
| 12 to 14 Years | 17 (73.9%) | 0 (0.0%) |
| 15 Years | 0 (0.0%) | 0 (0.0%) |
| 16 and 17 Years | 0 (0.0%) | 0 (0.0%) |
| 18 to 24 Years | 0 (0.0%) | 0 (0.0%) |
| 25 to 34 Years | 4 (15.4%) | 11 (78.6%) |
| 35 to 44 Years | 24 (82.8%) | 20 (45.5%) |
| 45 to 54 Years | 7 (17.9%) | 14 (21.9%) |
| 55 to 64 Years | 6 (17.6%) | 6 (15.0%) |
| 65 to 74 Years | 14 (56.0%) | 6 (35.3%) |
| 75 Years and over | 0 (0.0%) | 0 (0.0%) |
| Total | 93 (32.0%) | 82 (28.0%) |
Income Above Poverty by Sex and Age in San Luis
According to the poverty statistics in San Luis, males aged 16 and 17 years and females aged 16 and 17 years are the age groups that are most secure financially, with 100.0% of males and 100.0% of females in these age groups living above the poverty line.
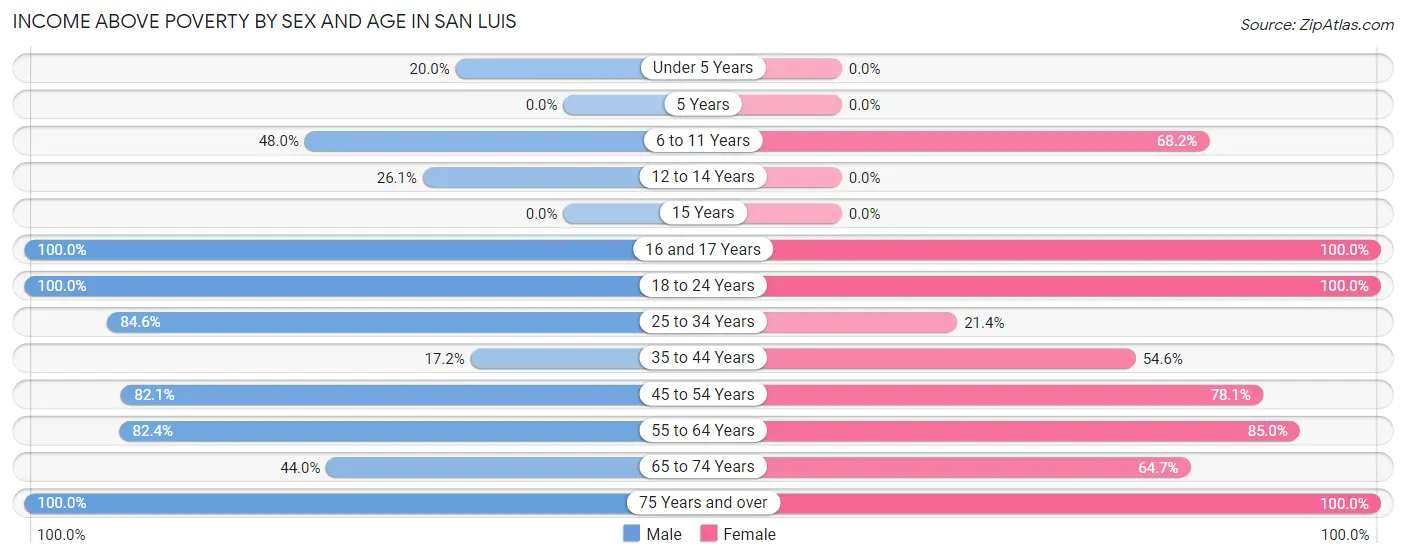
| Age Bracket | Male | Female |
| Under 5 Years | 2 (20.0%) | 0 (0.0%) |
| 5 Years | 0 (0.0%) | 0 (0.0%) |
| 6 to 11 Years | 12 (48.0%) | 15 (68.2%) |
| 12 to 14 Years | 6 (26.1%) | 0 (0.0%) |
| 15 Years | 0 (0.0%) | 0 (0.0%) |
| 16 and 17 Years | 9 (100.0%) | 16 (100.0%) |
| 18 to 24 Years | 36 (100.0%) | 13 (100.0%) |
| 25 to 34 Years | 22 (84.6%) | 3 (21.4%) |
| 35 to 44 Years | 5 (17.2%) | 24 (54.5%) |
| 45 to 54 Years | 32 (82.1%) | 50 (78.1%) |
| 55 to 64 Years | 28 (82.4%) | 34 (85.0%) |
| 65 to 74 Years | 11 (44.0%) | 11 (64.7%) |
| 75 Years and over | 35 (100.0%) | 45 (100.0%) |
| Total | 198 (68.0%) | 211 (72.0%) |
Income Below Poverty Among Married-Couple Families in San Luis
The poverty statistics for married-couple families in San Luis show that 15.8% or 16 of the total 101 families live below the poverty line. Families with 3 or 4 children have the highest poverty rate of 100.0%, comprising of 10 families. On the other hand, families with 1 or 2 children have the lowest poverty rate of 0.0%, which includes 0 families.
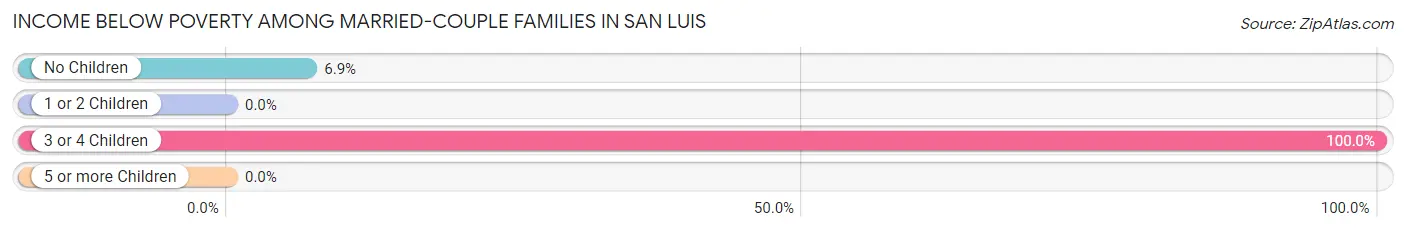
| Children | Above Poverty | Below Poverty |
| No Children | 81 (93.1%) | 6 (6.9%) |
| 1 or 2 Children | 4 (100.0%) | 0 (0.0%) |
| 3 or 4 Children | 0 (0.0%) | 10 (100.0%) |
| 5 or more Children | 0 (0.0%) | 0 (0.0%) |
| Total | 85 (84.2%) | 16 (15.8%) |
Income Below Poverty Among Single-Parent Households in San Luis
According to the poverty data in San Luis, 58.3% or 7 single-father households and 26.8% or 15 single-mother households are living below the poverty line. Among single-father households, those with 1 or 2 children have the highest poverty rate, with 7 households (100.0%) experiencing poverty. Likewise, among single-mother households, those with 1 or 2 children have the highest poverty rate, with 15 households (27.3%) falling below the poverty line.
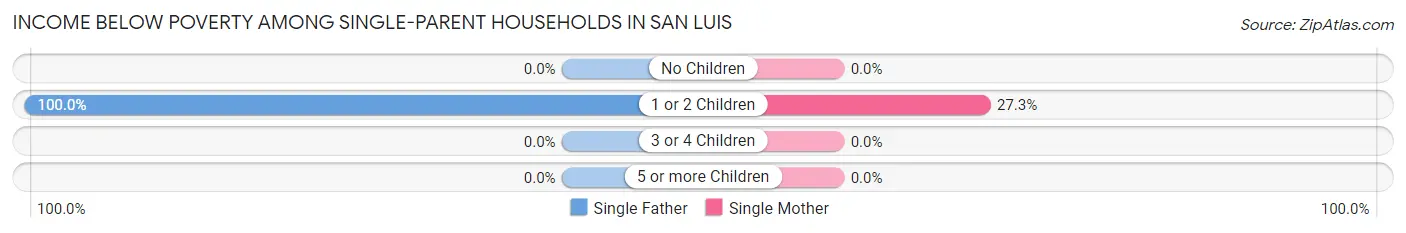
| Children | Single Father | Single Mother |
| No Children | 0 (0.0%) | 0 (0.0%) |
| 1 or 2 Children | 7 (100.0%) | 15 (27.3%) |
| 3 or 4 Children | 0 (0.0%) | 0 (0.0%) |
| 5 or more Children | 0 (0.0%) | 0 (0.0%) |
| Total | 7 (58.3%) | 15 (26.8%) |
Income Below Poverty Among Married-Couple vs Single-Parent Households in San Luis
The poverty data for San Luis shows that 16 of the married-couple family households (15.8%) and 22 of the single-parent households (32.4%) are living below the poverty level. Within the married-couple family households, those with 3 or 4 children have the highest poverty rate, with 10 households (100.0%) falling below the poverty line. Among the single-parent households, those with 1 or 2 children have the highest poverty rate, with 22 household (35.5%) living below poverty.
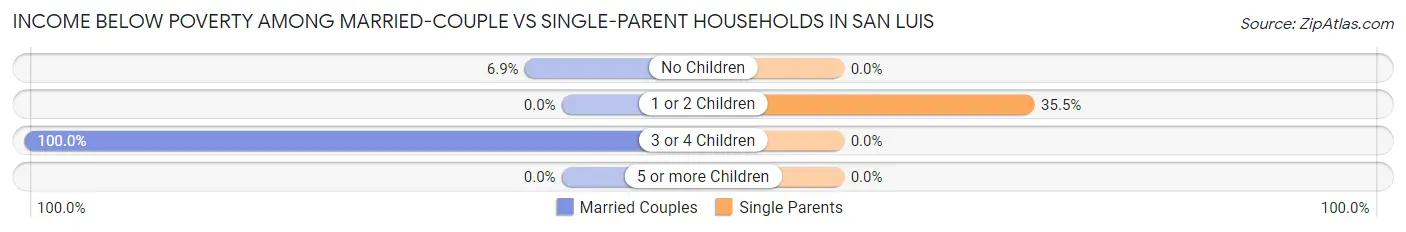
| Children | Married-Couple Families | Single-Parent Households |
| No Children | 6 (6.9%) | 0 (0.0%) |
| 1 or 2 Children | 0 (0.0%) | 22 (35.5%) |
| 3 or 4 Children | 10 (100.0%) | 0 (0.0%) |
| 5 or more Children | 0 (0.0%) | 0 (0.0%) |
| Total | 16 (15.8%) | 22 (32.4%) |
Race in San Luis
The most populous races in San Luis are Hispanic or Latino (458 | 75.9%), White / Caucasian (310 | 51.4%), and Two or more Races (149 | 24.7%).
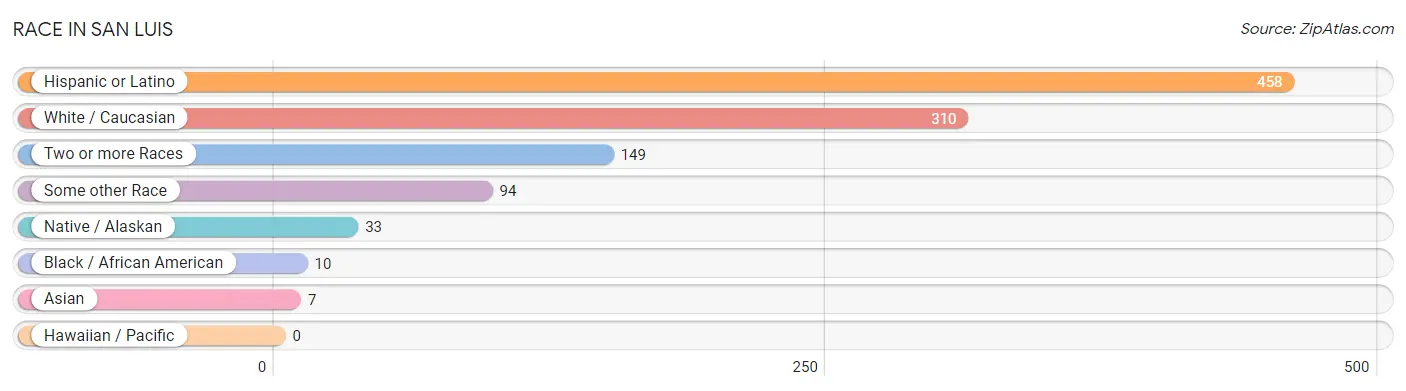
| Race | # Population | % Population |
| Asian | 7 | 1.2% |
| Black / African American | 10 | 1.7% |
| Hawaiian / Pacific | 0 | 0.0% |
| Hispanic or Latino | 458 | 75.9% |
| Native / Alaskan | 33 | 5.5% |
| White / Caucasian | 310 | 51.4% |
| Two or more Races | 149 | 24.7% |
| Some other Race | 94 | 15.6% |
| Total | 603 | 100.0% |
Ancestry in San Luis
The most populous ancestries reported in San Luis are Mexican (240 | 39.8%), Spaniard (102 | 16.9%), American (41 | 6.8%), Spanish (41 | 6.8%), and English (36 | 6.0%), together accounting for 76.3% of all San Luis residents.
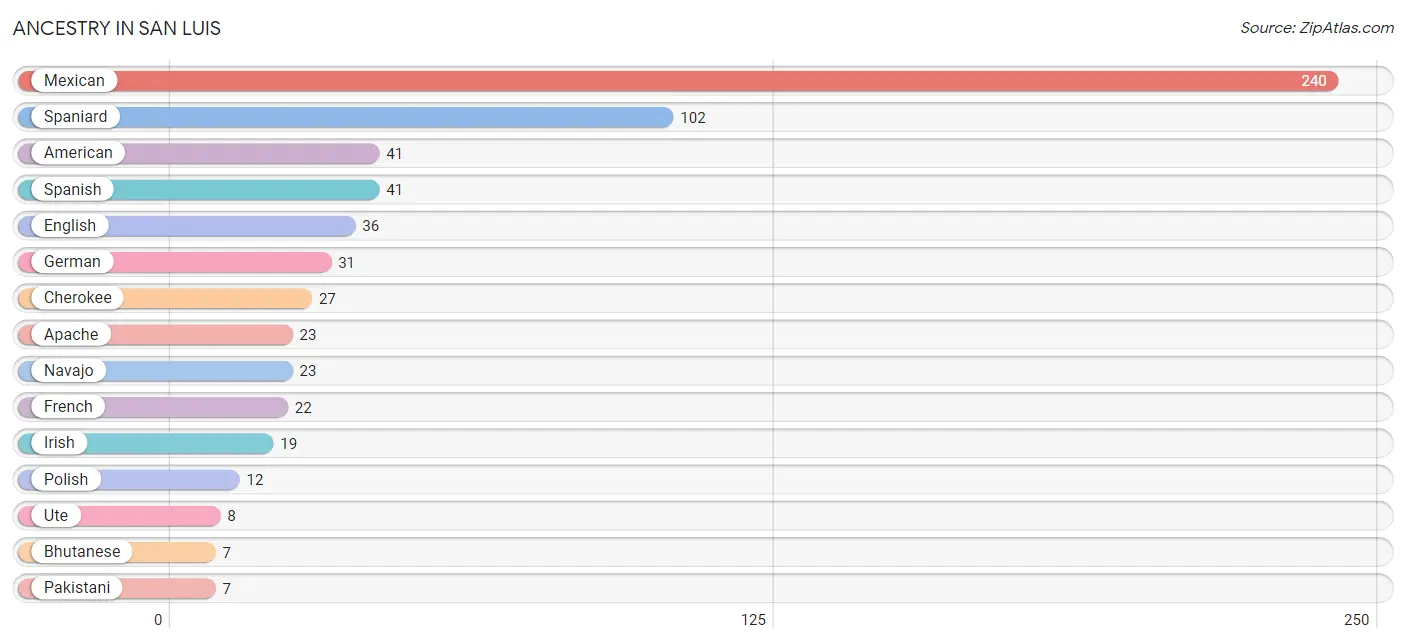
| Ancestry | # Population | % Population |
| American | 41 | 6.8% |
| Apache | 23 | 3.8% |
| Bhutanese | 7 | 1.2% |
| Cherokee | 27 | 4.5% |
| Dutch | 5 | 0.8% |
| English | 36 | 6.0% |
| French | 22 | 3.6% |
| German | 31 | 5.1% |
| Irish | 19 | 3.2% |
| Mexican | 240 | 39.8% |
| Navajo | 23 | 3.8% |
| Pakistani | 7 | 1.2% |
| Polish | 12 | 2.0% |
| Pueblo | 6 | 1.0% |
| Spaniard | 102 | 16.9% |
| Spanish | 41 | 6.8% |
| Swedish | 1 | 0.2% |
| Ute | 8 | 1.3% | View All 18 Rows |
Immigrants in San Luis
The most numerous immigrant groups reported in San Luis came from Central America (29 | 4.8%), Latin America (29 | 4.8%), Mexico (29 | 4.8%), Asia (7 | 1.2%), and South Eastern Asia (7 | 1.2%), together accounting for 16.7% of all San Luis residents.
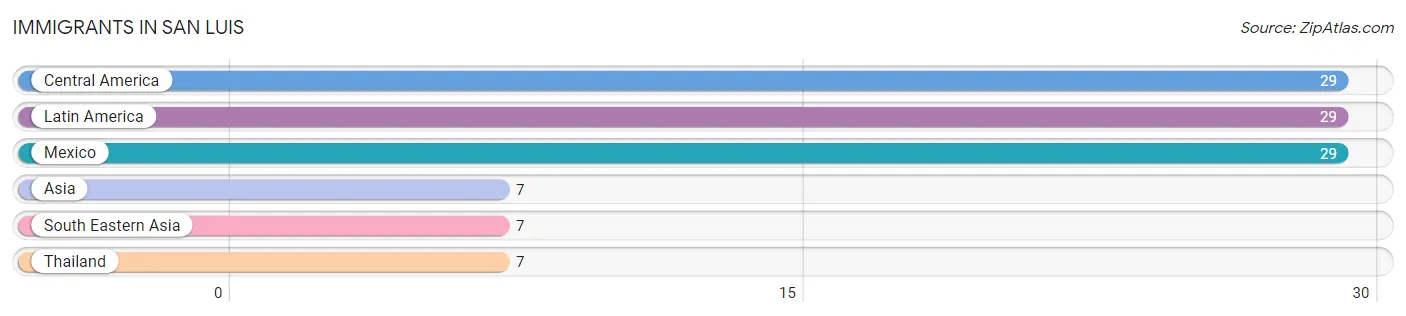
| Immigration Origin | # Population | % Population |
| Asia | 7 | 1.2% |
| Central America | 29 | 4.8% |
| Latin America | 29 | 4.8% |
| Mexico | 29 | 4.8% |
| South Eastern Asia | 7 | 1.2% |
| Thailand | 7 | 1.2% | View All 6 Rows |
Sex and Age in San Luis
Sex and Age in San Luis
The most populous age groups in San Luis are 10 to 14 Years (35 | 11.6%) for men and 45 to 49 Years (46 | 15.2%) for women.
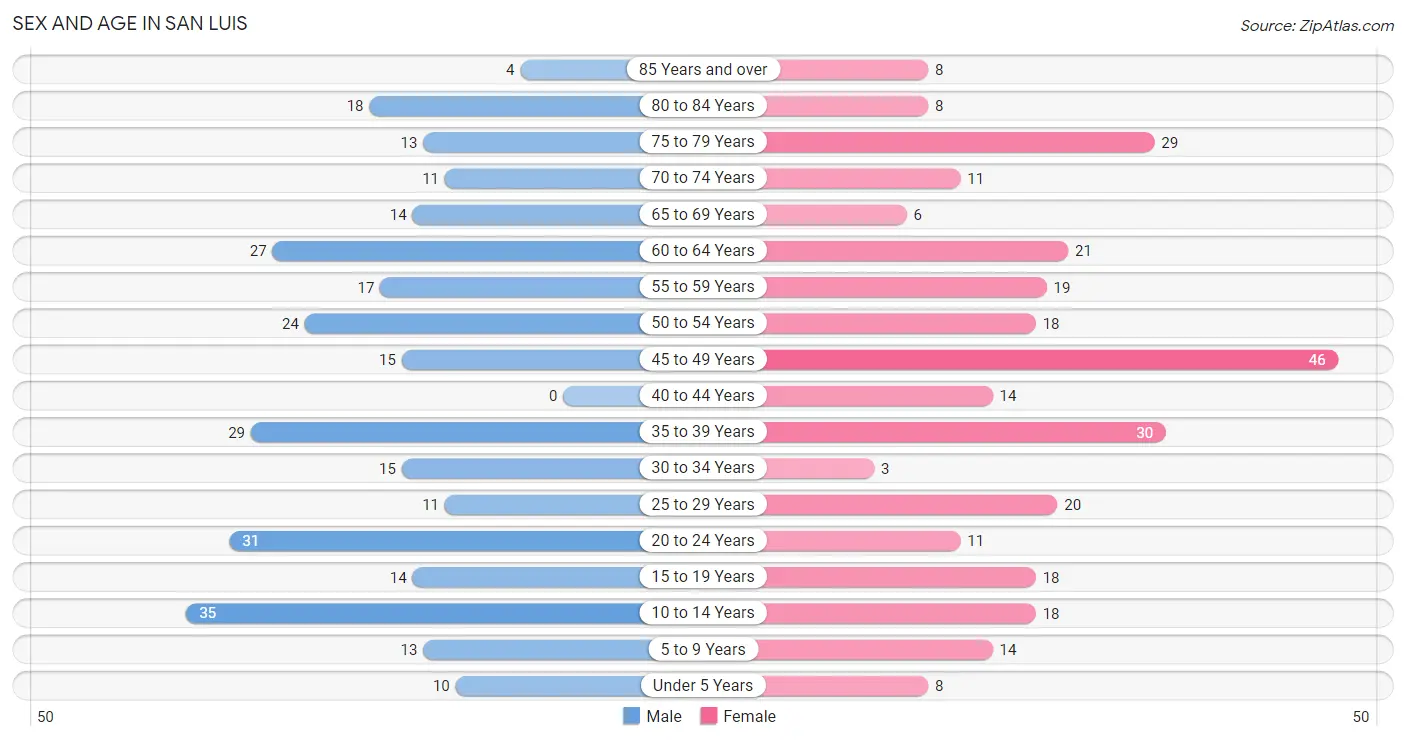
| Age Bracket | Male | Female |
| Under 5 Years | 10 (3.3%) | 8 (2.6%) |
| 5 to 9 Years | 13 (4.3%) | 14 (4.6%) |
| 10 to 14 Years | 35 (11.6%) | 18 (6.0%) |
| 15 to 19 Years | 14 (4.6%) | 18 (6.0%) |
| 20 to 24 Years | 31 (10.3%) | 11 (3.6%) |
| 25 to 29 Years | 11 (3.6%) | 20 (6.6%) |
| 30 to 34 Years | 15 (5.0%) | 3 (1.0%) |
| 35 to 39 Years | 29 (9.6%) | 30 (9.9%) |
| 40 to 44 Years | 0 (0.0%) | 14 (4.6%) |
| 45 to 49 Years | 15 (5.0%) | 46 (15.2%) |
| 50 to 54 Years | 24 (8.0%) | 18 (6.0%) |
| 55 to 59 Years | 17 (5.7%) | 19 (6.3%) |
| 60 to 64 Years | 27 (9.0%) | 21 (7.0%) |
| 65 to 69 Years | 14 (4.6%) | 6 (2.0%) |
| 70 to 74 Years | 11 (3.6%) | 11 (3.6%) |
| 75 to 79 Years | 13 (4.3%) | 29 (9.6%) |
| 80 to 84 Years | 18 (6.0%) | 8 (2.6%) |
| 85 Years and over | 4 (1.3%) | 8 (2.6%) |
| Total | 301 (100.0%) | 302 (100.0%) |
Families and Households in San Luis
Median Family Size in San Luis
The median family size in San Luis is 2.67 persons per family, with single male/father families (12 | 7.1%) accounting for the largest median family size of 3.33 persons per family. On the other hand, single female/mother families (56 | 33.1%) represent the smallest median family size with 2.61 persons per family.
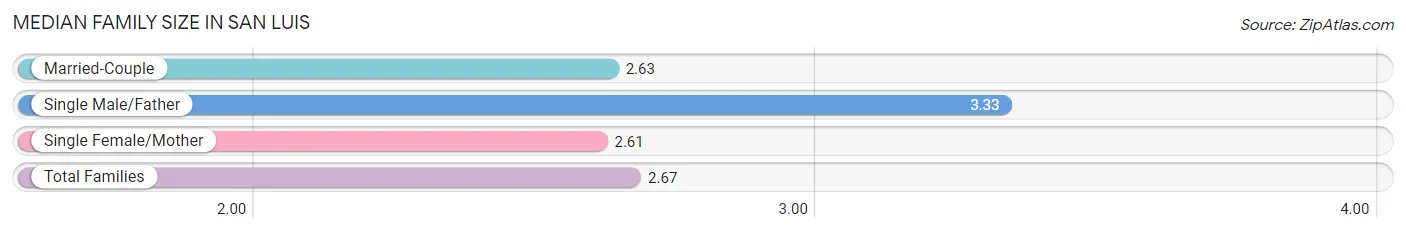
| Family Type | # Families | Family Size |
| Married-Couple | 101 (59.8%) | 2.63 |
| Single Male/Father | 12 (7.1%) | 3.33 |
| Single Female/Mother | 56 (33.1%) | 2.61 |
| Total Families | 169 (100.0%) | 2.67 |
Median Household Size in San Luis
The median household size in San Luis is 2.12 persons per household, with single male/father households (12 | 4.3%) accounting for the largest median household size of 4.17 persons per household. non-family households (107 | 38.8%) represent the smallest median household size with 1.14 persons per household.
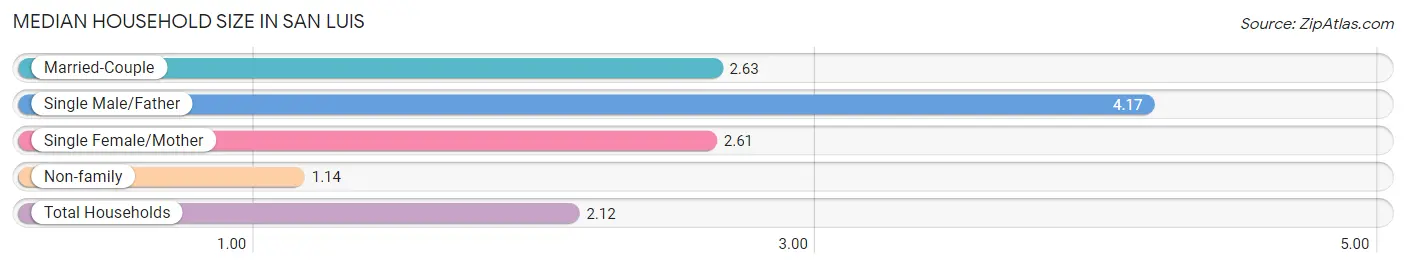
| Household Type | # Households | Household Size |
| Married-Couple | 101 (36.6%) | 2.63 |
| Single Male/Father | 12 (4.3%) | 4.17 |
| Single Female/Mother | 56 (20.3%) | 2.61 |
| Non-family | 107 (38.8%) | 1.14 |
| Total Households | 276 (100.0%) | 2.12 |
Household Size by Marriage Status in San Luis
Out of a total of 276 households in San Luis, 169 (61.2%) are family households, while 107 (38.8%) are nonfamily households. The most numerous type of family households are 2-person households, comprising 86, and the most common type of nonfamily households are 1-person households, comprising 105.
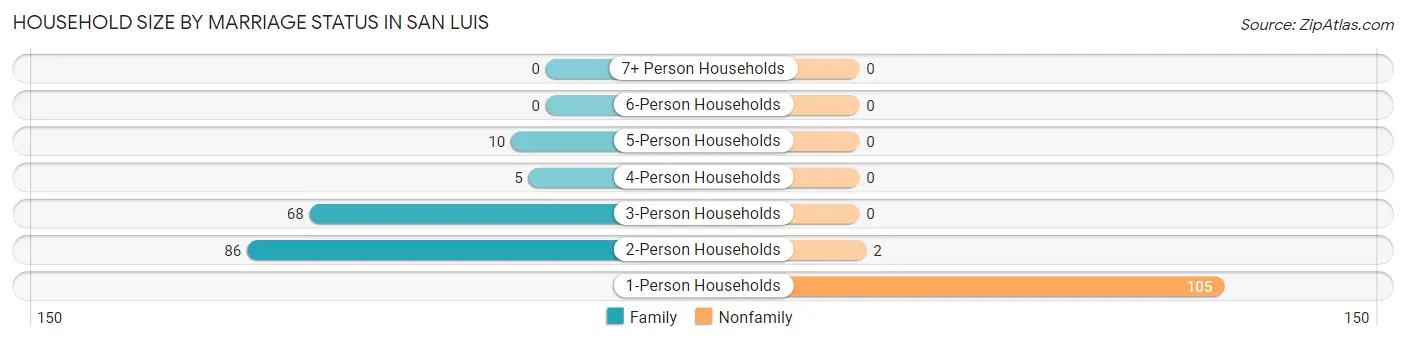
| Household Size | Family Households | Nonfamily Households |
| 1-Person Households | - | 105 (38.0%) |
| 2-Person Households | 86 (31.2%) | 2 (0.7%) |
| 3-Person Households | 68 (24.6%) | 0 (0.0%) |
| 4-Person Households | 5 (1.8%) | 0 (0.0%) |
| 5-Person Households | 10 (3.6%) | 0 (0.0%) |
| 6-Person Households | 0 (0.0%) | 0 (0.0%) |
| 7+ Person Households | 0 (0.0%) | 0 (0.0%) |
| Total | 169 (61.2%) | 107 (38.8%) |
Female Fertility in San Luis
Fertility by Age in San Luis
Average fertility rate in San Luis is 63.0 births per 1,000 women. Women in the age bracket of 20 to 34 years have the highest fertility rate with 265.0 births per 1,000 women. Women in the age bracket of 20 to 34 years acount for 100.0% of all women with births.
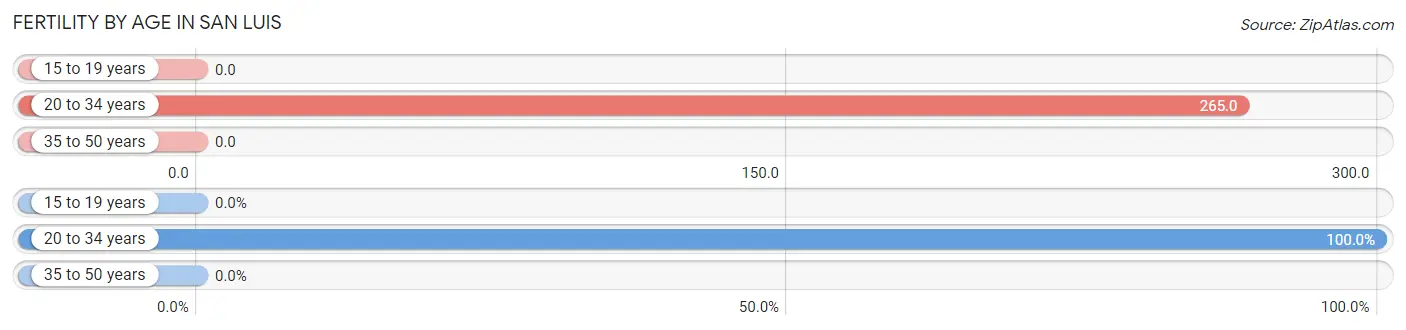
| Age Bracket | Women with Births | Births / 1,000 Women |
| 15 to 19 years | 0 (0.0%) | 0.0 |
| 20 to 34 years | 9 (100.0%) | 265.0 |
| 35 to 50 years | 0 (0.0%) | 0.0 |
| Total | 9 (100.0%) | 63.0 |
Fertility by Age by Marriage Status in San Luis
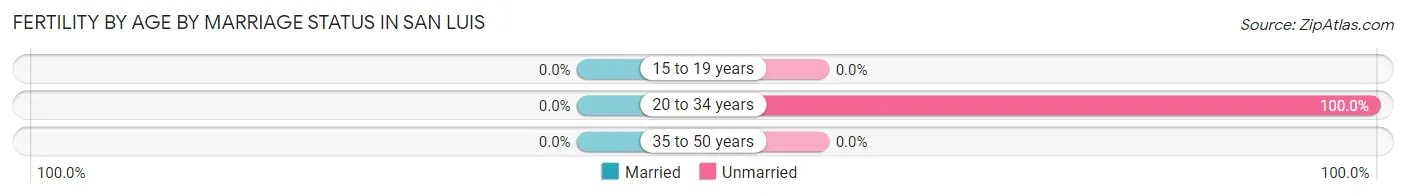
| Age Bracket | Married | Unmarried |
| 15 to 19 years | 0 (0.0%) | 0 (0.0%) |
| 20 to 34 years | 0 (0.0%) | 9 (100.0%) |
| 35 to 50 years | 0 (0.0%) | 0 (0.0%) |
| Total | 0 (0.0%) | 9 (100.0%) |
Fertility by Education in San Luis
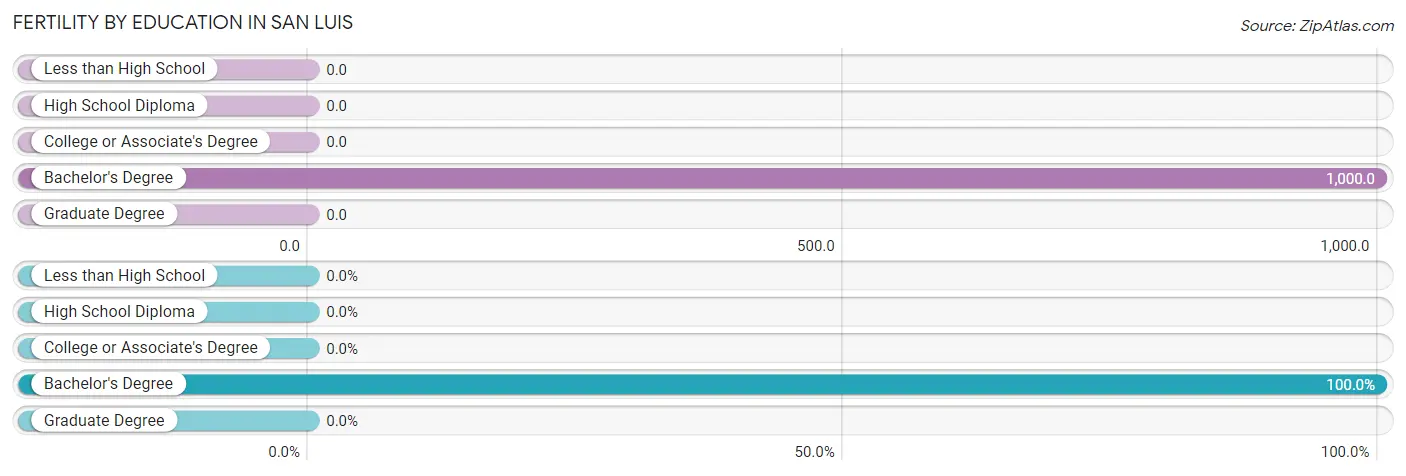
| Educational Attainment | Women with Births | Births / 1,000 Women |
| Less than High School | 0 (0.0%) | 0.0 |
| High School Diploma | 0 (0.0%) | 0.0 |
| College or Associate's Degree | 0 (0.0%) | 0.0 |
| Bachelor's Degree | 9 (100.0%) | 1,000.0 |
| Graduate Degree | 0 (0.0%) | 0.0 |
| Total | 9 (100.0%) | 63.0 |
Fertility by Education by Marriage Status in San Luis
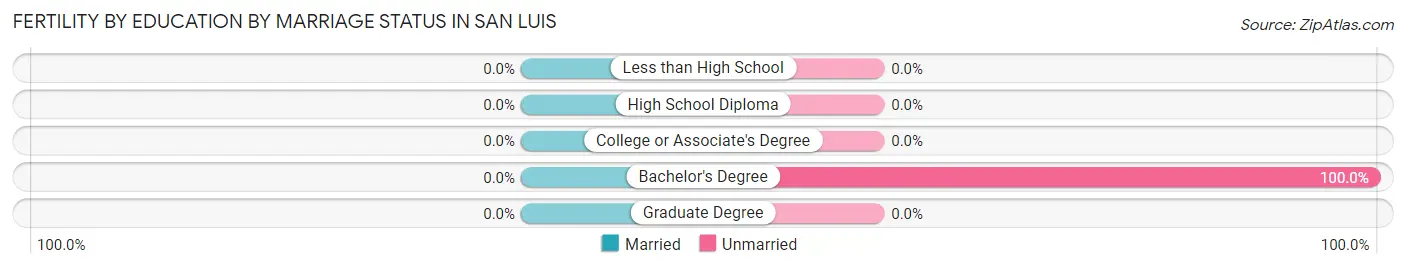
| Educational Attainment | Married | Unmarried |
| Less than High School | 0 (0.0%) | 0 (0.0%) |
| High School Diploma | 0 (0.0%) | 0 (0.0%) |
| College or Associate's Degree | 0 (0.0%) | 0 (0.0%) |
| Bachelor's Degree | 0 (0.0%) | 9 (100.0%) |
| Graduate Degree | 0 (0.0%) | 0 (0.0%) |
| Total | 0 (0.0%) | 9 (100.0%) |
Employment Characteristics in San Luis
Employment by Class of Employer in San Luis
Among the 230 employed individuals in San Luis, private company employees (117 | 50.9%), local government employees (67 | 29.1%), and self-employed (incorporated) (22 | 9.6%) make up the most common classes of employment.
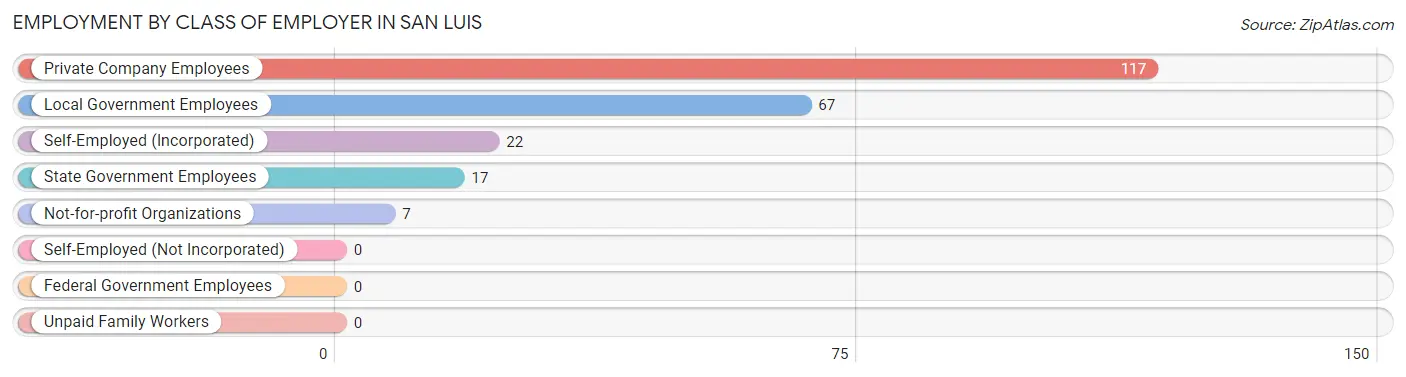
| Employer Class | # Employees | % Employees |
| Private Company Employees | 117 | 50.9% |
| Self-Employed (Incorporated) | 22 | 9.6% |
| Self-Employed (Not Incorporated) | 0 | 0.0% |
| Not-for-profit Organizations | 7 | 3.0% |
| Local Government Employees | 67 | 29.1% |
| State Government Employees | 17 | 7.4% |
| Federal Government Employees | 0 | 0.0% |
| Unpaid Family Workers | 0 | 0.0% |
| Total | 230 | 100.0% |
Employment Status by Age in San Luis
According to the labor force statistics for San Luis, out of the total population over 16 years of age (505), 52.9% or 267 individuals are in the labor force, with 3.4% or 9 of them unemployed. The age group with the highest labor force participation rate is 45 to 54 years, with 84.5% or 87 individuals in the labor force. Within the labor force, the 30 to 34 years age range has the highest percentage of unemployed individuals, with 21.4% or 3 of them being unemployed.
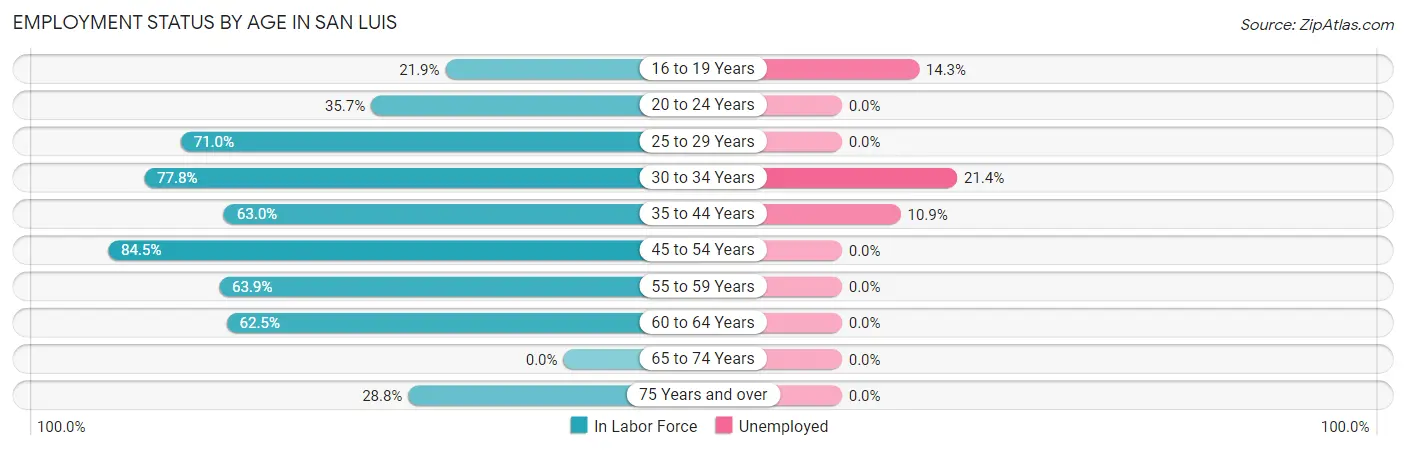
| Age Bracket | In Labor Force | Unemployed |
| 16 to 19 Years | 7 (21.9%) | 1 (14.3%) |
| 20 to 24 Years | 15 (35.7%) | 0 (0.0%) |
| 25 to 29 Years | 22 (71.0%) | 0 (0.0%) |
| 30 to 34 Years | 14 (77.8%) | 3 (21.4%) |
| 35 to 44 Years | 46 (63.0%) | 5 (10.9%) |
| 45 to 54 Years | 87 (84.5%) | 0 (0.0%) |
| 55 to 59 Years | 23 (63.9%) | 0 (0.0%) |
| 60 to 64 Years | 30 (62.5%) | 0 (0.0%) |
| 65 to 74 Years | 0 (0.0%) | 0 (0.0%) |
| 75 Years and over | 23 (28.8%) | 0 (0.0%) |
| Total | 267 (52.9%) | 9 (3.4%) |
Employment Status by Educational Attainment in San Luis
According to labor force statistics for San Luis, 71.8% of individuals (222) out of the total population between 25 and 64 years of age (309) are in the labor force, with 3.6% or 8 of them being unemployed. The group with the highest labor force participation rate are those with the educational attainment of college / associate degree, with 86.6% or 110 individuals in the labor force. Within the labor force, individuals with high school diploma education have the highest percentage of unemployment, with 6.7% or 5 of them being unemployed.
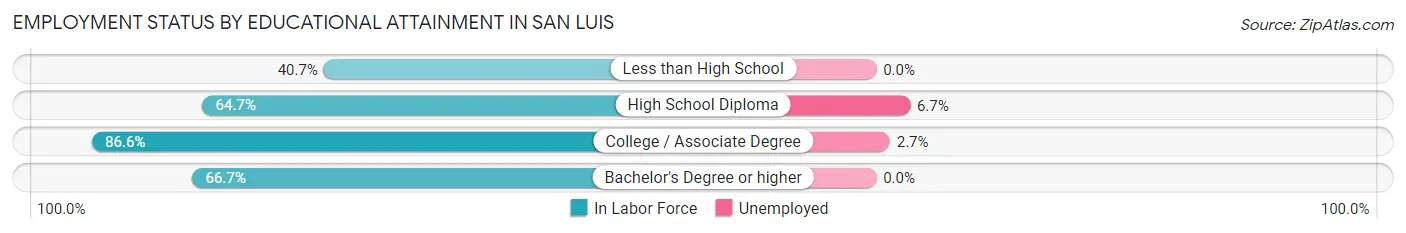
| Educational Attainment | In Labor Force | Unemployed |
| Less than High School | 11 (40.7%) | 0 (0.0%) |
| High School Diploma | 75 (64.7%) | 8 (6.7%) |
| College / Associate Degree | 110 (86.6%) | 3 (2.7%) |
| Bachelor's Degree or higher | 26 (66.7%) | 0 (0.0%) |
| Total | 222 (71.8%) | 11 (3.6%) |
Employment Occupations by Sex in San Luis
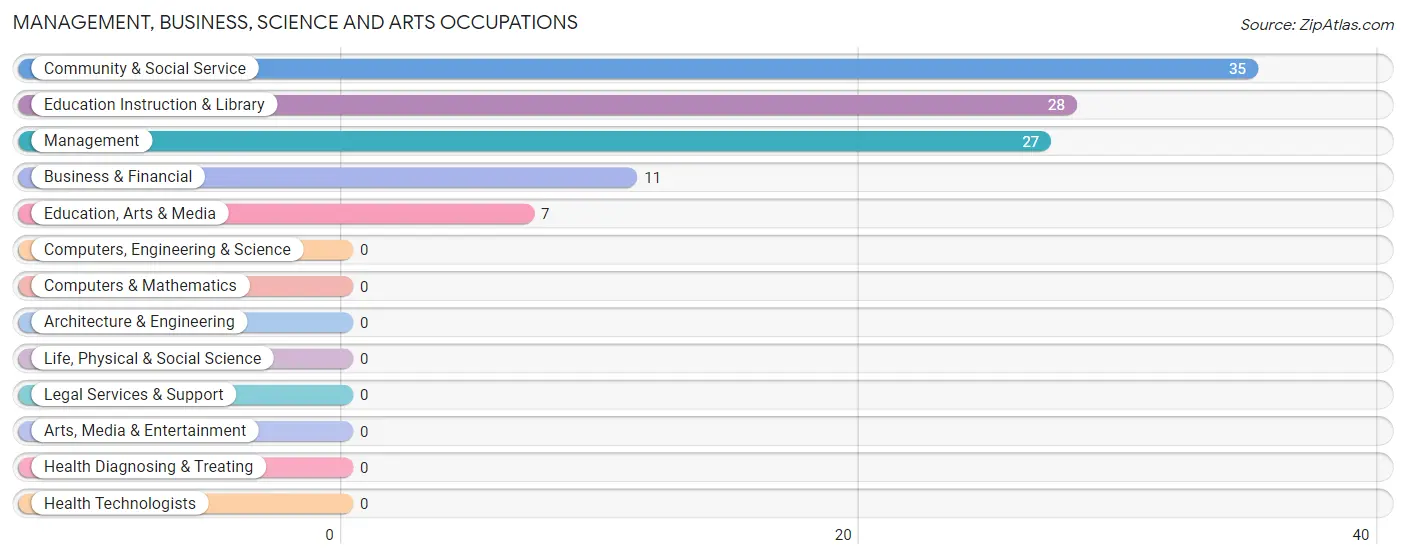
Management, Business, Science and Arts Occupations
The most common Management, Business, Science and Arts occupations in San Luis are Community & Social Service (35 | 13.6%), Education Instruction & Library (28 | 10.8%), Management (27 | 10.5%), Business & Financial (11 | 4.3%), and Education, Arts & Media (7 | 2.7%).
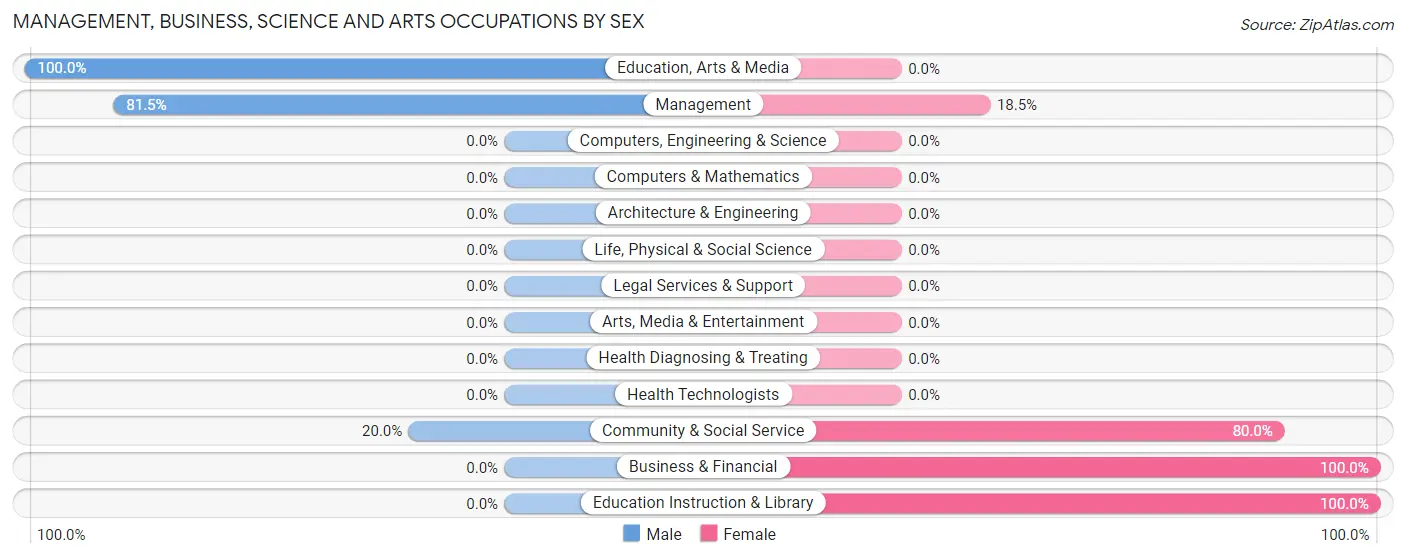
Management, Business, Science and Arts Occupations by Sex
Within the Management, Business, Science and Arts occupations in San Luis, the most male-oriented occupations are Education, Arts & Media (100.0%), Management (81.5%), and Community & Social Service (20.0%), while the most female-oriented occupations are Business & Financial (100.0%), Education Instruction & Library (100.0%), and Community & Social Service (80.0%).
| Occupation | Male | Female |
| Management | 22 (81.5%) | 5 (18.5%) |
| Business & Financial | 0 (0.0%) | 11 (100.0%) |
| Computers, Engineering & Science | 0 (0.0%) | 0 (0.0%) |
| Computers & Mathematics | 0 (0.0%) | 0 (0.0%) |
| Architecture & Engineering | 0 (0.0%) | 0 (0.0%) |
| Life, Physical & Social Science | 0 (0.0%) | 0 (0.0%) |
| Community & Social Service | 7 (20.0%) | 28 (80.0%) |
| Education, Arts & Media | 7 (100.0%) | 0 (0.0%) |
| Legal Services & Support | 0 (0.0%) | 0 (0.0%) |
| Education Instruction & Library | 0 (0.0%) | 28 (100.0%) |
| Arts, Media & Entertainment | 0 (0.0%) | 0 (0.0%) |
| Health Diagnosing & Treating | 0 (0.0%) | 0 (0.0%) |
| Health Technologists | 0 (0.0%) | 0 (0.0%) |
| Total (Category) | 29 (39.7%) | 44 (60.3%) |
| Total (Overall) | 113 (43.8%) | 145 (56.2%) |
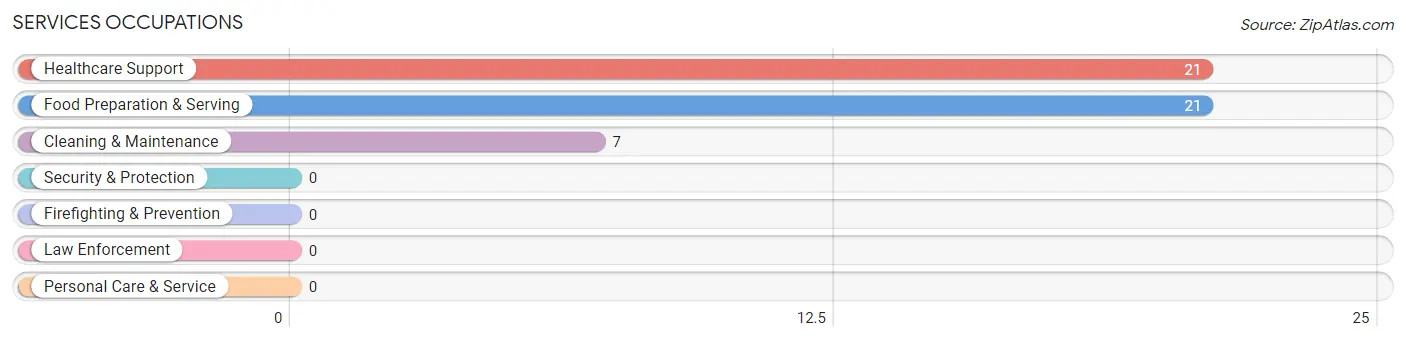
Services Occupations
The most common Services occupations in San Luis are Healthcare Support (21 | 8.1%), Food Preparation & Serving (21 | 8.1%), and Cleaning & Maintenance (7 | 2.7%).
Services Occupations by Sex
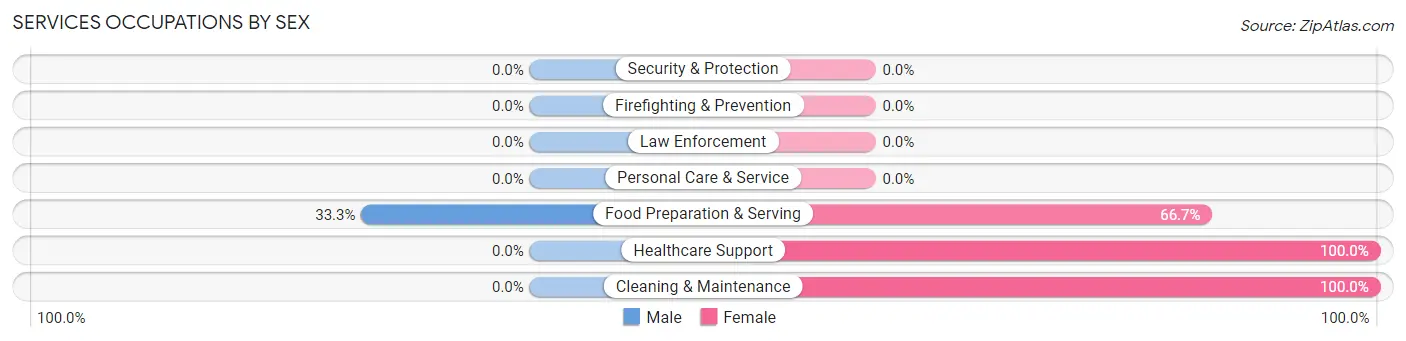
| Occupation | Male | Female |
| Healthcare Support | 0 (0.0%) | 21 (100.0%) |
| Security & Protection | 0 (0.0%) | 0 (0.0%) |
| Firefighting & Prevention | 0 (0.0%) | 0 (0.0%) |
| Law Enforcement | 0 (0.0%) | 0 (0.0%) |
| Food Preparation & Serving | 7 (33.3%) | 14 (66.7%) |
| Cleaning & Maintenance | 0 (0.0%) | 7 (100.0%) |
| Personal Care & Service | 0 (0.0%) | 0 (0.0%) |
| Total (Category) | 7 (14.3%) | 42 (85.7%) |
| Total (Overall) | 113 (43.8%) | 145 (56.2%) |
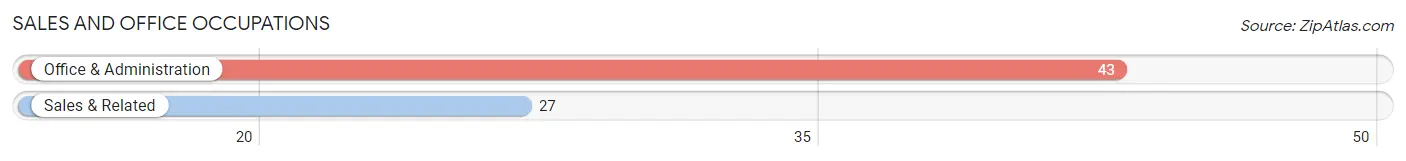
Sales and Office Occupations
The most common Sales and Office occupations in San Luis are Office & Administration (43 | 16.7%), and Sales & Related (27 | 10.5%).
Sales and Office Occupations by Sex
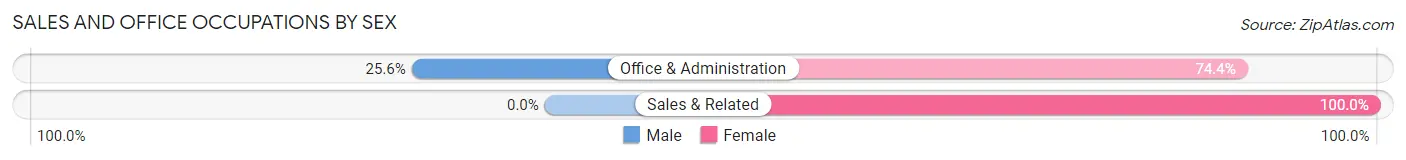
| Occupation | Male | Female |
| Sales & Related | 0 (0.0%) | 27 (100.0%) |
| Office & Administration | 11 (25.6%) | 32 (74.4%) |
| Total (Category) | 11 (15.7%) | 59 (84.3%) |
| Total (Overall) | 113 (43.8%) | 145 (56.2%) |
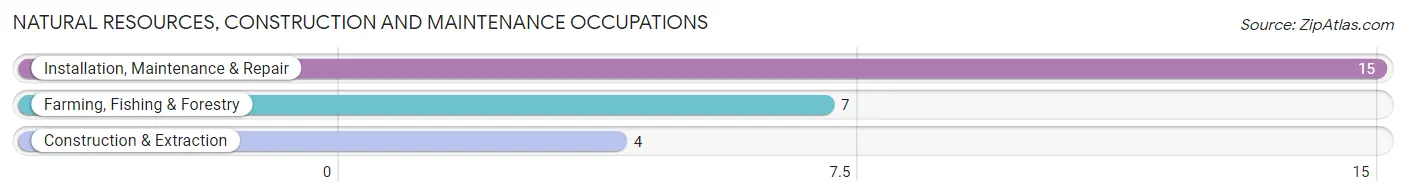
Natural Resources, Construction and Maintenance Occupations
The most common Natural Resources, Construction and Maintenance occupations in San Luis are Installation, Maintenance & Repair (15 | 5.8%), Farming, Fishing & Forestry (7 | 2.7%), and Construction & Extraction (4 | 1.5%).
Natural Resources, Construction and Maintenance Occupations by Sex
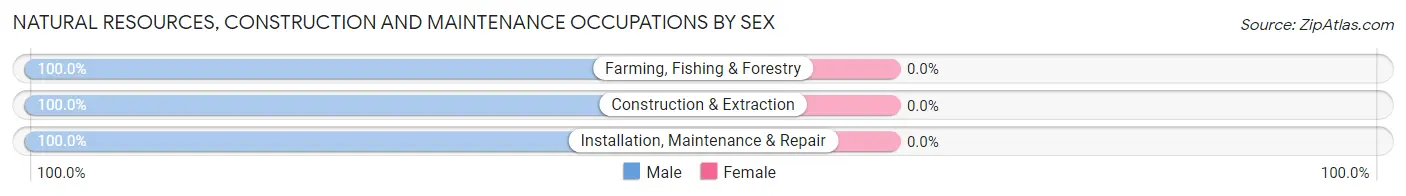
| Occupation | Male | Female |
| Farming, Fishing & Forestry | 7 (100.0%) | 0 (0.0%) |
| Construction & Extraction | 4 (100.0%) | 0 (0.0%) |
| Installation, Maintenance & Repair | 15 (100.0%) | 0 (0.0%) |
| Total (Category) | 26 (100.0%) | 0 (0.0%) |
| Total (Overall) | 113 (43.8%) | 145 (56.2%) |
Production, Transportation and Moving Occupations
The most common Production, Transportation and Moving occupations in San Luis are Production (22 | 8.5%), and Transportation (18 | 7.0%).
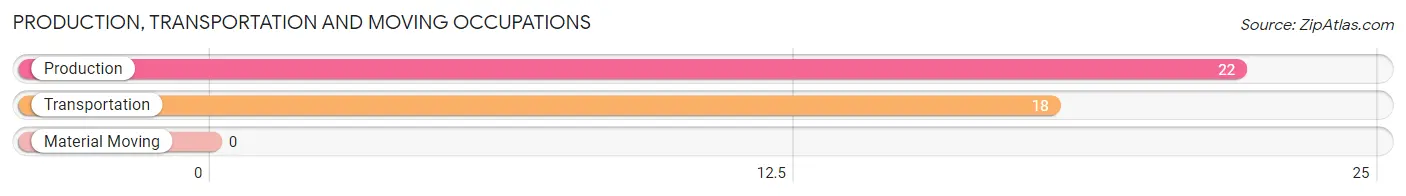
Production, Transportation and Moving Occupations by Sex
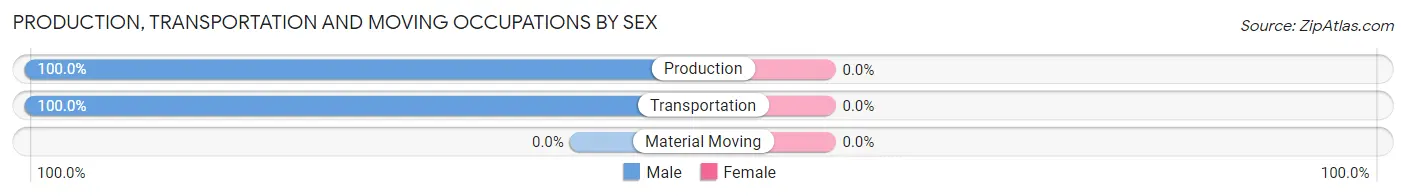
| Occupation | Male | Female |
| Production | 22 (100.0%) | 0 (0.0%) |
| Transportation | 18 (100.0%) | 0 (0.0%) |
| Material Moving | 0 (0.0%) | 0 (0.0%) |
| Total (Category) | 40 (100.0%) | 0 (0.0%) |
| Total (Overall) | 113 (43.8%) | 145 (56.2%) |
Employment Industries by Sex in San Luis
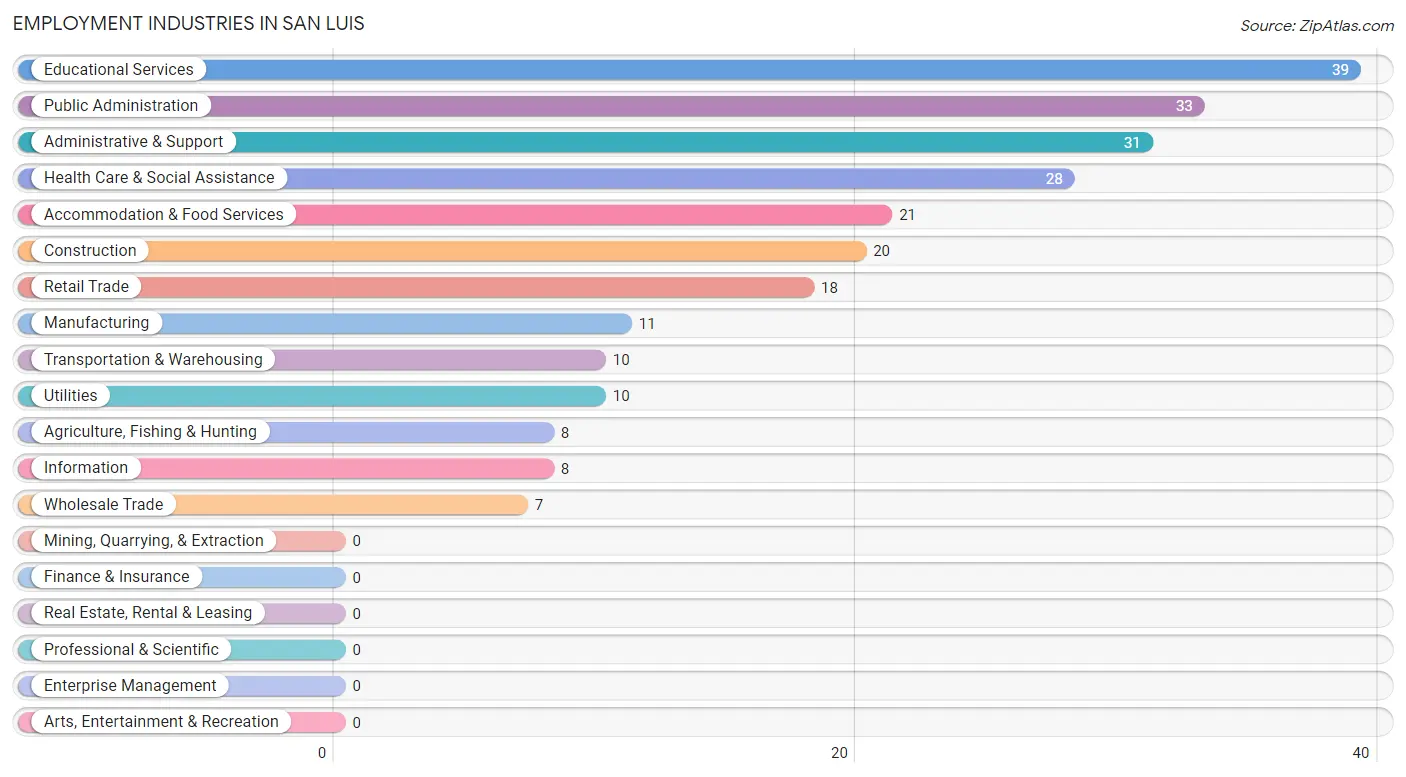
Employment Industries in San Luis
The major employment industries in San Luis include Educational Services (39 | 15.1%), Public Administration (33 | 12.8%), Administrative & Support (31 | 12.0%), Health Care & Social Assistance (28 | 10.8%), and Accommodation & Food Services (21 | 8.1%).
Employment Industries by Sex in San Luis
The San Luis industries that see more men than women are Agriculture, Fishing & Hunting (100.0%), Manufacturing (100.0%), and Wholesale Trade (100.0%), whereas the industries that tend to have a higher number of women are Retail Trade (100.0%), Information (100.0%), and Educational Services (79.5%).
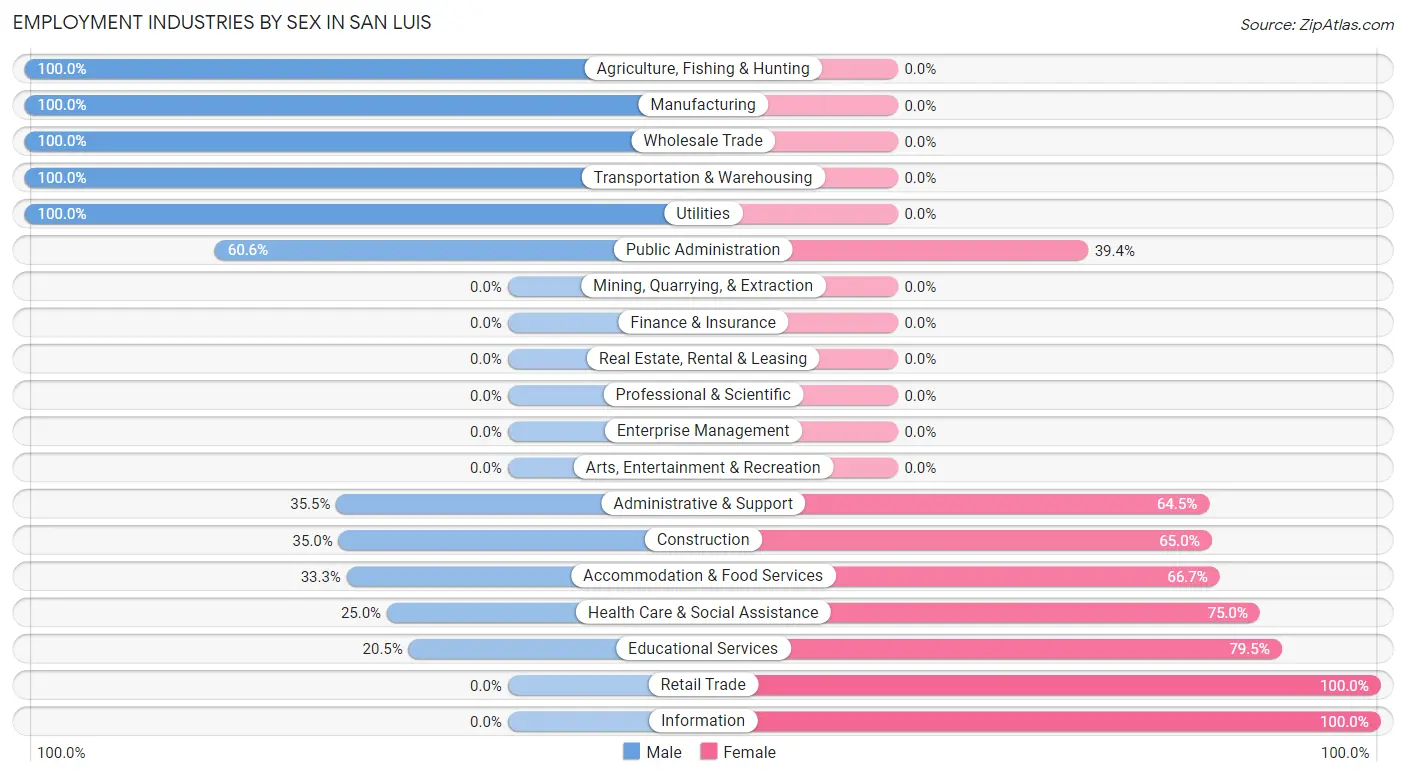
| Industry | Male | Female |
| Agriculture, Fishing & Hunting | 8 (100.0%) | 0 (0.0%) |
| Mining, Quarrying, & Extraction | 0 (0.0%) | 0 (0.0%) |
| Construction | 7 (35.0%) | 13 (65.0%) |
| Manufacturing | 11 (100.0%) | 0 (0.0%) |
| Wholesale Trade | 7 (100.0%) | 0 (0.0%) |
| Retail Trade | 0 (0.0%) | 18 (100.0%) |
| Transportation & Warehousing | 10 (100.0%) | 0 (0.0%) |
| Utilities | 10 (100.0%) | 0 (0.0%) |
| Information | 0 (0.0%) | 8 (100.0%) |
| Finance & Insurance | 0 (0.0%) | 0 (0.0%) |
| Real Estate, Rental & Leasing | 0 (0.0%) | 0 (0.0%) |
| Professional & Scientific | 0 (0.0%) | 0 (0.0%) |
| Enterprise Management | 0 (0.0%) | 0 (0.0%) |
| Administrative & Support | 11 (35.5%) | 20 (64.5%) |
| Educational Services | 8 (20.5%) | 31 (79.5%) |
| Health Care & Social Assistance | 7 (25.0%) | 21 (75.0%) |
| Arts, Entertainment & Recreation | 0 (0.0%) | 0 (0.0%) |
| Accommodation & Food Services | 7 (33.3%) | 14 (66.7%) |
| Public Administration | 20 (60.6%) | 13 (39.4%) |
| Total | 113 (43.8%) | 145 (56.2%) |
Education in San Luis
School Enrollment in San Luis
The most common levels of schooling among the 149 students in San Luis are middle school (53 | 35.6%), high school (31 | 20.8%), and college / undergraduate (28 | 18.8%).
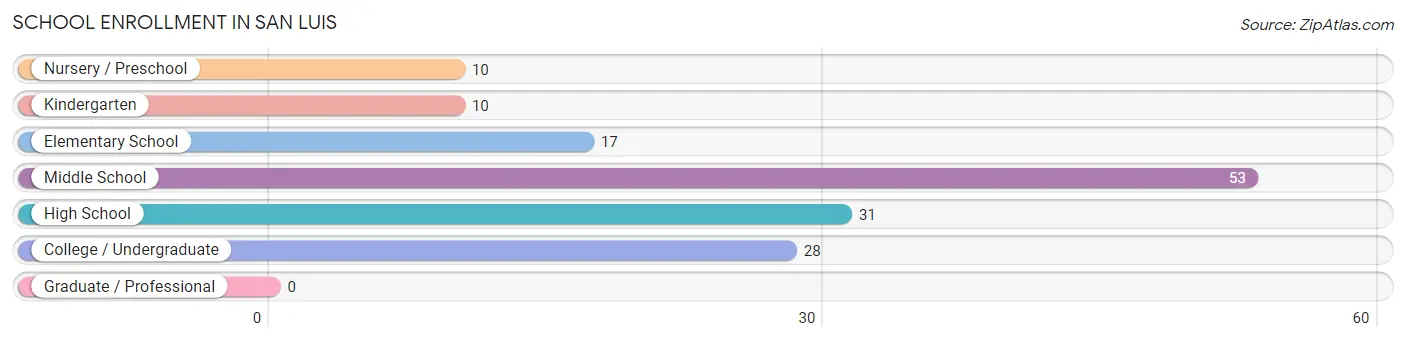
| School Level | # Students | % Students |
| Nursery / Preschool | 10 | 6.7% |
| Kindergarten | 10 | 6.7% |
| Elementary School | 17 | 11.4% |
| Middle School | 53 | 35.6% |
| High School | 31 | 20.8% |
| College / Undergraduate | 28 | 18.8% |
| Graduate / Professional | 0 | 0.0% |
| Total | 149 | 100.0% |
School Enrollment by Age by Funding Source in San Luis
Out of a total of 149 students who are enrolled in schools in San Luis, 17 (11.4%) attend a private institution, while the remaining 132 (88.6%) are enrolled in public schools. The age group of 20 to 24 year olds has the highest likelihood of being enrolled in private schools, with 17 (60.7% in the age bracket) enrolled. Conversely, the age group of 3 to 4 year olds has the lowest likelihood of being enrolled in a private school, with 10 (100.0% in the age bracket) attending a public institution.
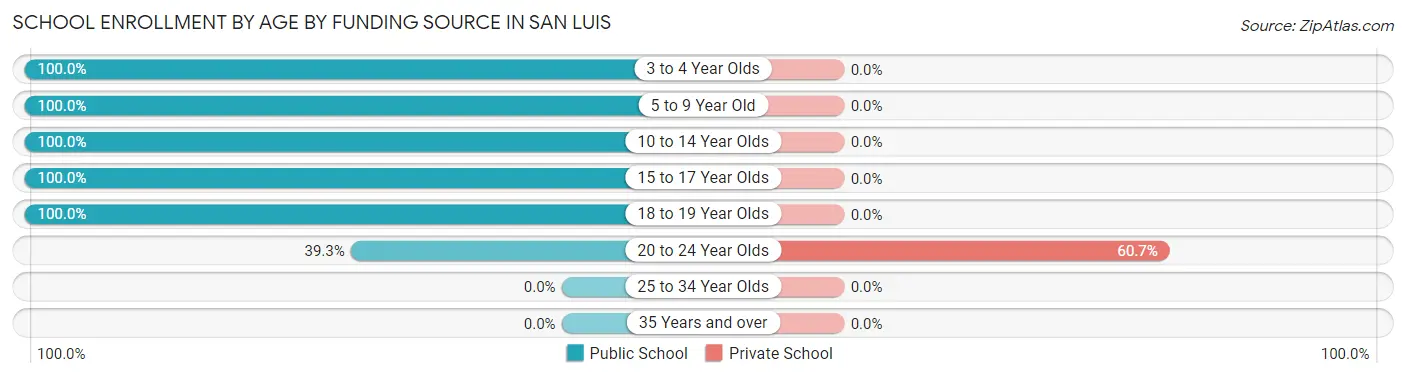
| Age Bracket | Public School | Private School |
| 3 to 4 Year Olds | 10 (100.0%) | 0 (0.0%) |
| 5 to 9 Year Old | 27 (100.0%) | 0 (0.0%) |
| 10 to 14 Year Olds | 53 (100.0%) | 0 (0.0%) |
| 15 to 17 Year Olds | 25 (100.0%) | 0 (0.0%) |
| 18 to 19 Year Olds | 6 (100.0%) | 0 (0.0%) |
| 20 to 24 Year Olds | 11 (39.3%) | 17 (60.7%) |
| 25 to 34 Year Olds | 0 (0.0%) | 0 (0.0%) |
| 35 Years and over | 0 (0.0%) | 0 (0.0%) |
| Total | 132 (88.6%) | 17 (11.4%) |
Educational Attainment by Field of Study in San Luis
Bio, nature & agricultural (28 | 70.0%), visual & performing arts (7 | 17.5%), computers & mathematics (4 | 10.0%), and literature & languages (1 | 2.5%) are the most common fields of study among 40 individuals in San Luis who have obtained a bachelor's degree or higher.
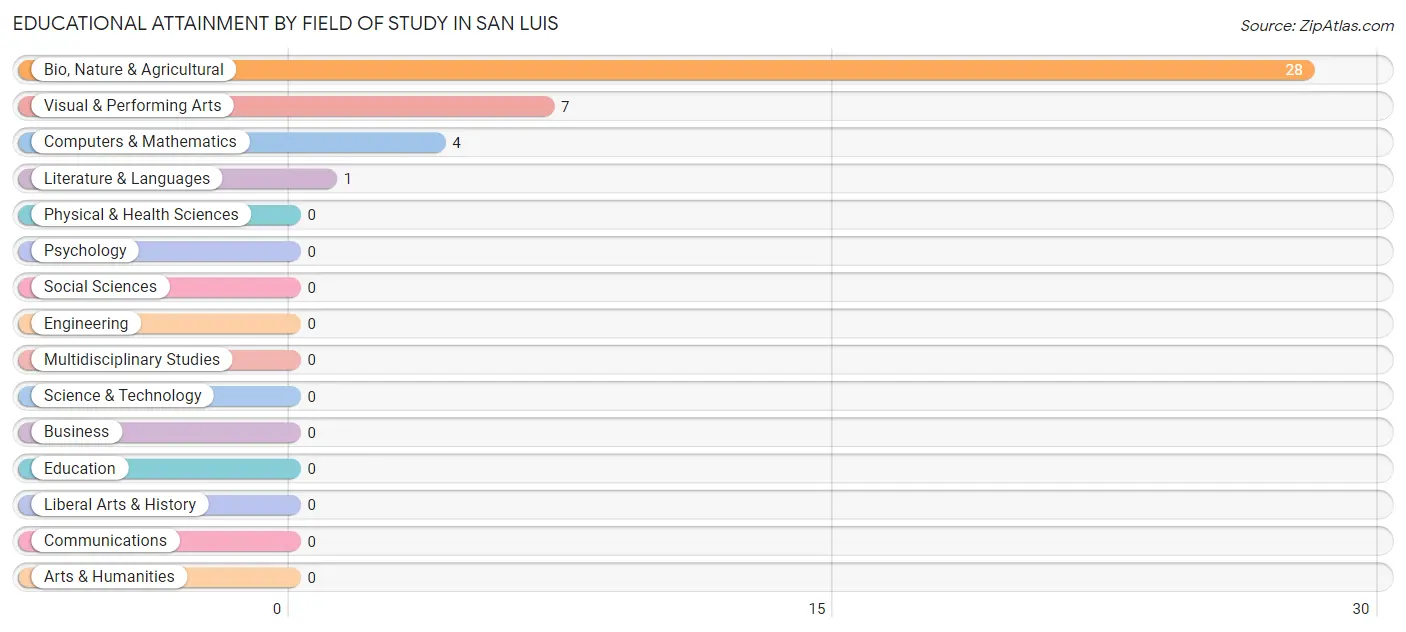
| Field of Study | # Graduates | % Graduates |
| Computers & Mathematics | 4 | 10.0% |
| Bio, Nature & Agricultural | 28 | 70.0% |
| Physical & Health Sciences | 0 | 0.0% |
| Psychology | 0 | 0.0% |
| Social Sciences | 0 | 0.0% |
| Engineering | 0 | 0.0% |
| Multidisciplinary Studies | 0 | 0.0% |
| Science & Technology | 0 | 0.0% |
| Business | 0 | 0.0% |
| Education | 0 | 0.0% |
| Literature & Languages | 1 | 2.5% |
| Liberal Arts & History | 0 | 0.0% |
| Visual & Performing Arts | 7 | 17.5% |
| Communications | 0 | 0.0% |
| Arts & Humanities | 0 | 0.0% |
| Total | 40 | 100.0% |
Transportation & Commute in San Luis
Vehicle Availability by Sex in San Luis
The most prevalent vehicle ownership categories in San Luis are males with 2 vehicles (31, accounting for 31.6%) and females with 2 vehicles (37, making up 23.5%).
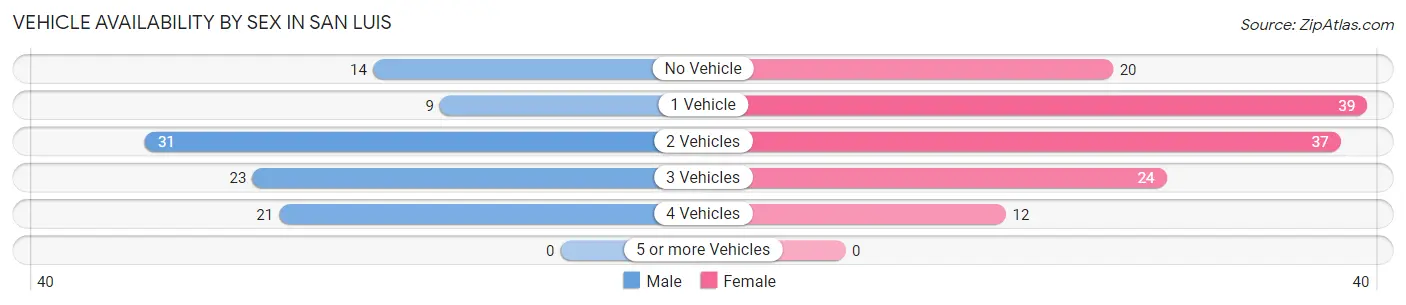
| Vehicles Available | Male | Female |
| No Vehicle | 14 (14.3%) | 20 (15.1%) |
| 1 Vehicle | 9 (9.2%) | 39 (29.5%) |
| 2 Vehicles | 31 (31.6%) | 37 (28.0%) |
| 3 Vehicles | 23 (23.5%) | 24 (18.2%) |
| 4 Vehicles | 21 (21.4%) | 12 (9.1%) |
| 5 or more Vehicles | 0 (0.0%) | 0 (0.0%) |
| Total | 98 (100.0%) | 132 (100.0%) |
Commute Time in San Luis
The most frequently occuring commute durations in San Luis are 5 to 9 minutes (54 commuters, 25.0%), 45 to 59 minutes (47 commuters, 21.8%), and 15 to 19 minutes (33 commuters, 15.3%).
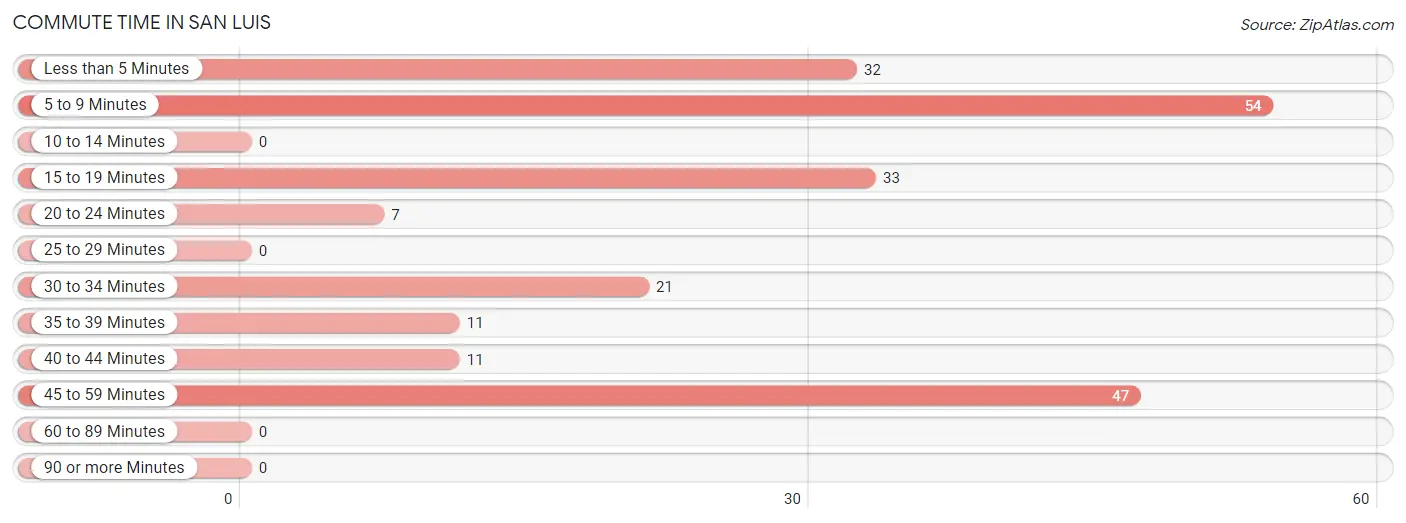
| Commute Time | # Commuters | % Commuters |
| Less than 5 Minutes | 32 | 14.8% |
| 5 to 9 Minutes | 54 | 25.0% |
| 10 to 14 Minutes | 0 | 0.0% |
| 15 to 19 Minutes | 33 | 15.3% |
| 20 to 24 Minutes | 7 | 3.2% |
| 25 to 29 Minutes | 0 | 0.0% |
| 30 to 34 Minutes | 21 | 9.7% |
| 35 to 39 Minutes | 11 | 5.1% |
| 40 to 44 Minutes | 11 | 5.1% |
| 45 to 59 Minutes | 47 | 21.8% |
| 60 to 89 Minutes | 0 | 0.0% |
| 90 or more Minutes | 0 | 0.0% |
Commute Time by Sex in San Luis
The most common commute times in San Luis are 30 to 34 minutes (21 commuters, 25.0%) for males and 45 to 59 minutes (37 commuters, 28.0%) for females.
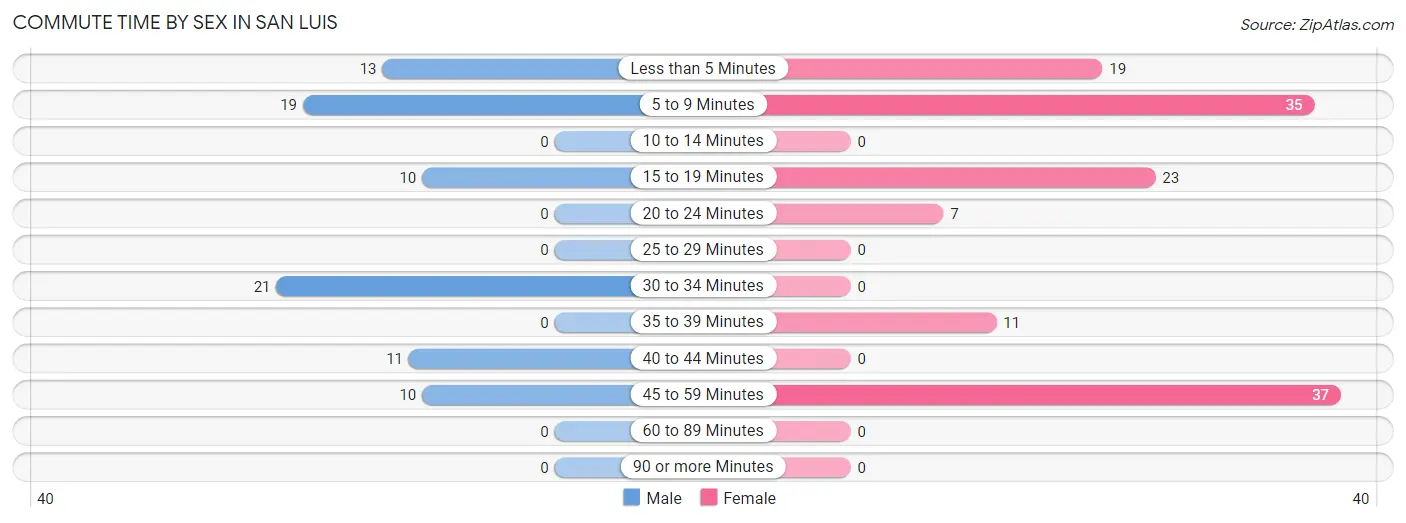
| Commute Time | Male | Female |
| Less than 5 Minutes | 13 (15.5%) | 19 (14.4%) |
| 5 to 9 Minutes | 19 (22.6%) | 35 (26.5%) |
| 10 to 14 Minutes | 0 (0.0%) | 0 (0.0%) |
| 15 to 19 Minutes | 10 (11.9%) | 23 (17.4%) |
| 20 to 24 Minutes | 0 (0.0%) | 7 (5.3%) |
| 25 to 29 Minutes | 0 (0.0%) | 0 (0.0%) |
| 30 to 34 Minutes | 21 (25.0%) | 0 (0.0%) |
| 35 to 39 Minutes | 0 (0.0%) | 11 (8.3%) |
| 40 to 44 Minutes | 11 (13.1%) | 0 (0.0%) |
| 45 to 59 Minutes | 10 (11.9%) | 37 (28.0%) |
| 60 to 89 Minutes | 0 (0.0%) | 0 (0.0%) |
| 90 or more Minutes | 0 (0.0%) | 0 (0.0%) |
Time of Departure to Work by Sex in San Luis
The most frequent times of departure to work in San Luis are 6:30 AM to 6:59 AM (26, 30.9%) for males and 7:00 AM to 7:29 AM (56, 42.4%) for females.
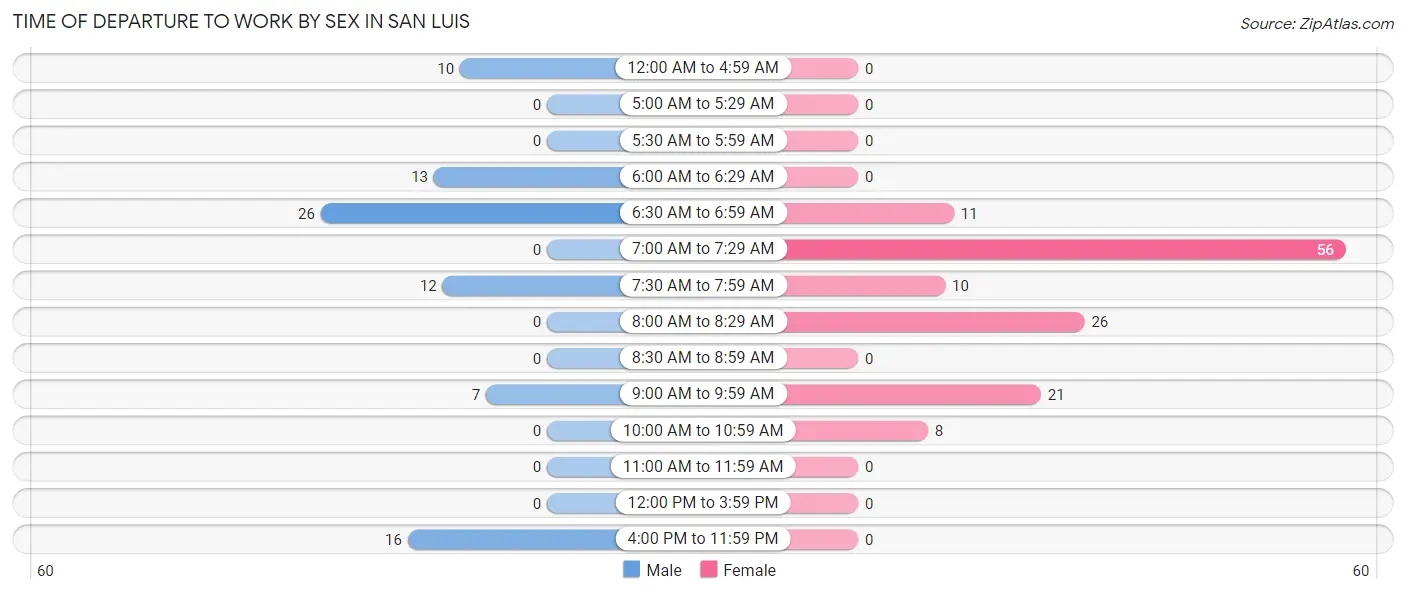
| Time of Departure | Male | Female |
| 12:00 AM to 4:59 AM | 10 (11.9%) | 0 (0.0%) |
| 5:00 AM to 5:29 AM | 0 (0.0%) | 0 (0.0%) |
| 5:30 AM to 5:59 AM | 0 (0.0%) | 0 (0.0%) |
| 6:00 AM to 6:29 AM | 13 (15.5%) | 0 (0.0%) |
| 6:30 AM to 6:59 AM | 26 (30.9%) | 11 (8.3%) |
| 7:00 AM to 7:29 AM | 0 (0.0%) | 56 (42.4%) |
| 7:30 AM to 7:59 AM | 12 (14.3%) | 10 (7.6%) |
| 8:00 AM to 8:29 AM | 0 (0.0%) | 26 (19.7%) |
| 8:30 AM to 8:59 AM | 0 (0.0%) | 0 (0.0%) |
| 9:00 AM to 9:59 AM | 7 (8.3%) | 21 (15.9%) |
| 10:00 AM to 10:59 AM | 0 (0.0%) | 8 (6.1%) |
| 11:00 AM to 11:59 AM | 0 (0.0%) | 0 (0.0%) |
| 12:00 PM to 3:59 PM | 0 (0.0%) | 0 (0.0%) |
| 4:00 PM to 11:59 PM | 16 (19.1%) | 0 (0.0%) |
| Total | 84 (100.0%) | 132 (100.0%) |
Housing Occupancy in San Luis
Occupancy by Ownership in San Luis
Of the total 276 dwellings in San Luis, owner-occupied units account for 148 (53.6%), while renter-occupied units make up 128 (46.4%).
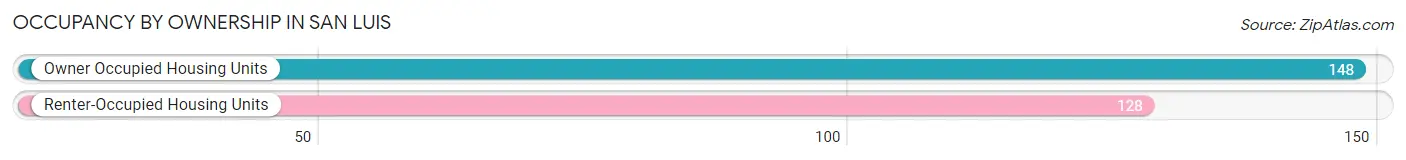
| Occupancy | # Housing Units | % Housing Units |
| Owner Occupied Housing Units | 148 | 53.6% |
| Renter-Occupied Housing Units | 128 | 46.4% |
| Total Occupied Housing Units | 276 | 100.0% |
Occupancy by Household Size in San Luis
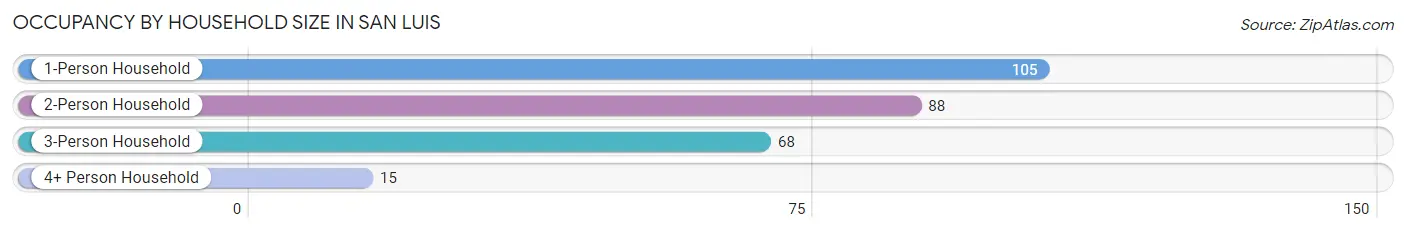
| Household Size | # Housing Units | % Housing Units |
| 1-Person Household | 105 | 38.0% |
| 2-Person Household | 88 | 31.9% |
| 3-Person Household | 68 | 24.6% |
| 4+ Person Household | 15 | 5.4% |
| Total Housing Units | 276 | 100.0% |
Occupancy by Ownership by Household Size in San Luis
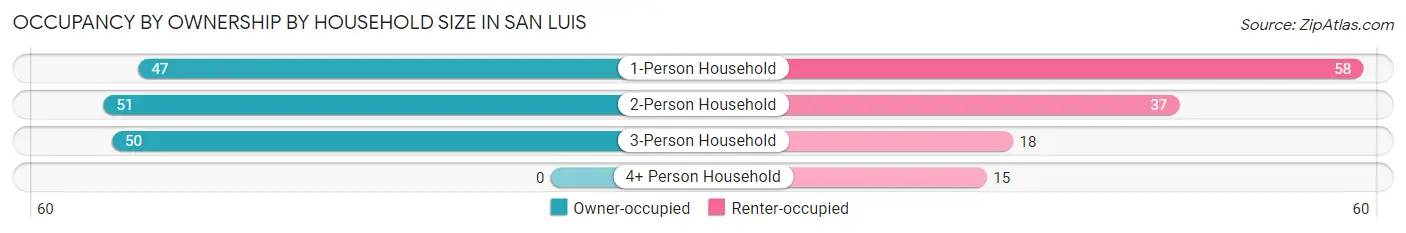
| Household Size | Owner-occupied | Renter-occupied |
| 1-Person Household | 47 (44.8%) | 58 (55.2%) |
| 2-Person Household | 51 (58.0%) | 37 (42.0%) |
| 3-Person Household | 50 (73.5%) | 18 (26.5%) |
| 4+ Person Household | 0 (0.0%) | 15 (100.0%) |
| Total Housing Units | 148 (53.6%) | 128 (46.4%) |
Occupancy by Educational Attainment in San Luis
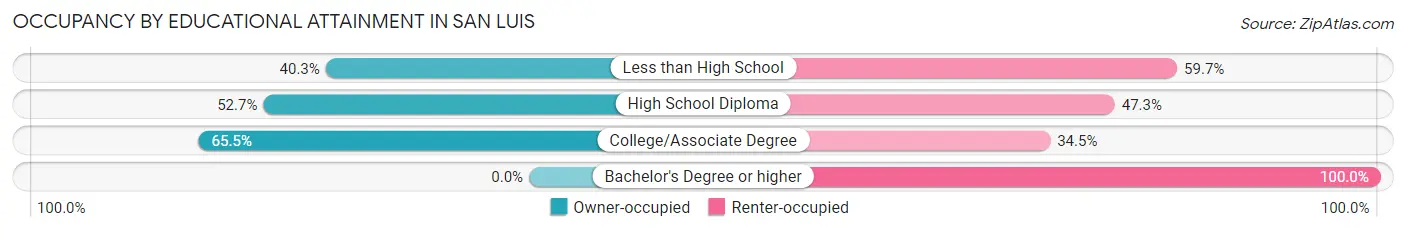
| Household Size | Owner-occupied | Renter-occupied |
| Less than High School | 25 (40.3%) | 37 (59.7%) |
| High School Diploma | 49 (52.7%) | 44 (47.3%) |
| College/Associate Degree | 74 (65.5%) | 39 (34.5%) |
| Bachelor's Degree or higher | 0 (0.0%) | 8 (100.0%) |
Occupancy by Age of Householder in San Luis
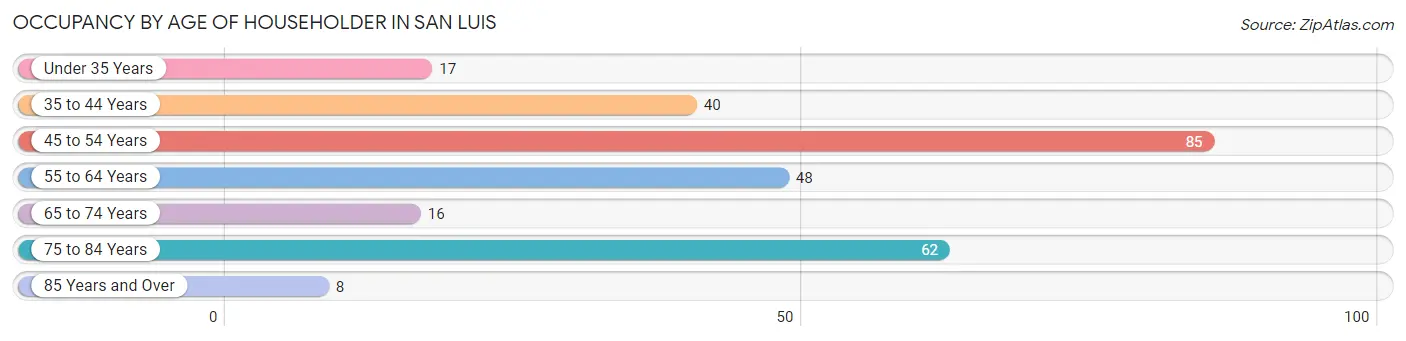
| Age Bracket | # Households | % Households |
| Under 35 Years | 17 | 6.2% |
| 35 to 44 Years | 40 | 14.5% |
| 45 to 54 Years | 85 | 30.8% |
| 55 to 64 Years | 48 | 17.4% |
| 65 to 74 Years | 16 | 5.8% |
| 75 to 84 Years | 62 | 22.5% |
| 85 Years and Over | 8 | 2.9% |
| Total | 276 | 100.0% |
Housing Finances in San Luis
Median Income by Occupancy in San Luis
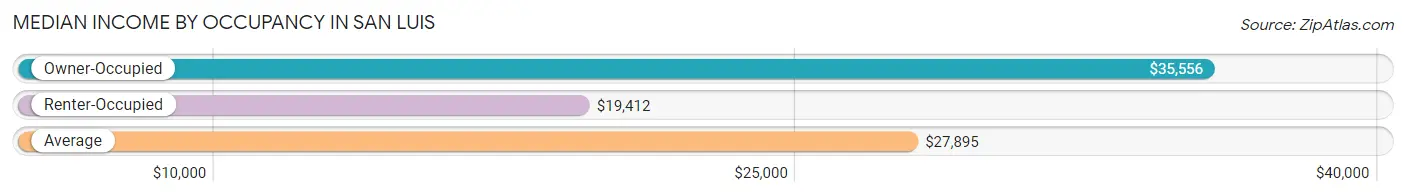
| Occupancy Type | # Households | Median Income |
| Owner-Occupied | 148 (53.6%) | $35,556 |
| Renter-Occupied | 128 (46.4%) | $19,412 |
| Average | 276 (100.0%) | $27,895 |
Occupancy by Householder Income Bracket in San Luis
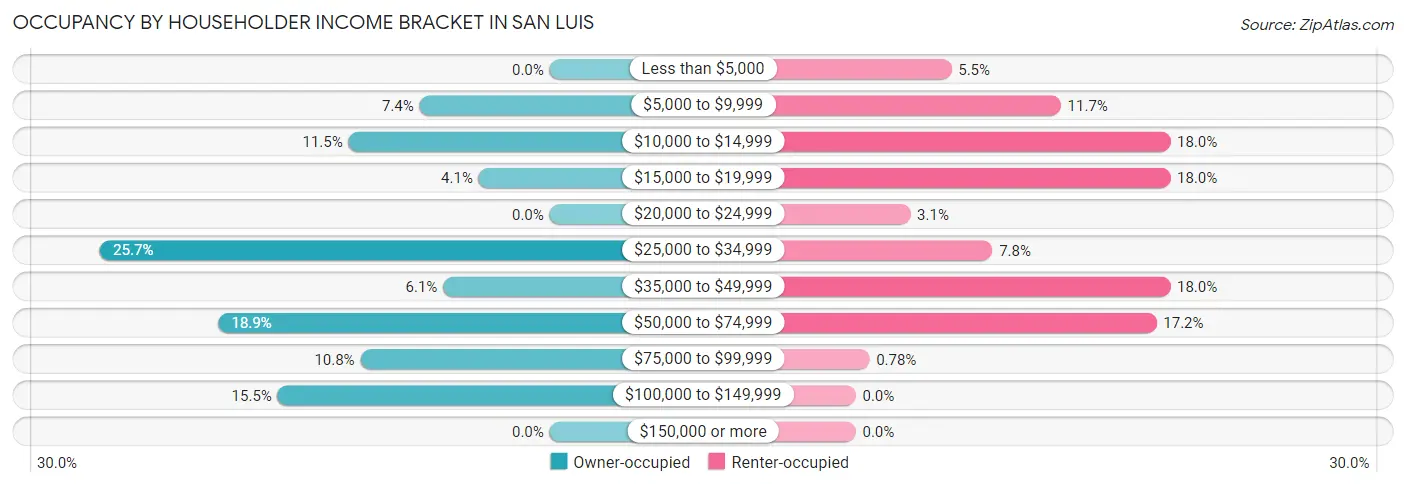
| Income Bracket | Owner-occupied | Renter-occupied |
| Less than $5,000 | 0 (0.0%) | 7 (5.5%) |
| $5,000 to $9,999 | 11 (7.4%) | 15 (11.7%) |
| $10,000 to $14,999 | 17 (11.5%) | 23 (18.0%) |
| $15,000 to $19,999 | 6 (4.1%) | 23 (18.0%) |
| $20,000 to $24,999 | 0 (0.0%) | 4 (3.1%) |
| $25,000 to $34,999 | 38 (25.7%) | 10 (7.8%) |
| $35,000 to $49,999 | 9 (6.1%) | 23 (18.0%) |
| $50,000 to $74,999 | 28 (18.9%) | 22 (17.2%) |
| $75,000 to $99,999 | 16 (10.8%) | 1 (0.8%) |
| $100,000 to $149,999 | 23 (15.5%) | 0 (0.0%) |
| $150,000 or more | 0 (0.0%) | 0 (0.0%) |
| Total | 148 (100.0%) | 128 (100.0%) |
Monthly Housing Cost Tiers in San Luis
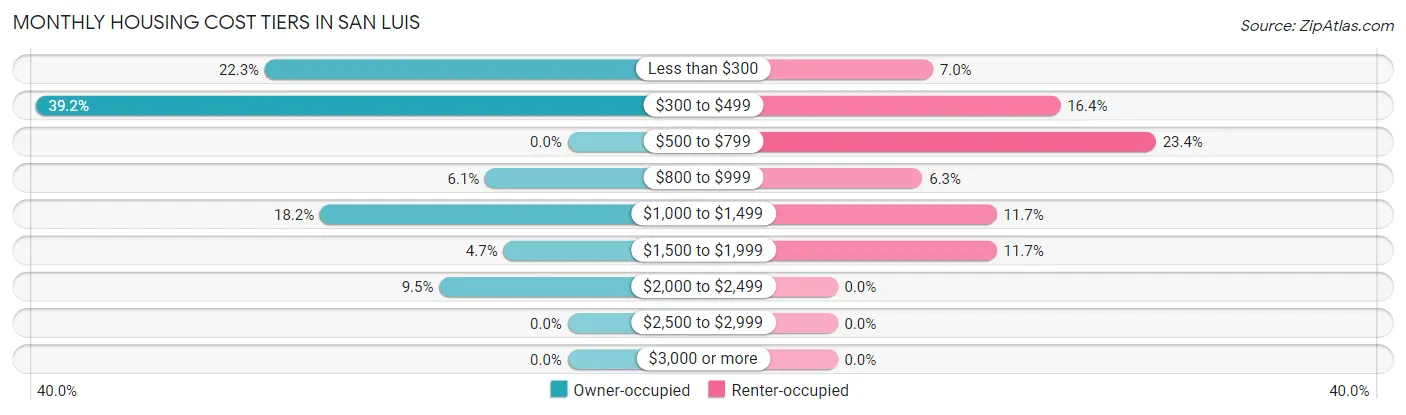
| Monthly Cost | Owner-occupied | Renter-occupied |
| Less than $300 | 33 (22.3%) | 9 (7.0%) |
| $300 to $499 | 58 (39.2%) | 21 (16.4%) |
| $500 to $799 | 0 (0.0%) | 30 (23.4%) |
| $800 to $999 | 9 (6.1%) | 8 (6.2%) |
| $1,000 to $1,499 | 27 (18.2%) | 15 (11.7%) |
| $1,500 to $1,999 | 7 (4.7%) | 15 (11.7%) |
| $2,000 to $2,499 | 14 (9.5%) | 0 (0.0%) |
| $2,500 to $2,999 | 0 (0.0%) | 0 (0.0%) |
| $3,000 or more | 0 (0.0%) | 0 (0.0%) |
| Total | 148 (100.0%) | 128 (100.0%) |
Physical Housing Characteristics in San Luis
Housing Structures in San Luis
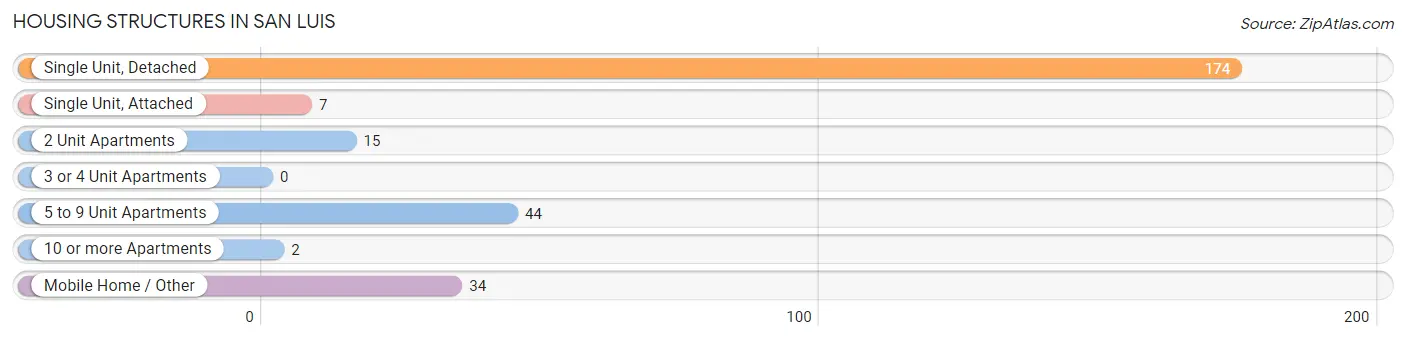
| Structure Type | # Housing Units | % Housing Units |
| Single Unit, Detached | 174 | 63.0% |
| Single Unit, Attached | 7 | 2.5% |
| 2 Unit Apartments | 15 | 5.4% |
| 3 or 4 Unit Apartments | 0 | 0.0% |
| 5 to 9 Unit Apartments | 44 | 15.9% |
| 10 or more Apartments | 2 | 0.7% |
| Mobile Home / Other | 34 | 12.3% |
| Total | 276 | 100.0% |
Housing Structures by Occupancy in San Luis
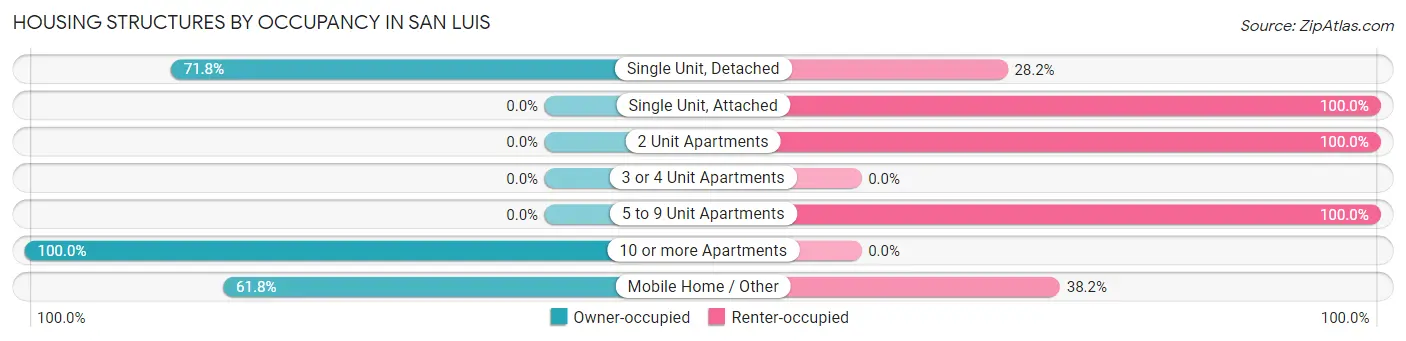
| Structure Type | Owner-occupied | Renter-occupied |
| Single Unit, Detached | 125 (71.8%) | 49 (28.2%) |
| Single Unit, Attached | 0 (0.0%) | 7 (100.0%) |
| 2 Unit Apartments | 0 (0.0%) | 15 (100.0%) |
| 3 or 4 Unit Apartments | 0 (0.0%) | 0 (0.0%) |
| 5 to 9 Unit Apartments | 0 (0.0%) | 44 (100.0%) |
| 10 or more Apartments | 2 (100.0%) | 0 (0.0%) |
| Mobile Home / Other | 21 (61.8%) | 13 (38.2%) |
| Total | 148 (53.6%) | 128 (46.4%) |
Housing Structures by Number of Rooms in San Luis
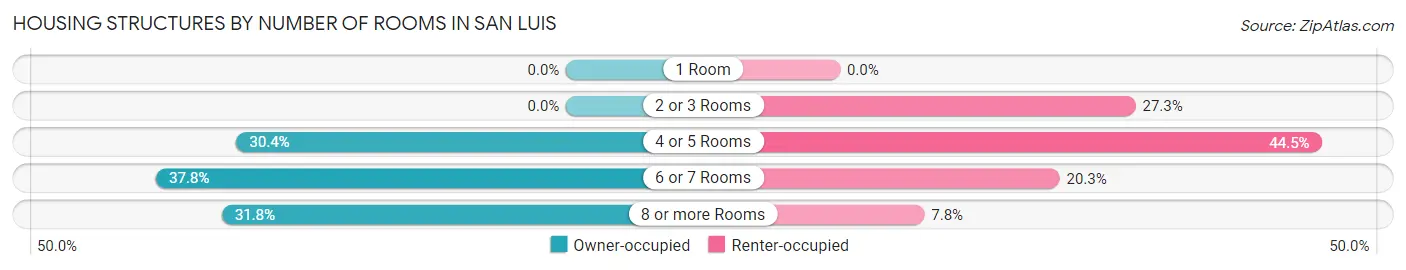
| Number of Rooms | Owner-occupied | Renter-occupied |
| 1 Room | 0 (0.0%) | 0 (0.0%) |
| 2 or 3 Rooms | 0 (0.0%) | 35 (27.3%) |
| 4 or 5 Rooms | 45 (30.4%) | 57 (44.5%) |
| 6 or 7 Rooms | 56 (37.8%) | 26 (20.3%) |
| 8 or more Rooms | 47 (31.8%) | 10 (7.8%) |
| Total | 148 (100.0%) | 128 (100.0%) |
Housing Structure by Heating Type in San Luis
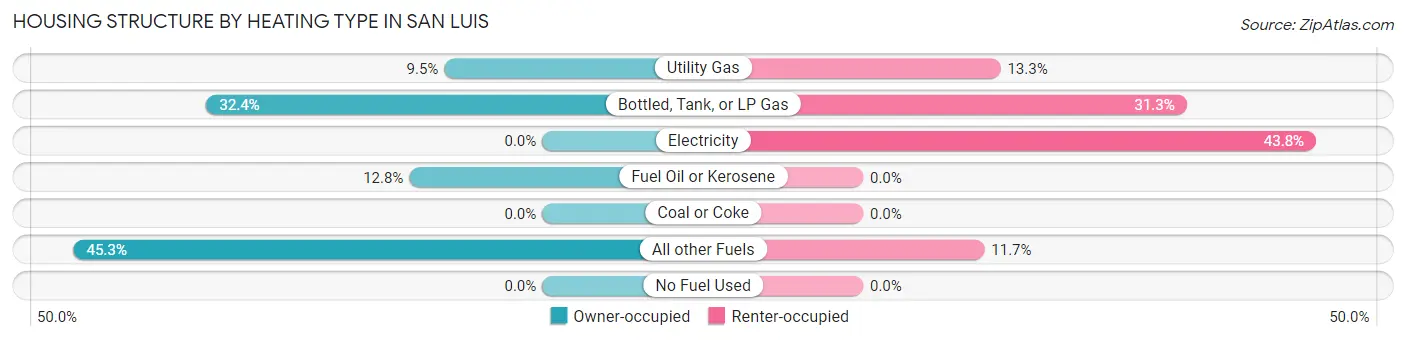
| Heating Type | Owner-occupied | Renter-occupied |
| Utility Gas | 14 (9.5%) | 17 (13.3%) |
| Bottled, Tank, or LP Gas | 48 (32.4%) | 40 (31.2%) |
| Electricity | 0 (0.0%) | 56 (43.8%) |
| Fuel Oil or Kerosene | 19 (12.8%) | 0 (0.0%) |
| Coal or Coke | 0 (0.0%) | 0 (0.0%) |
| All other Fuels | 67 (45.3%) | 15 (11.7%) |
| No Fuel Used | 0 (0.0%) | 0 (0.0%) |
| Total | 148 (100.0%) | 128 (100.0%) |
Household Vehicle Usage in San Luis
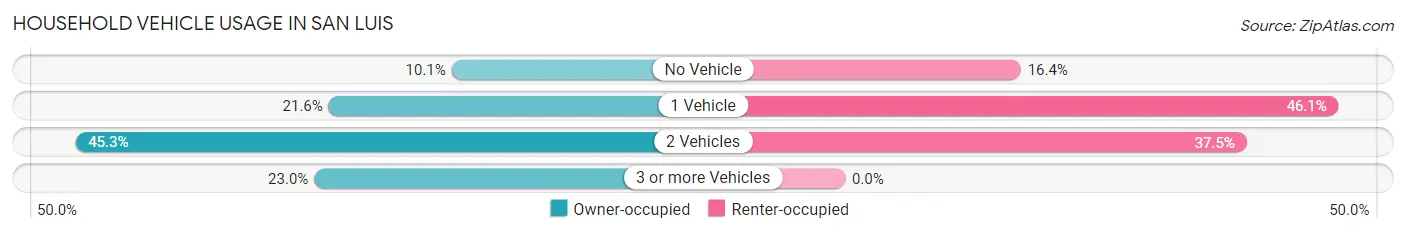
| Vehicles per Household | Owner-occupied | Renter-occupied |
| No Vehicle | 15 (10.1%) | 21 (16.4%) |
| 1 Vehicle | 32 (21.6%) | 59 (46.1%) |
| 2 Vehicles | 67 (45.3%) | 48 (37.5%) |
| 3 or more Vehicles | 34 (23.0%) | 0 (0.0%) |
| Total | 148 (100.0%) | 128 (100.0%) |
Real Estate & Mortgages in San Luis
Real Estate and Mortgage Overview in San Luis
| Characteristic | Without Mortgage | With Mortgage |
| Housing Units | 83 | 65 |
| Median Property Value | $99,100 | $122,200 |
| Median Household Income | $28,472 | $0 |
| Monthly Housing Costs | $368 | $0 |
| Real Estate Taxes | $398 | $0 |
Property Value by Mortgage Status in San Luis
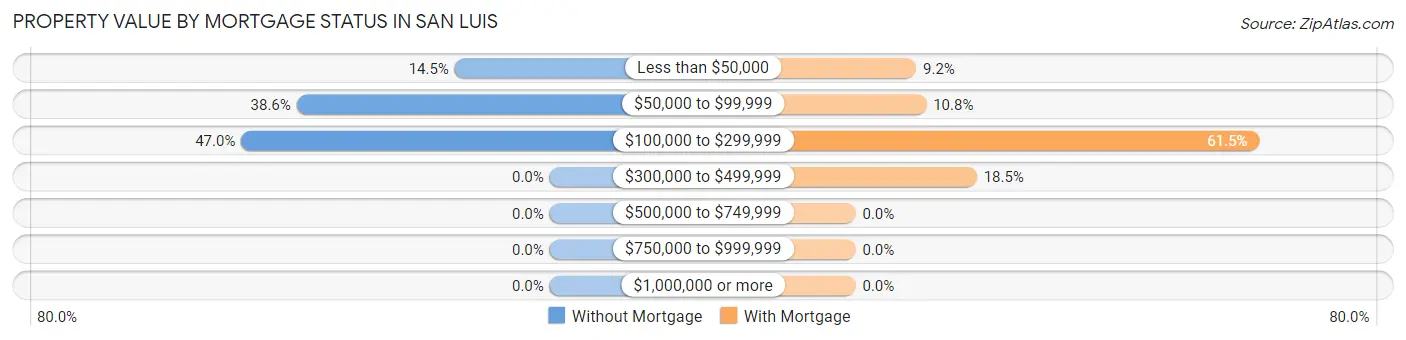
| Property Value | Without Mortgage | With Mortgage |
| Less than $50,000 | 12 (14.5%) | 6 (9.2%) |
| $50,000 to $99,999 | 32 (38.6%) | 7 (10.8%) |
| $100,000 to $299,999 | 39 (47.0%) | 40 (61.5%) |
| $300,000 to $499,999 | 0 (0.0%) | 12 (18.5%) |
| $500,000 to $749,999 | 0 (0.0%) | 0 (0.0%) |
| $750,000 to $999,999 | 0 (0.0%) | 0 (0.0%) |
| $1,000,000 or more | 0 (0.0%) | 0 (0.0%) |
| Total | 83 (100.0%) | 65 (100.0%) |
Household Income by Mortgage Status in San Luis
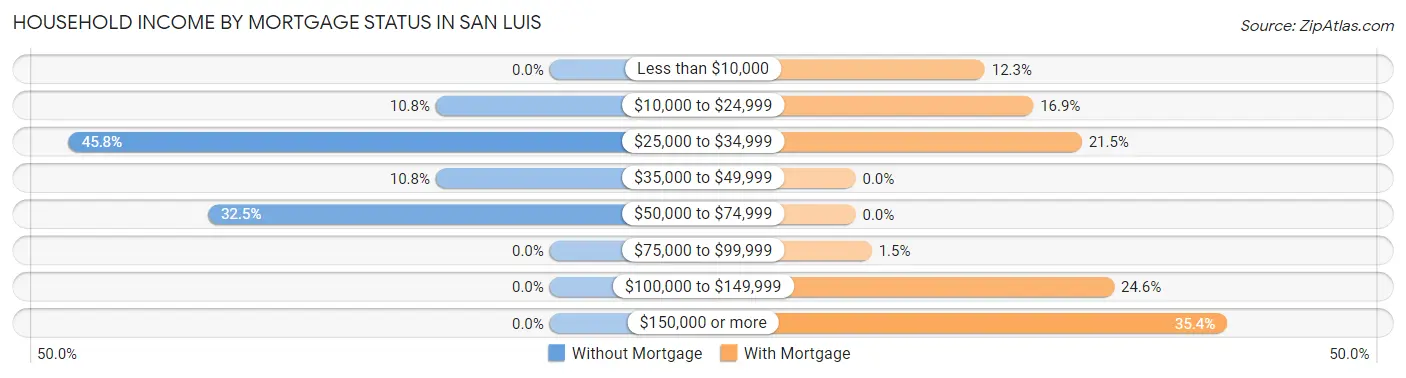
| Household Income | Without Mortgage | With Mortgage |
| Less than $10,000 | 0 (0.0%) | 8 (12.3%) |
| $10,000 to $24,999 | 9 (10.8%) | 11 (16.9%) |
| $25,000 to $34,999 | 38 (45.8%) | 14 (21.5%) |
| $35,000 to $49,999 | 9 (10.8%) | 0 (0.0%) |
| $50,000 to $74,999 | 27 (32.5%) | 0 (0.0%) |
| $75,000 to $99,999 | 0 (0.0%) | 1 (1.5%) |
| $100,000 to $149,999 | 0 (0.0%) | 16 (24.6%) |
| $150,000 or more | 0 (0.0%) | 23 (35.4%) |
| Total | 83 (100.0%) | 65 (100.0%) |
Property Value to Household Income Ratio in San Luis
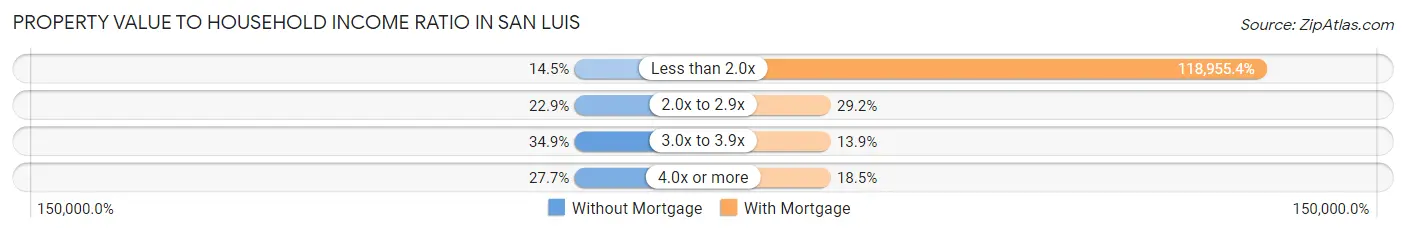
| Value-to-Income Ratio | Without Mortgage | With Mortgage |
| Less than 2.0x | 12 (14.5%) | 77,321 (118,955.4%) |
| 2.0x to 2.9x | 19 (22.9%) | 19 (29.2%) |
| 3.0x to 3.9x | 29 (34.9%) | 9 (13.9%) |
| 4.0x or more | 23 (27.7%) | 12 (18.5%) |
| Total | 83 (100.0%) | 65 (100.0%) |
Real Estate Taxes by Mortgage Status in San Luis
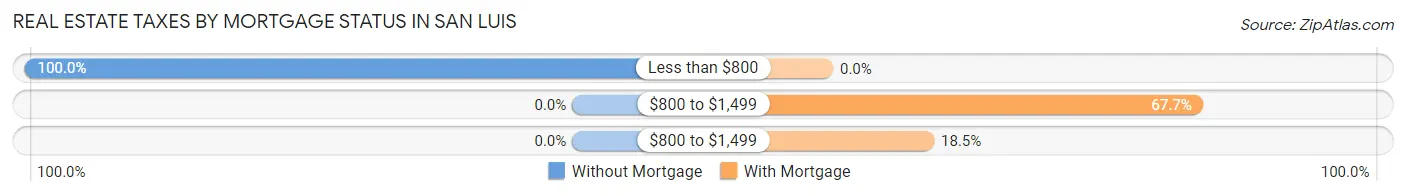
| Property Taxes | Without Mortgage | With Mortgage |
| Less than $800 | 83 (100.0%) | 0 (0.0%) |
| $800 to $1,499 | 0 (0.0%) | 44 (67.7%) |
| $800 to $1,499 | 0 (0.0%) | 12 (18.5%) |
| Total | 83 (100.0%) | 65 (100.0%) |
Health & Disability in San Luis
Health Insurance Coverage by Age in San Luis
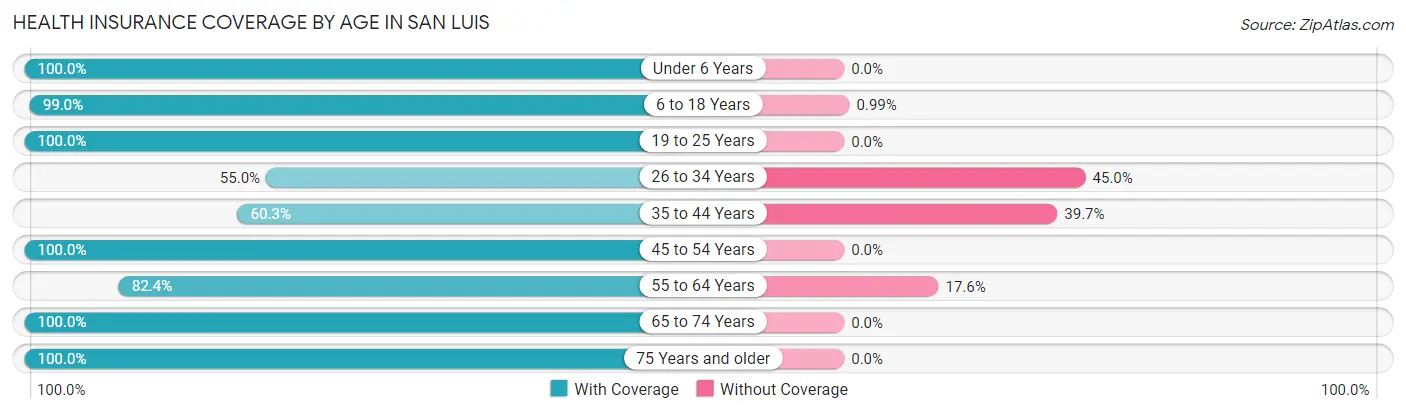
| Age Bracket | With Coverage | Without Coverage |
| Under 6 Years | 28 (100.0%) | 0 (0.0%) |
| 6 to 18 Years | 100 (99.0%) | 1 (1.0%) |
| 19 to 25 Years | 43 (100.0%) | 0 (0.0%) |
| 26 to 34 Years | 22 (55.0%) | 18 (45.0%) |
| 35 to 44 Years | 44 (60.3%) | 29 (39.7%) |
| 45 to 54 Years | 103 (100.0%) | 0 (0.0%) |
| 55 to 64 Years | 61 (82.4%) | 13 (17.6%) |
| 65 to 74 Years | 42 (100.0%) | 0 (0.0%) |
| 75 Years and older | 80 (100.0%) | 0 (0.0%) |
| Total | 523 (89.5%) | 61 (10.4%) |
Health Insurance Coverage by Citizenship Status in San Luis
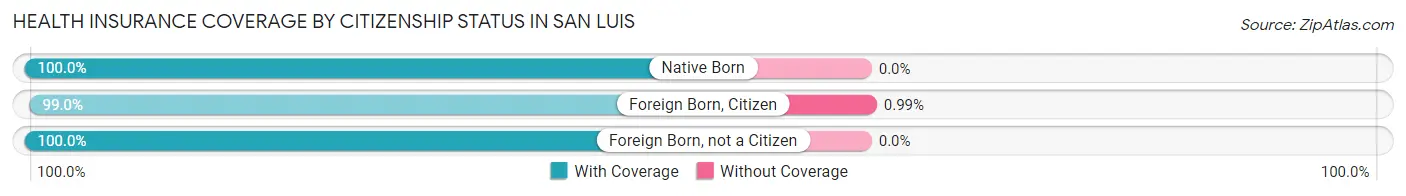
| Citizenship Status | With Coverage | Without Coverage |
| Native Born | 28 (100.0%) | 0 (0.0%) |
| Foreign Born, Citizen | 100 (99.0%) | 1 (1.0%) |
| Foreign Born, not a Citizen | 43 (100.0%) | 0 (0.0%) |
Health Insurance Coverage by Household Income in San Luis
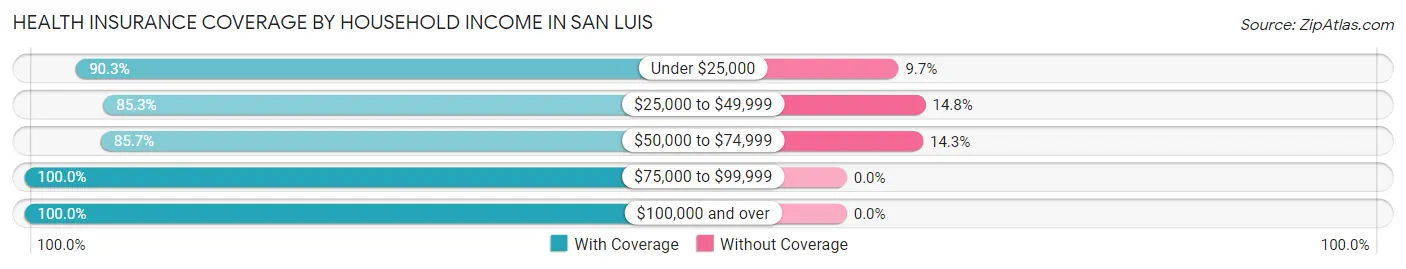
| Household Income | With Coverage | Without Coverage |
| Under $25,000 | 140 (90.3%) | 15 (9.7%) |
| $25,000 to $49,999 | 185 (85.3%) | 32 (14.7%) |
| $50,000 to $74,999 | 84 (85.7%) | 14 (14.3%) |
| $75,000 to $99,999 | 52 (100.0%) | 0 (0.0%) |
| $100,000 and over | 62 (100.0%) | 0 (0.0%) |
Public vs Private Health Insurance Coverage by Age in San Luis
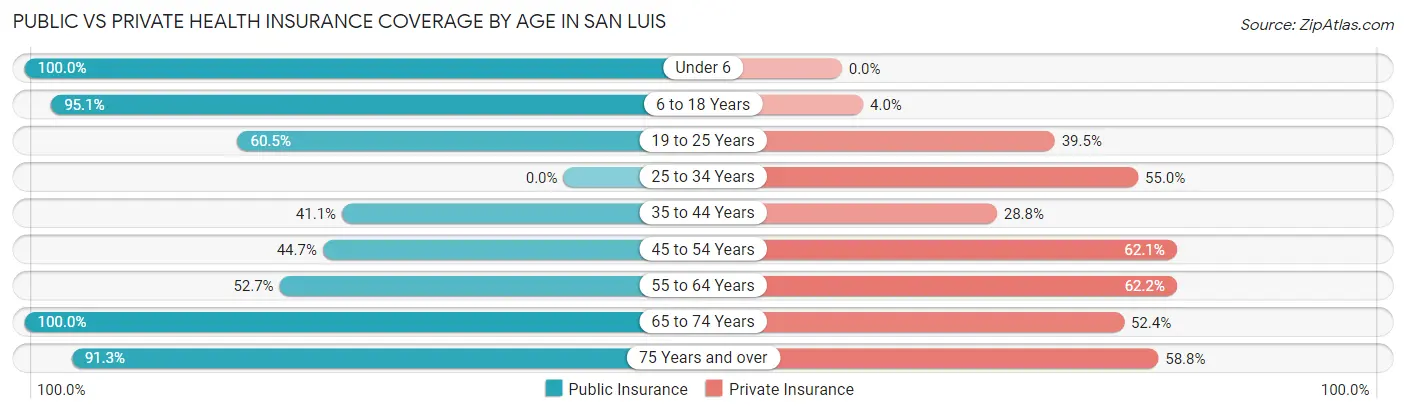
| Age Bracket | Public Insurance | Private Insurance |
| Under 6 | 28 (100.0%) | 0 (0.0%) |
| 6 to 18 Years | 96 (95.1%) | 4 (4.0%) |
| 19 to 25 Years | 26 (60.5%) | 17 (39.5%) |
| 25 to 34 Years | 0 (0.0%) | 22 (55.0%) |
| 35 to 44 Years | 30 (41.1%) | 21 (28.8%) |
| 45 to 54 Years | 46 (44.7%) | 64 (62.1%) |
| 55 to 64 Years | 39 (52.7%) | 46 (62.2%) |
| 65 to 74 Years | 42 (100.0%) | 22 (52.4%) |
| 75 Years and over | 73 (91.2%) | 47 (58.8%) |
| Total | 380 (65.1%) | 243 (41.6%) |
Disability Status by Sex by Age in San Luis
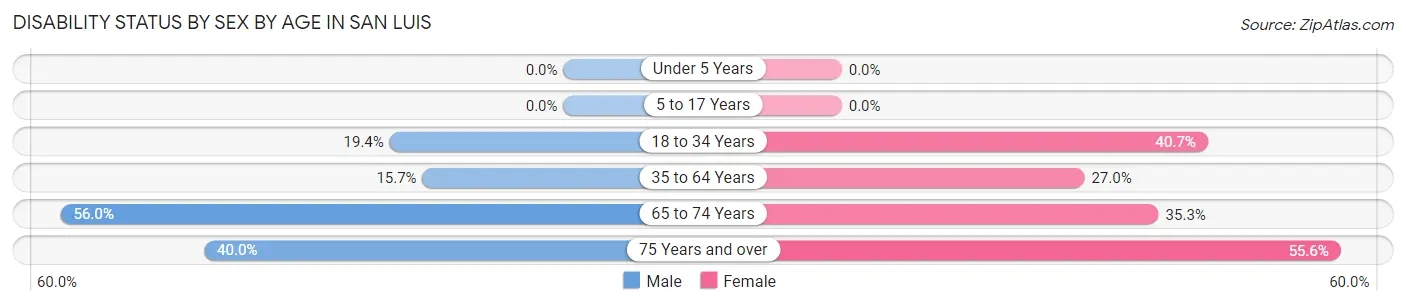
| Age Bracket | Male | Female |
| Under 5 Years | 0 (0.0%) | 0 (0.0%) |
| 5 to 17 Years | 0 (0.0%) | 0 (0.0%) |
| 18 to 34 Years | 12 (19.4%) | 11 (40.7%) |
| 35 to 64 Years | 16 (15.7%) | 40 (27.0%) |
| 65 to 74 Years | 14 (56.0%) | 6 (35.3%) |
| 75 Years and over | 14 (40.0%) | 25 (55.6%) |
Disability Class by Sex by Age in San Luis
Disability Class: Hearing Difficulty
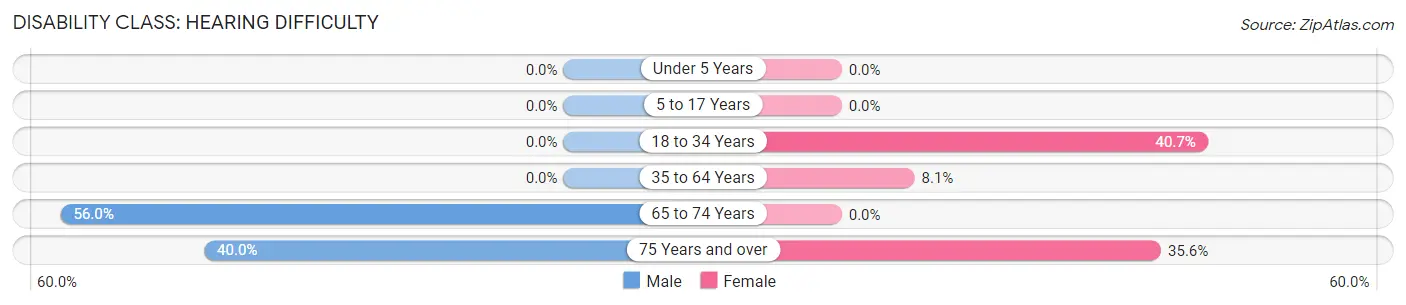
| Age Bracket | Male | Female |
| Under 5 Years | 0 (0.0%) | 0 (0.0%) |
| 5 to 17 Years | 0 (0.0%) | 0 (0.0%) |
| 18 to 34 Years | 0 (0.0%) | 11 (40.7%) |
| 35 to 64 Years | 0 (0.0%) | 12 (8.1%) |
| 65 to 74 Years | 14 (56.0%) | 0 (0.0%) |
| 75 Years and over | 14 (40.0%) | 16 (35.6%) |
Disability Class: Vision Difficulty
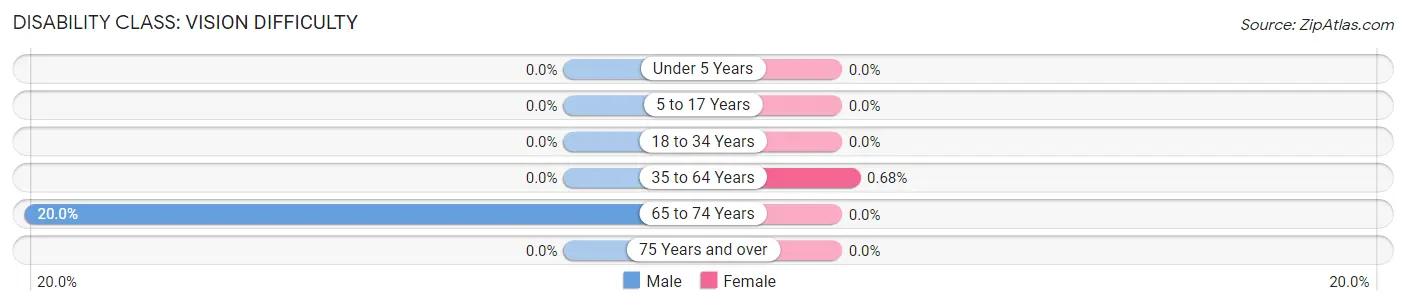
| Age Bracket | Male | Female |
| Under 5 Years | 0 (0.0%) | 0 (0.0%) |
| 5 to 17 Years | 0 (0.0%) | 0 (0.0%) |
| 18 to 34 Years | 0 (0.0%) | 0 (0.0%) |
| 35 to 64 Years | 0 (0.0%) | 1 (0.7%) |
| 65 to 74 Years | 5 (20.0%) | 0 (0.0%) |
| 75 Years and over | 0 (0.0%) | 0 (0.0%) |
Disability Class: Cognitive Difficulty
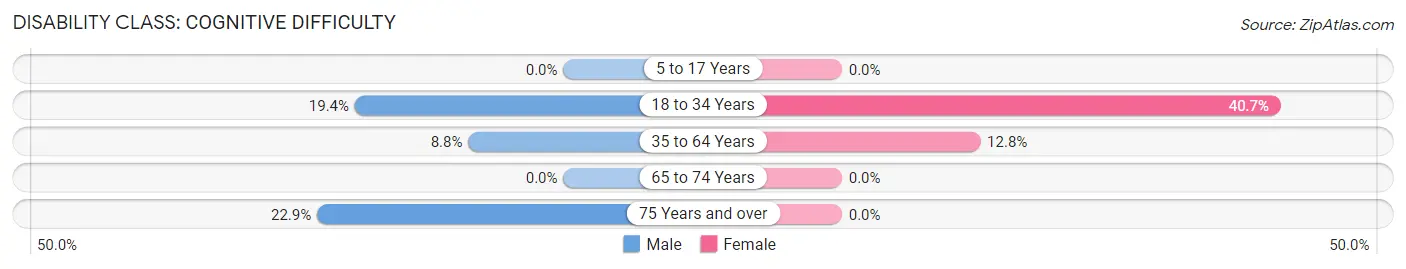
| Age Bracket | Male | Female |
| 5 to 17 Years | 0 (0.0%) | 0 (0.0%) |
| 18 to 34 Years | 12 (19.4%) | 11 (40.7%) |
| 35 to 64 Years | 9 (8.8%) | 19 (12.8%) |
| 65 to 74 Years | 0 (0.0%) | 0 (0.0%) |
| 75 Years and over | 8 (22.9%) | 0 (0.0%) |
Disability Class: Ambulatory Difficulty
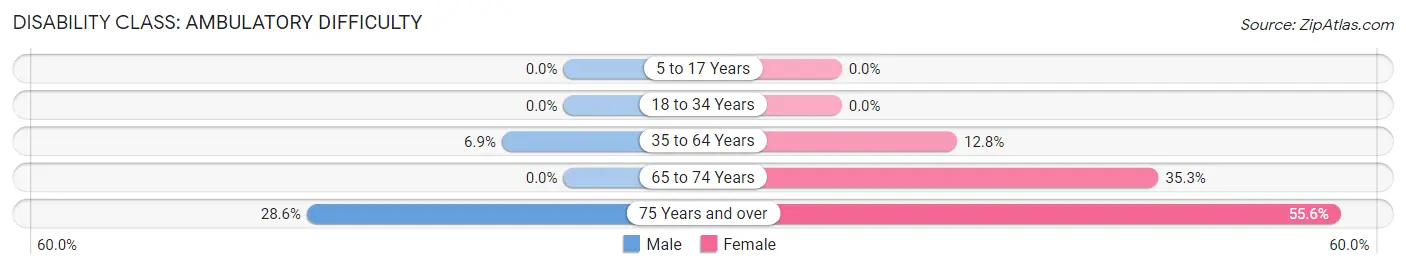
| Age Bracket | Male | Female |
| 5 to 17 Years | 0 (0.0%) | 0 (0.0%) |
| 18 to 34 Years | 0 (0.0%) | 0 (0.0%) |
| 35 to 64 Years | 7 (6.9%) | 19 (12.8%) |
| 65 to 74 Years | 0 (0.0%) | 6 (35.3%) |
| 75 Years and over | 10 (28.6%) | 25 (55.6%) |
Disability Class: Self-Care Difficulty
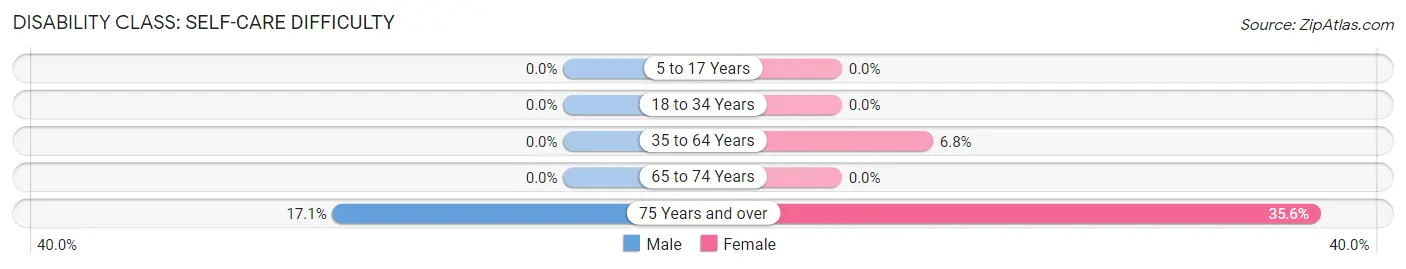
| Age Bracket | Male | Female |
| 5 to 17 Years | 0 (0.0%) | 0 (0.0%) |
| 18 to 34 Years | 0 (0.0%) | 0 (0.0%) |
| 35 to 64 Years | 0 (0.0%) | 10 (6.8%) |
| 65 to 74 Years | 0 (0.0%) | 0 (0.0%) |
| 75 Years and over | 6 (17.1%) | 16 (35.6%) |
Technology Access in San Luis
Computing Device Access in San Luis
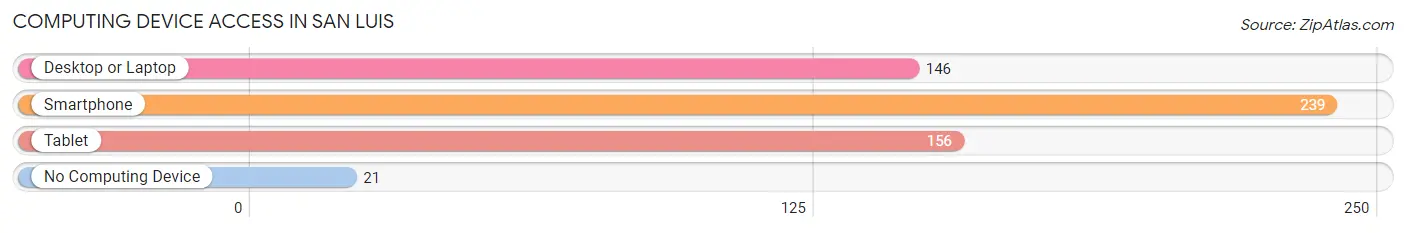
| Device Type | # Households | % Households |
| Desktop or Laptop | 146 | 52.9% |
| Smartphone | 239 | 86.6% |
| Tablet | 156 | 56.5% |
| No Computing Device | 21 | 7.6% |
| Total | 276 | 100.0% |
Internet Access in San Luis
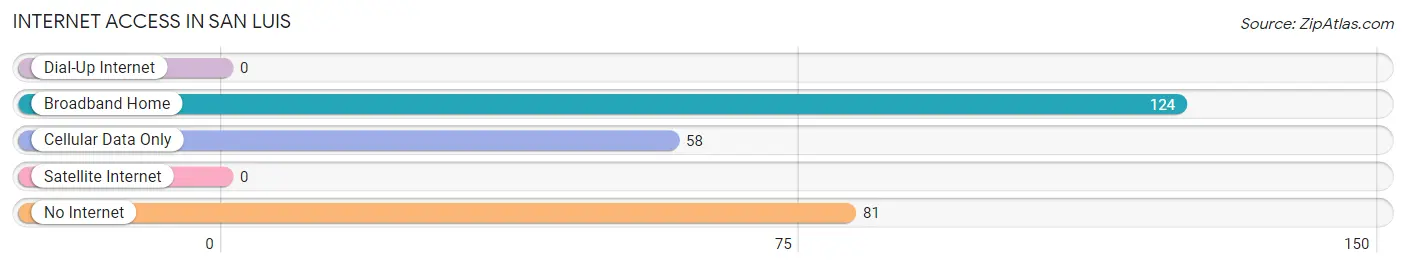
| Internet Type | # Households | % Households |
| Dial-Up Internet | 0 | 0.0% |
| Broadband Home | 124 | 44.9% |
| Cellular Data Only | 58 | 21.0% |
| Satellite Internet | 0 | 0.0% |
| No Internet | 81 | 29.3% |
| Total | 276 | 100.0% |
San Luis Summary
San Luis, Colorado is a small town located in the San Luis Valley in the south-central part of the state. It is the oldest town in Colorado, having been founded in 1851. The town is situated at an elevation of 7,619 feet and is surrounded by the Sangre de Cristo Mountains to the east and the San Juan Mountains to the west. The town is home to approximately 1,500 people and is the county seat of Costilla County.
History
San Luis was founded in 1851 by Mexican settlers who were attracted to the area by its fertile soil and abundant water supply. The town was originally named San Luis de la Culebra, after the nearby Culebra River. The town was the first permanent settlement in Colorado and was the first capital of the Colorado Territory.
In 1858, the town was renamed San Luis after the patron saint of the town, Saint Louis. The town was an important trading center for the region and was the site of the first post office in Colorado.
In the late 1800s, the town experienced a period of growth and prosperity due to the mining boom in the area. The town was home to several mines, including the San Luis Mine, which was the largest gold mine in the state.
Geography
San Luis is located in the San Luis Valley, which is a large intermontane basin located in south-central Colorado. The valley is surrounded by the Sangre de Cristo Mountains to the east and the San Juan Mountains to the west. The valley is home to several rivers, including the Rio Grande, the Culebra River, and the San Luis River.
The town is situated at an elevation of 7,619 feet and has a semi-arid climate, with hot summers and cold winters. The average annual precipitation is approximately 12 inches.
Economy
The economy of San Luis is largely based on agriculture and tourism. The town is home to several farms and ranches, which produce a variety of crops, including potatoes, alfalfa, and hay. The town is also home to several tourist attractions, including the San Luis Museum, the San Luis Valley Historical Society, and the San Luis Valley National Wildlife Refuge.
The town is also home to several businesses, including restaurants, retail stores, and a variety of services. The town is also home to several manufacturing companies, including a furniture factory and a food processing plant.
Demographics
As of the 2010 census, the population of San Luis was 1,487. The racial makeup of the town was 81.3% White, 0.7% African American, 0.7% Native American, 0.3% Asian, 0.1% Pacific Islander, 14.7% from other races, and 2.1% from two or more races. Hispanic or Latino of any race were 43.2% of the population.
The median household income in San Luis was $30,938, and the median family income was $35,625. The per capita income was $14,945. About 18.2% of the population was below the poverty line.
San Luis is a small town with a rich history and a diverse population. The town is home to a variety of businesses and attractions, and is a popular tourist destination. The town is also home to several farms and ranches, which provide a variety of products to the local economy.
Common Questions
What is Per Capita Income in San Luis?
Per Capita income in San Luis is $20,321.
What is the Median Family Income in San Luis?
Median Family Income in San Luis is $38,068.
What is the Median Household income in San Luis?
Median Household Income in San Luis is $27,895.
What is Income or Wage Gap in San Luis?
Income or Wage Gap in San Luis is 28.0%.
Women in San Luis earn 72.0 cents for every dollar earned by a man.
What is Inequality or Gini Index in San Luis?
Inequality or Gini Index in San Luis is 0.44.
What is the Total Population of San Luis?
Total Population of San Luis is 603.
What is the Total Male Population of San Luis?
Total Male Population of San Luis is 301.
What is the Total Female Population of San Luis?
Total Female Population of San Luis is 302.
What is the Ratio of Males per 100 Females in San Luis?
There are 99.67 Males per 100 Females in San Luis.
What is the Ratio of Females per 100 Males in San Luis?
There are 100.33 Females per 100 Males in San Luis.
What is the Median Population Age in San Luis?
Median Population Age in San Luis is 47.1 Years.
What is the Average Family Size in San Luis
Average Family Size in San Luis is 2.7 People.
What is the Average Household Size in San Luis
Average Household Size in San Luis is 2.1 People.
How Large is the Labor Force in San Luis?
There are 267 People in the Labor Forcein in San Luis.
What is the Percentage of People in the Labor Force in San Luis?
52.9% of People are in the Labor Force in San Luis.
What is the Unemployment Rate in San Luis?
Unemployment Rate in San Luis is 3.4%.