Zip Codes with the Highest Percentage of Population Employed in Food Preparation & Serving in Golden, CO
RELATED REPORTS & OPTIONS
Food Preparation & Serving
Golden
Compare Zip Codes
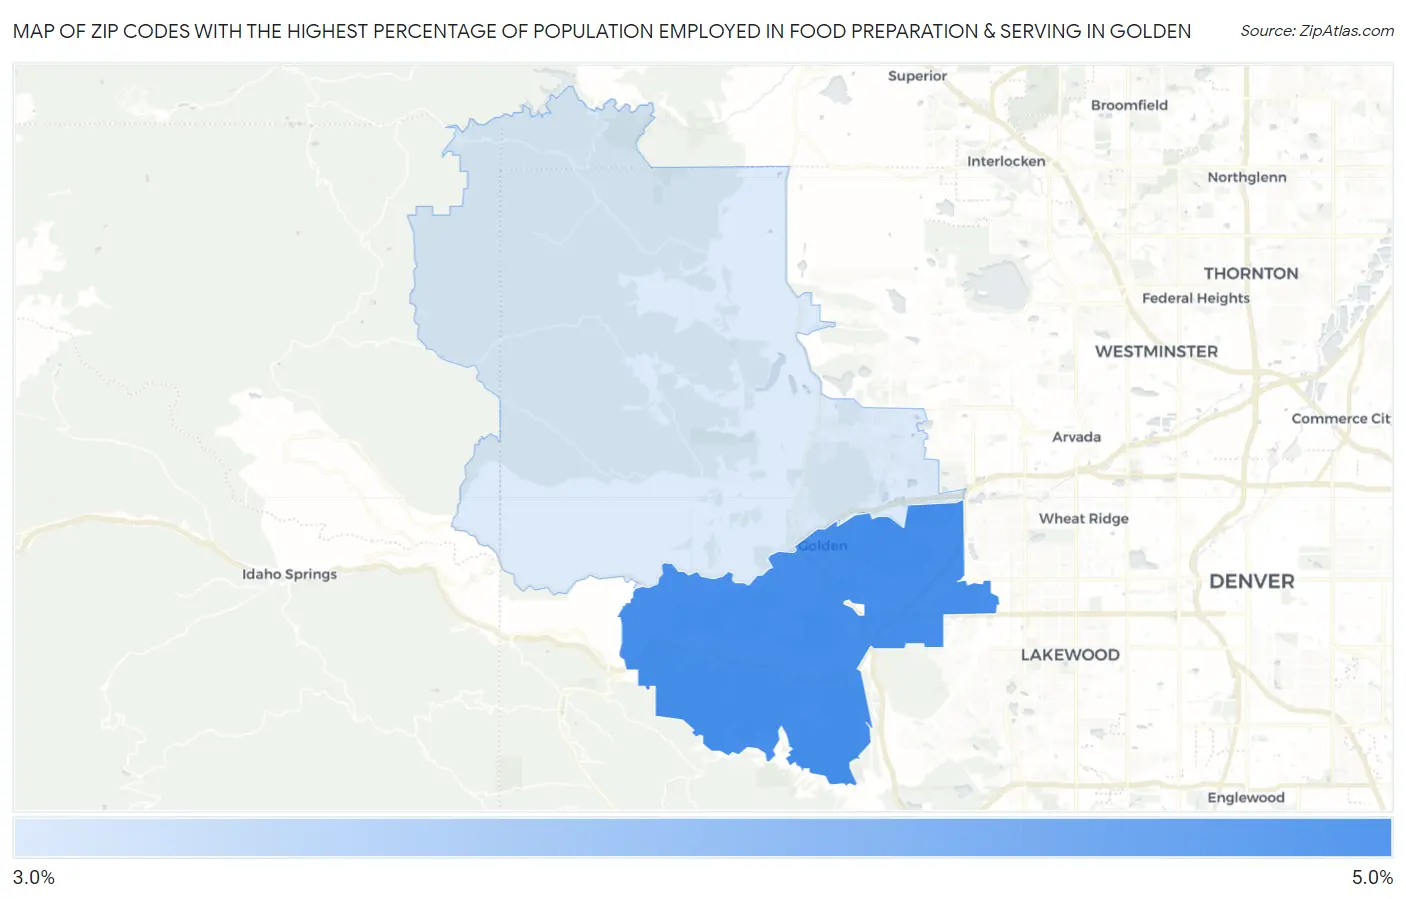
Map of Zip Codes with the Highest Percentage of Population Employed in Food Preparation & Serving in Golden
3.2%
4.3%
Zip Codes with the Highest Percentage of Population Employed in Food Preparation & Serving in Golden, CO
| Zip Code | % Employed | vs State | vs National | |
| 1. | 80401 | 4.3% | 5.2%(-0.900)#240 | 5.3%(-1.00)#15,962 |
| 2. | 80403 | 3.2% | 5.2%(-1.95)#308 | 5.3%(-2.05)#20,347 |
1
Common Questions
What are the Top Zip Codes with the Highest Percentage of Population Employed in Food Preparation & Serving in Golden, CO?
Top Zip Codes with the Highest Percentage of Population Employed in Food Preparation & Serving in Golden, CO are:
What zip code has the Highest Percentage of Population Employed in Food Preparation & Serving in Golden, CO?
80401 has the Highest Percentage of Population Employed in Food Preparation & Serving in Golden, CO with 4.3%.
What is the Percentage of Population Employed in Food Preparation & Serving in Golden, CO?
Percentage of Population Employed in Food Preparation & Serving in Golden is 6.4%.
What is the Percentage of Population Employed in Food Preparation & Serving in Colorado?
Percentage of Population Employed in Food Preparation & Serving in Colorado is 5.2%.
What is the Percentage of Population Employed in Food Preparation & Serving in the United States?
Percentage of Population Employed in Food Preparation & Serving in the United States is 5.3%.