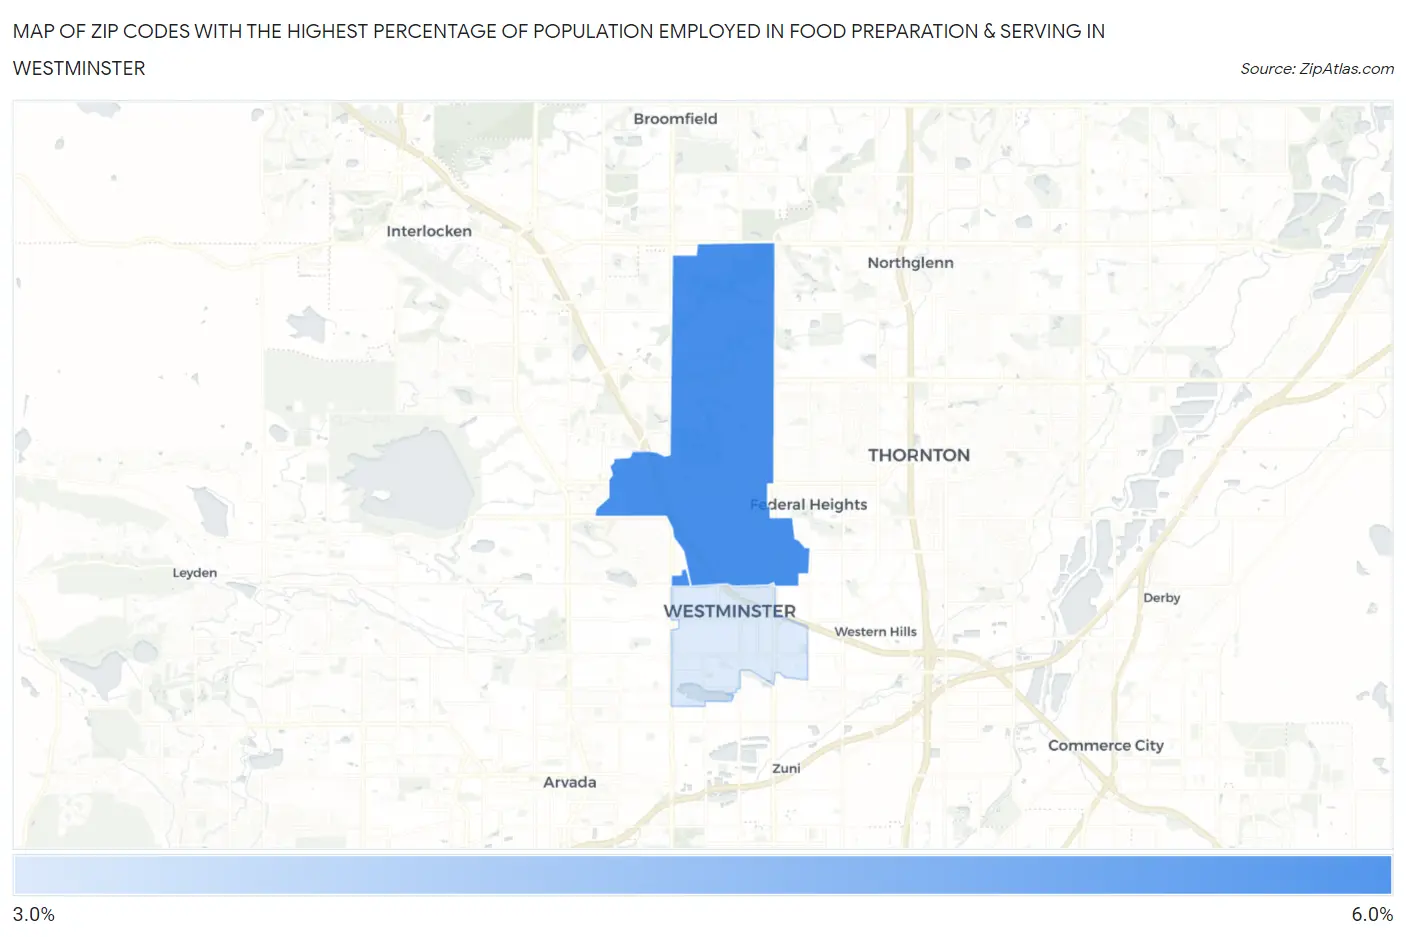
Zip Codes with the Highest Percentage of Population Employed in Food Preparation & Serving in Westminster, CO
RELATED REPORTS & OPTIONS
Food Preparation & Serving
Westminster
Compare Zip Codes
Map of Zip Codes with the Highest Percentage of Population Employed in Food Preparation & Serving in Westminster
3.7%
5.4%
Zip Codes with the Highest Percentage of Population Employed in Food Preparation & Serving in Westminster, CO
| Zip Code | % Employed | vs State | vs National | |
| 1. | 80031 | 5.4% | 5.2%(+0.191)#172 | 5.3%(+0.086)#11,498 |
| 2. | 80030 | 3.7% | 5.2%(-1.49)#280 | 5.3%(-1.59)#18,393 |
1
Common Questions
What are the Top Zip Codes with the Highest Percentage of Population Employed in Food Preparation & Serving in Westminster, CO?
Top Zip Codes with the Highest Percentage of Population Employed in Food Preparation & Serving in Westminster, CO are:
What zip code has the Highest Percentage of Population Employed in Food Preparation & Serving in Westminster, CO?
80031 has the Highest Percentage of Population Employed in Food Preparation & Serving in Westminster, CO with 5.4%.
What is the Percentage of Population Employed in Food Preparation & Serving in Westminster, CO?
Percentage of Population Employed in Food Preparation & Serving in Westminster is 4.7%.
What is the Percentage of Population Employed in Food Preparation & Serving in Colorado?
Percentage of Population Employed in Food Preparation & Serving in Colorado is 5.2%.
What is the Percentage of Population Employed in Food Preparation & Serving in the United States?
Percentage of Population Employed in Food Preparation & Serving in the United States is 5.3%.