Naturita, CO Map & Demographics
Naturita Map
Naturita Overview
$25,401
PER CAPITA INCOME
$25,278
AVG HOUSEHOLD INCOME
6.7%
WAGE / INCOME GAP [ % ]
93.3¢/ $1
WAGE / INCOME GAP [ $ ]
0.51
INEQUALITY / GINI INDEX
479
TOTAL POPULATION
269
MALE POPULATION
210
FEMALE POPULATION
128.10
MALES / 100 FEMALES
78.07
FEMALES / 100 MALES
55.0
MEDIAN AGE
3.0
AVG FAMILY SIZE
2.2
AVG HOUSEHOLD SIZE
192
LABOR FORCE [ PEOPLE ]
46.2%
PERCENT IN LABOR FORCE
Naturita Zip Codes
Naturita Area Codes
Income in Naturita
Income Overview in Naturita
| Characteristic | Number | Measure |
| Per Capita Income | 479 | $25,401 |
| Median Family Income | 97 | $0 |
| Mean Family Income | 97 | $60,222 |
| Median Household Income | 222 | $25,278 |
| Mean Household Income | 222 | $46,677 |
| Income Deficit | 97 | $0 |
| Wage / Income Gap (%) | 479 | 6.69% |
| Wage / Income Gap ($) | 479 | 93.31¢ per $1 |
| Gini / Inequality Index | 479 | 0.51 |
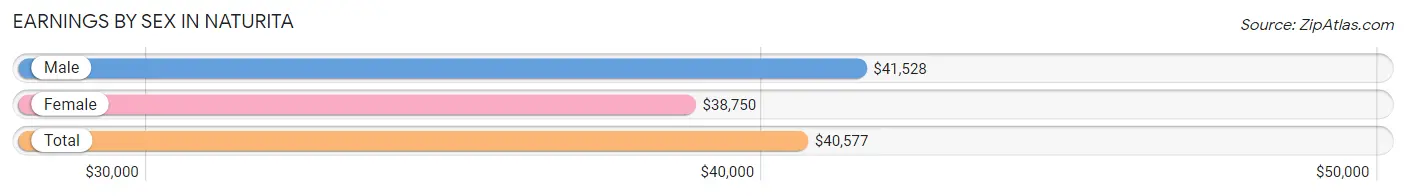
Earnings by Sex in Naturita
Average Earnings in Naturita are $40,577, $41,528 for men and $38,750 for women, a difference of 6.7%.
| Sex | Number | Average Earnings |
| Male | 109 (56.8%) | $41,528 |
| Female | 83 (43.2%) | $38,750 |
| Total | 192 (100.0%) | $40,577 |
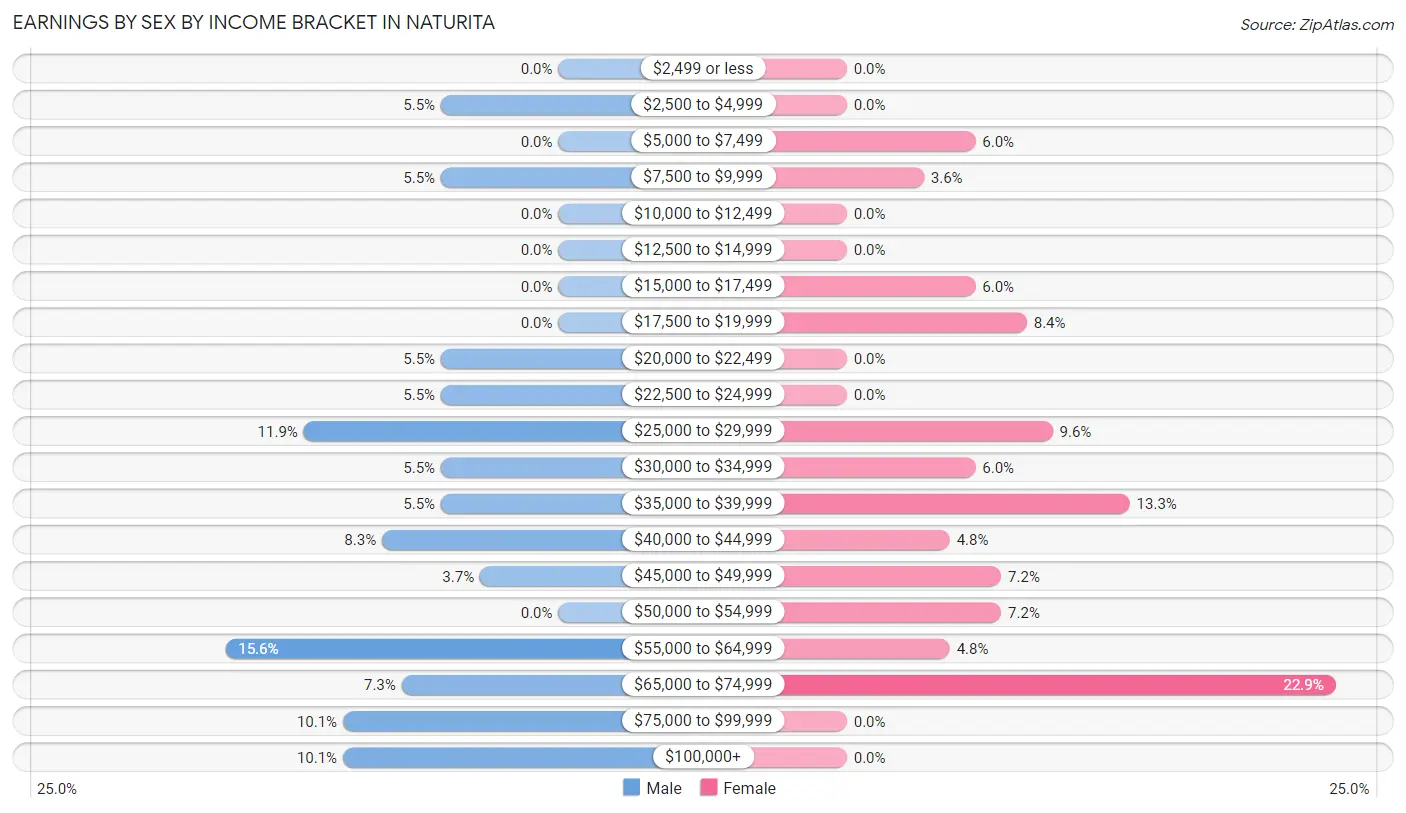
Earnings by Sex by Income Bracket in Naturita
The most common earnings brackets in Naturita are $55,000 to $64,999 for men (17 | 15.6%) and $65,000 to $74,999 for women (19 | 22.9%).
| Income | Male | Female |
| $2,499 or less | 0 (0.0%) | 0 (0.0%) |
| $2,500 to $4,999 | 6 (5.5%) | 0 (0.0%) |
| $5,000 to $7,499 | 0 (0.0%) | 5 (6.0%) |
| $7,500 to $9,999 | 6 (5.5%) | 3 (3.6%) |
| $10,000 to $12,499 | 0 (0.0%) | 0 (0.0%) |
| $12,500 to $14,999 | 0 (0.0%) | 0 (0.0%) |
| $15,000 to $17,499 | 0 (0.0%) | 5 (6.0%) |
| $17,500 to $19,999 | 0 (0.0%) | 7 (8.4%) |
| $20,000 to $22,499 | 6 (5.5%) | 0 (0.0%) |
| $22,500 to $24,999 | 6 (5.5%) | 0 (0.0%) |
| $25,000 to $29,999 | 13 (11.9%) | 8 (9.6%) |
| $30,000 to $34,999 | 6 (5.5%) | 5 (6.0%) |
| $35,000 to $39,999 | 6 (5.5%) | 11 (13.3%) |
| $40,000 to $44,999 | 9 (8.3%) | 4 (4.8%) |
| $45,000 to $49,999 | 4 (3.7%) | 6 (7.2%) |
| $50,000 to $54,999 | 0 (0.0%) | 6 (7.2%) |
| $55,000 to $64,999 | 17 (15.6%) | 4 (4.8%) |
| $65,000 to $74,999 | 8 (7.3%) | 19 (22.9%) |
| $75,000 to $99,999 | 11 (10.1%) | 0 (0.0%) |
| $100,000+ | 11 (10.1%) | 0 (0.0%) |
| Total | 109 (100.0%) | 83 (100.0%) |
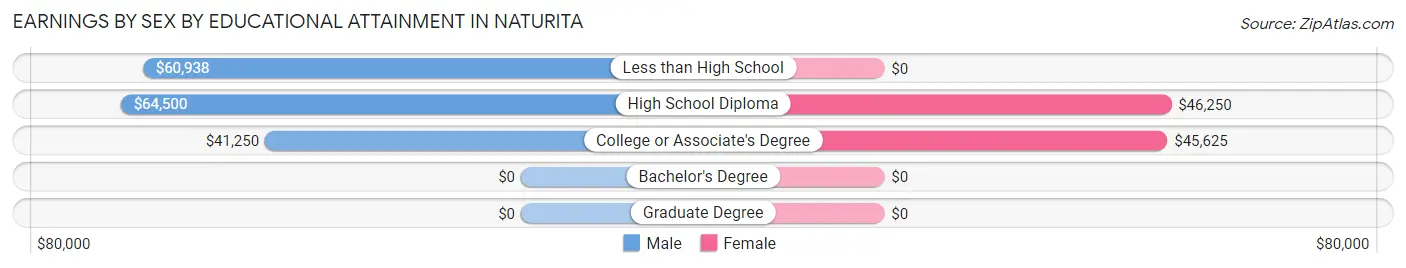
Earnings by Sex by Educational Attainment in Naturita
Average earnings in Naturita are $59,063 for men and $38,500 for women, a difference of 34.8%. Men with an educational attainment of high school diploma enjoy the highest average annual earnings of $64,500, while those with college or associate's degree education earn the least with $41,250. Women with an educational attainment of high school diploma earn the most with the average annual earnings of $46,250, while those with college or associate's degree education have the smallest earnings of $45,625.
| Educational Attainment | Male Income | Female Income |
| Less than High School | $60,938 | $0 |
| High School Diploma | $64,500 | $46,250 |
| College or Associate's Degree | $41,250 | $45,625 |
| Bachelor's Degree | - | - |
| Graduate Degree | - | - |
| Total | $59,063 | $38,500 |
Family Income in Naturita
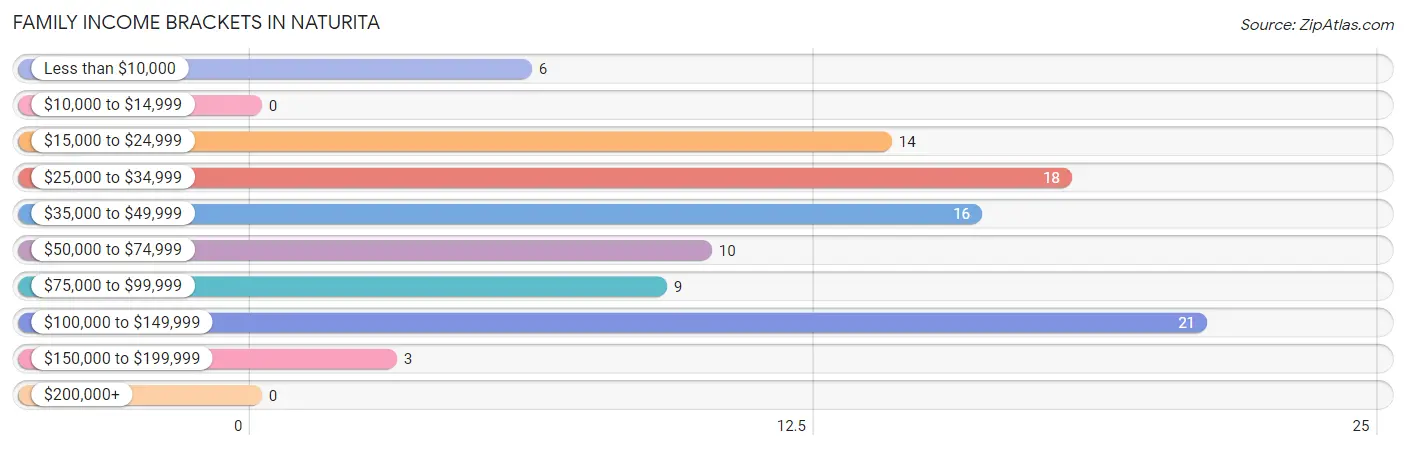
Family Income Brackets in Naturita
According to the Naturita family income data, there are 21 families falling into the $100,000 to $149,999 income range, which is the most common income bracket and makes up 21.6% of all families.
| Income Bracket | # Families | % Families |
| Less than $10,000 | 6 | 6.2% |
| $10,000 to $14,999 | 0 | 0.0% |
| $15,000 to $24,999 | 14 | 14.4% |
| $25,000 to $34,999 | 18 | 18.6% |
| $35,000 to $49,999 | 16 | 16.5% |
| $50,000 to $74,999 | 10 | 10.3% |
| $75,000 to $99,999 | 9 | 9.3% |
| $100,000 to $149,999 | 21 | 21.6% |
| $150,000 to $199,999 | 3 | 3.1% |
| $200,000+ | 0 | 0.0% |
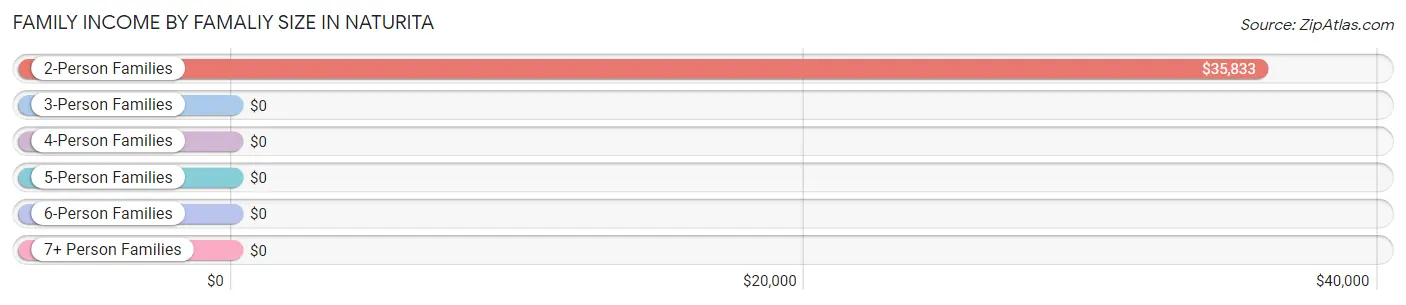
Family Income by Famaliy Size in Naturita
2-person families (62 | 63.9%) account for the highest median family income in Naturita with $35,833 per family, while 2-person families (62 | 63.9%) have the highest median income of $17,916 per family member.
| Income Bracket | # Families | Median Income |
| 2-Person Families | 62 (63.9%) | $35,833 |
| 3-Person Families | 14 (14.4%) | $0 |
| 4-Person Families | 15 (15.5%) | $0 |
| 5-Person Families | 6 (6.2%) | $0 |
| 6-Person Families | 0 (0.0%) | $0 |
| 7+ Person Families | 0 (0.0%) | $0 |
| Total | 97 (100.0%) | $0 |
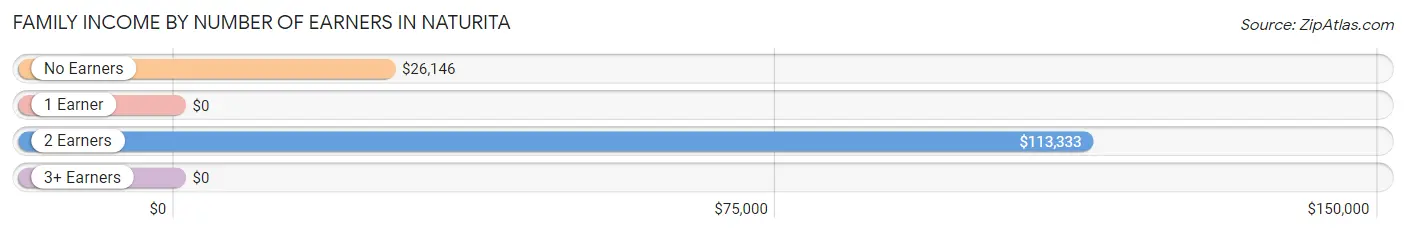
Family Income by Number of Earners in Naturita
| Number of Earners | # Families | Median Income |
| No Earners | 33 (34.0%) | $26,146 |
| 1 Earner | 32 (33.0%) | $0 |
| 2 Earners | 32 (33.0%) | $113,333 |
| 3+ Earners | 0 (0.0%) | $0 |
| Total | 97 (100.0%) | $0 |
Household Income in Naturita
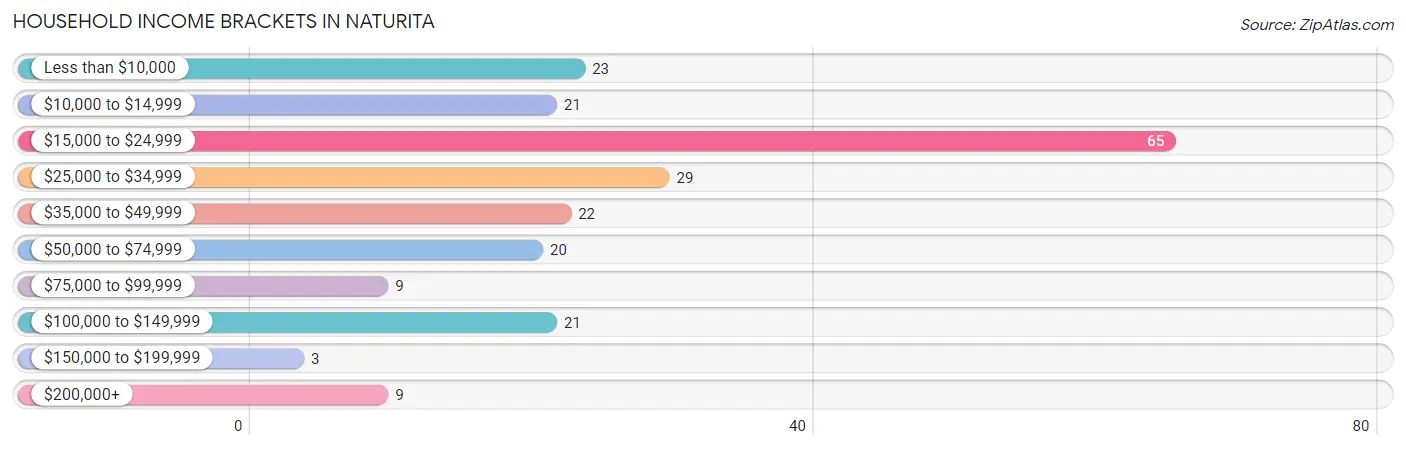
Household Income Brackets in Naturita
With 65 households falling in the category, the $15,000 to $24,999 income range is the most frequent in Naturita, accounting for 29.3% of all households. In contrast, only 3 households (1.3%) fall into the $150,000 to $199,999 income bracket, making it the least populous group.
| Income Bracket | # Households | % Households |
| Less than $10,000 | 23 | 10.4% |
| $10,000 to $14,999 | 21 | 9.5% |
| $15,000 to $24,999 | 65 | 29.3% |
| $25,000 to $34,999 | 29 | 13.1% |
| $35,000 to $49,999 | 22 | 9.9% |
| $50,000 to $74,999 | 20 | 9.0% |
| $75,000 to $99,999 | 9 | 4.1% |
| $100,000 to $149,999 | 21 | 9.5% |
| $150,000 to $199,999 | 3 | 1.4% |
| $200,000+ | 9 | 4.1% |
Household Income by Householder Age in Naturita
The median household income in Naturita is $25,278, with the highest median household income of $38,125 found in the 45 to 64 years age bracket for the primary householder. A total of 87 households (39.2%) fall into this category. Meanwhile, the 15 to 24 years age bracket for the primary householder has the lowest median household income of $0, with 7 households (3.2%) in this group.
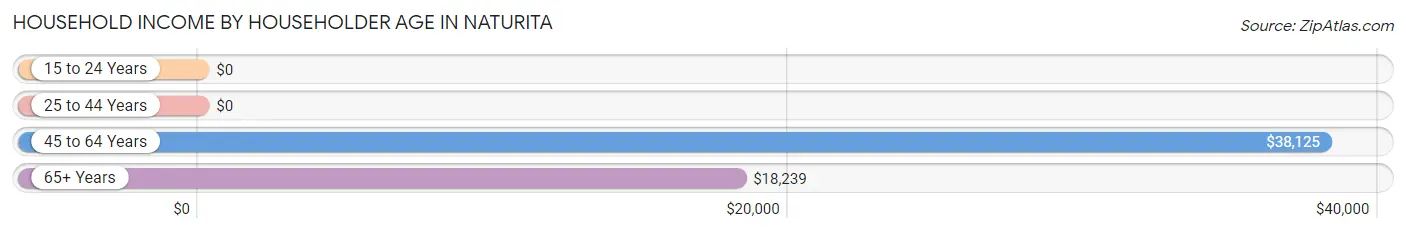
| Income Bracket | # Households | Median Income |
| 15 to 24 Years | 7 (3.2%) | $0 |
| 25 to 44 Years | 39 (17.6%) | $0 |
| 45 to 64 Years | 87 (39.2%) | $38,125 |
| 65+ Years | 89 (40.1%) | $18,239 |
| Total | 222 (100.0%) | $25,278 |
Poverty in Naturita
Income Below Poverty by Sex and Age in Naturita
With 16.4% poverty level for males and 23.3% for females among the residents of Naturita, 12 to 14 year old males and 65 to 74 year old females are the most vulnerable to poverty, with 3 males (100.0%) and 14 females (46.7%) in their respective age groups living below the poverty level.
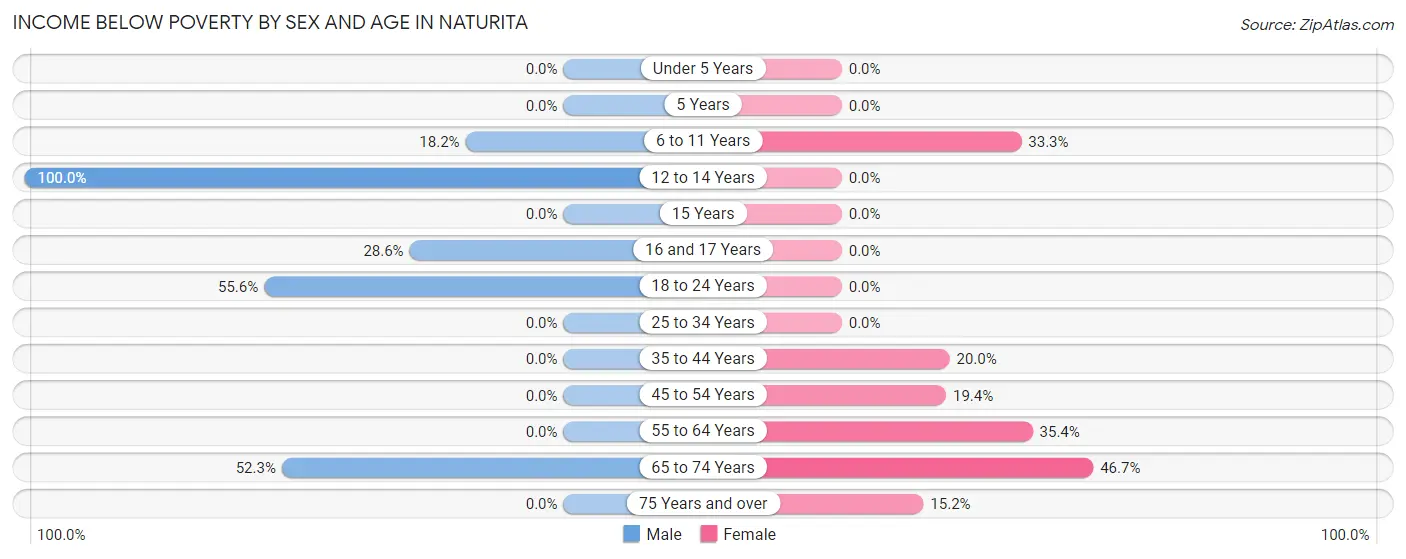
| Age Bracket | Male | Female |
| Under 5 Years | 0 (0.0%) | 0 (0.0%) |
| 5 Years | 0 (0.0%) | 0 (0.0%) |
| 6 to 11 Years | 2 (18.2%) | 4 (33.3%) |
| 12 to 14 Years | 3 (100.0%) | 0 (0.0%) |
| 15 Years | 0 (0.0%) | 0 (0.0%) |
| 16 and 17 Years | 6 (28.6%) | 0 (0.0%) |
| 18 to 24 Years | 10 (55.6%) | 0 (0.0%) |
| 25 to 34 Years | 0 (0.0%) | 0 (0.0%) |
| 35 to 44 Years | 0 (0.0%) | 3 (20.0%) |
| 45 to 54 Years | 0 (0.0%) | 6 (19.4%) |
| 55 to 64 Years | 0 (0.0%) | 17 (35.4%) |
| 65 to 74 Years | 23 (52.3%) | 14 (46.7%) |
| 75 Years and over | 0 (0.0%) | 5 (15.1%) |
| Total | 44 (16.4%) | 49 (23.3%) |
Income Above Poverty by Sex and Age in Naturita
According to the poverty statistics in Naturita, males aged under 5 years and females aged under 5 years are the age groups that are most secure financially, with 100.0% of males and 100.0% of females in these age groups living above the poverty line.
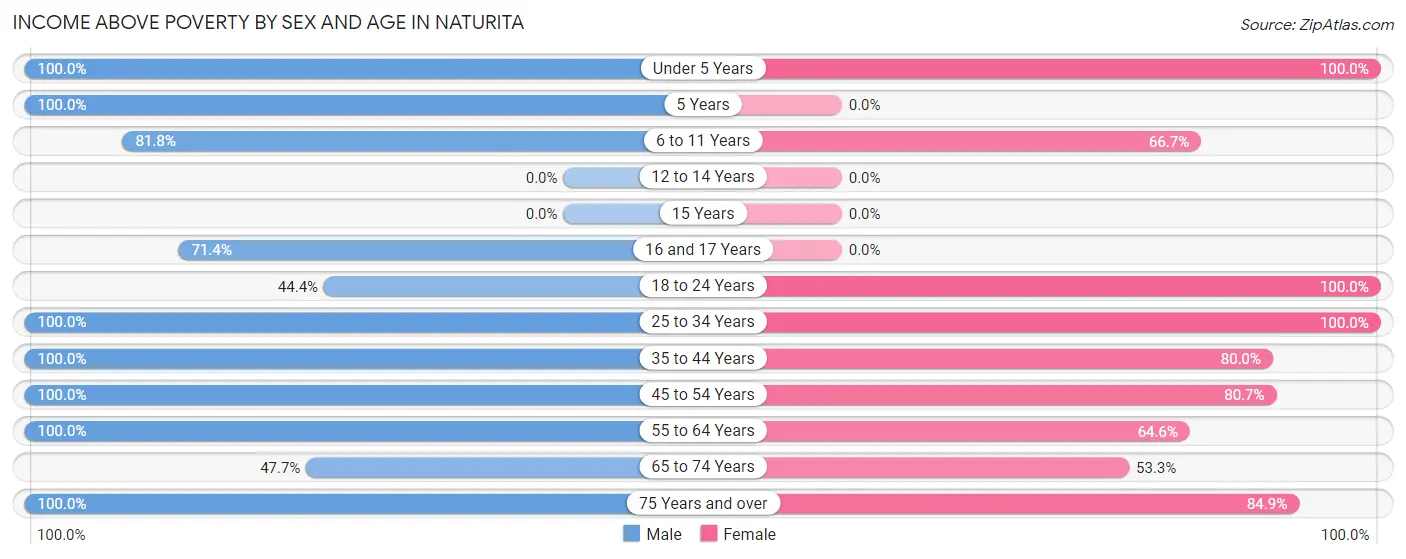
| Age Bracket | Male | Female |
| Under 5 Years | 8 (100.0%) | 8 (100.0%) |
| 5 Years | 21 (100.0%) | 0 (0.0%) |
| 6 to 11 Years | 9 (81.8%) | 8 (66.7%) |
| 12 to 14 Years | 0 (0.0%) | 0 (0.0%) |
| 15 Years | 0 (0.0%) | 0 (0.0%) |
| 16 and 17 Years | 15 (71.4%) | 0 (0.0%) |
| 18 to 24 Years | 8 (44.4%) | 7 (100.0%) |
| 25 to 34 Years | 27 (100.0%) | 26 (100.0%) |
| 35 to 44 Years | 20 (100.0%) | 12 (80.0%) |
| 45 to 54 Years | 11 (100.0%) | 25 (80.6%) |
| 55 to 64 Years | 70 (100.0%) | 31 (64.6%) |
| 65 to 74 Years | 21 (47.7%) | 16 (53.3%) |
| 75 Years and over | 15 (100.0%) | 28 (84.9%) |
| Total | 225 (83.6%) | 161 (76.7%) |
Income Below Poverty Among Married-Couple Families in Naturita
The poverty statistics for married-couple families in Naturita show that 6.3% or 5 of the total 79 families live below the poverty line. Families with no children have the highest poverty rate of 10.0%, comprising of 5 families. On the other hand, families with 1 or 2 children have the lowest poverty rate of 0.0%, which includes 0 families.
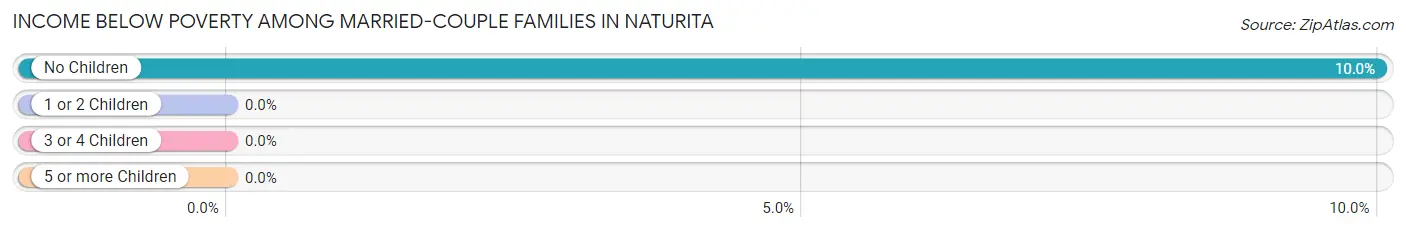
| Children | Above Poverty | Below Poverty |
| No Children | 45 (90.0%) | 5 (10.0%) |
| 1 or 2 Children | 23 (100.0%) | 0 (0.0%) |
| 3 or 4 Children | 6 (100.0%) | 0 (0.0%) |
| 5 or more Children | 0 (0.0%) | 0 (0.0%) |
| Total | 74 (93.7%) | 5 (6.3%) |
Income Below Poverty Among Single-Parent Households in Naturita
According to the poverty data in Naturita, 35.7% or 5 single-father households and 100.0% or 4 single-mother households are living below the poverty line. Among single-father households, those with no children have the highest poverty rate, with 5 households (100.0%) experiencing poverty. Likewise, among single-mother households, those with 1 or 2 children have the highest poverty rate, with 4 households (100.0%) falling below the poverty line.
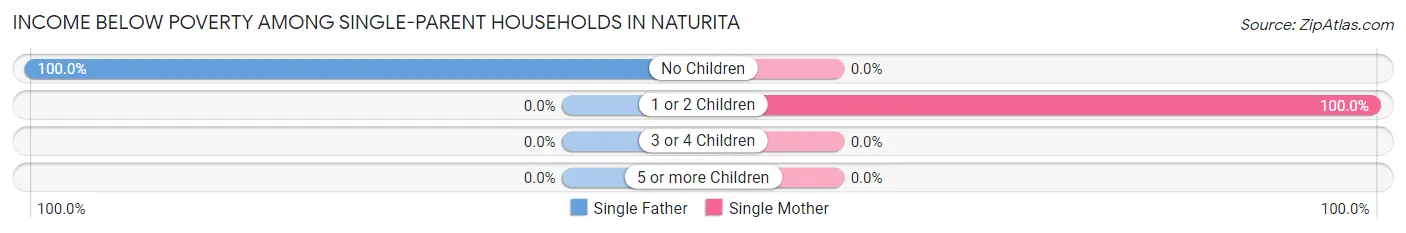
| Children | Single Father | Single Mother |
| No Children | 5 (100.0%) | 0 (0.0%) |
| 1 or 2 Children | 0 (0.0%) | 4 (100.0%) |
| 3 or 4 Children | 0 (0.0%) | 0 (0.0%) |
| 5 or more Children | 0 (0.0%) | 0 (0.0%) |
| Total | 5 (35.7%) | 4 (100.0%) |
Income Below Poverty Among Married-Couple vs Single-Parent Households in Naturita
The poverty data for Naturita shows that 5 of the married-couple family households (6.3%) and 9 of the single-parent households (50.0%) are living below the poverty level. Within the married-couple family households, those with no children have the highest poverty rate, with 5 households (10.0%) falling below the poverty line. Among the single-parent households, those with no children have the highest poverty rate, with 5 household (100.0%) living below poverty.
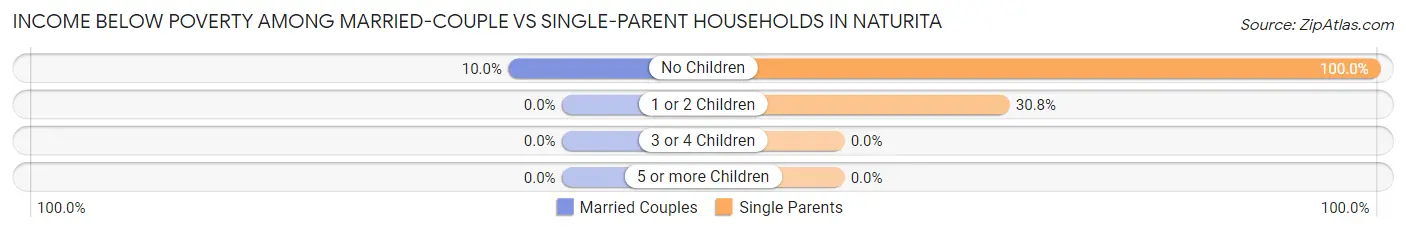
| Children | Married-Couple Families | Single-Parent Households |
| No Children | 5 (10.0%) | 5 (100.0%) |
| 1 or 2 Children | 0 (0.0%) | 4 (30.8%) |
| 3 or 4 Children | 0 (0.0%) | 0 (0.0%) |
| 5 or more Children | 0 (0.0%) | 0 (0.0%) |
| Total | 5 (6.3%) | 9 (50.0%) |
Race in Naturita
The most populous races in Naturita are White / Caucasian (476 | 99.4%), Hispanic or Latino (17 | 3.5%), and Two or more Races (3 | 0.6%).
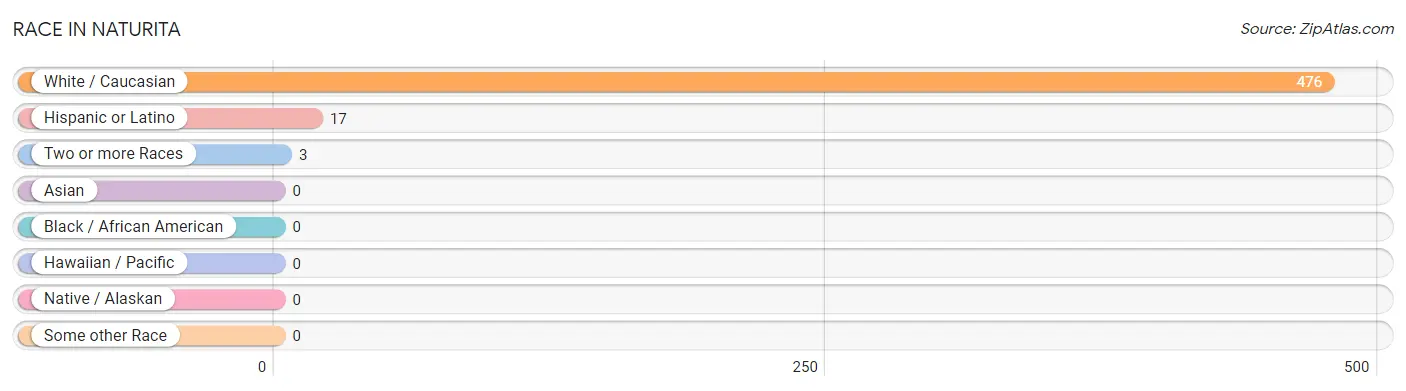
| Race | # Population | % Population |
| Asian | 0 | 0.0% |
| Black / African American | 0 | 0.0% |
| Hawaiian / Pacific | 0 | 0.0% |
| Hispanic or Latino | 17 | 3.5% |
| Native / Alaskan | 0 | 0.0% |
| White / Caucasian | 476 | 99.4% |
| Two or more Races | 3 | 0.6% |
| Some other Race | 0 | 0.0% |
| Total | 479 | 100.0% |
Ancestry in Naturita
The most populous ancestries reported in Naturita are German (66 | 13.8%), Irish (45 | 9.4%), English (27 | 5.6%), Norwegian (25 | 5.2%), and Mexican (17 | 3.5%), together accounting for 37.6% of all Naturita residents.
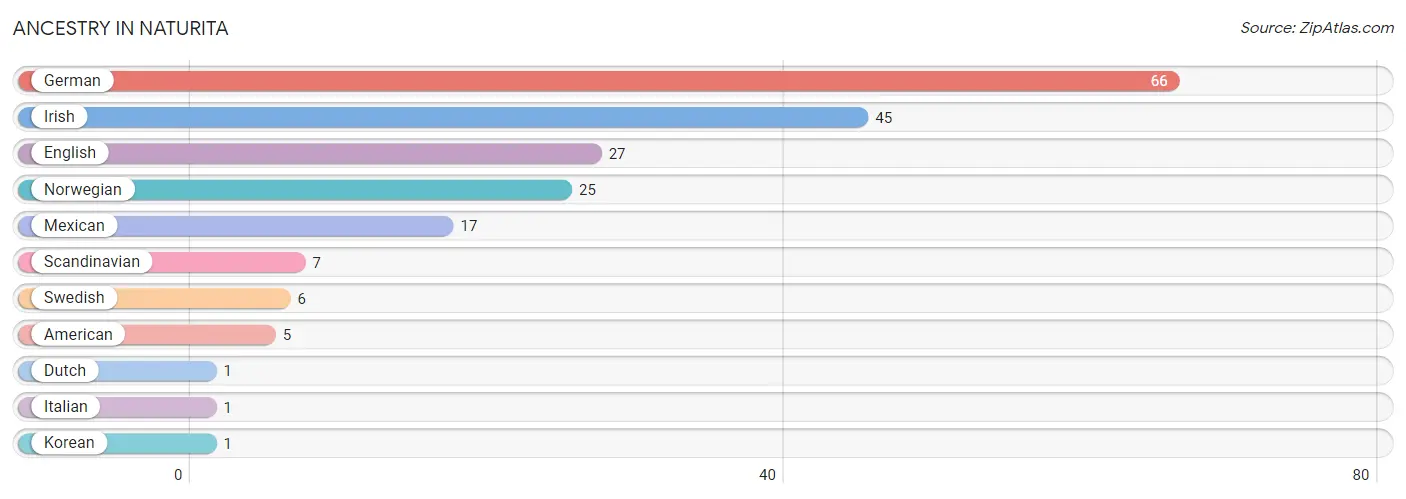
| Ancestry | # Population | % Population |
| American | 5 | 1.0% |
| Dutch | 1 | 0.2% |
| English | 27 | 5.6% |
| German | 66 | 13.8% |
| Irish | 45 | 9.4% |
| Italian | 1 | 0.2% |
| Korean | 1 | 0.2% |
| Mexican | 17 | 3.5% |
| Norwegian | 25 | 5.2% |
| Scandinavian | 7 | 1.5% |
| Swedish | 6 | 1.3% | View All 11 Rows |
Immigrants in Naturita
The most numerous immigrant groups reported in Naturita came from Asia (1 | 0.2%), Philippines (1 | 0.2%), and South Eastern Asia (1 | 0.2%), together accounting for 0.6% of all Naturita residents.
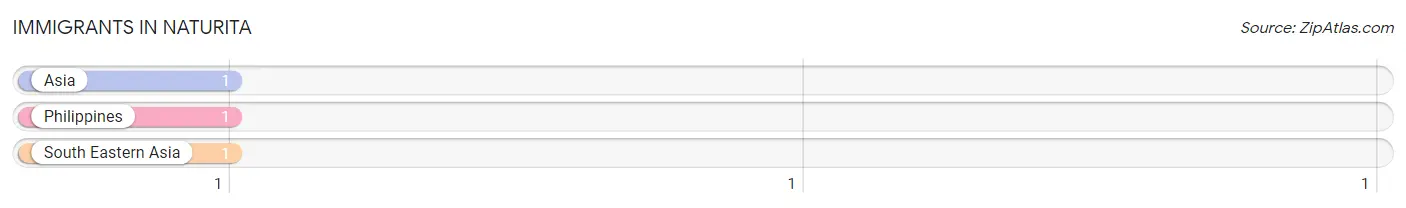
| Immigration Origin | # Population | % Population |
| Asia | 1 | 0.2% |
| Philippines | 1 | 0.2% |
| South Eastern Asia | 1 | 0.2% | View All 3 Rows |
Sex and Age in Naturita
Sex and Age in Naturita
The most populous age groups in Naturita are 60 to 64 Years (41 | 15.2%) for men and 60 to 64 Years (32 | 15.2%) for women.
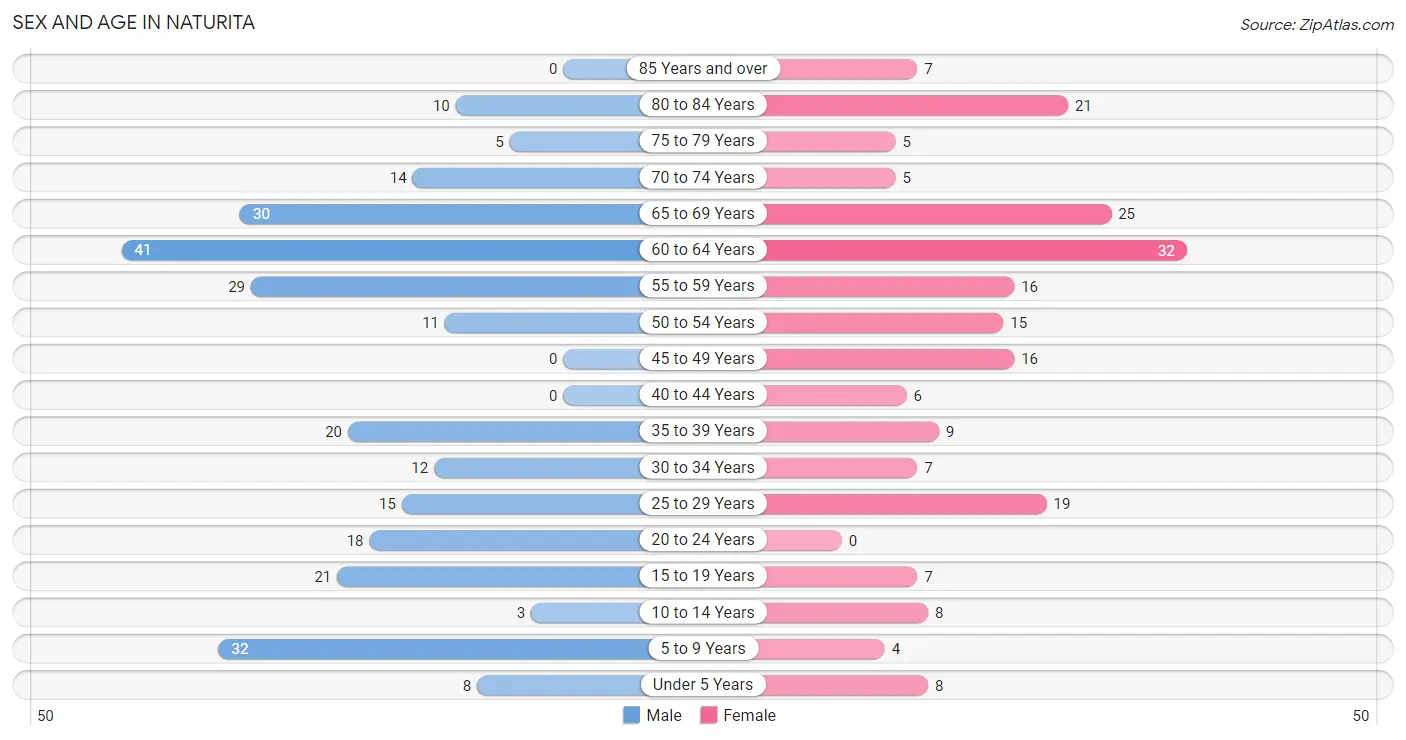
| Age Bracket | Male | Female |
| Under 5 Years | 8 (3.0%) | 8 (3.8%) |
| 5 to 9 Years | 32 (11.9%) | 4 (1.9%) |
| 10 to 14 Years | 3 (1.1%) | 8 (3.8%) |
| 15 to 19 Years | 21 (7.8%) | 7 (3.3%) |
| 20 to 24 Years | 18 (6.7%) | 0 (0.0%) |
| 25 to 29 Years | 15 (5.6%) | 19 (9.0%) |
| 30 to 34 Years | 12 (4.5%) | 7 (3.3%) |
| 35 to 39 Years | 20 (7.4%) | 9 (4.3%) |
| 40 to 44 Years | 0 (0.0%) | 6 (2.9%) |
| 45 to 49 Years | 0 (0.0%) | 16 (7.6%) |
| 50 to 54 Years | 11 (4.1%) | 15 (7.1%) |
| 55 to 59 Years | 29 (10.8%) | 16 (7.6%) |
| 60 to 64 Years | 41 (15.2%) | 32 (15.2%) |
| 65 to 69 Years | 30 (11.2%) | 25 (11.9%) |
| 70 to 74 Years | 14 (5.2%) | 5 (2.4%) |
| 75 to 79 Years | 5 (1.9%) | 5 (2.4%) |
| 80 to 84 Years | 10 (3.7%) | 21 (10.0%) |
| 85 Years and over | 0 (0.0%) | 7 (3.3%) |
| Total | 269 (100.0%) | 210 (100.0%) |
Families and Households in Naturita
Median Family Size in Naturita
The median family size in Naturita is 2.99 persons per family, with single female/mother families (4 | 4.1%) accounting for the largest median family size of 4.75 persons per family. On the other hand, single male/father families (14 | 14.4%) represent the smallest median family size with 2.57 persons per family.
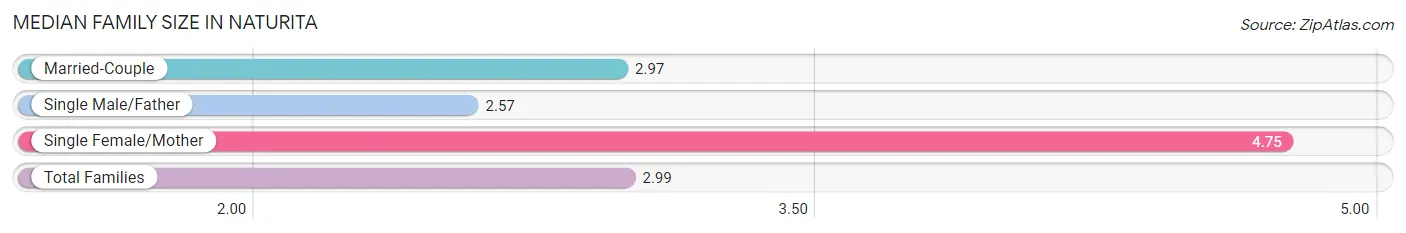
| Family Type | # Families | Family Size |
| Married-Couple | 79 (81.4%) | 2.97 |
| Single Male/Father | 14 (14.4%) | 2.57 |
| Single Female/Mother | 4 (4.1%) | 4.75 |
| Total Families | 97 (100.0%) | 2.99 |
Median Household Size in Naturita
The median household size in Naturita is 2.16 persons per household, with single female/mother households (4 | 1.8%) accounting for the largest median household size of 5.5 persons per household. non-family households (125 | 56.3%) represent the smallest median household size with 1.49 persons per household.
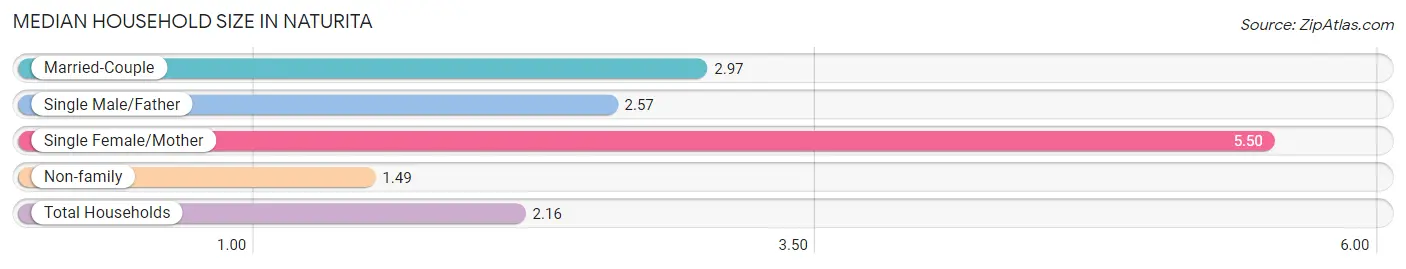
| Household Type | # Households | Household Size |
| Married-Couple | 79 (35.6%) | 2.97 |
| Single Male/Father | 14 (6.3%) | 2.57 |
| Single Female/Mother | 4 (1.8%) | 5.50 |
| Non-family | 125 (56.3%) | 1.49 |
| Total Households | 222 (100.0%) | 2.16 |
Household Size by Marriage Status in Naturita
Out of a total of 222 households in Naturita, 97 (43.7%) are family households, while 125 (56.3%) are nonfamily households. The most numerous type of family households are 2-person households, comprising 61, and the most common type of nonfamily households are 1-person households, comprising 103.
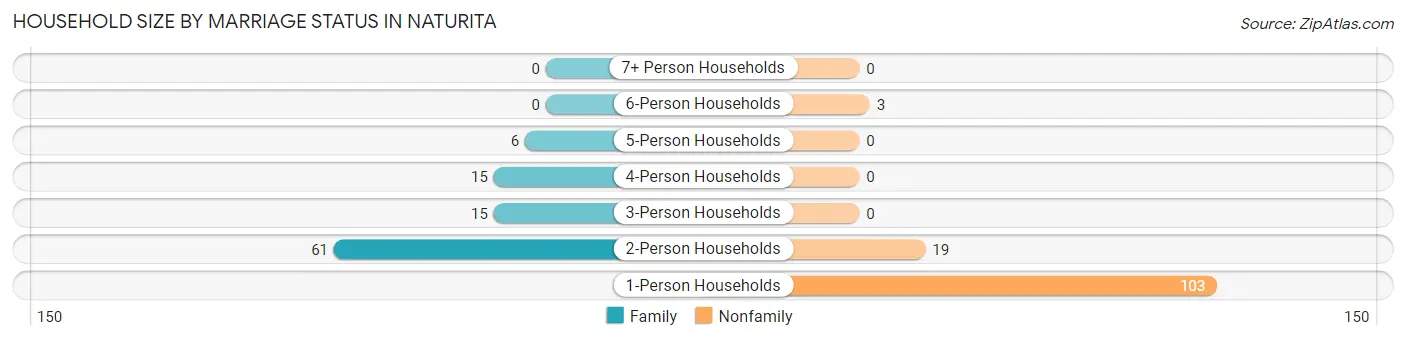
| Household Size | Family Households | Nonfamily Households |
| 1-Person Households | - | 103 (46.4%) |
| 2-Person Households | 61 (27.5%) | 19 (8.6%) |
| 3-Person Households | 15 (6.8%) | 0 (0.0%) |
| 4-Person Households | 15 (6.8%) | 0 (0.0%) |
| 5-Person Households | 6 (2.7%) | 0 (0.0%) |
| 6-Person Households | 0 (0.0%) | 3 (1.3%) |
| 7+ Person Households | 0 (0.0%) | 0 (0.0%) |
| Total | 97 (43.7%) | 125 (56.3%) |
Female Fertility in Naturita
Fertility by Age in Naturita
| Age Bracket | Women with Births | Births / 1,000 Women |
| 15 to 19 years | 0 (0.0%) | 0.0 |
| 20 to 34 years | 0 (0.0%) | 0.0 |
| 35 to 50 years | 0 (0.0%) | 0.0 |
| Total | 0 (0.0%) | 0.0 |
Fertility by Age by Marriage Status in Naturita
| Age Bracket | Married | Unmarried |
| 15 to 19 years | 0 (0.0%) | 0 (0.0%) |
| 20 to 34 years | 0 (0.0%) | 0 (0.0%) |
| 35 to 50 years | 0 (0.0%) | 0 (0.0%) |
| Total | 0 (0.0%) | 0 (0.0%) |
Fertility by Education in Naturita
| Educational Attainment | Women with Births | Births / 1,000 Women |
| Less than High School | 0 (0.0%) | 0.0 |
| High School Diploma | 0 (0.0%) | 0.0 |
| College or Associate's Degree | 0 (0.0%) | 0.0 |
| Bachelor's Degree | 0 (0.0%) | 0.0 |
| Graduate Degree | 0 (0.0%) | 0.0 |
| Total | 0 (0.0%) | 0.0 |
Fertility by Education by Marriage Status in Naturita
| Educational Attainment | Married | Unmarried |
| Less than High School | 0 (0.0%) | 0 (0.0%) |
| High School Diploma | 0 (0.0%) | 0 (0.0%) |
| College or Associate's Degree | 0 (0.0%) | 0 (0.0%) |
| Bachelor's Degree | 0 (0.0%) | 0 (0.0%) |
| Graduate Degree | 0 (0.0%) | 0 (0.0%) |
| Total | 0 (0.0%) | 0 (0.0%) |
Employment Characteristics in Naturita
Employment by Class of Employer in Naturita
Among the 192 employed individuals in Naturita, private company employees (139 | 72.4%), local government employees (26 | 13.5%), and not-for-profit organizations (19 | 9.9%) make up the most common classes of employment.
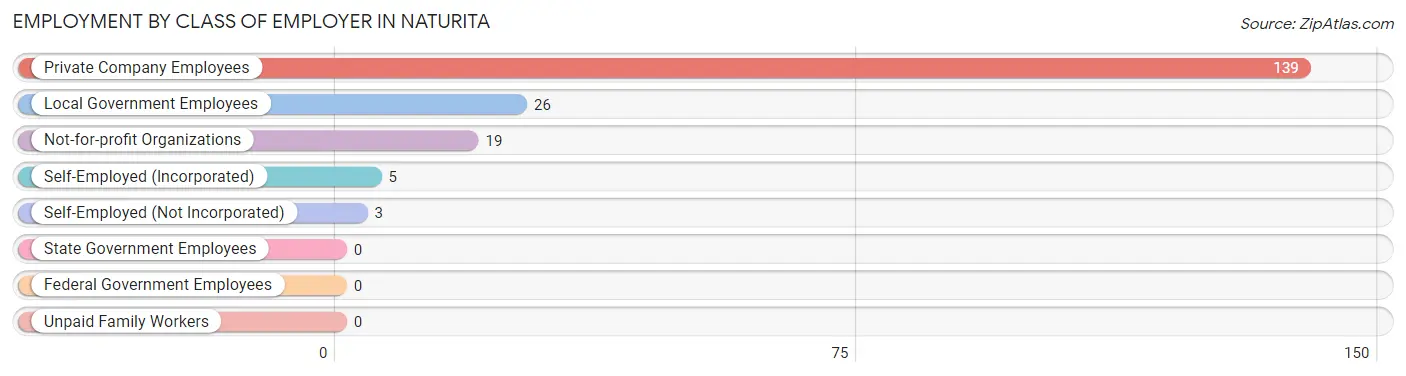
| Employer Class | # Employees | % Employees |
| Private Company Employees | 139 | 72.4% |
| Self-Employed (Incorporated) | 5 | 2.6% |
| Self-Employed (Not Incorporated) | 3 | 1.6% |
| Not-for-profit Organizations | 19 | 9.9% |
| Local Government Employees | 26 | 13.5% |
| State Government Employees | 0 | 0.0% |
| Federal Government Employees | 0 | 0.0% |
| Unpaid Family Workers | 0 | 0.0% |
| Total | 192 | 100.0% |
Employment Status by Age in Naturita
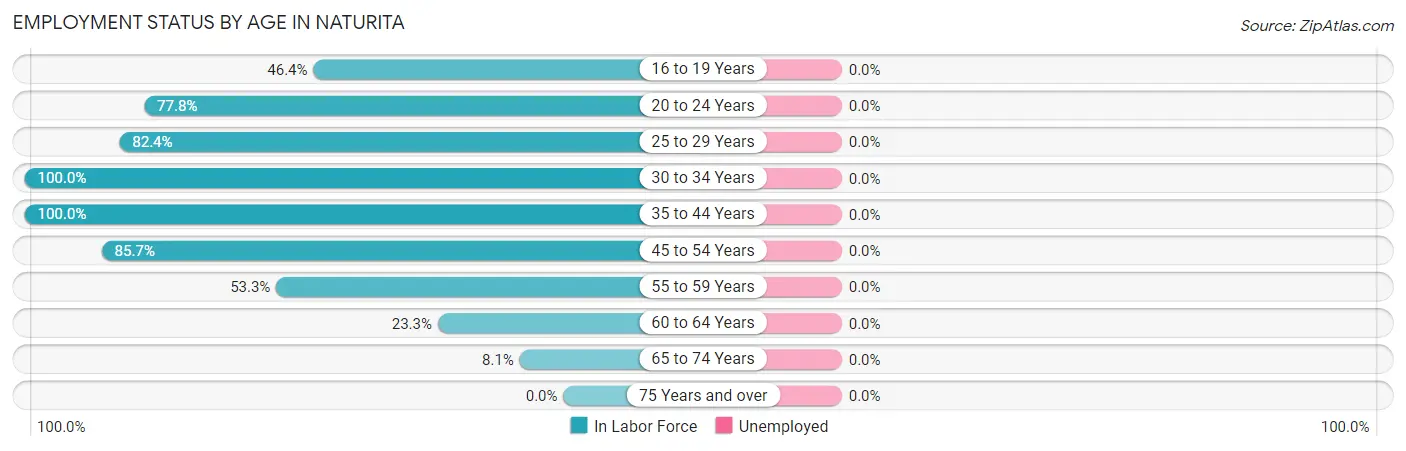
| Age Bracket | In Labor Force | Unemployed |
| 16 to 19 Years | 13 (46.4%) | 0 (0.0%) |
| 20 to 24 Years | 14 (77.8%) | 0 (0.0%) |
| 25 to 29 Years | 28 (82.4%) | 0 (0.0%) |
| 30 to 34 Years | 19 (100.0%) | 0 (0.0%) |
| 35 to 44 Years | 35 (100.0%) | 0 (0.0%) |
| 45 to 54 Years | 36 (85.7%) | 0 (0.0%) |
| 55 to 59 Years | 24 (53.3%) | 0 (0.0%) |
| 60 to 64 Years | 17 (23.3%) | 0 (0.0%) |
| 65 to 74 Years | 6 (8.1%) | 0 (0.0%) |
| 75 Years and over | 0 (0.0%) | 0 (0.0%) |
| Total | 192 (46.2%) | 0 (0.0%) |
Employment Status by Educational Attainment in Naturita
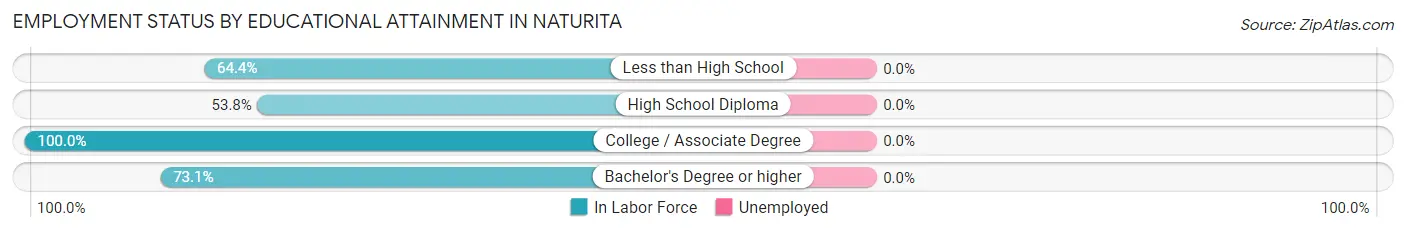
| Educational Attainment | In Labor Force | Unemployed |
| Less than High School | 29 (64.4%) | 0 (0.0%) |
| High School Diploma | 77 (53.8%) | 0 (0.0%) |
| College / Associate Degree | 34 (100.0%) | 0 (0.0%) |
| Bachelor's Degree or higher | 19 (73.1%) | 0 (0.0%) |
| Total | 159 (64.1%) | 0 (0.0%) |
Employment Occupations by Sex in Naturita
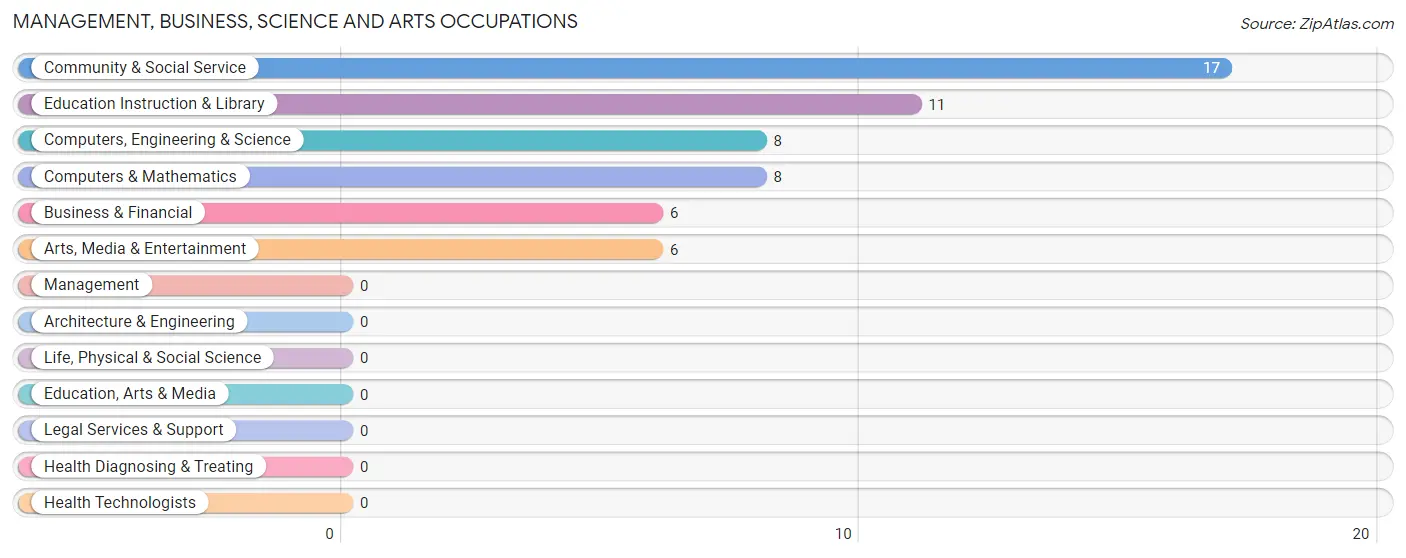
Management, Business, Science and Arts Occupations
The most common Management, Business, Science and Arts occupations in Naturita are Community & Social Service (17 | 8.8%), Education Instruction & Library (11 | 5.7%), Computers, Engineering & Science (8 | 4.2%), Computers & Mathematics (8 | 4.2%), and Business & Financial (6 | 3.1%).
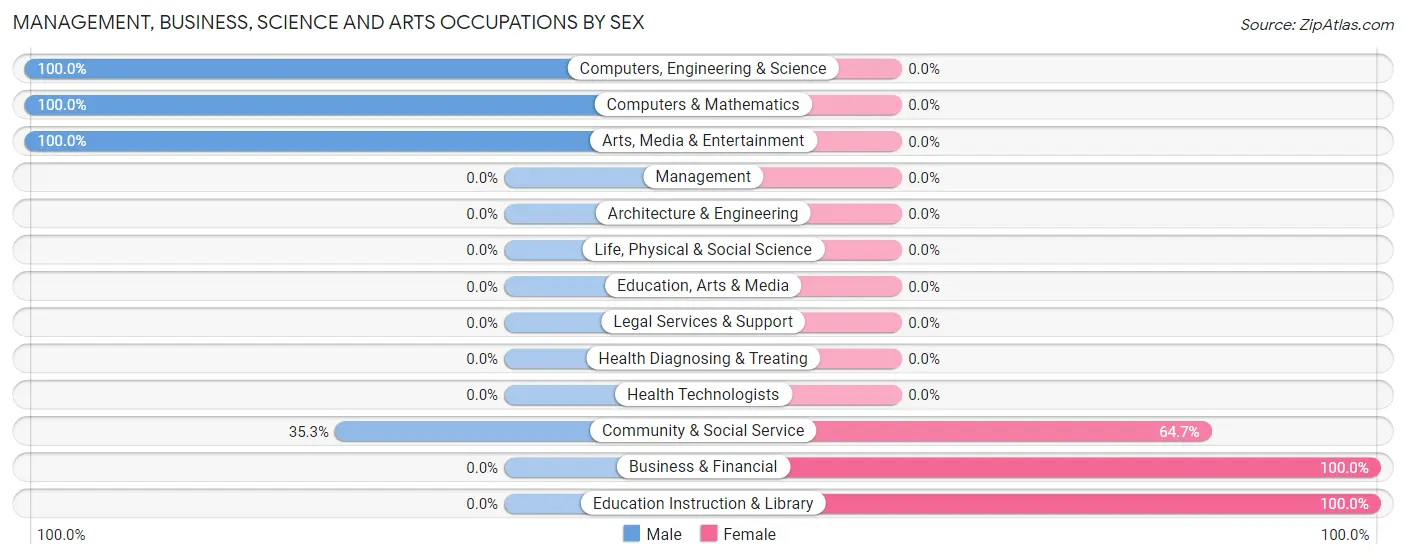
Management, Business, Science and Arts Occupations by Sex
Within the Management, Business, Science and Arts occupations in Naturita, the most male-oriented occupations are Computers, Engineering & Science (100.0%), Computers & Mathematics (100.0%), and Arts, Media & Entertainment (100.0%), while the most female-oriented occupations are Business & Financial (100.0%), Education Instruction & Library (100.0%), and Community & Social Service (64.7%).
| Occupation | Male | Female |
| Management | 0 (0.0%) | 0 (0.0%) |
| Business & Financial | 0 (0.0%) | 6 (100.0%) |
| Computers, Engineering & Science | 8 (100.0%) | 0 (0.0%) |
| Computers & Mathematics | 8 (100.0%) | 0 (0.0%) |
| Architecture & Engineering | 0 (0.0%) | 0 (0.0%) |
| Life, Physical & Social Science | 0 (0.0%) | 0 (0.0%) |
| Community & Social Service | 6 (35.3%) | 11 (64.7%) |
| Education, Arts & Media | 0 (0.0%) | 0 (0.0%) |
| Legal Services & Support | 0 (0.0%) | 0 (0.0%) |
| Education Instruction & Library | 0 (0.0%) | 11 (100.0%) |
| Arts, Media & Entertainment | 6 (100.0%) | 0 (0.0%) |
| Health Diagnosing & Treating | 0 (0.0%) | 0 (0.0%) |
| Health Technologists | 0 (0.0%) | 0 (0.0%) |
| Total (Category) | 14 (45.2%) | 17 (54.8%) |
| Total (Overall) | 109 (56.8%) | 83 (43.2%) |
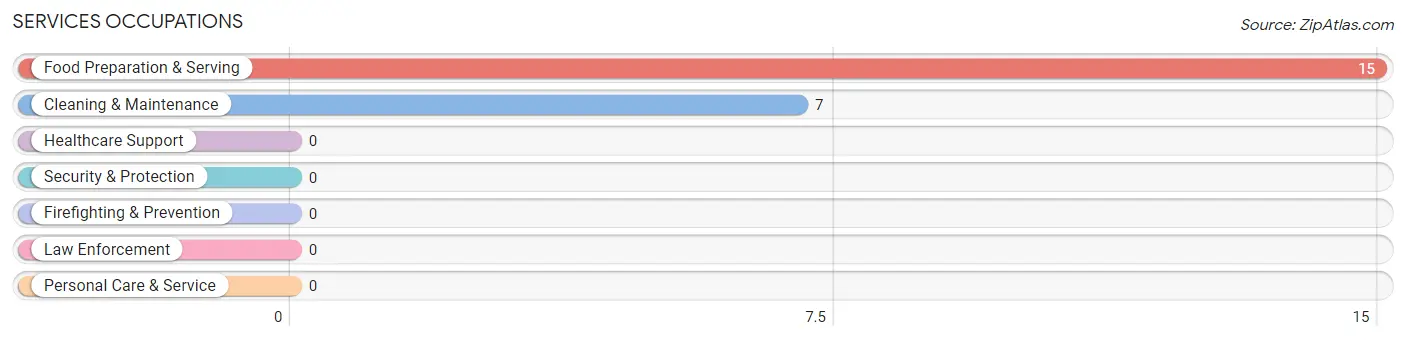
Services Occupations
The most common Services occupations in Naturita are Food Preparation & Serving (15 | 7.8%), and Cleaning & Maintenance (7 | 3.6%).
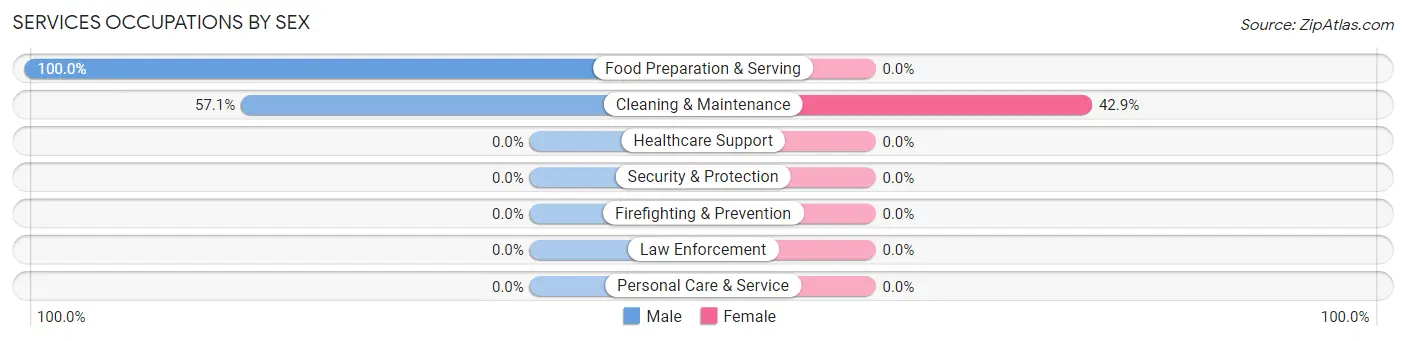
Services Occupations by Sex
| Occupation | Male | Female |
| Healthcare Support | 0 (0.0%) | 0 (0.0%) |
| Security & Protection | 0 (0.0%) | 0 (0.0%) |
| Firefighting & Prevention | 0 (0.0%) | 0 (0.0%) |
| Law Enforcement | 0 (0.0%) | 0 (0.0%) |
| Food Preparation & Serving | 15 (100.0%) | 0 (0.0%) |
| Cleaning & Maintenance | 4 (57.1%) | 3 (42.9%) |
| Personal Care & Service | 0 (0.0%) | 0 (0.0%) |
| Total (Category) | 19 (86.4%) | 3 (13.6%) |
| Total (Overall) | 109 (56.8%) | 83 (43.2%) |
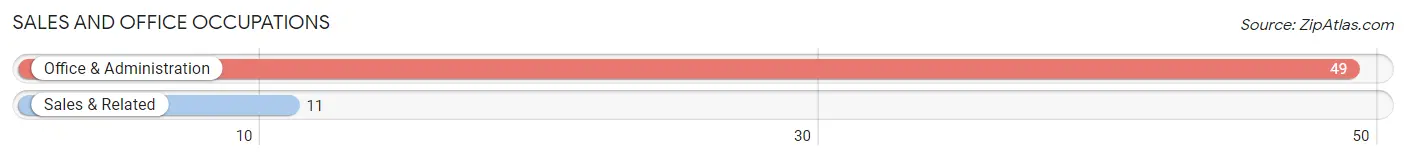
Sales and Office Occupations
The most common Sales and Office occupations in Naturita are Office & Administration (49 | 25.5%), and Sales & Related (11 | 5.7%).
Sales and Office Occupations by Sex
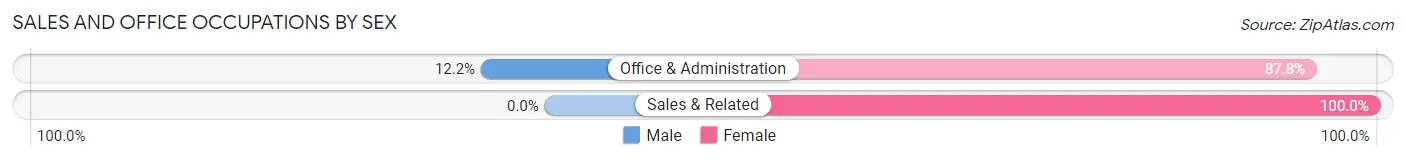
| Occupation | Male | Female |
| Sales & Related | 0 (0.0%) | 11 (100.0%) |
| Office & Administration | 6 (12.2%) | 43 (87.8%) |
| Total (Category) | 6 (10.0%) | 54 (90.0%) |
| Total (Overall) | 109 (56.8%) | 83 (43.2%) |
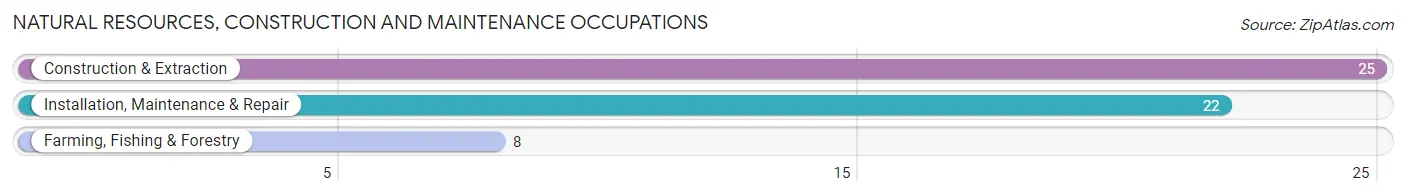
Natural Resources, Construction and Maintenance Occupations
The most common Natural Resources, Construction and Maintenance occupations in Naturita are Construction & Extraction (25 | 13.0%), Installation, Maintenance & Repair (22 | 11.5%), and Farming, Fishing & Forestry (8 | 4.2%).
Natural Resources, Construction and Maintenance Occupations by Sex
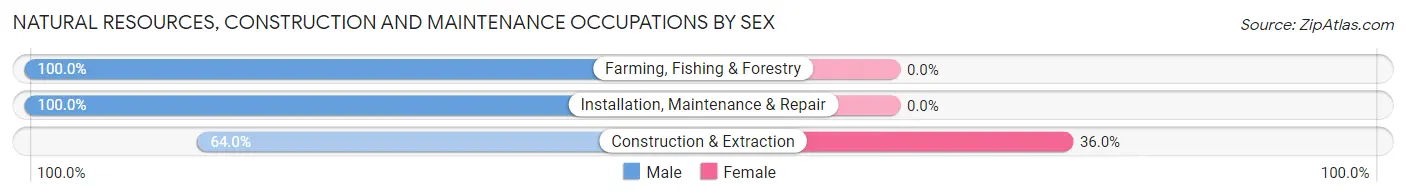
| Occupation | Male | Female |
| Farming, Fishing & Forestry | 8 (100.0%) | 0 (0.0%) |
| Construction & Extraction | 16 (64.0%) | 9 (36.0%) |
| Installation, Maintenance & Repair | 22 (100.0%) | 0 (0.0%) |
| Total (Category) | 46 (83.6%) | 9 (16.4%) |
| Total (Overall) | 109 (56.8%) | 83 (43.2%) |
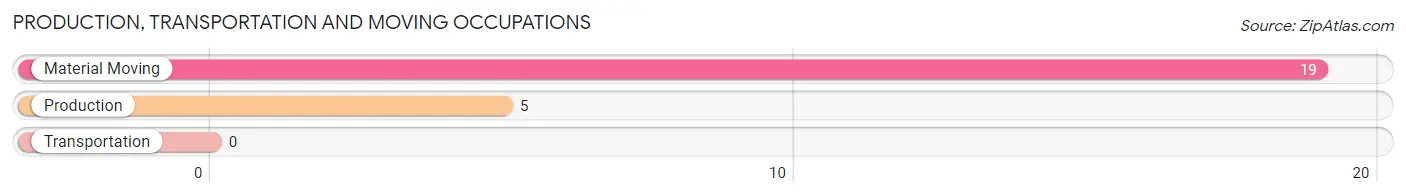
Production, Transportation and Moving Occupations
The most common Production, Transportation and Moving occupations in Naturita are Material Moving (19 | 9.9%), and Production (5 | 2.6%).
Production, Transportation and Moving Occupations by Sex
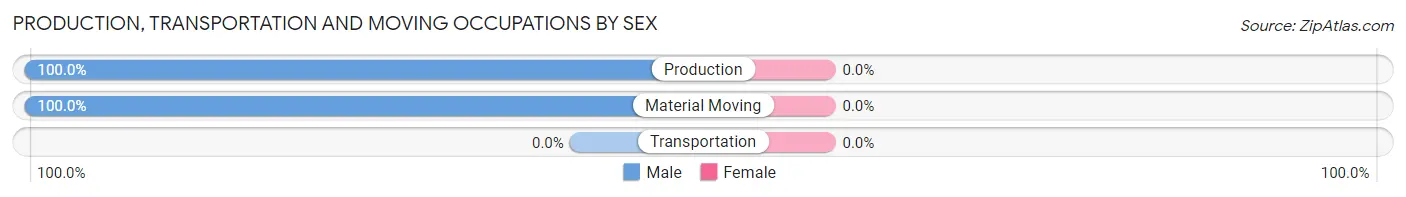
| Occupation | Male | Female |
| Production | 5 (100.0%) | 0 (0.0%) |
| Transportation | 0 (0.0%) | 0 (0.0%) |
| Material Moving | 19 (100.0%) | 0 (0.0%) |
| Total (Category) | 24 (100.0%) | 0 (0.0%) |
| Total (Overall) | 109 (56.8%) | 83 (43.2%) |
Employment Industries by Sex in Naturita
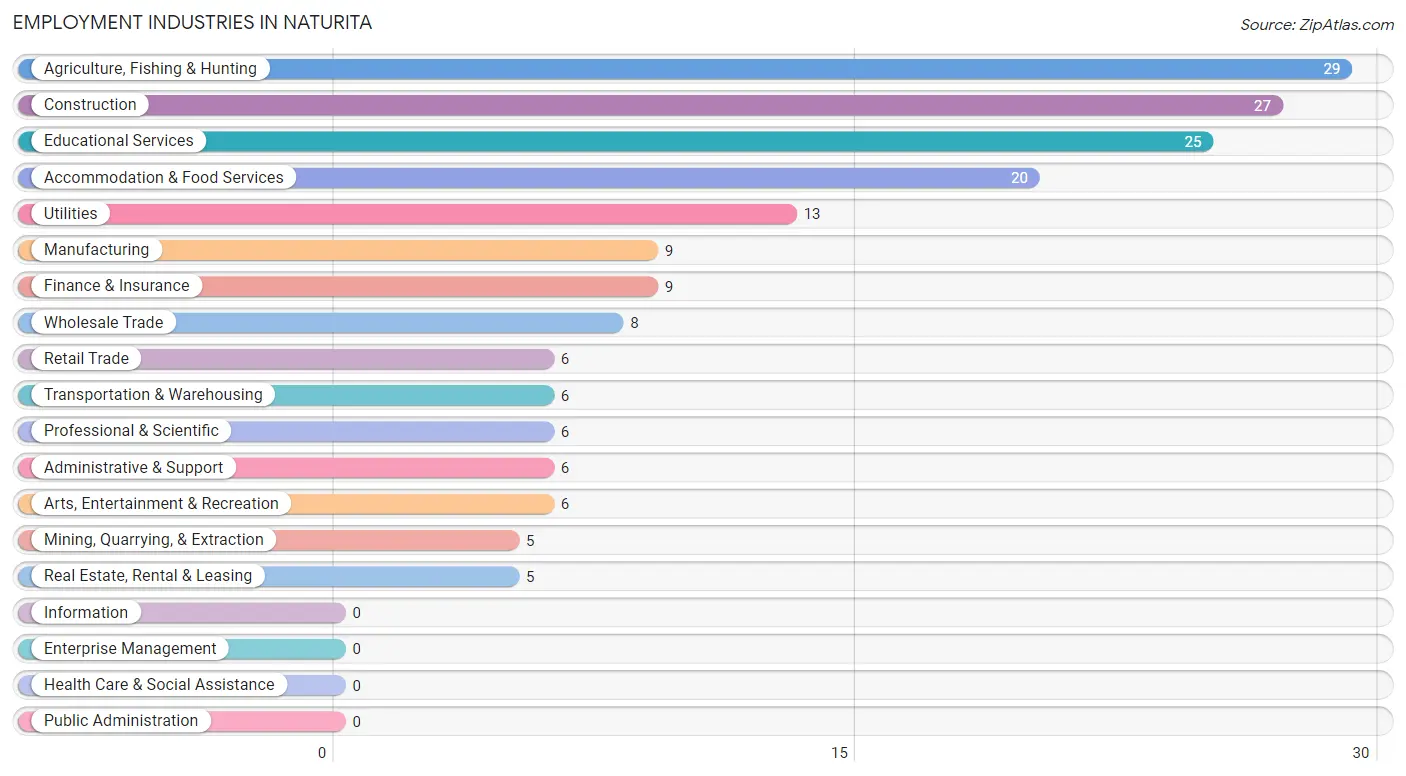
Employment Industries in Naturita
The major employment industries in Naturita include Agriculture, Fishing & Hunting (29 | 15.1%), Construction (27 | 14.1%), Educational Services (25 | 13.0%), Accommodation & Food Services (20 | 10.4%), and Utilities (13 | 6.8%).
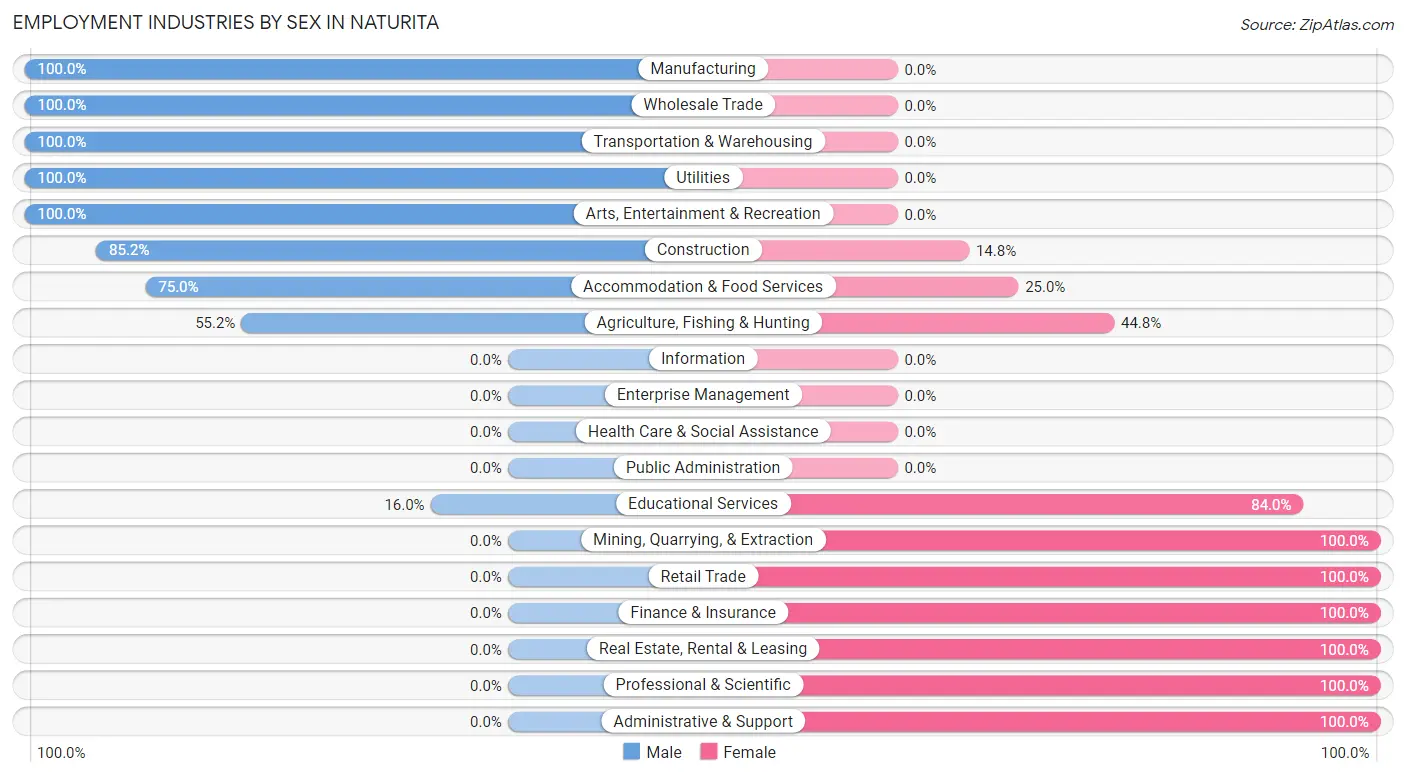
Employment Industries by Sex in Naturita
The Naturita industries that see more men than women are Manufacturing (100.0%), Wholesale Trade (100.0%), and Transportation & Warehousing (100.0%), whereas the industries that tend to have a higher number of women are Mining, Quarrying, & Extraction (100.0%), Retail Trade (100.0%), and Finance & Insurance (100.0%).
| Industry | Male | Female |
| Agriculture, Fishing & Hunting | 16 (55.2%) | 13 (44.8%) |
| Mining, Quarrying, & Extraction | 0 (0.0%) | 5 (100.0%) |
| Construction | 23 (85.2%) | 4 (14.8%) |
| Manufacturing | 9 (100.0%) | 0 (0.0%) |
| Wholesale Trade | 8 (100.0%) | 0 (0.0%) |
| Retail Trade | 0 (0.0%) | 6 (100.0%) |
| Transportation & Warehousing | 6 (100.0%) | 0 (0.0%) |
| Utilities | 13 (100.0%) | 0 (0.0%) |
| Information | 0 (0.0%) | 0 (0.0%) |
| Finance & Insurance | 0 (0.0%) | 9 (100.0%) |
| Real Estate, Rental & Leasing | 0 (0.0%) | 5 (100.0%) |
| Professional & Scientific | 0 (0.0%) | 6 (100.0%) |
| Enterprise Management | 0 (0.0%) | 0 (0.0%) |
| Administrative & Support | 0 (0.0%) | 6 (100.0%) |
| Educational Services | 4 (16.0%) | 21 (84.0%) |
| Health Care & Social Assistance | 0 (0.0%) | 0 (0.0%) |
| Arts, Entertainment & Recreation | 6 (100.0%) | 0 (0.0%) |
| Accommodation & Food Services | 15 (75.0%) | 5 (25.0%) |
| Public Administration | 0 (0.0%) | 0 (0.0%) |
| Total | 109 (56.8%) | 83 (43.2%) |
Education in Naturita
School Enrollment in Naturita
The most common levels of schooling among the 61 students in Naturita are elementary school (24 | 39.3%), nursery / preschool (15 | 24.6%), and high school (15 | 24.6%).
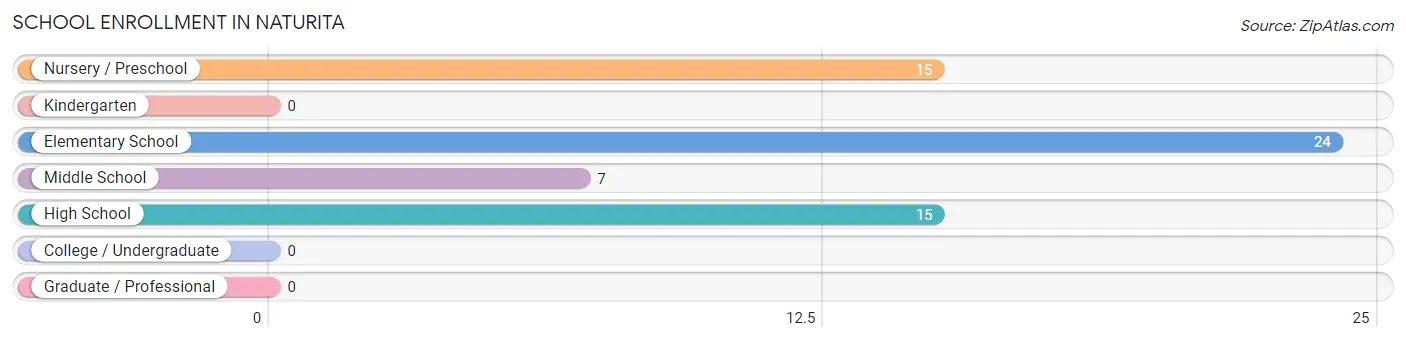
| School Level | # Students | % Students |
| Nursery / Preschool | 15 | 24.6% |
| Kindergarten | 0 | 0.0% |
| Elementary School | 24 | 39.3% |
| Middle School | 7 | 11.5% |
| High School | 15 | 24.6% |
| College / Undergraduate | 0 | 0.0% |
| Graduate / Professional | 0 | 0.0% |
| Total | 61 | 100.0% |
School Enrollment by Age by Funding Source in Naturita
Out of a total of 61 students who are enrolled in schools in Naturita, 9 (14.8%) attend a private institution, while the remaining 52 (85.2%) are enrolled in public schools. The age group of 15 to 17 year olds has the highest likelihood of being enrolled in private schools, with 7 (46.7% in the age bracket) enrolled. Conversely, the age group of 3 to 4 year olds has the lowest likelihood of being enrolled in a private school, with 8 (100.0% in the age bracket) attending a public institution.
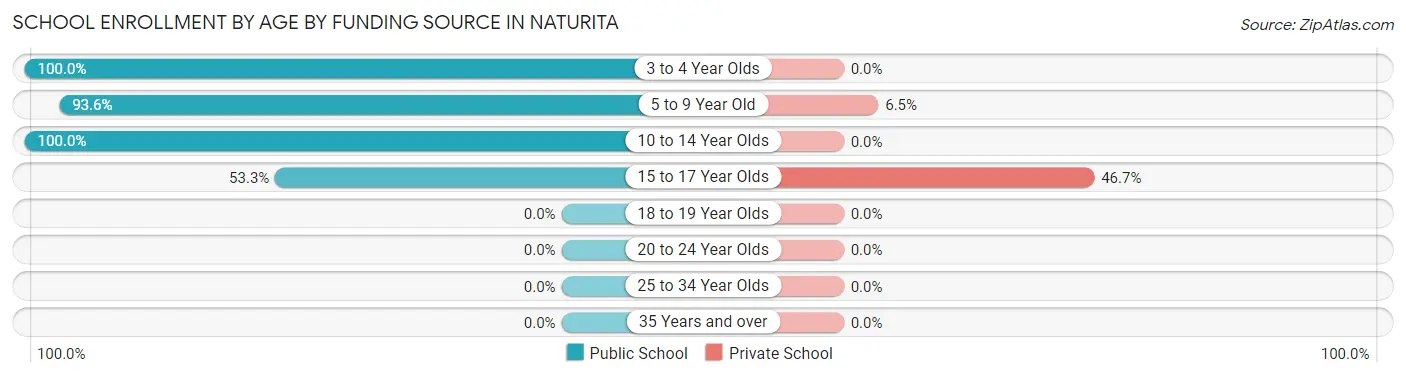
| Age Bracket | Public School | Private School |
| 3 to 4 Year Olds | 8 (100.0%) | 0 (0.0%) |
| 5 to 9 Year Old | 29 (93.5%) | 2 (6.5%) |
| 10 to 14 Year Olds | 7 (100.0%) | 0 (0.0%) |
| 15 to 17 Year Olds | 8 (53.3%) | 7 (46.7%) |
| 18 to 19 Year Olds | 0 (0.0%) | 0 (0.0%) |
| 20 to 24 Year Olds | 0 (0.0%) | 0 (0.0%) |
| 25 to 34 Year Olds | 0 (0.0%) | 0 (0.0%) |
| 35 Years and over | 0 (0.0%) | 0 (0.0%) |
| Total | 52 (85.2%) | 9 (14.8%) |
Educational Attainment by Field of Study in Naturita
Education (8 | 25.0%), arts & humanities (7 | 21.9%), social sciences (6 | 18.8%), business (6 | 18.8%), and engineering (5 | 15.6%) are the most common fields of study among 32 individuals in Naturita who have obtained a bachelor's degree or higher.
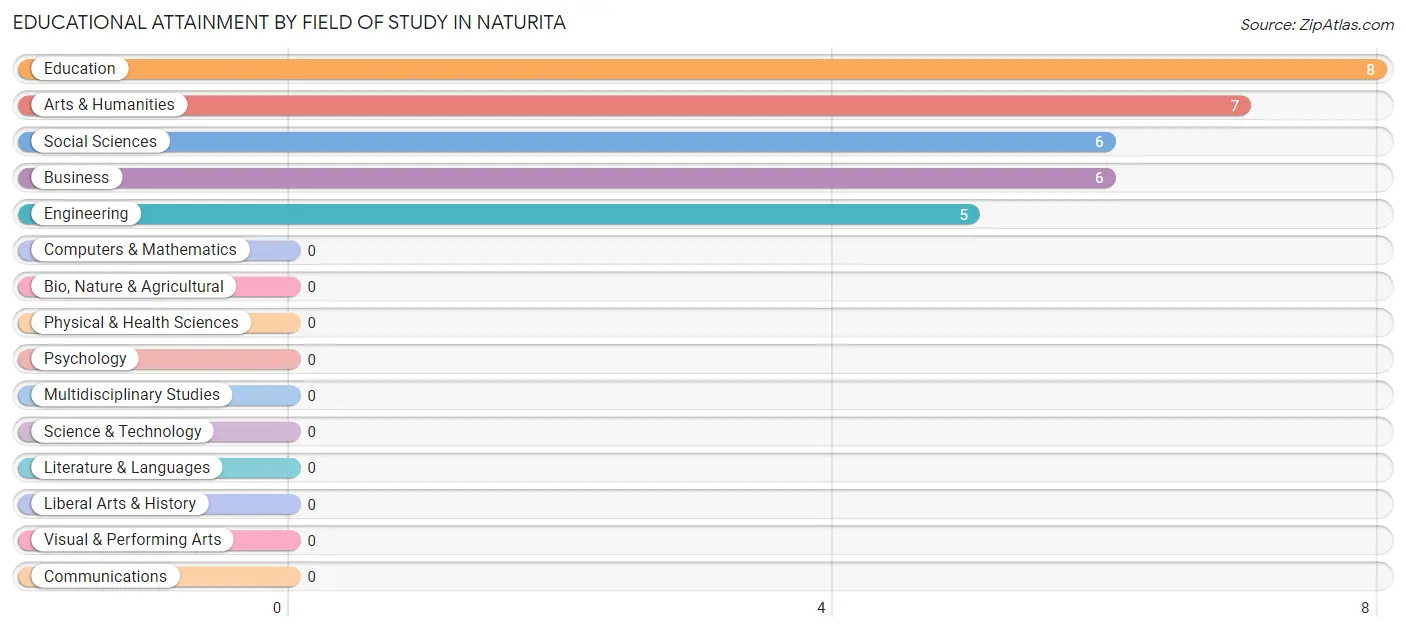
| Field of Study | # Graduates | % Graduates |
| Computers & Mathematics | 0 | 0.0% |
| Bio, Nature & Agricultural | 0 | 0.0% |
| Physical & Health Sciences | 0 | 0.0% |
| Psychology | 0 | 0.0% |
| Social Sciences | 6 | 18.8% |
| Engineering | 5 | 15.6% |
| Multidisciplinary Studies | 0 | 0.0% |
| Science & Technology | 0 | 0.0% |
| Business | 6 | 18.8% |
| Education | 8 | 25.0% |
| Literature & Languages | 0 | 0.0% |
| Liberal Arts & History | 0 | 0.0% |
| Visual & Performing Arts | 0 | 0.0% |
| Communications | 0 | 0.0% |
| Arts & Humanities | 7 | 21.9% |
| Total | 32 | 100.0% |
Transportation & Commute in Naturita
Vehicle Availability by Sex in Naturita
The most prevalent vehicle ownership categories in Naturita are males with 2 vehicles (49, accounting for 45.0%) and females with 2 vehicles (50, making up 59.0%).
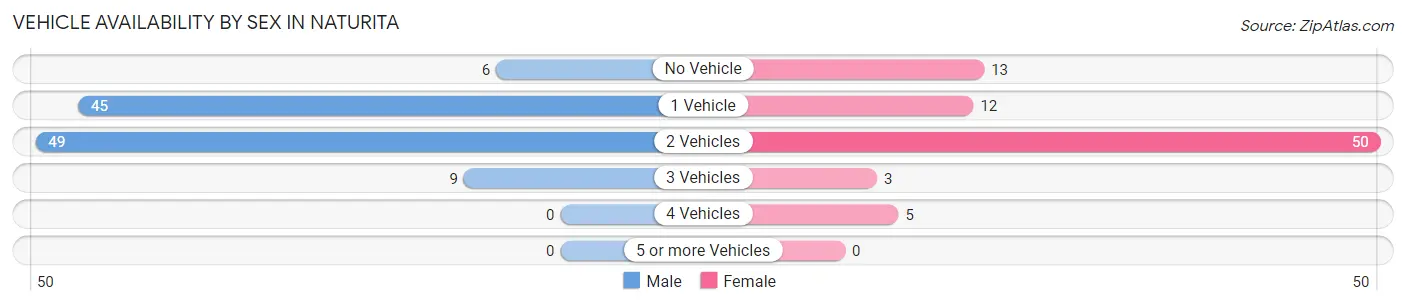
| Vehicles Available | Male | Female |
| No Vehicle | 6 (5.5%) | 13 (15.7%) |
| 1 Vehicle | 45 (41.3%) | 12 (14.5%) |
| 2 Vehicles | 49 (45.0%) | 50 (60.2%) |
| 3 Vehicles | 9 (8.3%) | 3 (3.6%) |
| 4 Vehicles | 0 (0.0%) | 5 (6.0%) |
| 5 or more Vehicles | 0 (0.0%) | 0 (0.0%) |
| Total | 109 (100.0%) | 83 (100.0%) |
Commute Time in Naturita
The most frequently occuring commute durations in Naturita are 5 to 9 minutes (63 commuters, 34.1%), less than 5 minutes (30 commuters, 16.2%), and 20 to 24 minutes (21 commuters, 11.4%).
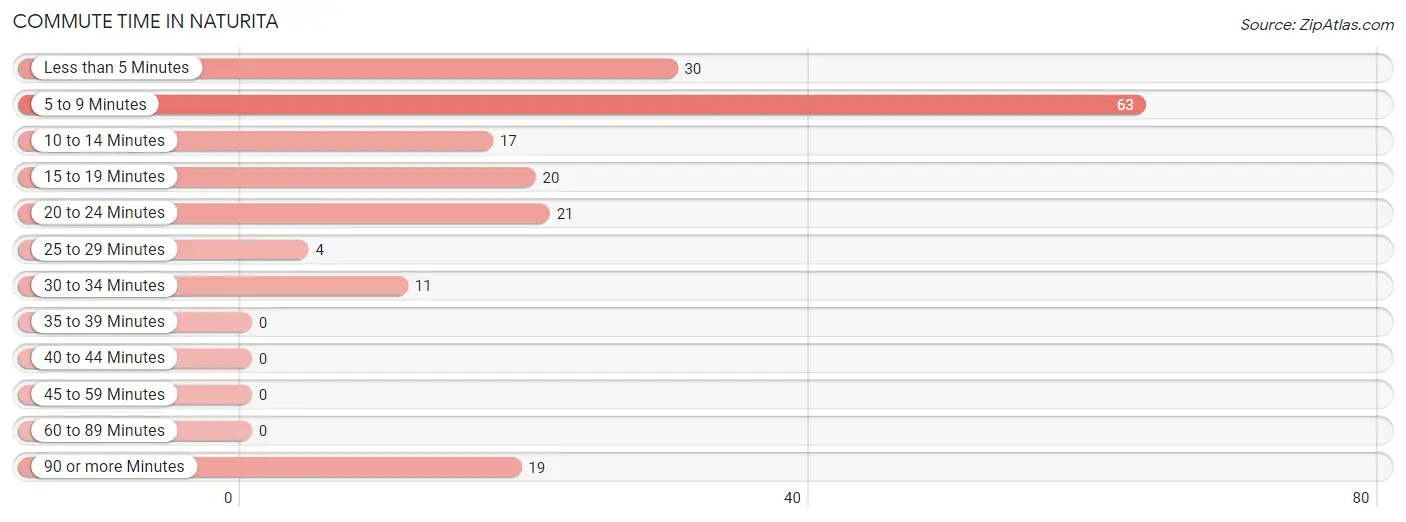
| Commute Time | # Commuters | % Commuters |
| Less than 5 Minutes | 30 | 16.2% |
| 5 to 9 Minutes | 63 | 34.1% |
| 10 to 14 Minutes | 17 | 9.2% |
| 15 to 19 Minutes | 20 | 10.8% |
| 20 to 24 Minutes | 21 | 11.4% |
| 25 to 29 Minutes | 4 | 2.2% |
| 30 to 34 Minutes | 11 | 5.9% |
| 35 to 39 Minutes | 0 | 0.0% |
| 40 to 44 Minutes | 0 | 0.0% |
| 45 to 59 Minutes | 0 | 0.0% |
| 60 to 89 Minutes | 0 | 0.0% |
| 90 or more Minutes | 19 | 10.3% |
Commute Time by Sex in Naturita
The most common commute times in Naturita are 5 to 9 minutes (35 commuters, 32.1%) for males and 5 to 9 minutes (28 commuters, 36.8%) for females.
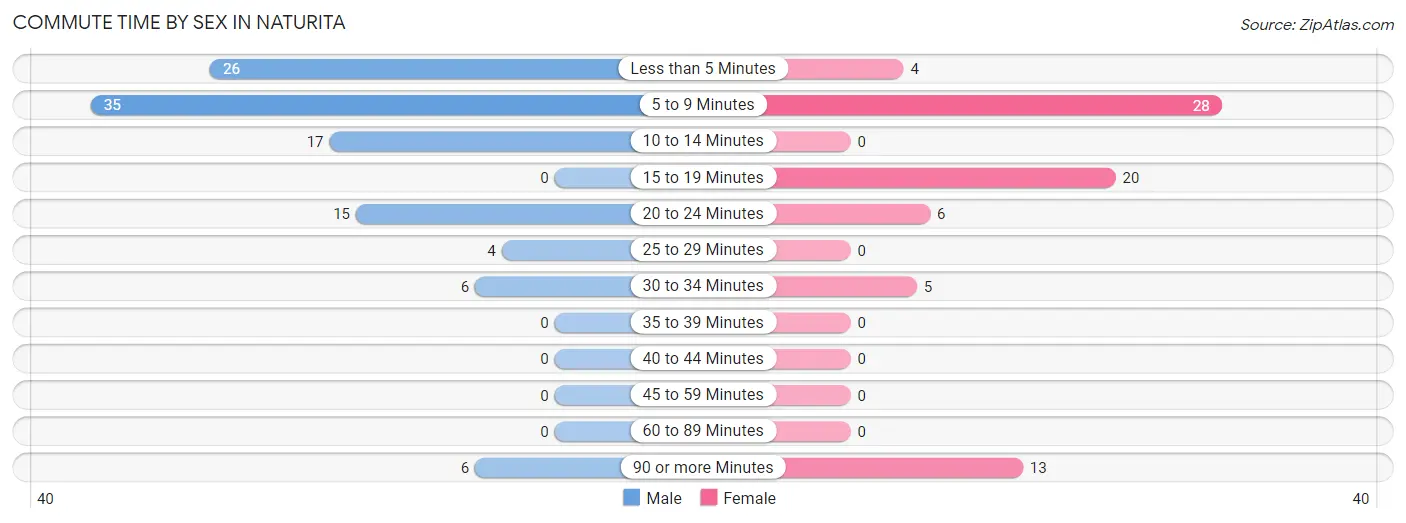
| Commute Time | Male | Female |
| Less than 5 Minutes | 26 (23.8%) | 4 (5.3%) |
| 5 to 9 Minutes | 35 (32.1%) | 28 (36.8%) |
| 10 to 14 Minutes | 17 (15.6%) | 0 (0.0%) |
| 15 to 19 Minutes | 0 (0.0%) | 20 (26.3%) |
| 20 to 24 Minutes | 15 (13.8%) | 6 (7.9%) |
| 25 to 29 Minutes | 4 (3.7%) | 0 (0.0%) |
| 30 to 34 Minutes | 6 (5.5%) | 5 (6.6%) |
| 35 to 39 Minutes | 0 (0.0%) | 0 (0.0%) |
| 40 to 44 Minutes | 0 (0.0%) | 0 (0.0%) |
| 45 to 59 Minutes | 0 (0.0%) | 0 (0.0%) |
| 60 to 89 Minutes | 0 (0.0%) | 0 (0.0%) |
| 90 or more Minutes | 6 (5.5%) | 13 (17.1%) |
Time of Departure to Work by Sex in Naturita
The most frequent times of departure to work in Naturita are 6:30 AM to 6:59 AM (40, 36.7%) for males and 6:30 AM to 6:59 AM (32, 42.1%) for females.
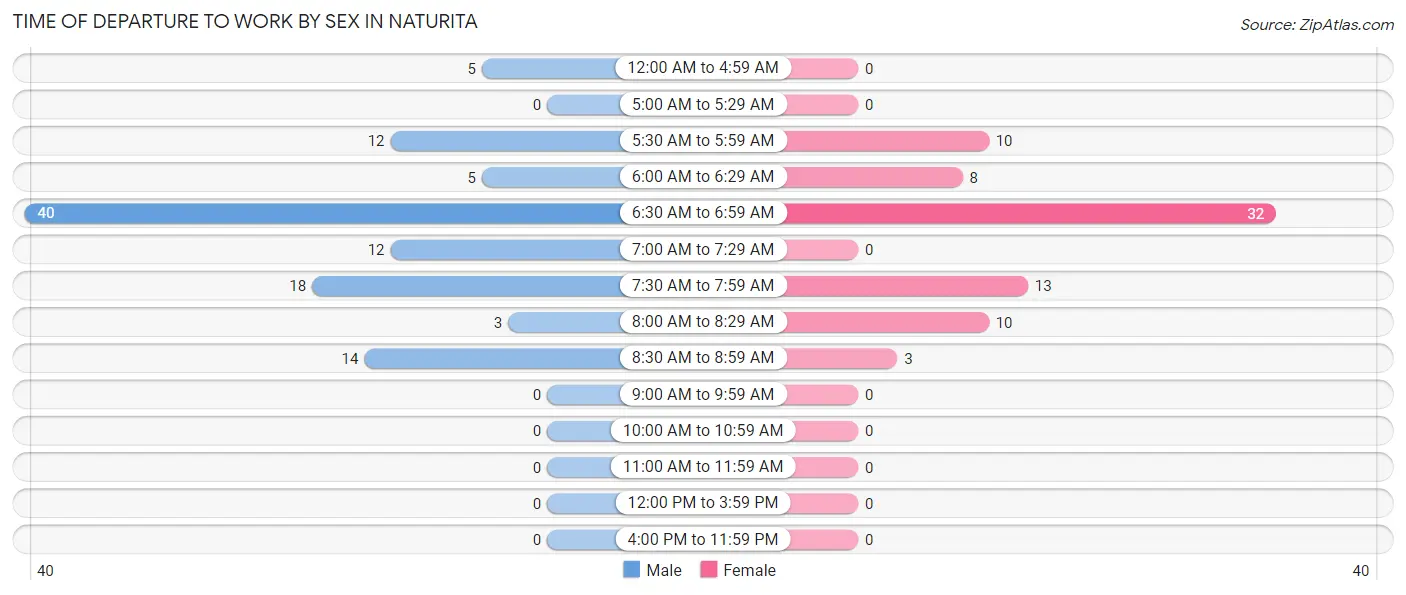
| Time of Departure | Male | Female |
| 12:00 AM to 4:59 AM | 5 (4.6%) | 0 (0.0%) |
| 5:00 AM to 5:29 AM | 0 (0.0%) | 0 (0.0%) |
| 5:30 AM to 5:59 AM | 12 (11.0%) | 10 (13.2%) |
| 6:00 AM to 6:29 AM | 5 (4.6%) | 8 (10.5%) |
| 6:30 AM to 6:59 AM | 40 (36.7%) | 32 (42.1%) |
| 7:00 AM to 7:29 AM | 12 (11.0%) | 0 (0.0%) |
| 7:30 AM to 7:59 AM | 18 (16.5%) | 13 (17.1%) |
| 8:00 AM to 8:29 AM | 3 (2.8%) | 10 (13.2%) |
| 8:30 AM to 8:59 AM | 14 (12.8%) | 3 (4.0%) |
| 9:00 AM to 9:59 AM | 0 (0.0%) | 0 (0.0%) |
| 10:00 AM to 10:59 AM | 0 (0.0%) | 0 (0.0%) |
| 11:00 AM to 11:59 AM | 0 (0.0%) | 0 (0.0%) |
| 12:00 PM to 3:59 PM | 0 (0.0%) | 0 (0.0%) |
| 4:00 PM to 11:59 PM | 0 (0.0%) | 0 (0.0%) |
| Total | 109 (100.0%) | 76 (100.0%) |
Housing Occupancy in Naturita
Occupancy by Ownership in Naturita
Of the total 222 dwellings in Naturita, owner-occupied units account for 174 (78.4%), while renter-occupied units make up 48 (21.6%).
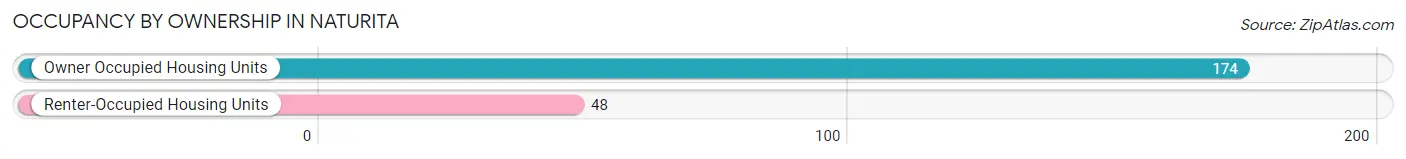
| Occupancy | # Housing Units | % Housing Units |
| Owner Occupied Housing Units | 174 | 78.4% |
| Renter-Occupied Housing Units | 48 | 21.6% |
| Total Occupied Housing Units | 222 | 100.0% |
Occupancy by Household Size in Naturita
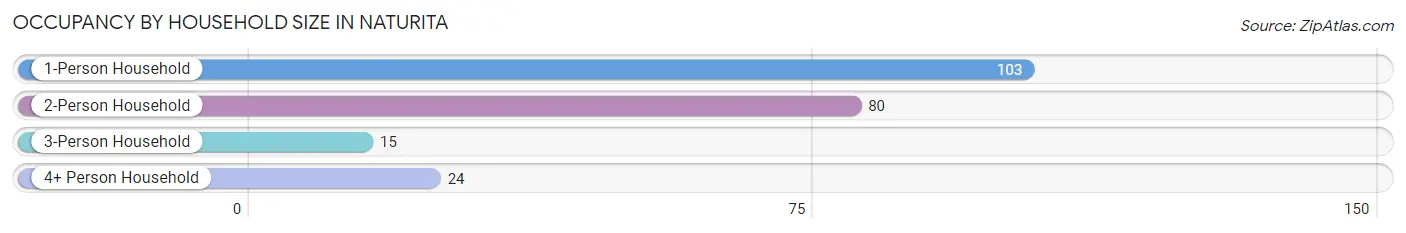
| Household Size | # Housing Units | % Housing Units |
| 1-Person Household | 103 | 46.4% |
| 2-Person Household | 80 | 36.0% |
| 3-Person Household | 15 | 6.8% |
| 4+ Person Household | 24 | 10.8% |
| Total Housing Units | 222 | 100.0% |
Occupancy by Ownership by Household Size in Naturita
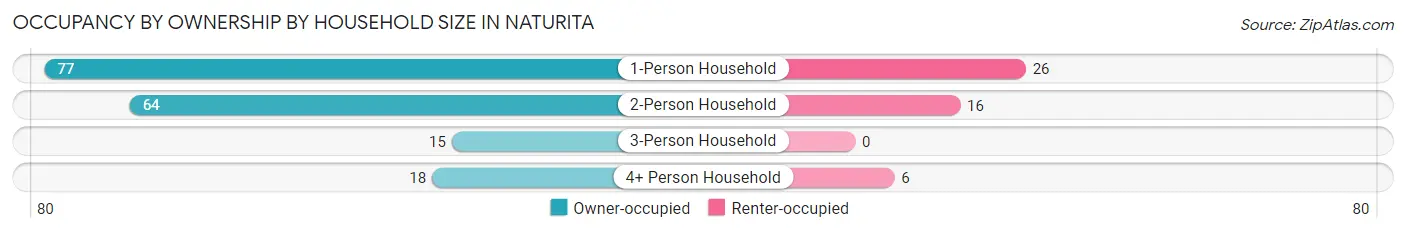
| Household Size | Owner-occupied | Renter-occupied |
| 1-Person Household | 77 (74.8%) | 26 (25.2%) |
| 2-Person Household | 64 (80.0%) | 16 (20.0%) |
| 3-Person Household | 15 (100.0%) | 0 (0.0%) |
| 4+ Person Household | 18 (75.0%) | 6 (25.0%) |
| Total Housing Units | 174 (78.4%) | 48 (21.6%) |
Occupancy by Educational Attainment in Naturita
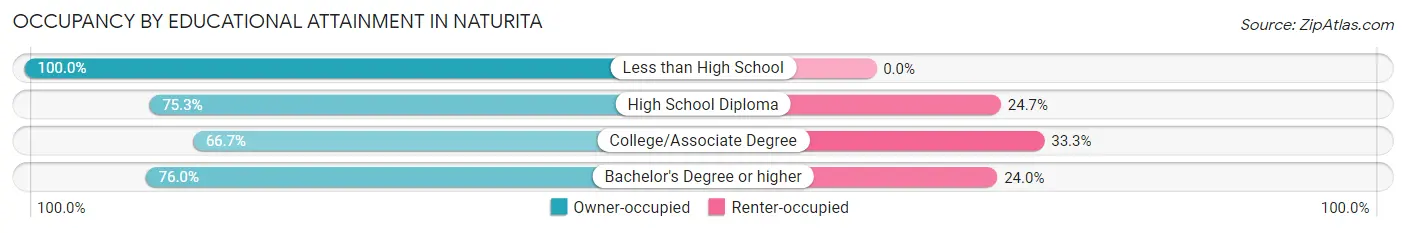
| Household Size | Owner-occupied | Renter-occupied |
| Less than High School | 48 (100.0%) | 0 (0.0%) |
| High School Diploma | 67 (75.3%) | 22 (24.7%) |
| College/Associate Degree | 40 (66.7%) | 20 (33.3%) |
| Bachelor's Degree or higher | 19 (76.0%) | 6 (24.0%) |
Occupancy by Age of Householder in Naturita
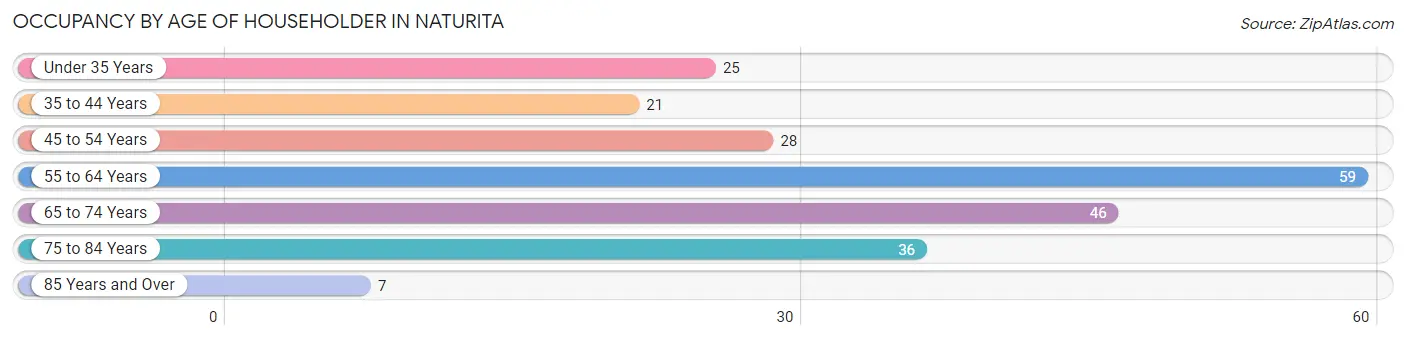
| Age Bracket | # Households | % Households |
| Under 35 Years | 25 | 11.3% |
| 35 to 44 Years | 21 | 9.5% |
| 45 to 54 Years | 28 | 12.6% |
| 55 to 64 Years | 59 | 26.6% |
| 65 to 74 Years | 46 | 20.7% |
| 75 to 84 Years | 36 | 16.2% |
| 85 Years and Over | 7 | 3.2% |
| Total | 222 | 100.0% |
Housing Finances in Naturita
Median Income by Occupancy in Naturita
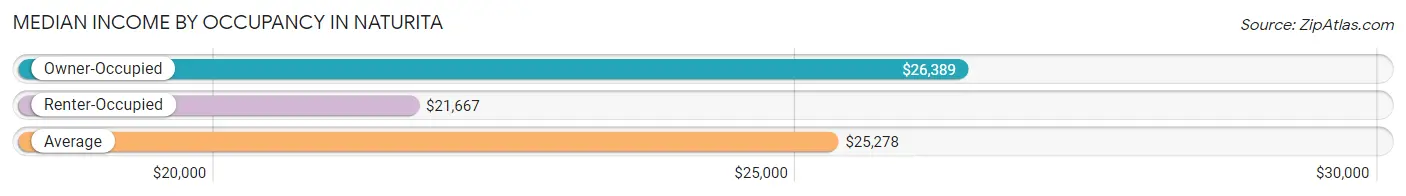
| Occupancy Type | # Households | Median Income |
| Owner-Occupied | 174 (78.4%) | $26,389 |
| Renter-Occupied | 48 (21.6%) | $21,667 |
| Average | 222 (100.0%) | $25,278 |
Occupancy by Householder Income Bracket in Naturita
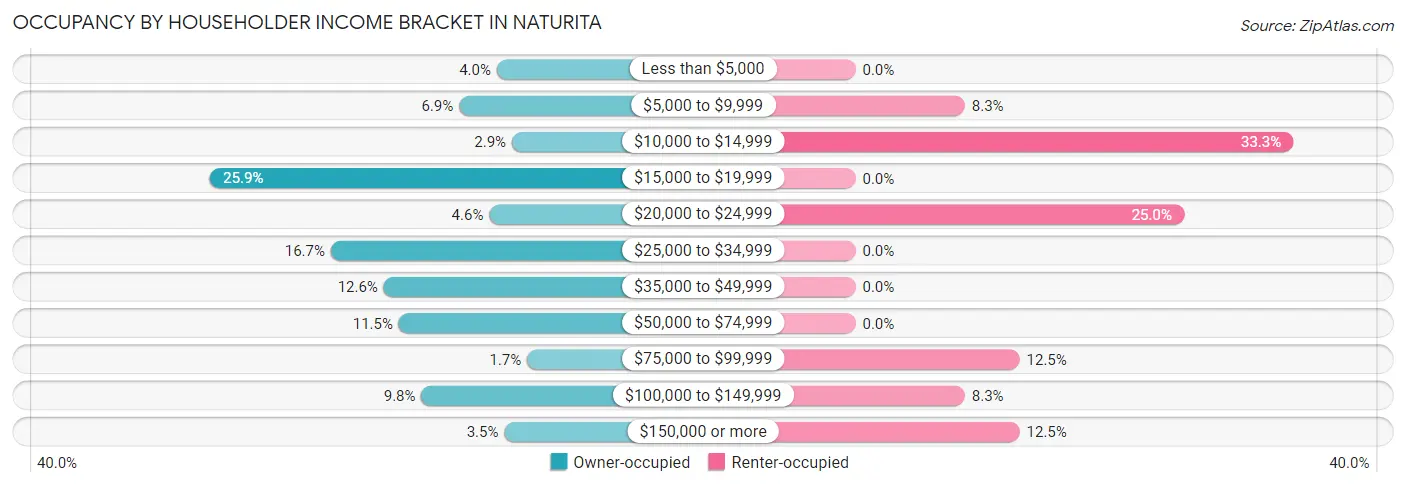
| Income Bracket | Owner-occupied | Renter-occupied |
| Less than $5,000 | 7 (4.0%) | 0 (0.0%) |
| $5,000 to $9,999 | 12 (6.9%) | 4 (8.3%) |
| $10,000 to $14,999 | 5 (2.9%) | 16 (33.3%) |
| $15,000 to $19,999 | 45 (25.9%) | 0 (0.0%) |
| $20,000 to $24,999 | 8 (4.6%) | 12 (25.0%) |
| $25,000 to $34,999 | 29 (16.7%) | 0 (0.0%) |
| $35,000 to $49,999 | 22 (12.6%) | 0 (0.0%) |
| $50,000 to $74,999 | 20 (11.5%) | 0 (0.0%) |
| $75,000 to $99,999 | 3 (1.7%) | 6 (12.5%) |
| $100,000 to $149,999 | 17 (9.8%) | 4 (8.3%) |
| $150,000 or more | 6 (3.5%) | 6 (12.5%) |
| Total | 174 (100.0%) | 48 (100.0%) |
Monthly Housing Cost Tiers in Naturita
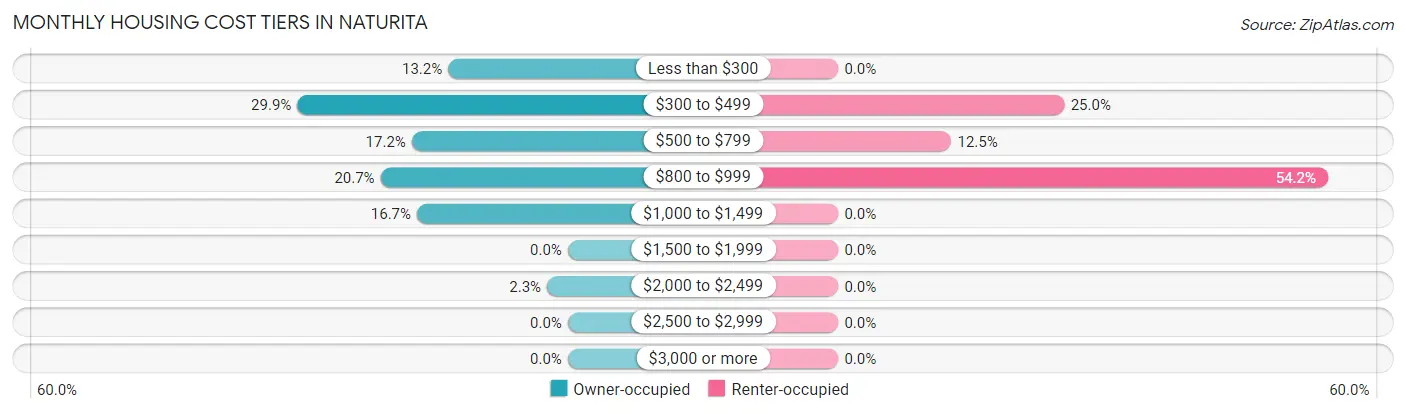
| Monthly Cost | Owner-occupied | Renter-occupied |
| Less than $300 | 23 (13.2%) | 0 (0.0%) |
| $300 to $499 | 52 (29.9%) | 12 (25.0%) |
| $500 to $799 | 30 (17.2%) | 6 (12.5%) |
| $800 to $999 | 36 (20.7%) | 26 (54.2%) |
| $1,000 to $1,499 | 29 (16.7%) | 0 (0.0%) |
| $1,500 to $1,999 | 0 (0.0%) | 0 (0.0%) |
| $2,000 to $2,499 | 4 (2.3%) | 0 (0.0%) |
| $2,500 to $2,999 | 0 (0.0%) | 0 (0.0%) |
| $3,000 or more | 0 (0.0%) | 0 (0.0%) |
| Total | 174 (100.0%) | 48 (100.0%) |
Physical Housing Characteristics in Naturita
Housing Structures in Naturita
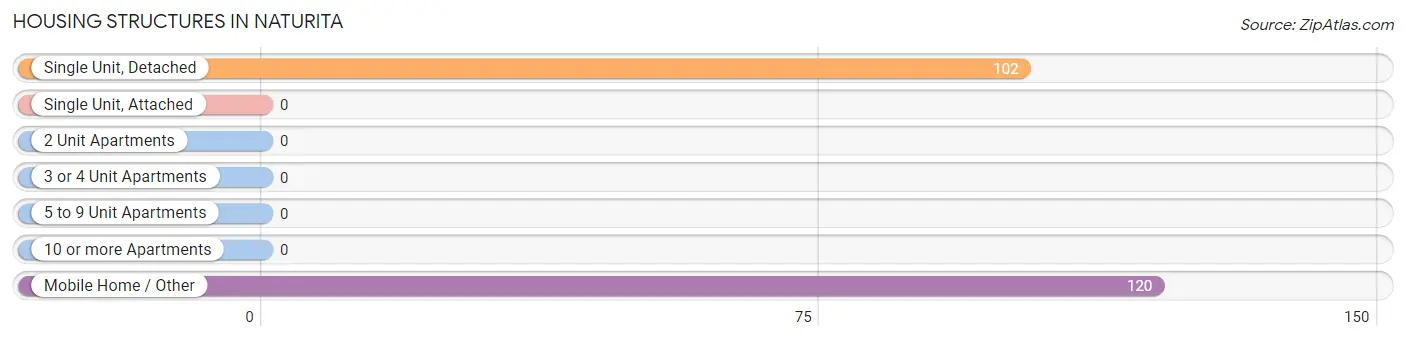
| Structure Type | # Housing Units | % Housing Units |
| Single Unit, Detached | 102 | 46.0% |
| Single Unit, Attached | 0 | 0.0% |
| 2 Unit Apartments | 0 | 0.0% |
| 3 or 4 Unit Apartments | 0 | 0.0% |
| 5 to 9 Unit Apartments | 0 | 0.0% |
| 10 or more Apartments | 0 | 0.0% |
| Mobile Home / Other | 120 | 54.0% |
| Total | 222 | 100.0% |
Housing Structures by Occupancy in Naturita
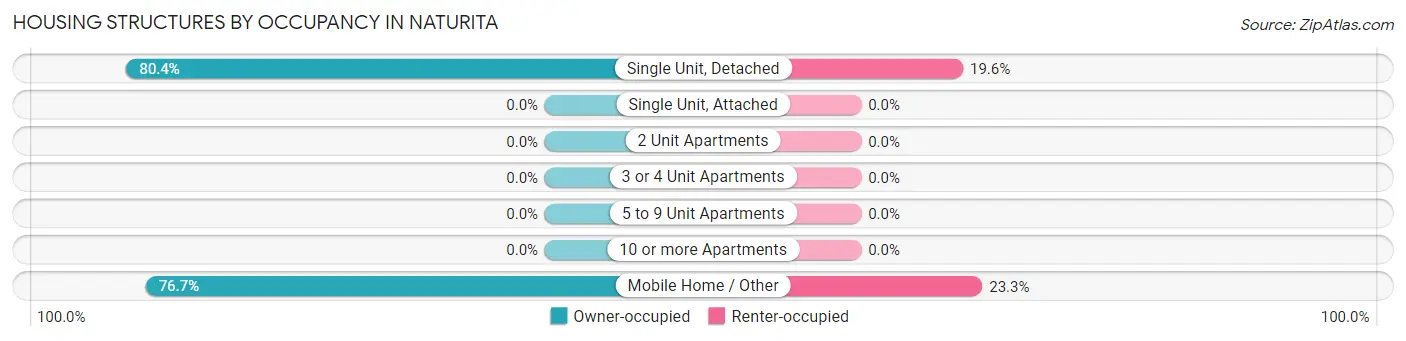
| Structure Type | Owner-occupied | Renter-occupied |
| Single Unit, Detached | 82 (80.4%) | 20 (19.6%) |
| Single Unit, Attached | 0 (0.0%) | 0 (0.0%) |
| 2 Unit Apartments | 0 (0.0%) | 0 (0.0%) |
| 3 or 4 Unit Apartments | 0 (0.0%) | 0 (0.0%) |
| 5 to 9 Unit Apartments | 0 (0.0%) | 0 (0.0%) |
| 10 or more Apartments | 0 (0.0%) | 0 (0.0%) |
| Mobile Home / Other | 92 (76.7%) | 28 (23.3%) |
| Total | 174 (78.4%) | 48 (21.6%) |
Housing Structures by Number of Rooms in Naturita
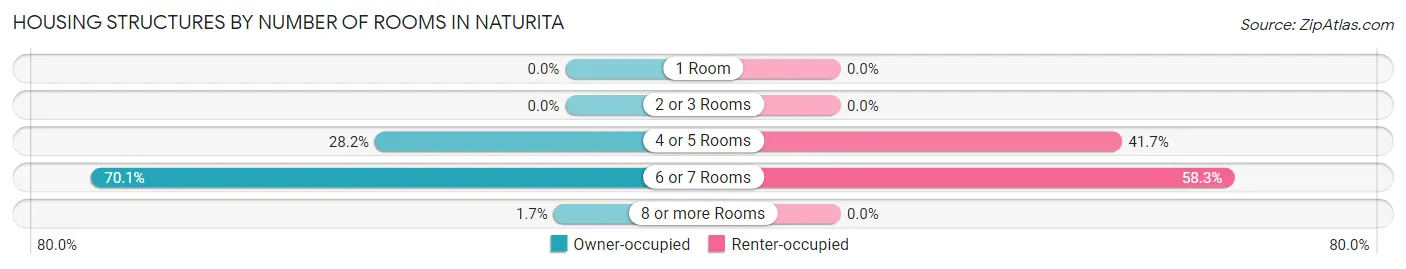
| Number of Rooms | Owner-occupied | Renter-occupied |
| 1 Room | 0 (0.0%) | 0 (0.0%) |
| 2 or 3 Rooms | 0 (0.0%) | 0 (0.0%) |
| 4 or 5 Rooms | 49 (28.2%) | 20 (41.7%) |
| 6 or 7 Rooms | 122 (70.1%) | 28 (58.3%) |
| 8 or more Rooms | 3 (1.7%) | 0 (0.0%) |
| Total | 174 (100.0%) | 48 (100.0%) |
Housing Structure by Heating Type in Naturita
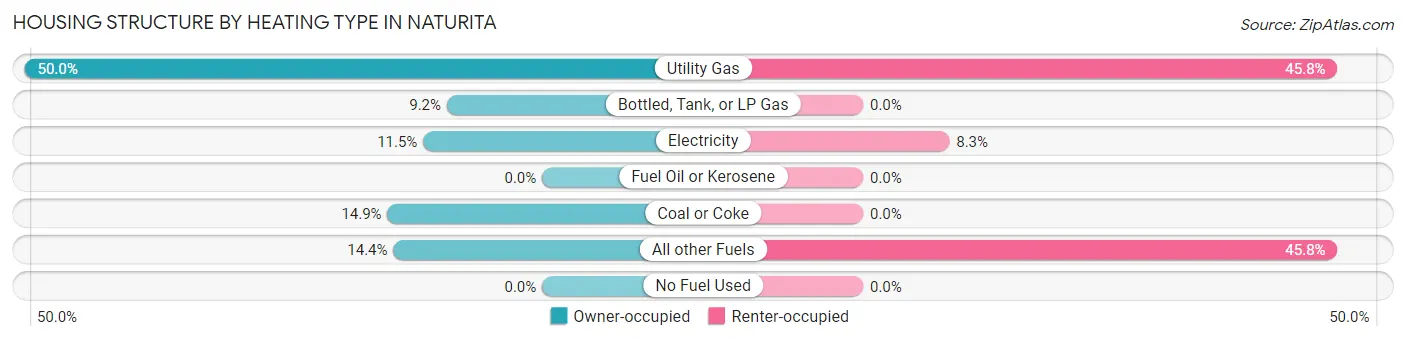
| Heating Type | Owner-occupied | Renter-occupied |
| Utility Gas | 87 (50.0%) | 22 (45.8%) |
| Bottled, Tank, or LP Gas | 16 (9.2%) | 0 (0.0%) |
| Electricity | 20 (11.5%) | 4 (8.3%) |
| Fuel Oil or Kerosene | 0 (0.0%) | 0 (0.0%) |
| Coal or Coke | 26 (14.9%) | 0 (0.0%) |
| All other Fuels | 25 (14.4%) | 22 (45.8%) |
| No Fuel Used | 0 (0.0%) | 0 (0.0%) |
| Total | 174 (100.0%) | 48 (100.0%) |
Household Vehicle Usage in Naturita
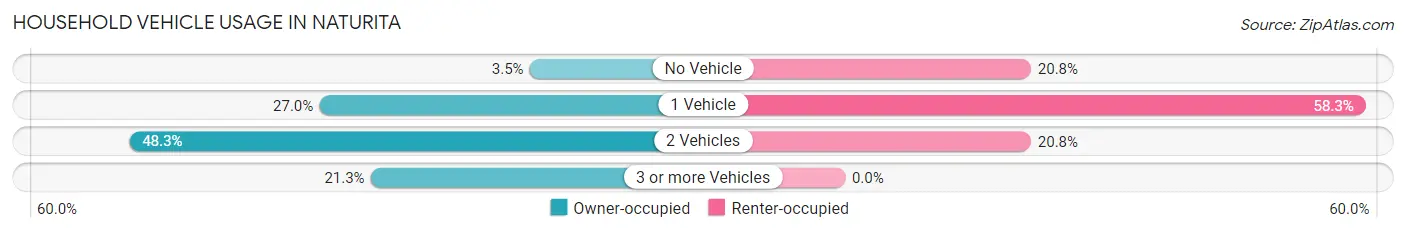
| Vehicles per Household | Owner-occupied | Renter-occupied |
| No Vehicle | 6 (3.5%) | 10 (20.8%) |
| 1 Vehicle | 47 (27.0%) | 28 (58.3%) |
| 2 Vehicles | 84 (48.3%) | 10 (20.8%) |
| 3 or more Vehicles | 37 (21.3%) | 0 (0.0%) |
| Total | 174 (100.0%) | 48 (100.0%) |
Real Estate & Mortgages in Naturita
Real Estate and Mortgage Overview in Naturita
| Characteristic | Without Mortgage | With Mortgage |
| Housing Units | 89 | 85 |
| Median Property Value | $110,600 | $166,300 |
| Median Household Income | $22,344 | $0 |
| Monthly Housing Costs | $338 | $0 |
| Real Estate Taxes | $315 | $0 |
Property Value by Mortgage Status in Naturita
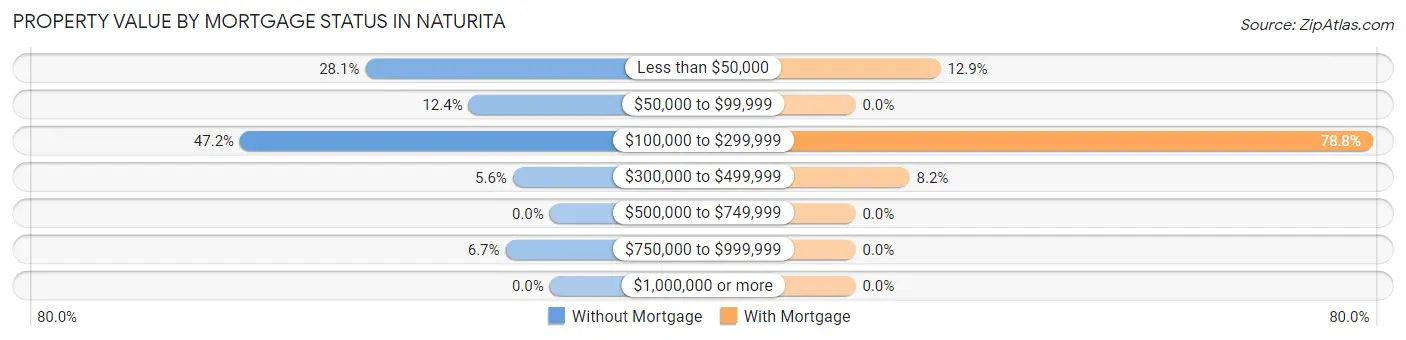
| Property Value | Without Mortgage | With Mortgage |
| Less than $50,000 | 25 (28.1%) | 11 (12.9%) |
| $50,000 to $99,999 | 11 (12.4%) | 0 (0.0%) |
| $100,000 to $299,999 | 42 (47.2%) | 67 (78.8%) |
| $300,000 to $499,999 | 5 (5.6%) | 7 (8.2%) |
| $500,000 to $749,999 | 0 (0.0%) | 0 (0.0%) |
| $750,000 to $999,999 | 6 (6.7%) | 0 (0.0%) |
| $1,000,000 or more | 0 (0.0%) | 0 (0.0%) |
| Total | 89 (100.0%) | 85 (100.0%) |
Household Income by Mortgage Status in Naturita
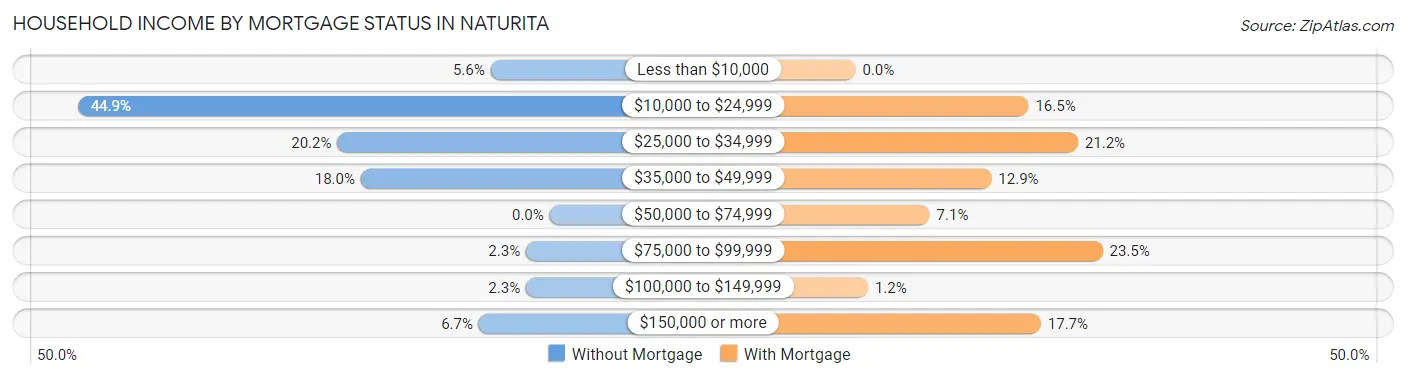
| Household Income | Without Mortgage | With Mortgage |
| Less than $10,000 | 5 (5.6%) | 0 (0.0%) |
| $10,000 to $24,999 | 40 (44.9%) | 14 (16.5%) |
| $25,000 to $34,999 | 18 (20.2%) | 18 (21.2%) |
| $35,000 to $49,999 | 16 (18.0%) | 11 (12.9%) |
| $50,000 to $74,999 | 0 (0.0%) | 6 (7.1%) |
| $75,000 to $99,999 | 2 (2.2%) | 20 (23.5%) |
| $100,000 to $149,999 | 2 (2.2%) | 1 (1.2%) |
| $150,000 or more | 6 (6.7%) | 15 (17.6%) |
| Total | 89 (100.0%) | 85 (100.0%) |
Property Value to Household Income Ratio in Naturita
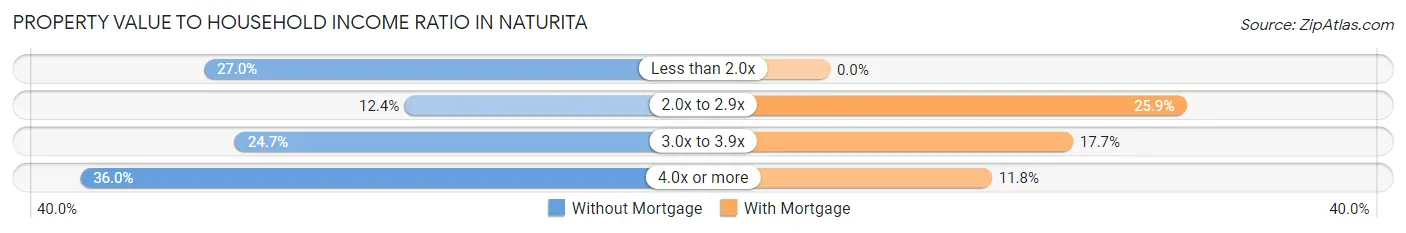
| Value-to-Income Ratio | Without Mortgage | With Mortgage |
| Less than 2.0x | 24 (27.0%) | 0 (0.0%) |
| 2.0x to 2.9x | 11 (12.4%) | 22 (25.9%) |
| 3.0x to 3.9x | 22 (24.7%) | 15 (17.6%) |
| 4.0x or more | 32 (36.0%) | 10 (11.8%) |
| Total | 89 (100.0%) | 85 (100.0%) |
Real Estate Taxes by Mortgage Status in Naturita
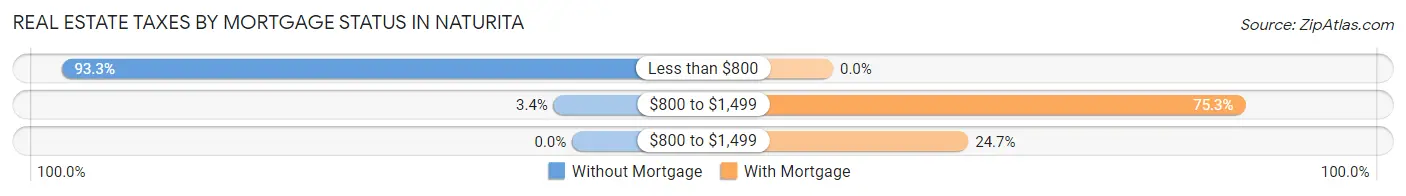
| Property Taxes | Without Mortgage | With Mortgage |
| Less than $800 | 83 (93.3%) | 0 (0.0%) |
| $800 to $1,499 | 3 (3.4%) | 64 (75.3%) |
| $800 to $1,499 | 0 (0.0%) | 21 (24.7%) |
| Total | 89 (100.0%) | 85 (100.0%) |
Health & Disability in Naturita
Health Insurance Coverage by Age in Naturita
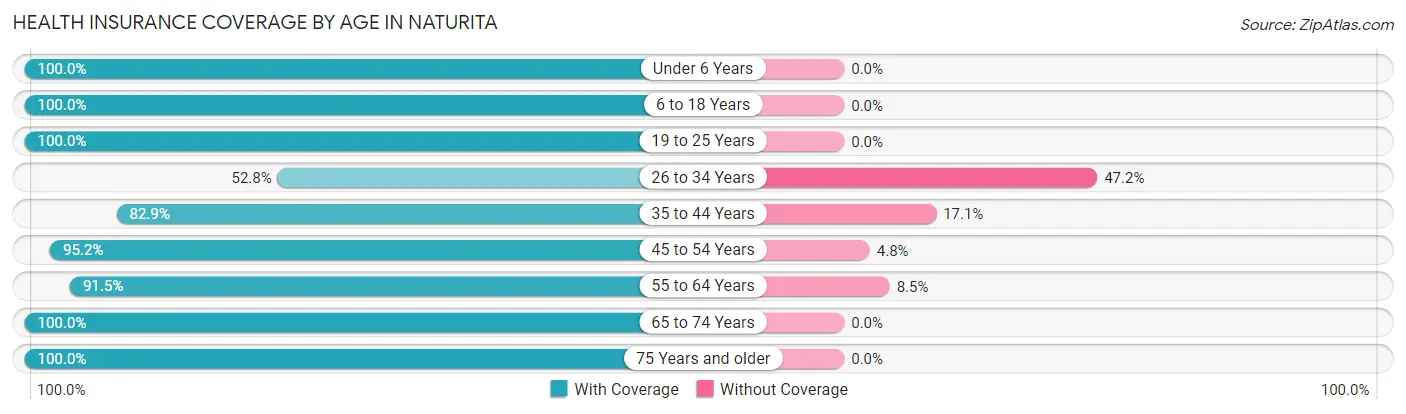
| Age Bracket | With Coverage | Without Coverage |
| Under 6 Years | 37 (100.0%) | 0 (0.0%) |
| 6 to 18 Years | 51 (100.0%) | 0 (0.0%) |
| 19 to 25 Years | 21 (100.0%) | 0 (0.0%) |
| 26 to 34 Years | 28 (52.8%) | 25 (47.2%) |
| 35 to 44 Years | 29 (82.9%) | 6 (17.1%) |
| 45 to 54 Years | 40 (95.2%) | 2 (4.8%) |
| 55 to 64 Years | 108 (91.5%) | 10 (8.5%) |
| 65 to 74 Years | 74 (100.0%) | 0 (0.0%) |
| 75 Years and older | 48 (100.0%) | 0 (0.0%) |
| Total | 436 (91.0%) | 43 (9.0%) |
Health Insurance Coverage by Citizenship Status in Naturita
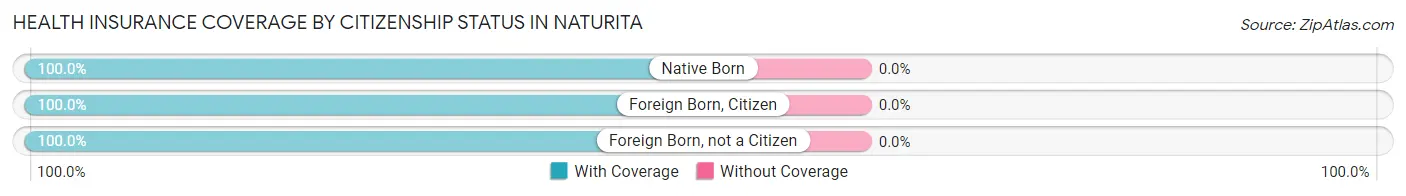
| Citizenship Status | With Coverage | Without Coverage |
| Native Born | 37 (100.0%) | 0 (0.0%) |
| Foreign Born, Citizen | 51 (100.0%) | 0 (0.0%) |
| Foreign Born, not a Citizen | 21 (100.0%) | 0 (0.0%) |
Health Insurance Coverage by Household Income in Naturita
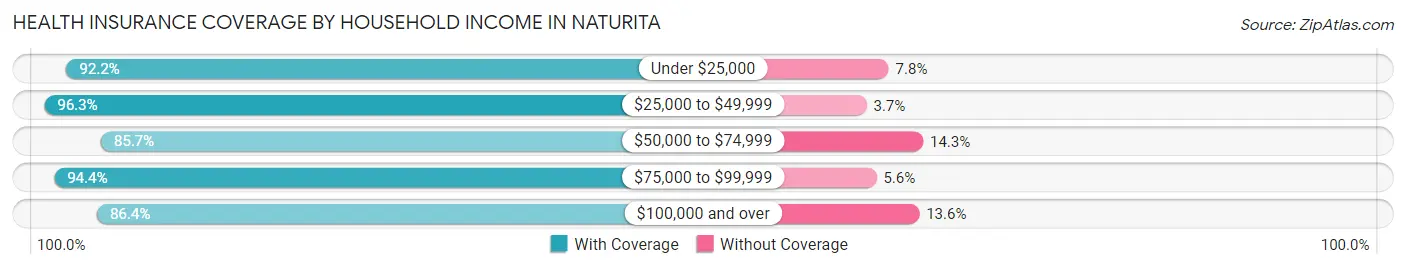
| Household Income | With Coverage | Without Coverage |
| Under $25,000 | 141 (92.2%) | 12 (7.8%) |
| $25,000 to $49,999 | 104 (96.3%) | 4 (3.7%) |
| $50,000 to $74,999 | 36 (85.7%) | 6 (14.3%) |
| $75,000 to $99,999 | 34 (94.4%) | 2 (5.6%) |
| $100,000 and over | 121 (86.4%) | 19 (13.6%) |
Public vs Private Health Insurance Coverage by Age in Naturita
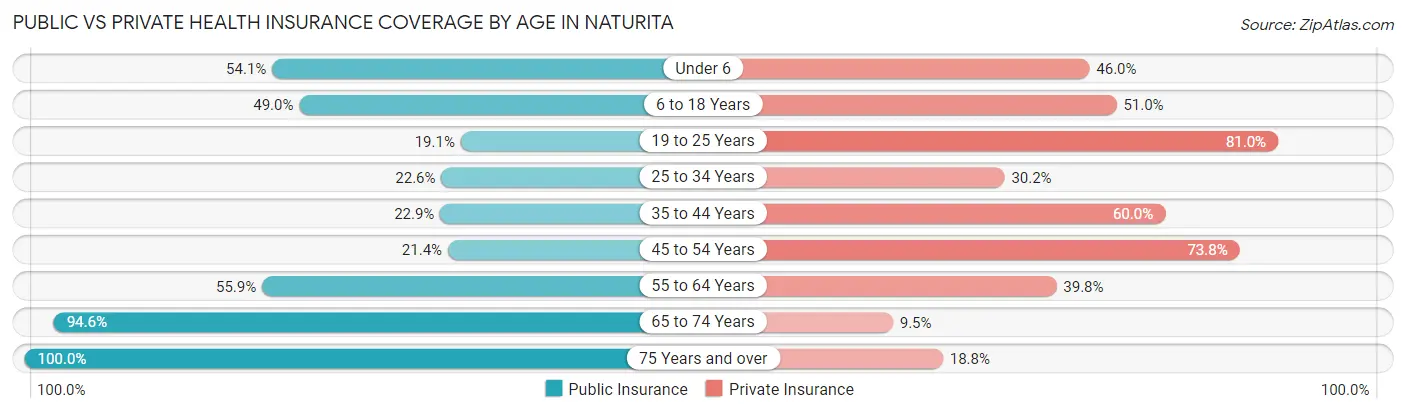
| Age Bracket | Public Insurance | Private Insurance |
| Under 6 | 20 (54.0%) | 17 (46.0%) |
| 6 to 18 Years | 25 (49.0%) | 26 (51.0%) |
| 19 to 25 Years | 4 (19.1%) | 17 (80.9%) |
| 25 to 34 Years | 12 (22.6%) | 16 (30.2%) |
| 35 to 44 Years | 8 (22.9%) | 21 (60.0%) |
| 45 to 54 Years | 9 (21.4%) | 31 (73.8%) |
| 55 to 64 Years | 66 (55.9%) | 47 (39.8%) |
| 65 to 74 Years | 70 (94.6%) | 7 (9.5%) |
| 75 Years and over | 48 (100.0%) | 9 (18.8%) |
| Total | 262 (54.7%) | 191 (39.9%) |
Disability Status by Sex by Age in Naturita
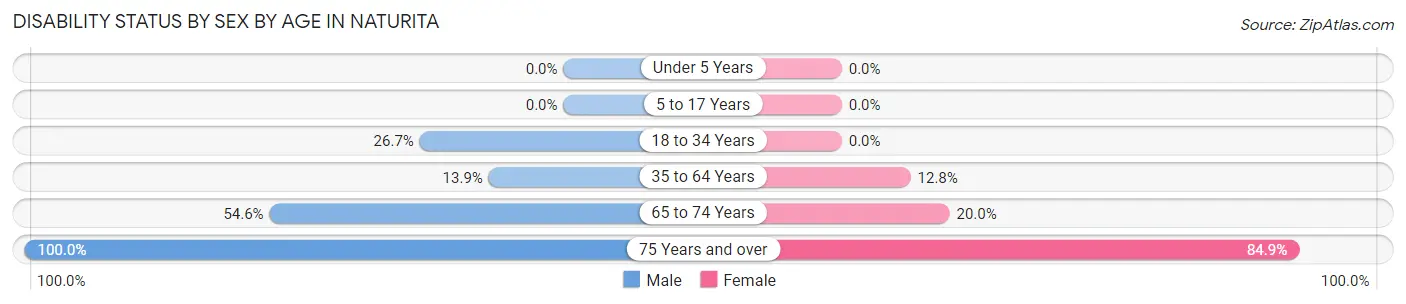
| Age Bracket | Male | Female |
| Under 5 Years | 0 (0.0%) | 0 (0.0%) |
| 5 to 17 Years | 0 (0.0%) | 0 (0.0%) |
| 18 to 34 Years | 12 (26.7%) | 0 (0.0%) |
| 35 to 64 Years | 14 (13.9%) | 12 (12.8%) |
| 65 to 74 Years | 24 (54.5%) | 6 (20.0%) |
| 75 Years and over | 15 (100.0%) | 28 (84.9%) |
Disability Class by Sex by Age in Naturita
Disability Class: Hearing Difficulty
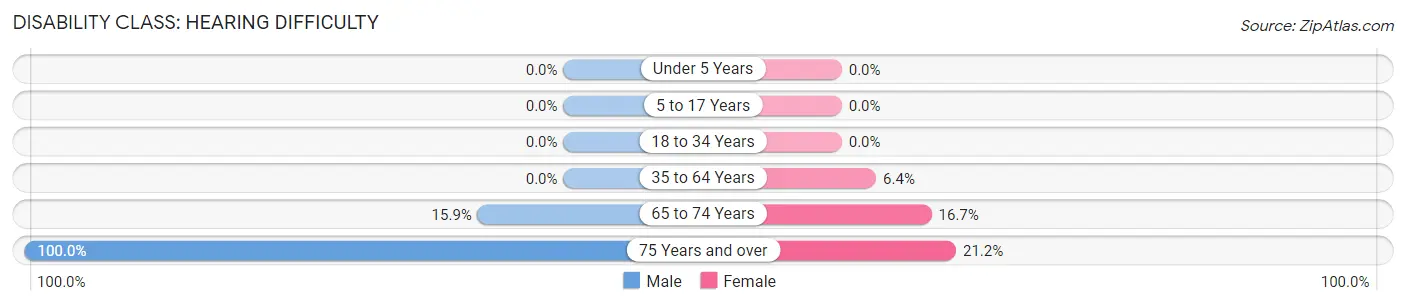
| Age Bracket | Male | Female |
| Under 5 Years | 0 (0.0%) | 0 (0.0%) |
| 5 to 17 Years | 0 (0.0%) | 0 (0.0%) |
| 18 to 34 Years | 0 (0.0%) | 0 (0.0%) |
| 35 to 64 Years | 0 (0.0%) | 6 (6.4%) |
| 65 to 74 Years | 7 (15.9%) | 5 (16.7%) |
| 75 Years and over | 15 (100.0%) | 7 (21.2%) |
Disability Class: Vision Difficulty
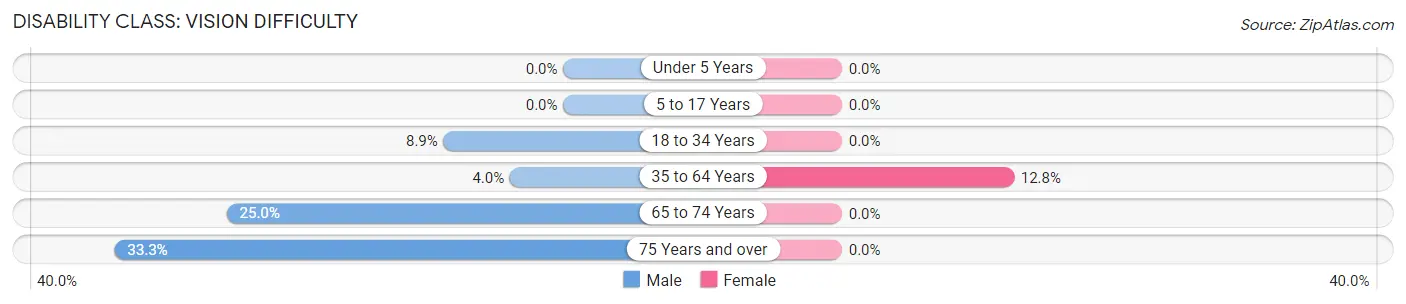
| Age Bracket | Male | Female |
| Under 5 Years | 0 (0.0%) | 0 (0.0%) |
| 5 to 17 Years | 0 (0.0%) | 0 (0.0%) |
| 18 to 34 Years | 4 (8.9%) | 0 (0.0%) |
| 35 to 64 Years | 4 (4.0%) | 12 (12.8%) |
| 65 to 74 Years | 11 (25.0%) | 0 (0.0%) |
| 75 Years and over | 5 (33.3%) | 0 (0.0%) |
Disability Class: Cognitive Difficulty
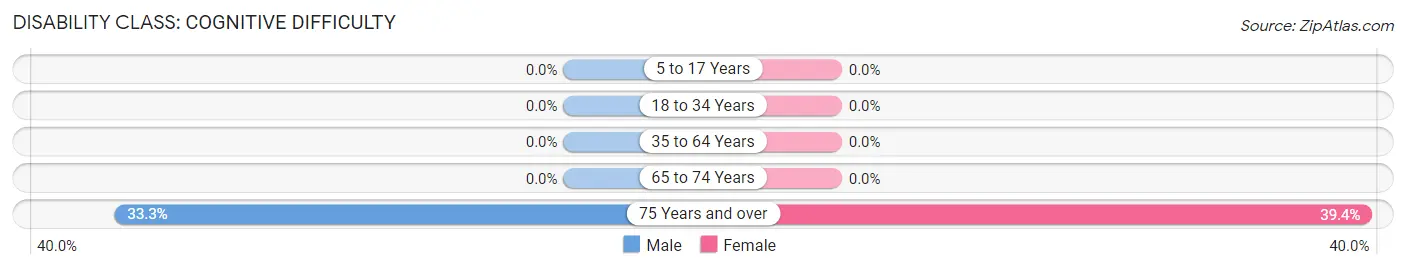
| Age Bracket | Male | Female |
| 5 to 17 Years | 0 (0.0%) | 0 (0.0%) |
| 18 to 34 Years | 0 (0.0%) | 0 (0.0%) |
| 35 to 64 Years | 0 (0.0%) | 0 (0.0%) |
| 65 to 74 Years | 0 (0.0%) | 0 (0.0%) |
| 75 Years and over | 5 (33.3%) | 13 (39.4%) |
Disability Class: Ambulatory Difficulty
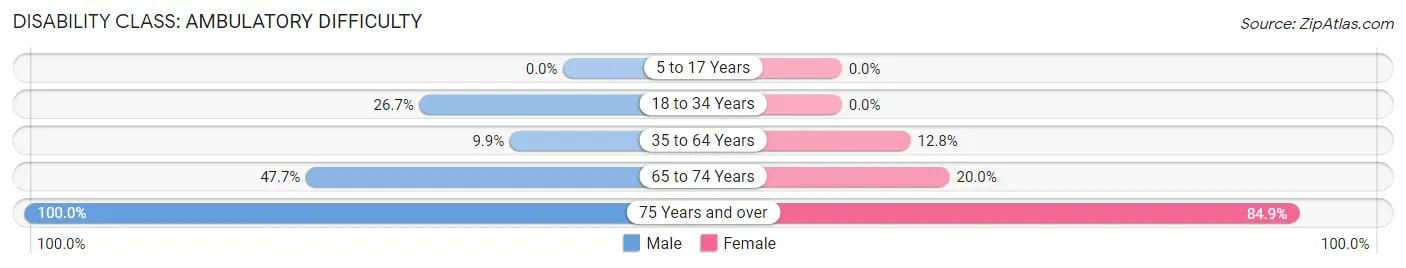
| Age Bracket | Male | Female |
| 5 to 17 Years | 0 (0.0%) | 0 (0.0%) |
| 18 to 34 Years | 12 (26.7%) | 0 (0.0%) |
| 35 to 64 Years | 10 (9.9%) | 12 (12.8%) |
| 65 to 74 Years | 21 (47.7%) | 6 (20.0%) |
| 75 Years and over | 15 (100.0%) | 28 (84.9%) |
Disability Class: Self-Care Difficulty
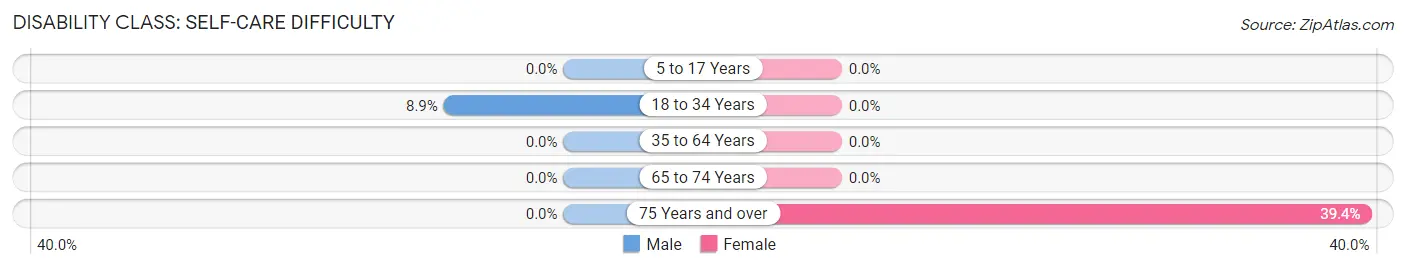
| Age Bracket | Male | Female |
| 5 to 17 Years | 0 (0.0%) | 0 (0.0%) |
| 18 to 34 Years | 4 (8.9%) | 0 (0.0%) |
| 35 to 64 Years | 0 (0.0%) | 0 (0.0%) |
| 65 to 74 Years | 0 (0.0%) | 0 (0.0%) |
| 75 Years and over | 0 (0.0%) | 13 (39.4%) |
Technology Access in Naturita
Computing Device Access in Naturita
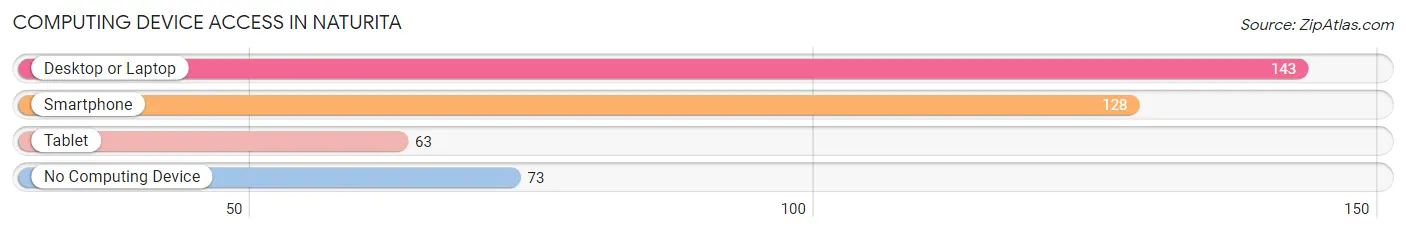
| Device Type | # Households | % Households |
| Desktop or Laptop | 143 | 64.4% |
| Smartphone | 128 | 57.7% |
| Tablet | 63 | 28.4% |
| No Computing Device | 73 | 32.9% |
| Total | 222 | 100.0% |
Internet Access in Naturita
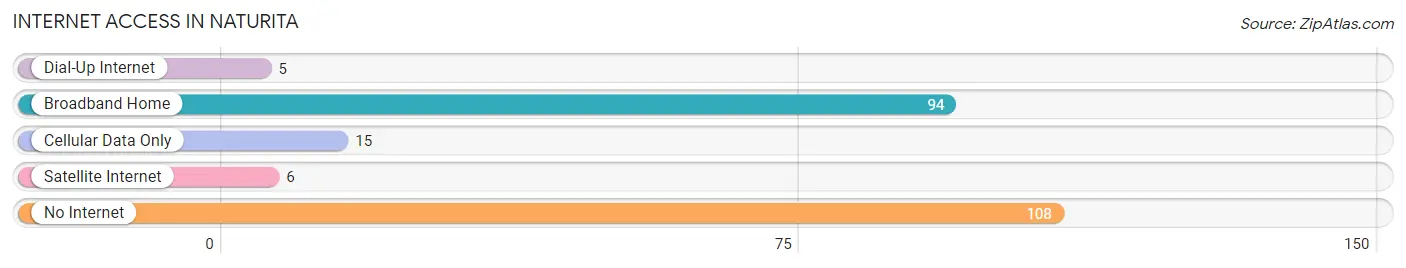
| Internet Type | # Households | % Households |
| Dial-Up Internet | 5 | 2.2% |
| Broadband Home | 94 | 42.3% |
| Cellular Data Only | 15 | 6.8% |
| Satellite Internet | 6 | 2.7% |
| No Internet | 108 | 48.6% |
| Total | 222 | 100.0% |
Naturita Summary
Naturita is a small town located in the western part of Montrose County, Colorado. It is situated in the Uncompahgre Valley, at the confluence of the San Miguel and Dolores Rivers. The town is located at an elevation of 5,945 feet and has a population of approximately 590 people.
Geography
Naturita is located in the western part of Montrose County, Colorado. It is situated in the Uncompahgre Valley, at the confluence of the San Miguel and Dolores Rivers. The town is located at an elevation of 5,945 feet and has a population of approximately 590 people. The town is surrounded by the Uncompahgre National Forest and is located near the San Juan Mountains. The climate in Naturita is semi-arid, with hot summers and cold winters. The average annual precipitation is approximately 11 inches.
History
Naturita was founded in 1883 by a group of settlers from the nearby town of Nucla. The town was originally named “Naturita” after the nearby Naturita Creek. The town was established as a mining camp and quickly grew to become a thriving community. In the early 1900s, the town was home to several businesses, including a hotel, a general store, a saloon, and a post office.
In the 1920s, the town experienced a period of growth and prosperity due to the discovery of uranium in the area. The uranium boom brought many new residents to the town and led to the construction of several new businesses. The town also became a popular tourist destination, as visitors came to explore the nearby canyons and mountains.
In the 1950s, the uranium boom ended and the town experienced a period of decline. Many of the businesses closed and the population decreased. In the 1970s, the town experienced a resurgence as it became a popular destination for outdoor recreation. The town is now home to several businesses, including a grocery store, a gas station, and a restaurant.
Economy
The economy of Naturita is largely based on tourism and outdoor recreation. The town is home to several businesses, including a grocery store, a gas station, and a restaurant. The town is also home to several outdoor recreation businesses, such as a rafting company, a fishing guide service, and a hunting guide service.
The town is also home to several uranium mining operations. The uranium mining industry has been a major source of employment for the town since the 1950s.
Demographics
As of the 2010 census, the population of Naturita was 590 people. The racial makeup of the town was 95.3% White, 0.2% African American, 0.2% Native American, 0.2% Asian, 0.2% Pacific Islander, 0.2% from other races, and 3.1% from two or more races. Hispanic or Latino of any race were 4.1% of the population.
The median household income in Naturita was $37,500, and the median family income was $41,250. The per capita income for the town was $17,818. About 11.7% of families and 14.3% of the population were below the poverty line, including 18.2% of those under age 18 and none of those age 65 or over.
Conclusion
Naturita is a small town located in the western part of Montrose County, Colorado. It is situated in the Uncompahgre Valley, at the confluence of the San Miguel and Dolores Rivers. The town is located at an elevation of 5,945 feet and has a population of approximately 590 people. The economy of Naturita is largely based on tourism and outdoor recreation, as well as uranium mining. The town is home to several businesses, including a grocery store, a gas station, and a restaurant. The racial makeup of the town is predominantly White, with a small percentage of other races. The median household income in Naturita is $37,500, and the median family income is $41,250.
Common Questions
What is Per Capita Income in Naturita?
Per Capita income in Naturita is $25,401.
What is the Median Household income in Naturita?
Median Household Income in Naturita is $25,278.
What is Income or Wage Gap in Naturita?
Income or Wage Gap in Naturita is 6.7%.
Women in Naturita earn 93.3 cents for every dollar earned by a man.
What is Inequality or Gini Index in Naturita?
Inequality or Gini Index in Naturita is 0.51.
What is the Total Population of Naturita?
Total Population of Naturita is 479.
What is the Total Male Population of Naturita?
Total Male Population of Naturita is 269.
What is the Total Female Population of Naturita?
Total Female Population of Naturita is 210.
What is the Ratio of Males per 100 Females in Naturita?
There are 128.10 Males per 100 Females in Naturita.
What is the Ratio of Females per 100 Males in Naturita?
There are 78.07 Females per 100 Males in Naturita.
What is the Median Population Age in Naturita?
Median Population Age in Naturita is 55.0 Years.
What is the Average Family Size in Naturita
Average Family Size in Naturita is 3.0 People.
What is the Average Household Size in Naturita
Average Household Size in Naturita is 2.2 People.
How Large is the Labor Force in Naturita?
There are 192 People in the Labor Forcein in Naturita.
What is the Percentage of People in the Labor Force in Naturita?
46.2% of People are in the Labor Force in Naturita.