La Salle, CO Map & Demographics
La Salle Map
La Salle Overview
$39,024
PER CAPITA INCOME
$103,523
AVG FAMILY INCOME
$91,080
AVG HOUSEHOLD INCOME
43.2%
WAGE / INCOME GAP [ % ]
56.8¢/ $1
WAGE / INCOME GAP [ $ ]
0.39
INEQUALITY / GINI INDEX
2,874
TOTAL POPULATION
1,367
MALE POPULATION
1,507
FEMALE POPULATION
90.71
MALES / 100 FEMALES
110.24
FEMALES / 100 MALES
34.3
MEDIAN AGE
3.6
AVG FAMILY SIZE
3.0
AVG HOUSEHOLD SIZE
1,547
LABOR FORCE [ PEOPLE ]
71.3%
PERCENT IN LABOR FORCE
1.6%
UNEMPLOYMENT RATE
La Salle Zip Codes
La Salle Area Codes
Income in La Salle
Income Overview in La Salle
Per Capita Income in La Salle is $39,024, while median incomes of families and households are $103,523 and $91,080 respectively.
| Characteristic | Number | Measure |
| Per Capita Income | 2,874 | $39,024 |
| Median Family Income | 719 | $103,523 |
| Mean Family Income | 719 | $110,251 |
| Median Household Income | 961 | $91,080 |
| Mean Household Income | 961 | $111,781 |
| Income Deficit | 719 | $0 |
| Wage / Income Gap (%) | 2,874 | 43.17% |
| Wage / Income Gap ($) | 2,874 | 56.83¢ per $1 |
| Gini / Inequality Index | 2,874 | 0.39 |
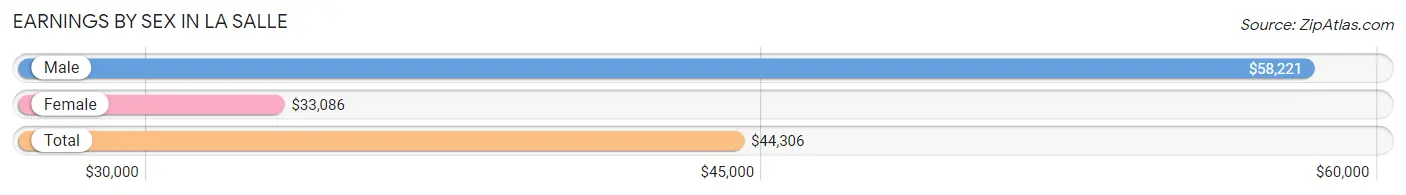
Earnings by Sex in La Salle
Average Earnings in La Salle are $44,306, $58,221 for men and $33,086 for women, a difference of 43.2%.
| Sex | Number | Average Earnings |
| Male | 853 (53.0%) | $58,221 |
| Female | 757 (47.0%) | $33,086 |
| Total | 1,610 (100.0%) | $44,306 |
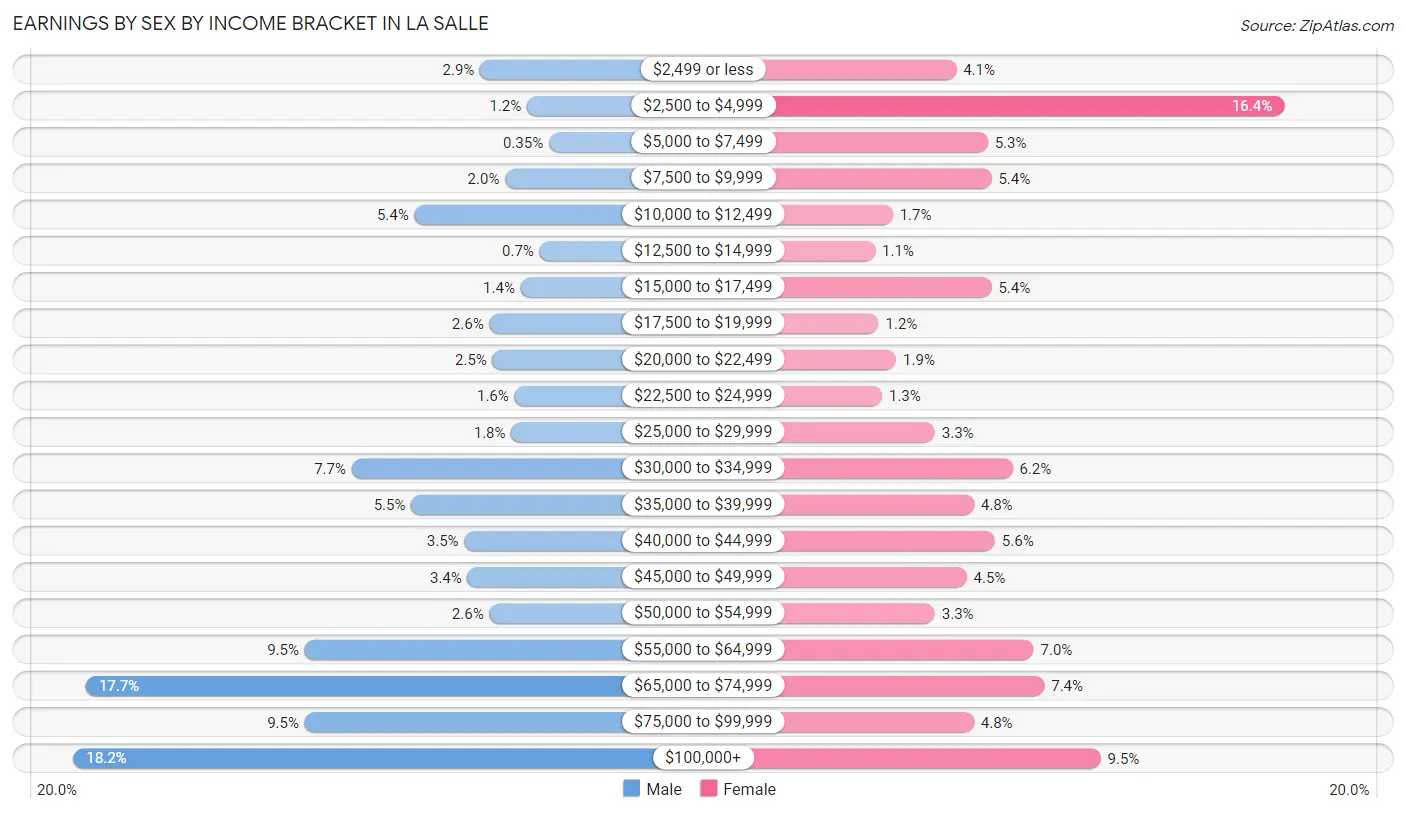
Earnings by Sex by Income Bracket in La Salle
The most common earnings brackets in La Salle are $100,000+ for men (155 | 18.2%) and $2,500 to $4,999 for women (124 | 16.4%).
| Income | Male | Female |
| $2,499 or less | 25 (2.9%) | 31 (4.1%) |
| $2,500 to $4,999 | 10 (1.2%) | 124 (16.4%) |
| $5,000 to $7,499 | 3 (0.4%) | 40 (5.3%) |
| $7,500 to $9,999 | 17 (2.0%) | 41 (5.4%) |
| $10,000 to $12,499 | 46 (5.4%) | 13 (1.7%) |
| $12,500 to $14,999 | 6 (0.7%) | 8 (1.1%) |
| $15,000 to $17,499 | 12 (1.4%) | 41 (5.4%) |
| $17,500 to $19,999 | 22 (2.6%) | 9 (1.2%) |
| $20,000 to $22,499 | 21 (2.5%) | 14 (1.8%) |
| $22,500 to $24,999 | 14 (1.6%) | 10 (1.3%) |
| $25,000 to $29,999 | 15 (1.8%) | 25 (3.3%) |
| $30,000 to $34,999 | 66 (7.7%) | 47 (6.2%) |
| $35,000 to $39,999 | 47 (5.5%) | 36 (4.8%) |
| $40,000 to $44,999 | 30 (3.5%) | 42 (5.6%) |
| $45,000 to $49,999 | 29 (3.4%) | 34 (4.5%) |
| $50,000 to $54,999 | 22 (2.6%) | 25 (3.3%) |
| $55,000 to $64,999 | 81 (9.5%) | 53 (7.0%) |
| $65,000 to $74,999 | 151 (17.7%) | 56 (7.4%) |
| $75,000 to $99,999 | 81 (9.5%) | 36 (4.8%) |
| $100,000+ | 155 (18.2%) | 72 (9.5%) |
| Total | 853 (100.0%) | 757 (100.0%) |
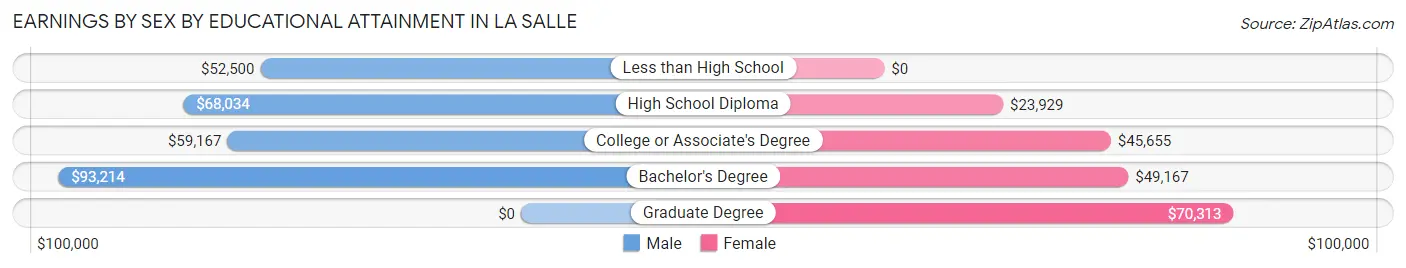
Earnings by Sex by Educational Attainment in La Salle
Average earnings in La Salle are $67,666 for men and $42,500 for women, a difference of 37.2%. Men with an educational attainment of bachelor's degree enjoy the highest average annual earnings of $93,214, while those with less than high school education earn the least with $52,500. Women with an educational attainment of graduate degree earn the most with the average annual earnings of $70,313, while those with high school diploma education have the smallest earnings of $23,929.
| Educational Attainment | Male Income | Female Income |
| Less than High School | $52,500 | $0 |
| High School Diploma | $68,034 | $23,929 |
| College or Associate's Degree | $59,167 | $45,655 |
| Bachelor's Degree | $93,214 | $49,167 |
| Graduate Degree | - | - |
| Total | $67,666 | $42,500 |
Family Income in La Salle
Family Income Brackets in La Salle
According to the La Salle family income data, there are 262 families falling into the $100,000 to $149,999 income range, which is the most common income bracket and makes up 36.4% of all families. Conversely, the less than $10,000 income bracket is the least frequent group with only 3 families (0.4%) belonging to this category.
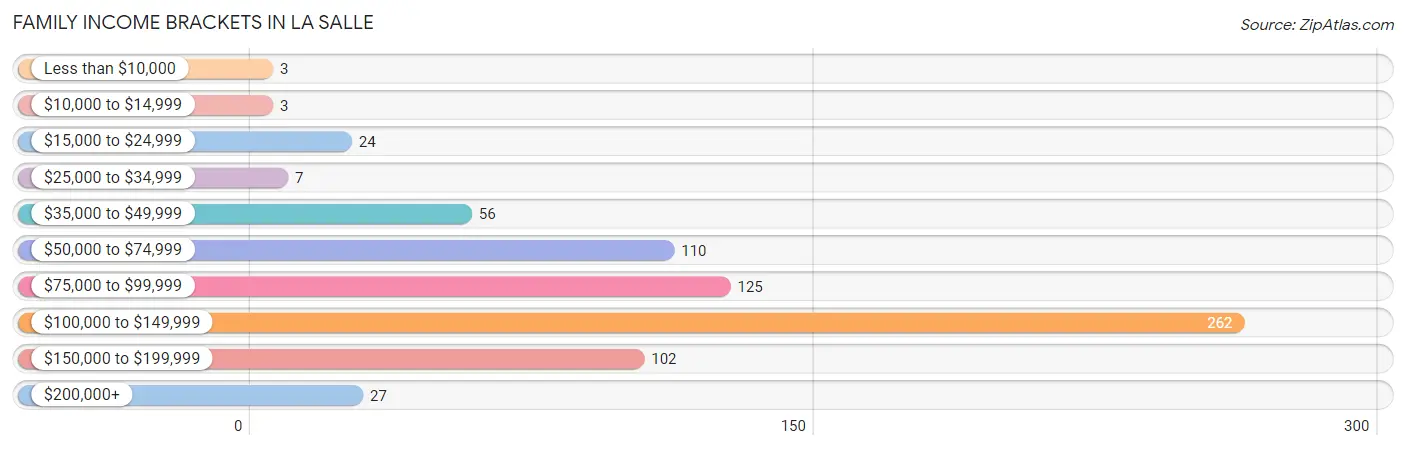
| Income Bracket | # Families | % Families |
| Less than $10,000 | 3 | 0.4% |
| $10,000 to $14,999 | 3 | 0.4% |
| $15,000 to $24,999 | 24 | 3.3% |
| $25,000 to $34,999 | 7 | 1.0% |
| $35,000 to $49,999 | 56 | 7.8% |
| $50,000 to $74,999 | 110 | 15.3% |
| $75,000 to $99,999 | 125 | 17.4% |
| $100,000 to $149,999 | 262 | 36.4% |
| $150,000 to $199,999 | 102 | 14.2% |
| $200,000+ | 27 | 3.8% |
Family Income by Famaliy Size in La Salle
5-person families (122 | 17.0%) account for the highest median family income in La Salle with $121,316 per family, while 2-person families (254 | 35.3%) have the highest median income of $45,834 per family member.
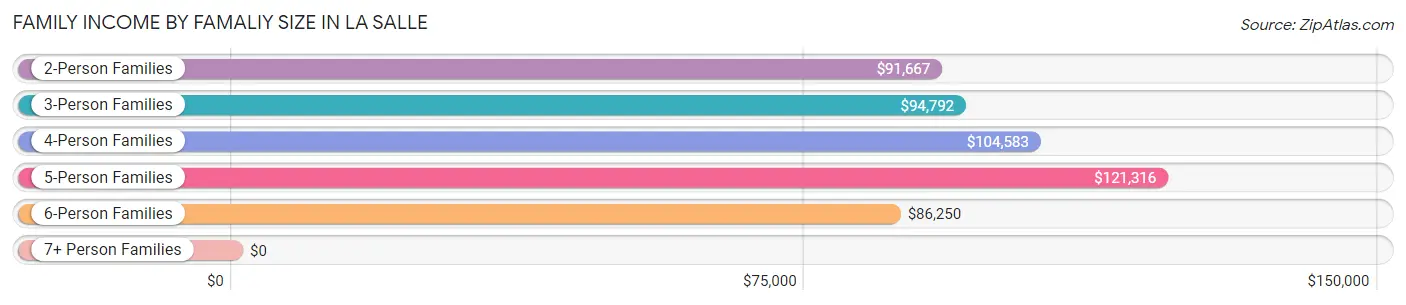
| Income Bracket | # Families | Median Income |
| 2-Person Families | 254 (35.3%) | $91,667 |
| 3-Person Families | 174 (24.2%) | $94,792 |
| 4-Person Families | 133 (18.5%) | $104,583 |
| 5-Person Families | 122 (17.0%) | $121,316 |
| 6-Person Families | 30 (4.2%) | $86,250 |
| 7+ Person Families | 6 (0.8%) | $0 |
| Total | 719 (100.0%) | $103,523 |
Family Income by Number of Earners in La Salle
The median family income in La Salle is $103,523, with families comprising 2 earners (323) having the highest median family income of $124,792, while families with 1 earner (225) have the lowest median family income of $68,911, accounting for 44.9% and 31.3% of families, respectively.
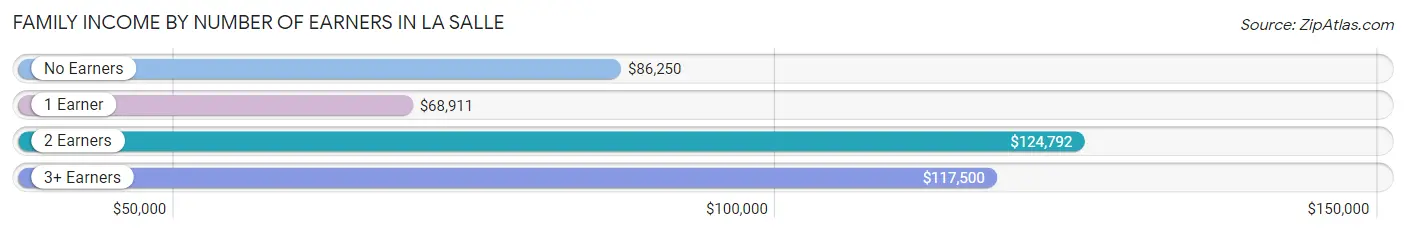
| Number of Earners | # Families | Median Income |
| No Earners | 53 (7.4%) | $86,250 |
| 1 Earner | 225 (31.3%) | $68,911 |
| 2 Earners | 323 (44.9%) | $124,792 |
| 3+ Earners | 118 (16.4%) | $117,500 |
| Total | 719 (100.0%) | $103,523 |
Household Income in La Salle
Household Income Brackets in La Salle
With 271 households falling in the category, the $100,000 to $149,999 income range is the most frequent in La Salle, accounting for 28.2% of all households. In contrast, only 11 households (1.1%) fall into the less than $10,000 income bracket, making it the least populous group.
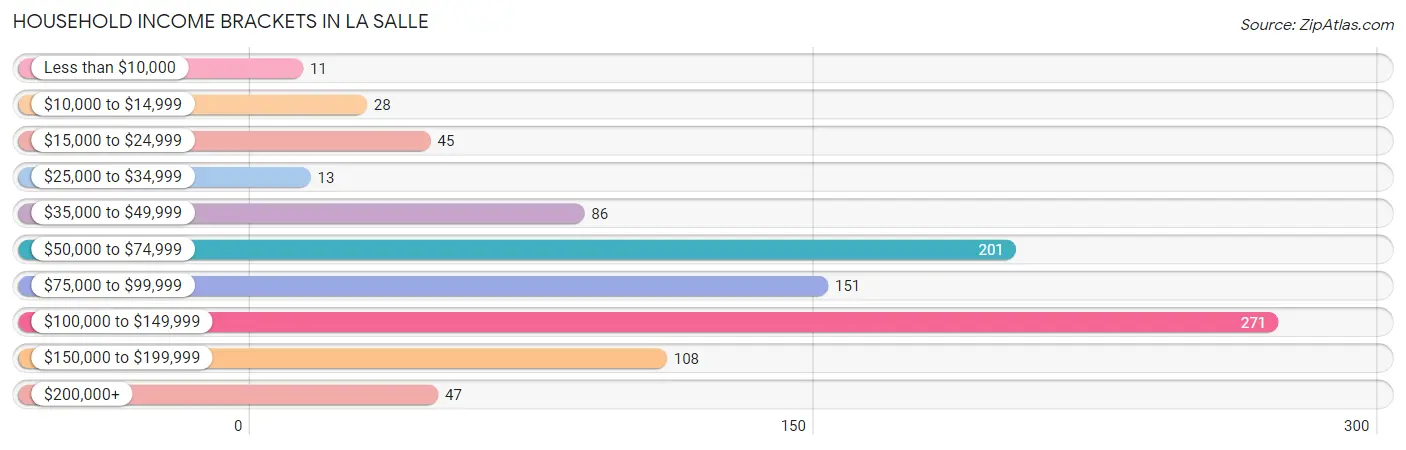
| Income Bracket | # Households | % Households |
| Less than $10,000 | 11 | 1.1% |
| $10,000 to $14,999 | 28 | 2.9% |
| $15,000 to $24,999 | 45 | 4.7% |
| $25,000 to $34,999 | 13 | 1.4% |
| $35,000 to $49,999 | 86 | 8.9% |
| $50,000 to $74,999 | 201 | 20.9% |
| $75,000 to $99,999 | 151 | 15.7% |
| $100,000 to $149,999 | 271 | 28.2% |
| $150,000 to $199,999 | 108 | 11.2% |
| $200,000+ | 47 | 4.9% |
Household Income by Householder Age in La Salle
The median household income in La Salle is $91,080, with the highest median household income of $106,905 found in the 25 to 44 years age bracket for the primary householder. A total of 390 households (40.6%) fall into this category. Meanwhile, the 15 to 24 years age bracket for the primary householder has the lowest median household income of $0, with 31 households (3.2%) in this group.
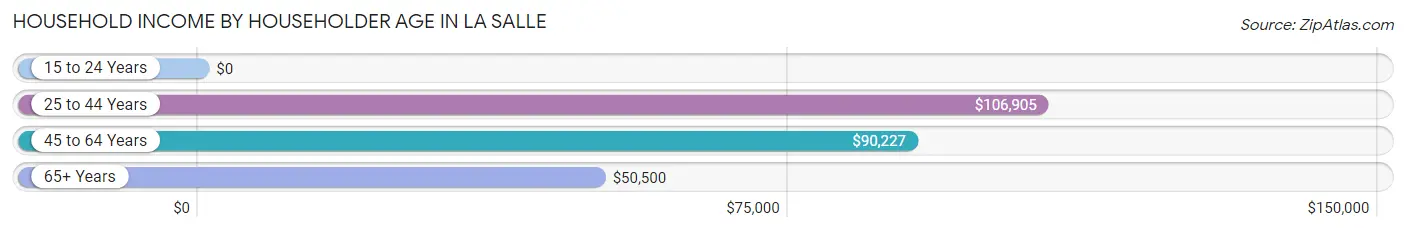
| Income Bracket | # Households | Median Income |
| 15 to 24 Years | 31 (3.2%) | $0 |
| 25 to 44 Years | 390 (40.6%) | $106,905 |
| 45 to 64 Years | 330 (34.3%) | $90,227 |
| 65+ Years | 210 (21.8%) | $50,500 |
| Total | 961 (100.0%) | $91,080 |
Poverty in La Salle
Income Below Poverty by Sex and Age in La Salle
With 5.3% poverty level for males and 5.8% for females among the residents of La Salle, 18 to 24 year old males and 5 year old females are the most vulnerable to poverty, with 23 males (26.4%) and 4 females (23.5%) in their respective age groups living below the poverty level.
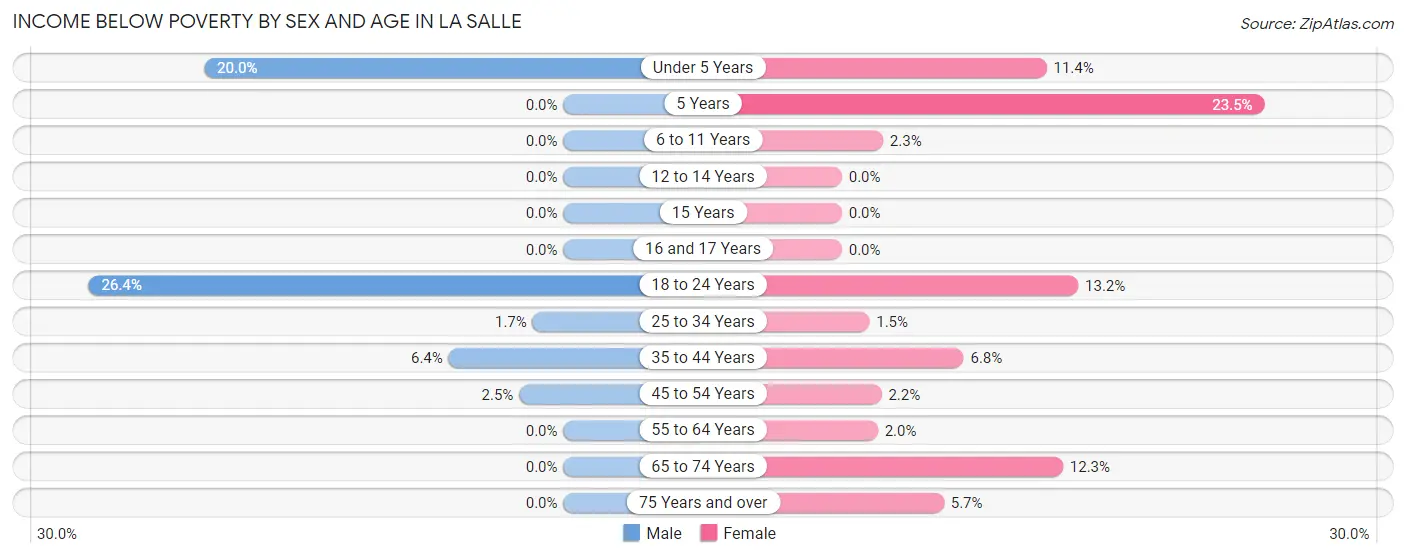
| Age Bracket | Male | Female |
| Under 5 Years | 25 (20.0%) | 13 (11.4%) |
| 5 Years | 0 (0.0%) | 4 (23.5%) |
| 6 to 11 Years | 0 (0.0%) | 3 (2.3%) |
| 12 to 14 Years | 0 (0.0%) | 0 (0.0%) |
| 15 Years | 0 (0.0%) | 0 (0.0%) |
| 16 and 17 Years | 0 (0.0%) | 0 (0.0%) |
| 18 to 24 Years | 23 (26.4%) | 25 (13.2%) |
| 25 to 34 Years | 3 (1.7%) | 3 (1.5%) |
| 35 to 44 Years | 17 (6.4%) | 12 (6.8%) |
| 45 to 54 Years | 5 (2.5%) | 3 (2.2%) |
| 55 to 64 Years | 0 (0.0%) | 3 (2.0%) |
| 65 to 74 Years | 0 (0.0%) | 16 (12.3%) |
| 75 Years and over | 0 (0.0%) | 5 (5.7%) |
| Total | 73 (5.3%) | 87 (5.8%) |
Income Above Poverty by Sex and Age in La Salle
According to the poverty statistics in La Salle, males aged 5 years and females aged 12 to 14 years are the age groups that are most secure financially, with 100.0% of males and 100.0% of females in these age groups living above the poverty line.
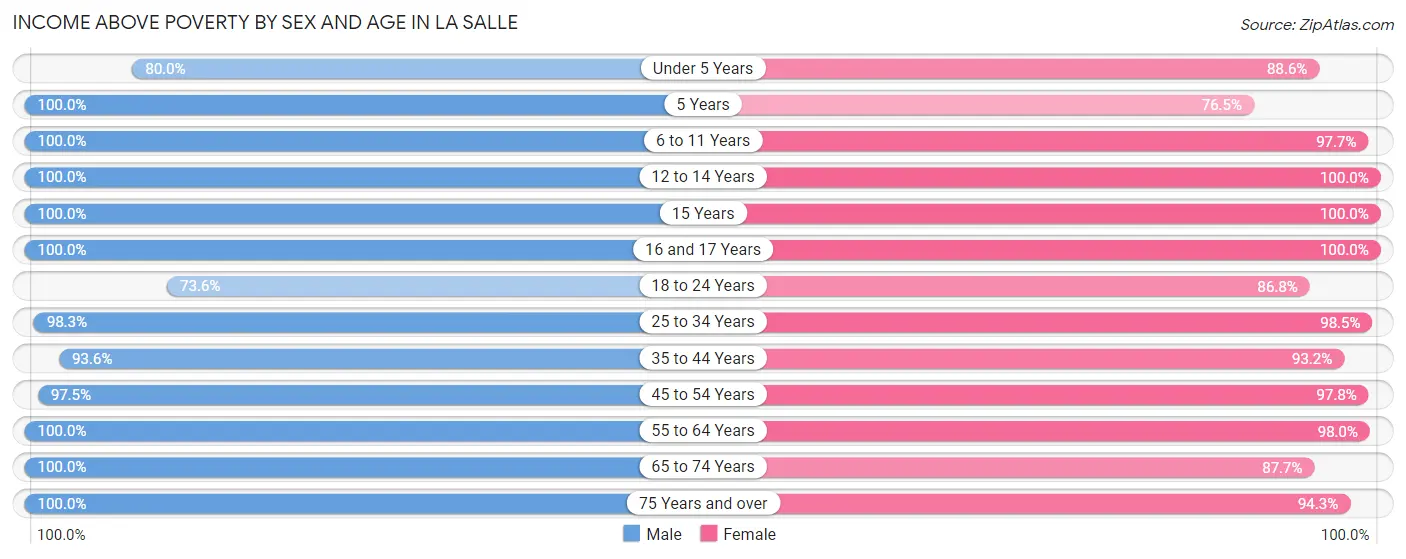
| Age Bracket | Male | Female |
| Under 5 Years | 100 (80.0%) | 101 (88.6%) |
| 5 Years | 22 (100.0%) | 13 (76.5%) |
| 6 to 11 Years | 138 (100.0%) | 128 (97.7%) |
| 12 to 14 Years | 7 (100.0%) | 111 (100.0%) |
| 15 Years | 12 (100.0%) | 27 (100.0%) |
| 16 and 17 Years | 62 (100.0%) | 40 (100.0%) |
| 18 to 24 Years | 64 (73.6%) | 165 (86.8%) |
| 25 to 34 Years | 172 (98.3%) | 193 (98.5%) |
| 35 to 44 Years | 249 (93.6%) | 165 (93.2%) |
| 45 to 54 Years | 198 (97.5%) | 133 (97.8%) |
| 55 to 64 Years | 144 (100.0%) | 147 (98.0%) |
| 65 to 74 Years | 80 (100.0%) | 114 (87.7%) |
| 75 Years and over | 46 (100.0%) | 83 (94.3%) |
| Total | 1,294 (94.7%) | 1,420 (94.2%) |
Income Below Poverty Among Married-Couple Families in La Salle
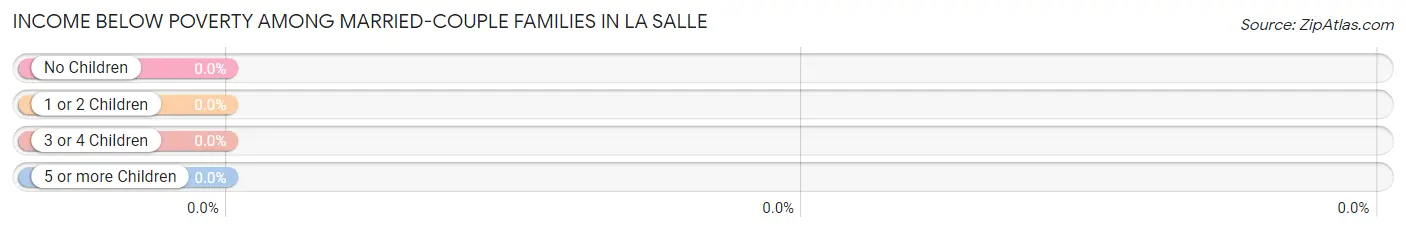
| Children | Above Poverty | Below Poverty |
| No Children | 179 (100.0%) | 0 (0.0%) |
| 1 or 2 Children | 241 (100.0%) | 0 (0.0%) |
| 3 or 4 Children | 78 (100.0%) | 0 (0.0%) |
| 5 or more Children | 0 (0.0%) | 0 (0.0%) |
| Total | 498 (100.0%) | 0 (0.0%) |
Income Below Poverty Among Single-Parent Households in La Salle
According to the poverty data in La Salle, 4.6% or 3 single-father households and 17.3% or 27 single-mother households are living below the poverty line. Among single-father households, those with 3 or 4 children have the highest poverty rate, with 3 households (100.0%) experiencing poverty. Likewise, among single-mother households, those with 1 or 2 children have the highest poverty rate, with 14 households (41.2%) falling below the poverty line.
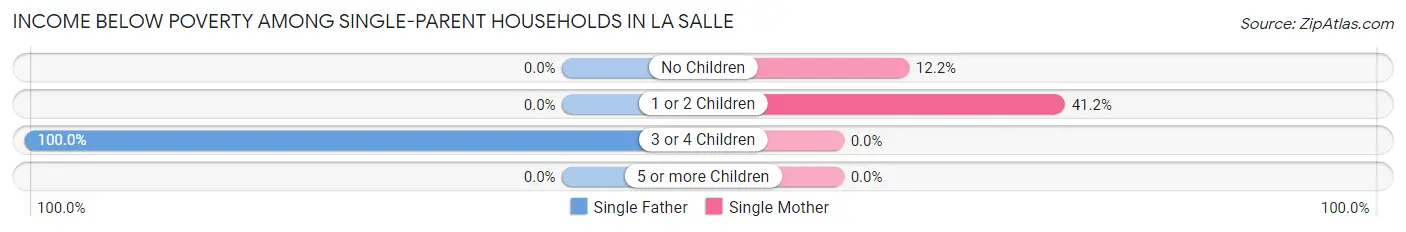
| Children | Single Father | Single Mother |
| No Children | 0 (0.0%) | 13 (12.1%) |
| 1 or 2 Children | 0 (0.0%) | 14 (41.2%) |
| 3 or 4 Children | 3 (100.0%) | 0 (0.0%) |
| 5 or more Children | 0 (0.0%) | 0 (0.0%) |
| Total | 3 (4.6%) | 27 (17.3%) |
Income Below Poverty Among Married-Couple vs Single-Parent Households in La Salle
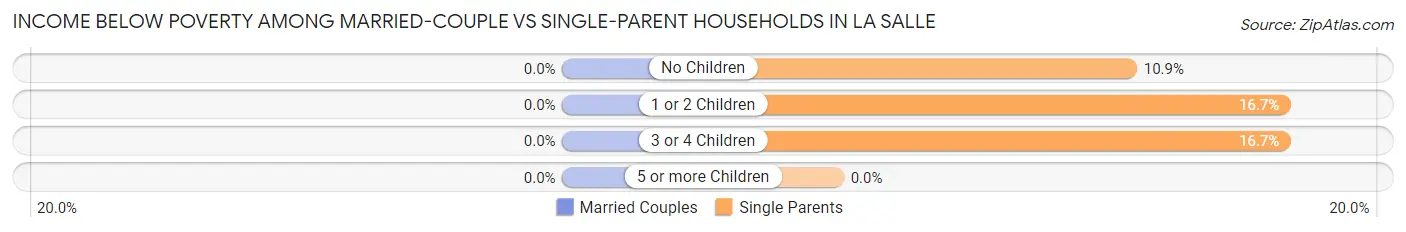
| Children | Married-Couple Families | Single-Parent Households |
| No Children | 0 (0.0%) | 13 (10.9%) |
| 1 or 2 Children | 0 (0.0%) | 14 (16.7%) |
| 3 or 4 Children | 0 (0.0%) | 3 (16.7%) |
| 5 or more Children | 0 (0.0%) | 0 (0.0%) |
| Total | 0 (0.0%) | 30 (13.6%) |
Race in La Salle
The most populous races in La Salle are White / Caucasian (2,146 | 74.7%), Hispanic or Latino (1,093 | 38.0%), and Two or more Races (421 | 14.6%).
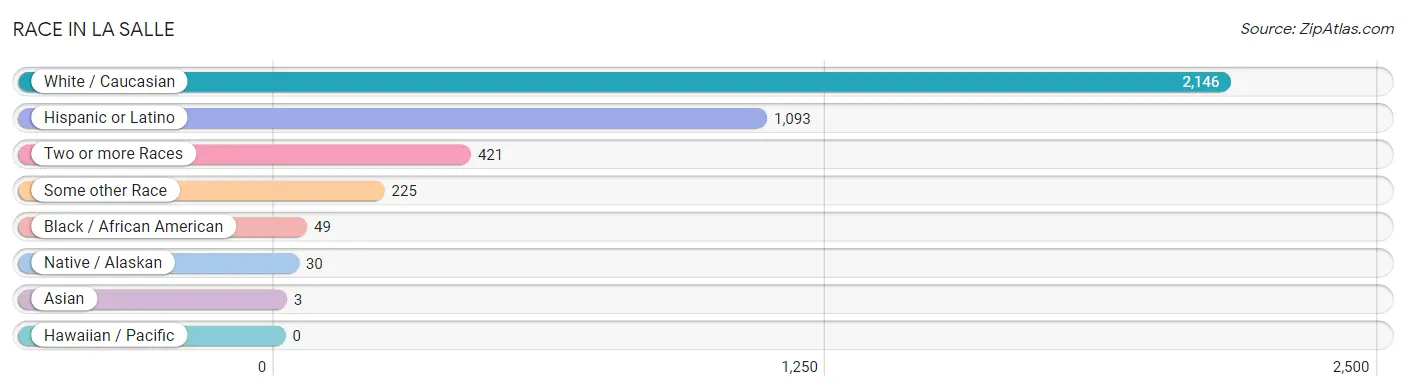
| Race | # Population | % Population |
| Asian | 3 | 0.1% |
| Black / African American | 49 | 1.7% |
| Hawaiian / Pacific | 0 | 0.0% |
| Hispanic or Latino | 1,093 | 38.0% |
| Native / Alaskan | 30 | 1.0% |
| White / Caucasian | 2,146 | 74.7% |
| Two or more Races | 421 | 14.6% |
| Some other Race | 225 | 7.8% |
| Total | 2,874 | 100.0% |
Ancestry in La Salle
The most populous ancestries reported in La Salle are Mexican (892 | 31.0%), German (558 | 19.4%), English (302 | 10.5%), Irish (275 | 9.6%), and Norwegian (104 | 3.6%), together accounting for 74.2% of all La Salle residents.
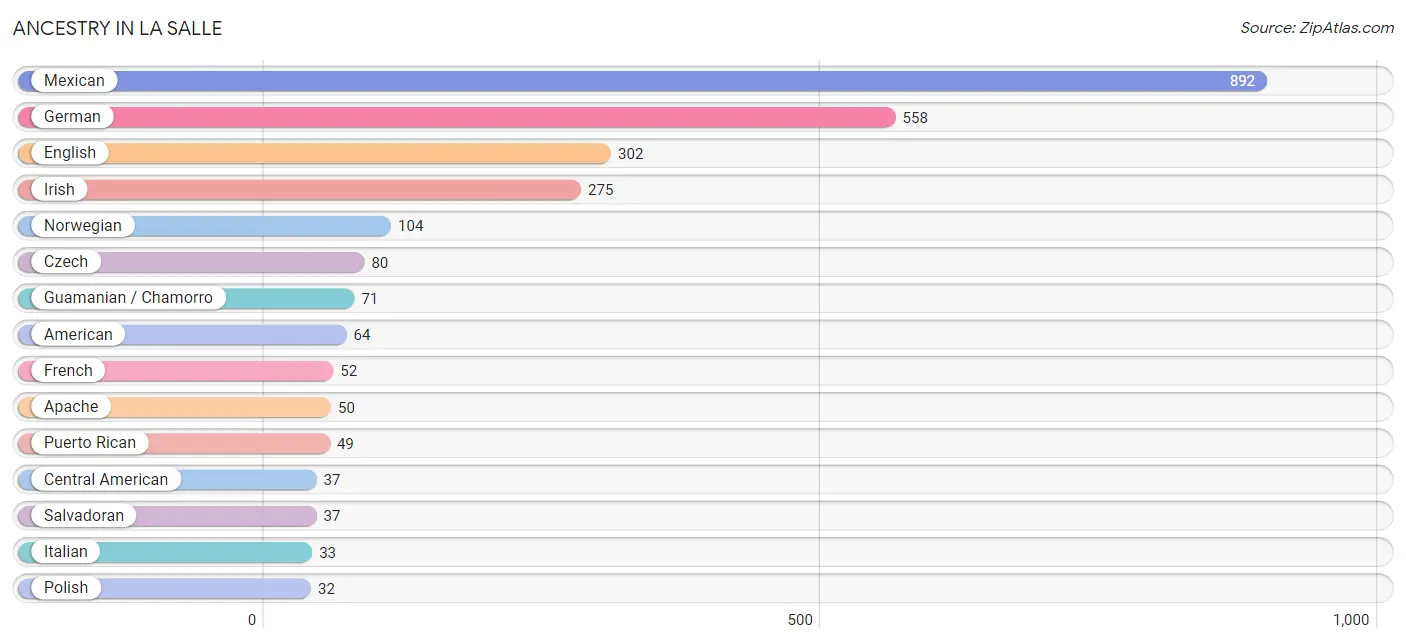
| Ancestry | # Population | % Population |
| American | 64 | 2.2% |
| Apache | 50 | 1.7% |
| Arab | 4 | 0.1% |
| Armenian | 22 | 0.8% |
| Belgian | 11 | 0.4% |
| Blackfeet | 16 | 0.6% |
| British | 13 | 0.4% |
| Bulgarian | 3 | 0.1% |
| Burmese | 3 | 0.1% |
| Central American | 37 | 1.3% |
| Cherokee | 16 | 0.6% |
| Cuban | 7 | 0.2% |
| Czech | 80 | 2.8% |
| Danish | 15 | 0.5% |
| Dutch | 10 | 0.4% |
| English | 302 | 10.5% |
| European | 13 | 0.4% |
| Finnish | 4 | 0.1% |
| French | 52 | 1.8% |
| French Canadian | 7 | 0.2% |
| German | 558 | 19.4% |
| German Russian | 14 | 0.5% |
| Guamanian / Chamorro | 71 | 2.5% |
| Hungarian | 2 | 0.1% |
| Irish | 275 | 9.6% |
| Italian | 33 | 1.1% |
| Mexican | 892 | 31.0% |
| Mexican American Indian | 30 | 1.0% |
| Moroccan | 4 | 0.1% |
| Navajo | 4 | 0.1% |
| Norwegian | 104 | 3.6% |
| Polish | 32 | 1.1% |
| Puerto Rican | 49 | 1.7% |
| Russian | 10 | 0.4% |
| Salvadoran | 37 | 1.3% |
| Scandinavian | 12 | 0.4% |
| Scotch-Irish | 28 | 1.0% |
| Scottish | 24 | 0.8% |
| Sioux | 26 | 0.9% |
| Spaniard | 3 | 0.1% |
| Spanish | 28 | 1.0% |
| Sri Lankan | 8 | 0.3% |
| Swedish | 24 | 0.8% |
| Swiss | 8 | 0.3% |
| Thai | 3 | 0.1% | View All 45 Rows |
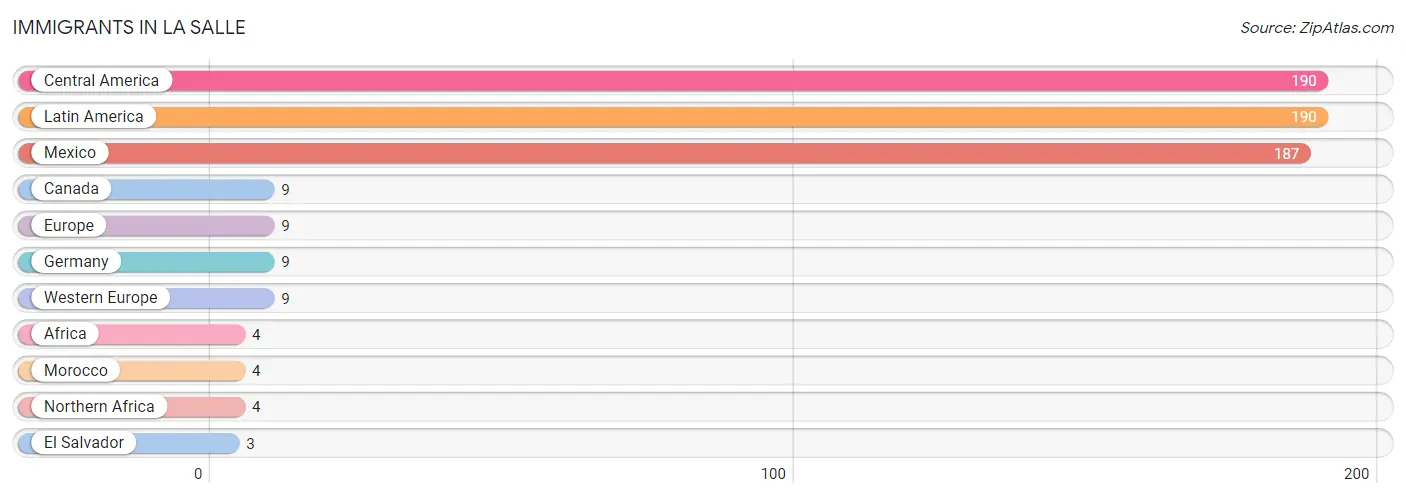
Immigrants in La Salle
The most numerous immigrant groups reported in La Salle came from Central America (190 | 6.6%), Latin America (190 | 6.6%), Mexico (187 | 6.5%), Canada (9 | 0.3%), and Europe (9 | 0.3%), together accounting for 20.4% of all La Salle residents.
| Immigration Origin | # Population | % Population |
| Africa | 4 | 0.1% |
| Canada | 9 | 0.3% |
| Central America | 190 | 6.6% |
| El Salvador | 3 | 0.1% |
| Europe | 9 | 0.3% |
| Germany | 9 | 0.3% |
| Latin America | 190 | 6.6% |
| Mexico | 187 | 6.5% |
| Morocco | 4 | 0.1% |
| Northern Africa | 4 | 0.1% |
| Western Europe | 9 | 0.3% | View All 11 Rows |
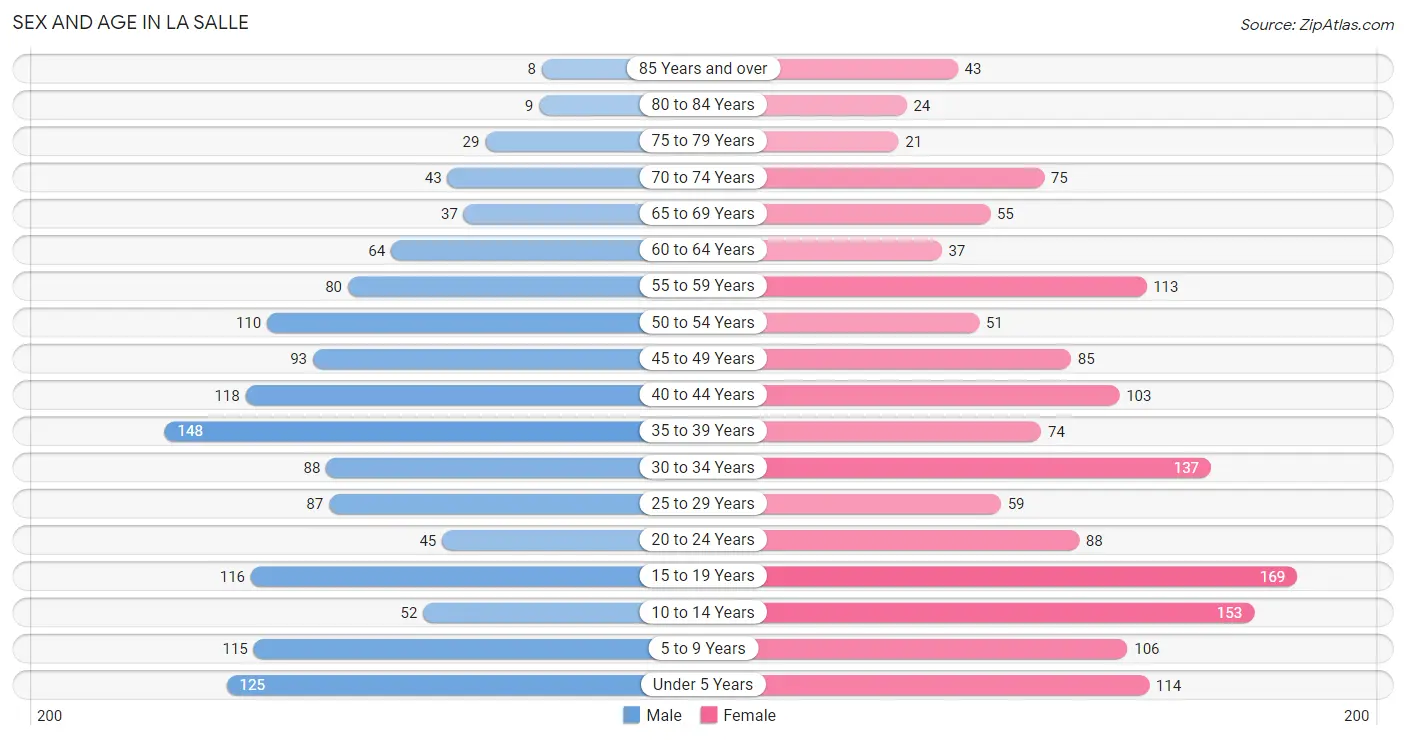
Sex and Age in La Salle
Sex and Age in La Salle
The most populous age groups in La Salle are 35 to 39 Years (148 | 10.8%) for men and 15 to 19 Years (169 | 11.2%) for women.
| Age Bracket | Male | Female |
| Under 5 Years | 125 (9.1%) | 114 (7.6%) |
| 5 to 9 Years | 115 (8.4%) | 106 (7.0%) |
| 10 to 14 Years | 52 (3.8%) | 153 (10.2%) |
| 15 to 19 Years | 116 (8.5%) | 169 (11.2%) |
| 20 to 24 Years | 45 (3.3%) | 88 (5.8%) |
| 25 to 29 Years | 87 (6.4%) | 59 (3.9%) |
| 30 to 34 Years | 88 (6.4%) | 137 (9.1%) |
| 35 to 39 Years | 148 (10.8%) | 74 (4.9%) |
| 40 to 44 Years | 118 (8.6%) | 103 (6.8%) |
| 45 to 49 Years | 93 (6.8%) | 85 (5.6%) |
| 50 to 54 Years | 110 (8.1%) | 51 (3.4%) |
| 55 to 59 Years | 80 (5.9%) | 113 (7.5%) |
| 60 to 64 Years | 64 (4.7%) | 37 (2.5%) |
| 65 to 69 Years | 37 (2.7%) | 55 (3.6%) |
| 70 to 74 Years | 43 (3.2%) | 75 (5.0%) |
| 75 to 79 Years | 29 (2.1%) | 21 (1.4%) |
| 80 to 84 Years | 9 (0.7%) | 24 (1.6%) |
| 85 Years and over | 8 (0.6%) | 43 (2.9%) |
| Total | 1,367 (100.0%) | 1,507 (100.0%) |
Families and Households in La Salle
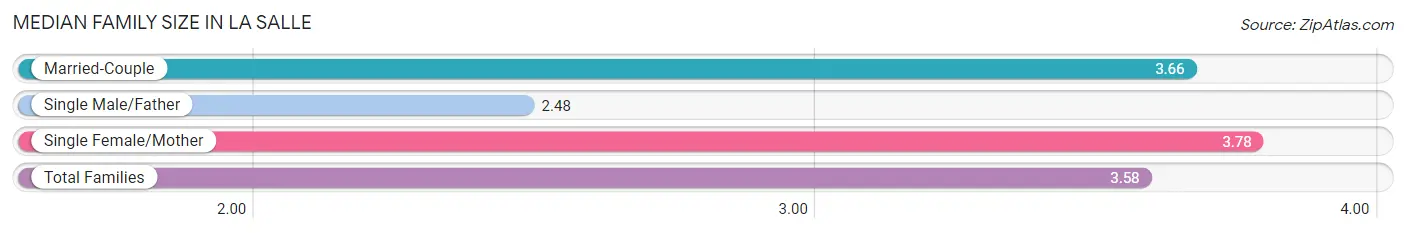
Median Family Size in La Salle
The median family size in La Salle is 3.58 persons per family, with single female/mother families (156 | 21.7%) accounting for the largest median family size of 3.78 persons per family. On the other hand, single male/father families (65 | 9.0%) represent the smallest median family size with 2.48 persons per family.
| Family Type | # Families | Family Size |
| Married-Couple | 498 (69.3%) | 3.66 |
| Single Male/Father | 65 (9.0%) | 2.48 |
| Single Female/Mother | 156 (21.7%) | 3.78 |
| Total Families | 719 (100.0%) | 3.58 |
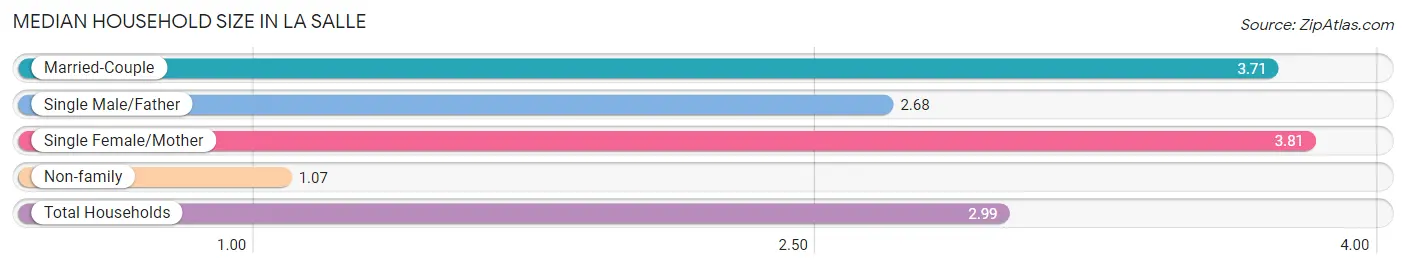
Median Household Size in La Salle
The median household size in La Salle is 2.99 persons per household, with single female/mother households (156 | 16.2%) accounting for the largest median household size of 3.81 persons per household. non-family households (242 | 25.2%) represent the smallest median household size with 1.07 persons per household.
| Household Type | # Households | Household Size |
| Married-Couple | 498 (51.8%) | 3.71 |
| Single Male/Father | 65 (6.8%) | 2.68 |
| Single Female/Mother | 156 (16.2%) | 3.81 |
| Non-family | 242 (25.2%) | 1.07 |
| Total Households | 961 (100.0%) | 2.99 |
Household Size by Marriage Status in La Salle
Out of a total of 961 households in La Salle, 719 (74.8%) are family households, while 242 (25.2%) are nonfamily households. The most numerous type of family households are 2-person households, comprising 234, and the most common type of nonfamily households are 1-person households, comprising 231.
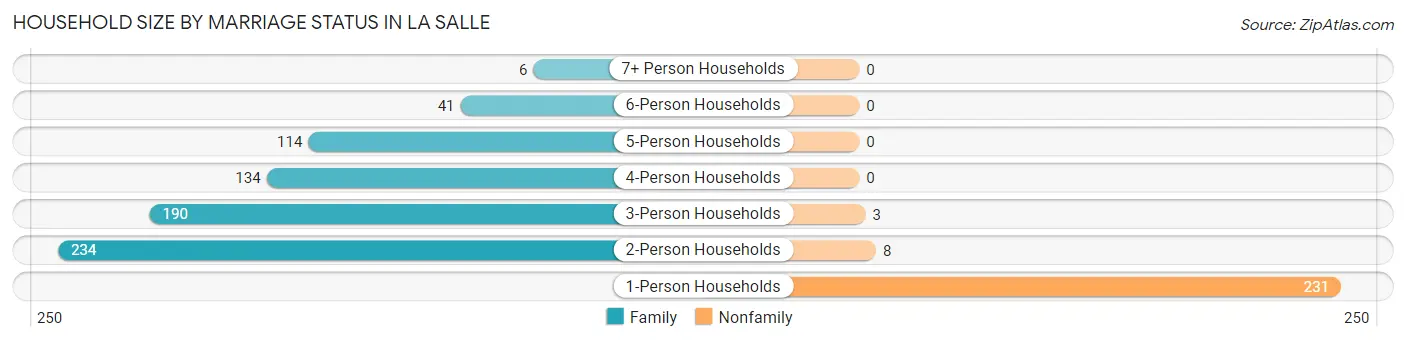
| Household Size | Family Households | Nonfamily Households |
| 1-Person Households | - | 231 (24.0%) |
| 2-Person Households | 234 (24.3%) | 8 (0.8%) |
| 3-Person Households | 190 (19.8%) | 3 (0.3%) |
| 4-Person Households | 134 (13.9%) | 0 (0.0%) |
| 5-Person Households | 114 (11.9%) | 0 (0.0%) |
| 6-Person Households | 41 (4.3%) | 0 (0.0%) |
| 7+ Person Households | 6 (0.6%) | 0 (0.0%) |
| Total | 719 (74.8%) | 242 (25.2%) |
Female Fertility in La Salle
Fertility by Age in La Salle
Average fertility rate in La Salle is 59.0 births per 1,000 women. Women in the age bracket of 20 to 34 years have the highest fertility rate with 148.0 births per 1,000 women. Women in the age bracket of 20 to 34 years acount for 100.0% of all women with births.
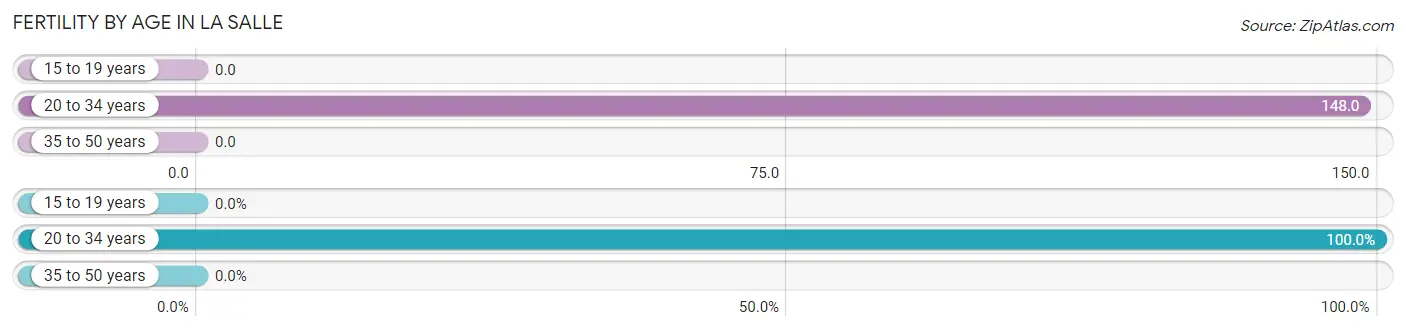
| Age Bracket | Women with Births | Births / 1,000 Women |
| 15 to 19 years | 0 (0.0%) | 0.0 |
| 20 to 34 years | 42 (100.0%) | 148.0 |
| 35 to 50 years | 0 (0.0%) | 0.0 |
| Total | 42 (100.0%) | 59.0 |
Fertility by Age by Marriage Status in La Salle
38.1% of women with births (42) in La Salle are married. The highest percentage of unmarried women with births falls into 20 to 34 years age bracket with 61.9% of them unmarried at the time of birth, while the lowest percentage of unmarried women with births belong to 20 to 34 years age bracket with 61.9% of them unmarried.
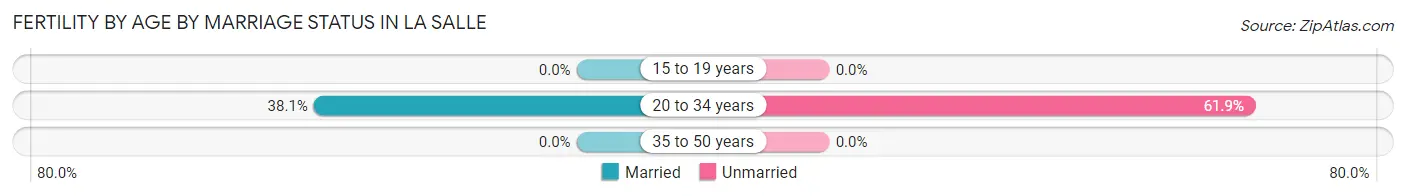
| Age Bracket | Married | Unmarried |
| 15 to 19 years | 0 (0.0%) | 0 (0.0%) |
| 20 to 34 years | 16 (38.1%) | 26 (61.9%) |
| 35 to 50 years | 0 (0.0%) | 0 (0.0%) |
| Total | 16 (38.1%) | 26 (61.9%) |
Fertility by Education in La Salle
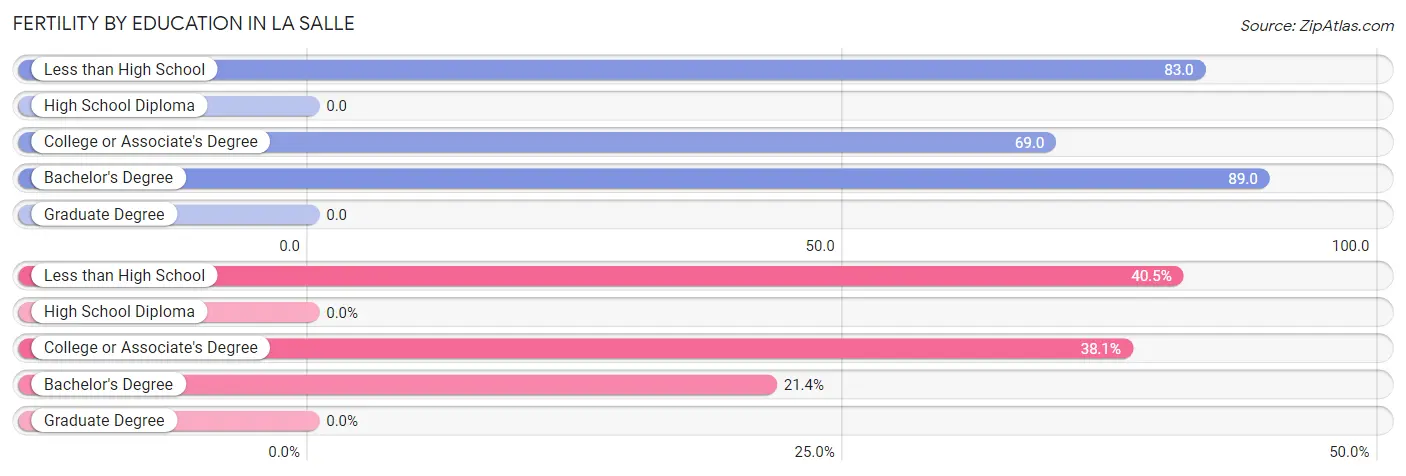
| Educational Attainment | Women with Births | Births / 1,000 Women |
| Less than High School | 17 (40.5%) | 83.0 |
| High School Diploma | 0 (0.0%) | 0.0 |
| College or Associate's Degree | 16 (38.1%) | 69.0 |
| Bachelor's Degree | 9 (21.4%) | 89.0 |
| Graduate Degree | 0 (0.0%) | 0.0 |
| Total | 42 (100.0%) | 59.0 |
Fertility by Education by Marriage Status in La Salle
61.9% of women with births in La Salle are unmarried. Women with the educational attainment of college or associate's degree are most likely to be married with 100.0% of them married at childbirth, while women with the educational attainment of less than high school are least likely to be married with 100.0% of them unmarried at childbirth.
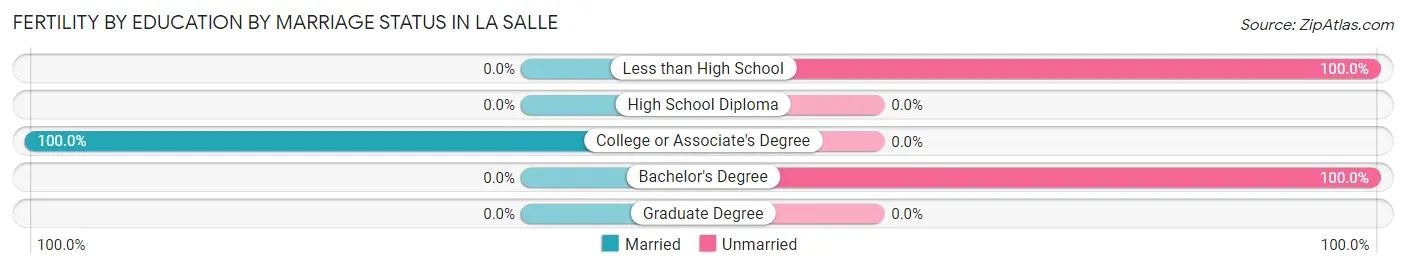
| Educational Attainment | Married | Unmarried |
| Less than High School | 0 (0.0%) | 17 (100.0%) |
| High School Diploma | 0 (0.0%) | 0 (0.0%) |
| College or Associate's Degree | 16 (100.0%) | 0 (0.0%) |
| Bachelor's Degree | 0 (0.0%) | 9 (100.0%) |
| Graduate Degree | 0 (0.0%) | 0 (0.0%) |
| Total | 16 (38.1%) | 26 (61.9%) |
Employment Characteristics in La Salle
Employment by Class of Employer in La Salle
Among the 1,500 employed individuals in La Salle, private company employees (1,162 | 77.5%), local government employees (127 | 8.5%), and self-employed (not incorporated) (64 | 4.3%) make up the most common classes of employment.
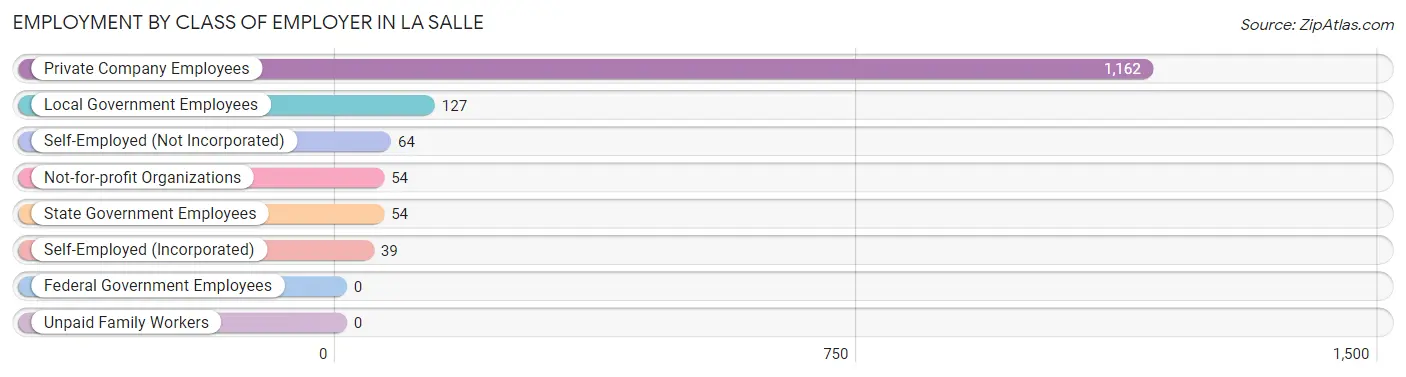
| Employer Class | # Employees | % Employees |
| Private Company Employees | 1,162 | 77.5% |
| Self-Employed (Incorporated) | 39 | 2.6% |
| Self-Employed (Not Incorporated) | 64 | 4.3% |
| Not-for-profit Organizations | 54 | 3.6% |
| Local Government Employees | 127 | 8.5% |
| State Government Employees | 54 | 3.6% |
| Federal Government Employees | 0 | 0.0% |
| Unpaid Family Workers | 0 | 0.0% |
| Total | 1,500 | 100.0% |
Employment Status by Age in La Salle
According to the labor force statistics for La Salle, out of the total population over 16 years of age (2,170), 71.3% or 1,547 individuals are in the labor force, with 1.6% or 25 of them unemployed. The age group with the highest labor force participation rate is 55 to 59 years, with 95.9% or 185 individuals in the labor force. Within the labor force, the 16 to 19 years age range has the highest percentage of unemployed individuals, with 2.7% or 5 of them being unemployed.
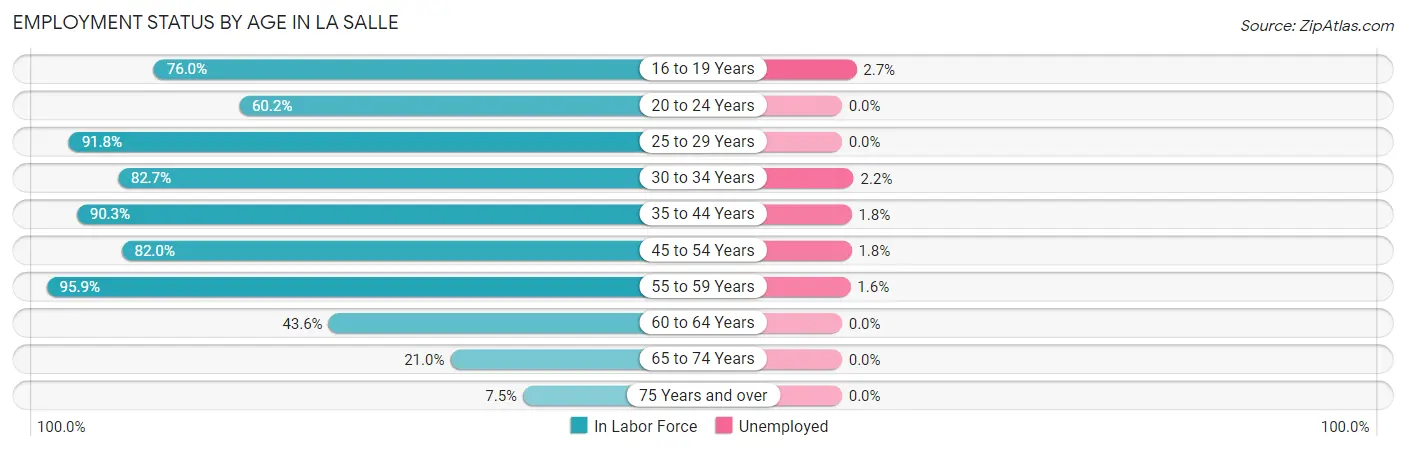
| Age Bracket | In Labor Force | Unemployed |
| 16 to 19 Years | 187 (76.0%) | 5 (2.7%) |
| 20 to 24 Years | 80 (60.2%) | 0 (0.0%) |
| 25 to 29 Years | 134 (91.8%) | 0 (0.0%) |
| 30 to 34 Years | 186 (82.7%) | 4 (2.2%) |
| 35 to 44 Years | 400 (90.3%) | 7 (1.8%) |
| 45 to 54 Years | 278 (82.0%) | 5 (1.8%) |
| 55 to 59 Years | 185 (95.9%) | 3 (1.6%) |
| 60 to 64 Years | 44 (43.6%) | 0 (0.0%) |
| 65 to 74 Years | 44 (21.0%) | 0 (0.0%) |
| 75 Years and over | 10 (7.5%) | 0 (0.0%) |
| Total | 1,547 (71.3%) | 25 (1.6%) |
Employment Status by Educational Attainment in La Salle
According to labor force statistics for La Salle, 84.8% of individuals (1,227) out of the total population between 25 and 64 years of age (1,447) are in the labor force, with 1.5% or 18 of them being unemployed. The group with the highest labor force participation rate are those with the educational attainment of bachelor's degree or higher, with 93.0% or 254 individuals in the labor force. Within the labor force, individuals with less than high school education have the highest percentage of unemployment, with 4.2% or 4 of them being unemployed.
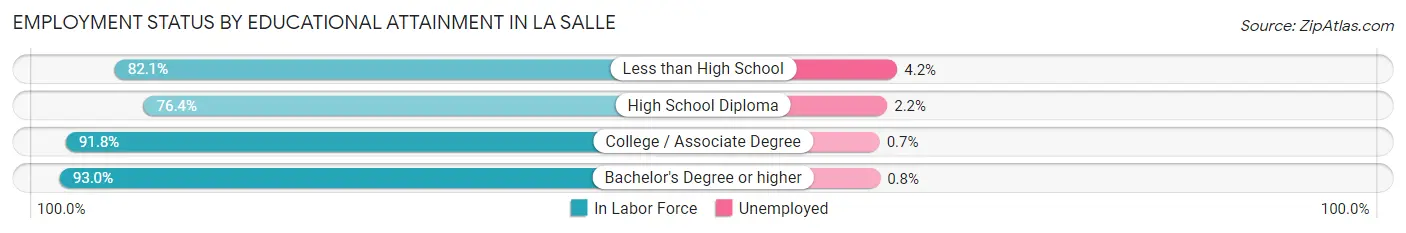
| Educational Attainment | In Labor Force | Unemployed |
| Less than High School | 96 (82.1%) | 5 (4.2%) |
| High School Diploma | 464 (76.4%) | 13 (2.2%) |
| College / Associate Degree | 413 (91.8%) | 3 (0.7%) |
| Bachelor's Degree or higher | 254 (93.0%) | 2 (0.8%) |
| Total | 1,227 (84.8%) | 22 (1.5%) |
Employment Occupations by Sex in La Salle
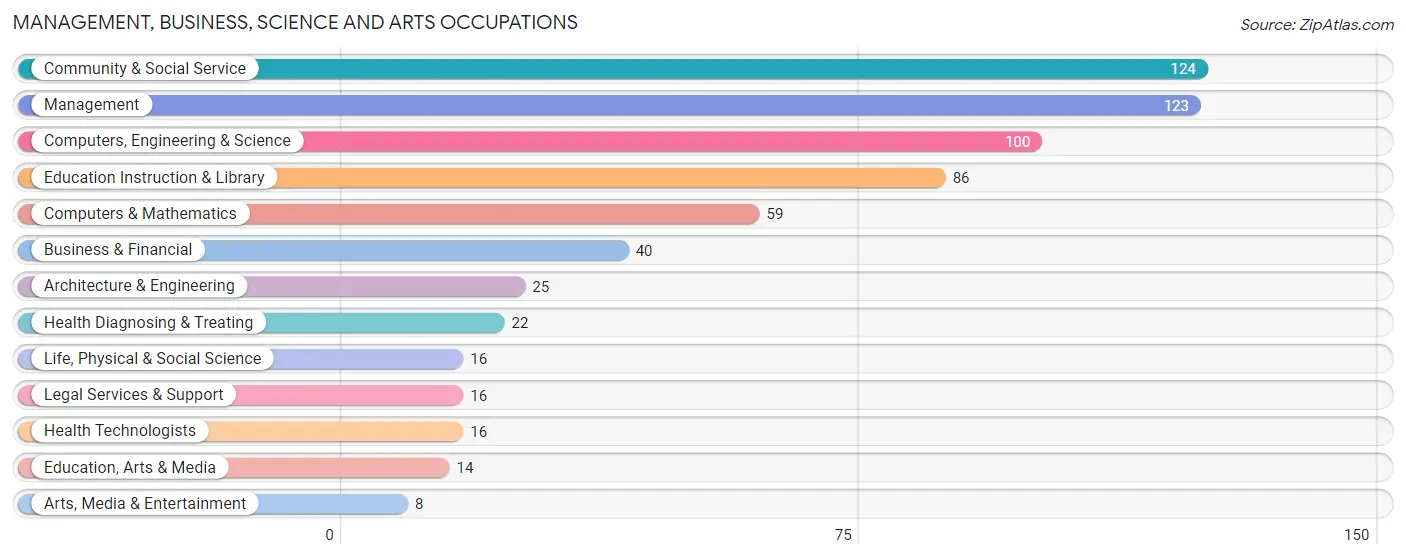
Management, Business, Science and Arts Occupations
The most common Management, Business, Science and Arts occupations in La Salle are Community & Social Service (124 | 8.1%), Management (123 | 8.1%), Computers, Engineering & Science (100 | 6.6%), Education Instruction & Library (86 | 5.6%), and Computers & Mathematics (59 | 3.9%).
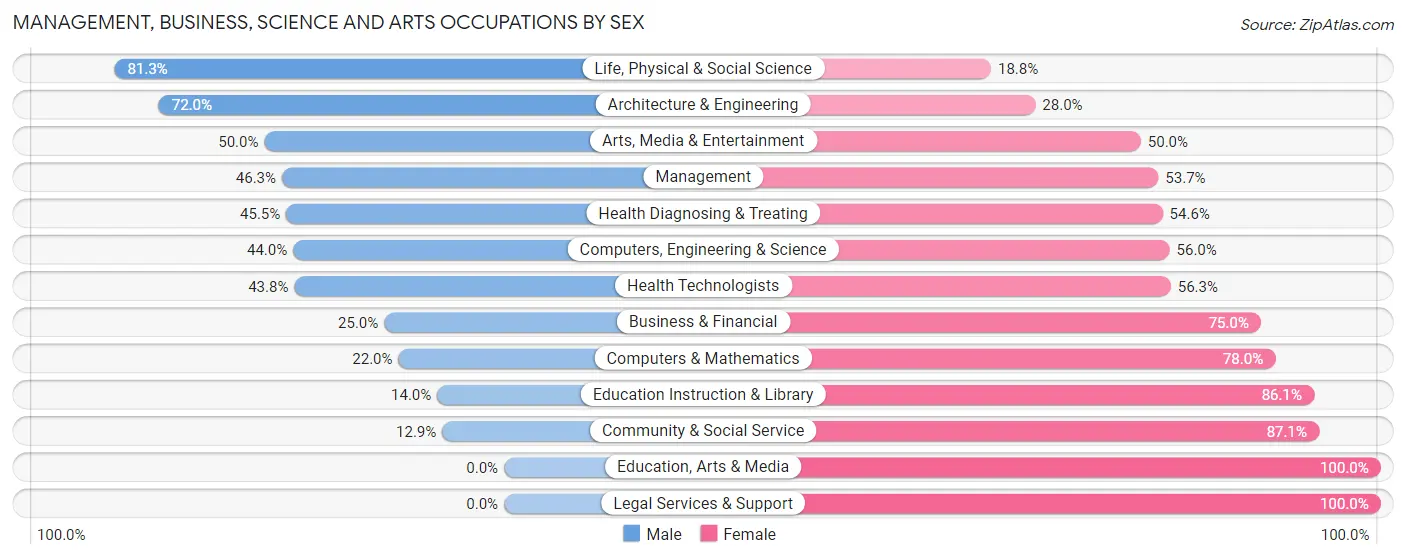
Management, Business, Science and Arts Occupations by Sex
Within the Management, Business, Science and Arts occupations in La Salle, the most male-oriented occupations are Life, Physical & Social Science (81.2%), Architecture & Engineering (72.0%), and Arts, Media & Entertainment (50.0%), while the most female-oriented occupations are Education, Arts & Media (100.0%), Legal Services & Support (100.0%), and Community & Social Service (87.1%).
| Occupation | Male | Female |
| Management | 57 (46.3%) | 66 (53.7%) |
| Business & Financial | 10 (25.0%) | 30 (75.0%) |
| Computers, Engineering & Science | 44 (44.0%) | 56 (56.0%) |
| Computers & Mathematics | 13 (22.0%) | 46 (78.0%) |
| Architecture & Engineering | 18 (72.0%) | 7 (28.0%) |
| Life, Physical & Social Science | 13 (81.2%) | 3 (18.8%) |
| Community & Social Service | 16 (12.9%) | 108 (87.1%) |
| Education, Arts & Media | 0 (0.0%) | 14 (100.0%) |
| Legal Services & Support | 0 (0.0%) | 16 (100.0%) |
| Education Instruction & Library | 12 (14.0%) | 74 (86.1%) |
| Arts, Media & Entertainment | 4 (50.0%) | 4 (50.0%) |
| Health Diagnosing & Treating | 10 (45.5%) | 12 (54.5%) |
| Health Technologists | 7 (43.8%) | 9 (56.2%) |
| Total (Category) | 137 (33.5%) | 272 (66.5%) |
| Total (Overall) | 824 (54.1%) | 700 (45.9%) |
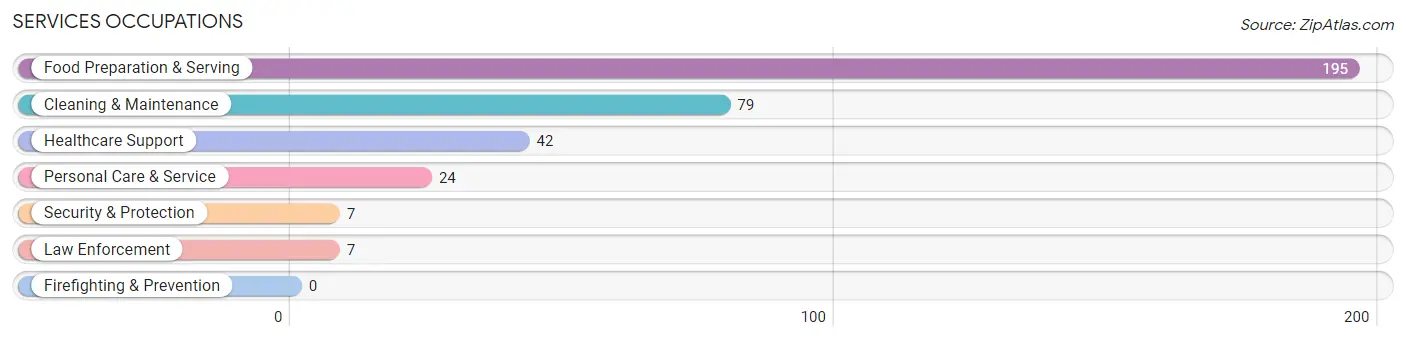
Services Occupations
The most common Services occupations in La Salle are Food Preparation & Serving (195 | 12.8%), Cleaning & Maintenance (79 | 5.2%), Healthcare Support (42 | 2.8%), Personal Care & Service (24 | 1.6%), and Security & Protection (7 | 0.5%).
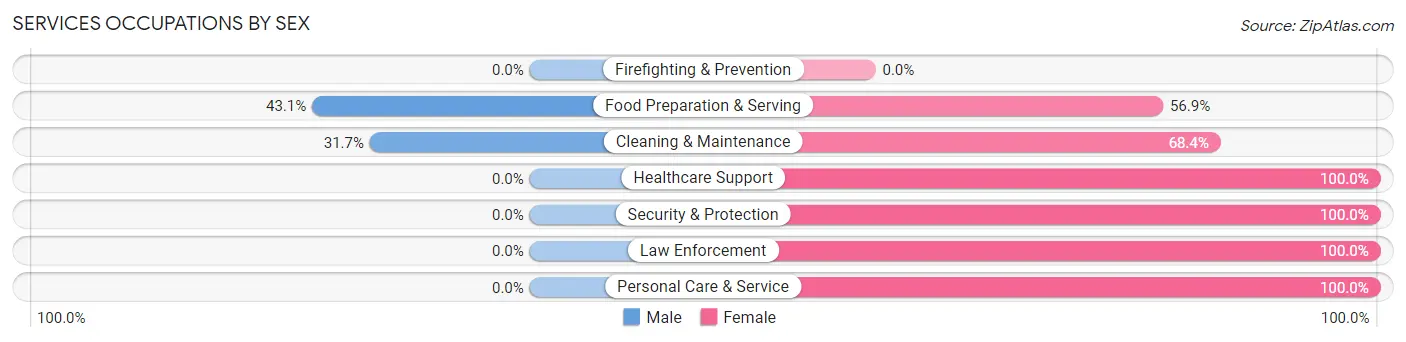
Services Occupations by Sex
Within the Services occupations in La Salle, the most male-oriented occupations are Food Preparation & Serving (43.1%), and Cleaning & Maintenance (31.7%), while the most female-oriented occupations are Healthcare Support (100.0%), Security & Protection (100.0%), and Law Enforcement (100.0%).
| Occupation | Male | Female |
| Healthcare Support | 0 (0.0%) | 42 (100.0%) |
| Security & Protection | 0 (0.0%) | 7 (100.0%) |
| Firefighting & Prevention | 0 (0.0%) | 0 (0.0%) |
| Law Enforcement | 0 (0.0%) | 7 (100.0%) |
| Food Preparation & Serving | 84 (43.1%) | 111 (56.9%) |
| Cleaning & Maintenance | 25 (31.7%) | 54 (68.3%) |
| Personal Care & Service | 0 (0.0%) | 24 (100.0%) |
| Total (Category) | 109 (31.4%) | 238 (68.6%) |
| Total (Overall) | 824 (54.1%) | 700 (45.9%) |
Sales and Office Occupations
The most common Sales and Office occupations in La Salle are Office & Administration (114 | 7.5%), and Sales & Related (76 | 5.0%).
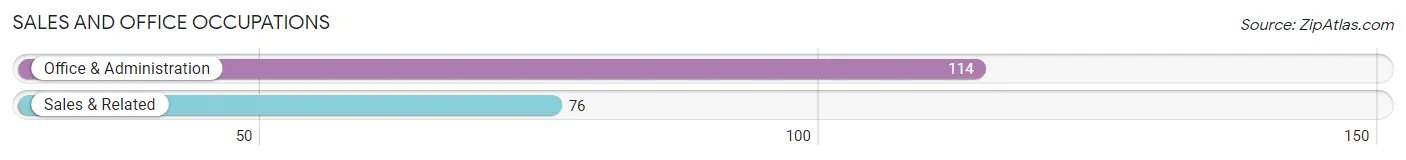
Sales and Office Occupations by Sex
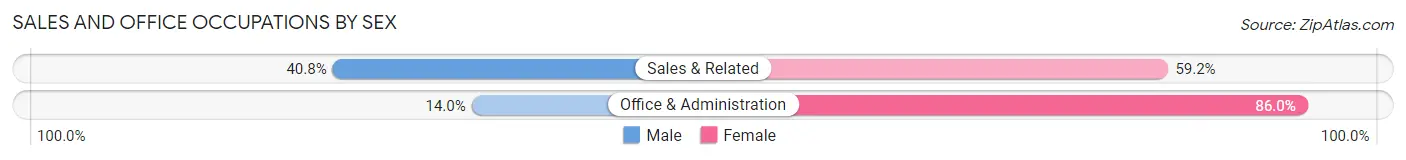
| Occupation | Male | Female |
| Sales & Related | 31 (40.8%) | 45 (59.2%) |
| Office & Administration | 16 (14.0%) | 98 (86.0%) |
| Total (Category) | 47 (24.7%) | 143 (75.3%) |
| Total (Overall) | 824 (54.1%) | 700 (45.9%) |
Natural Resources, Construction and Maintenance Occupations
The most common Natural Resources, Construction and Maintenance occupations in La Salle are Construction & Extraction (220 | 14.4%), Installation, Maintenance & Repair (104 | 6.8%), and Farming, Fishing & Forestry (2 | 0.1%).
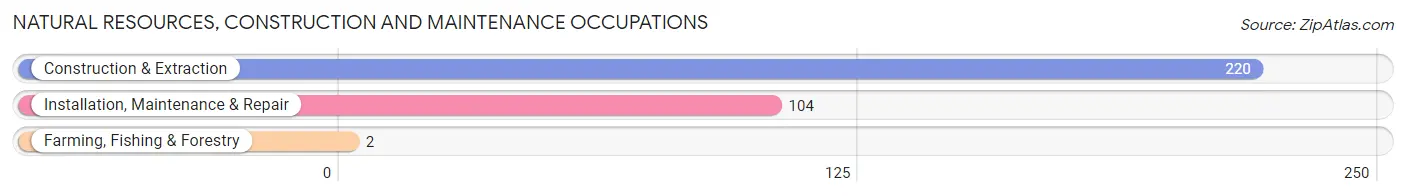
Natural Resources, Construction and Maintenance Occupations by Sex
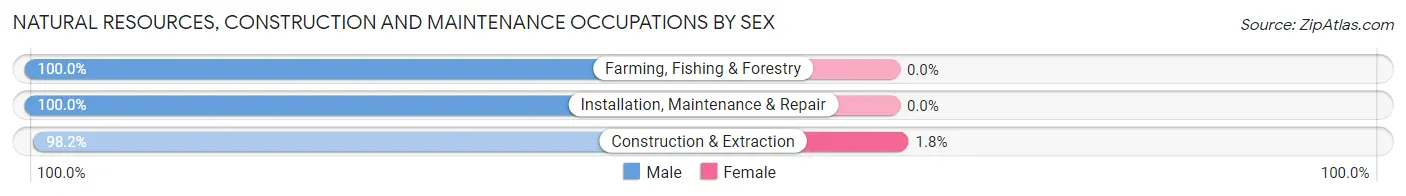
| Occupation | Male | Female |
| Farming, Fishing & Forestry | 2 (100.0%) | 0 (0.0%) |
| Construction & Extraction | 216 (98.2%) | 4 (1.8%) |
| Installation, Maintenance & Repair | 104 (100.0%) | 0 (0.0%) |
| Total (Category) | 322 (98.8%) | 4 (1.2%) |
| Total (Overall) | 824 (54.1%) | 700 (45.9%) |
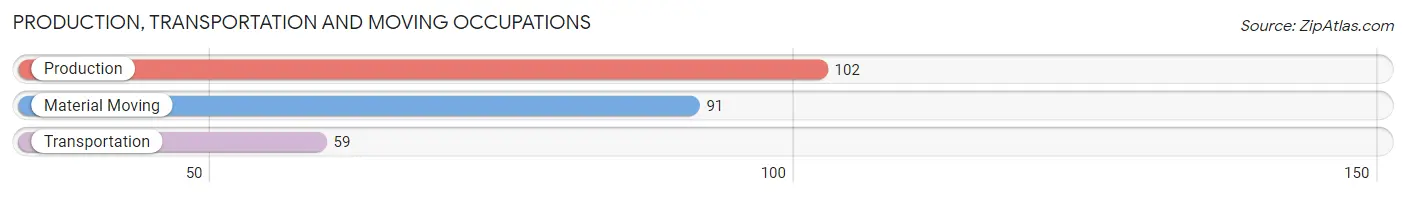
Production, Transportation and Moving Occupations
The most common Production, Transportation and Moving occupations in La Salle are Production (102 | 6.7%), Material Moving (91 | 6.0%), and Transportation (59 | 3.9%).
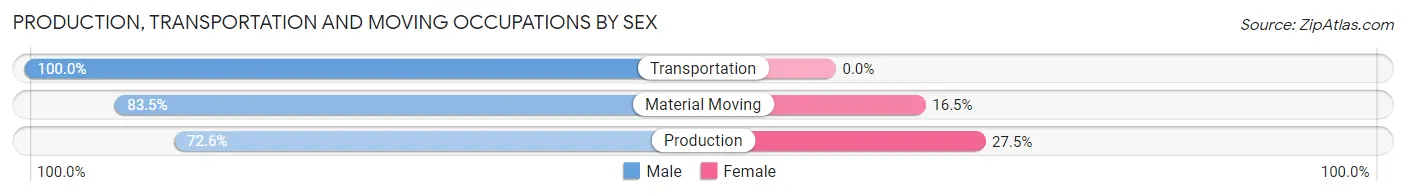
Production, Transportation and Moving Occupations by Sex
| Occupation | Male | Female |
| Production | 74 (72.6%) | 28 (27.5%) |
| Transportation | 59 (100.0%) | 0 (0.0%) |
| Material Moving | 76 (83.5%) | 15 (16.5%) |
| Total (Category) | 209 (82.9%) | 43 (17.1%) |
| Total (Overall) | 824 (54.1%) | 700 (45.9%) |
Employment Industries by Sex in La Salle
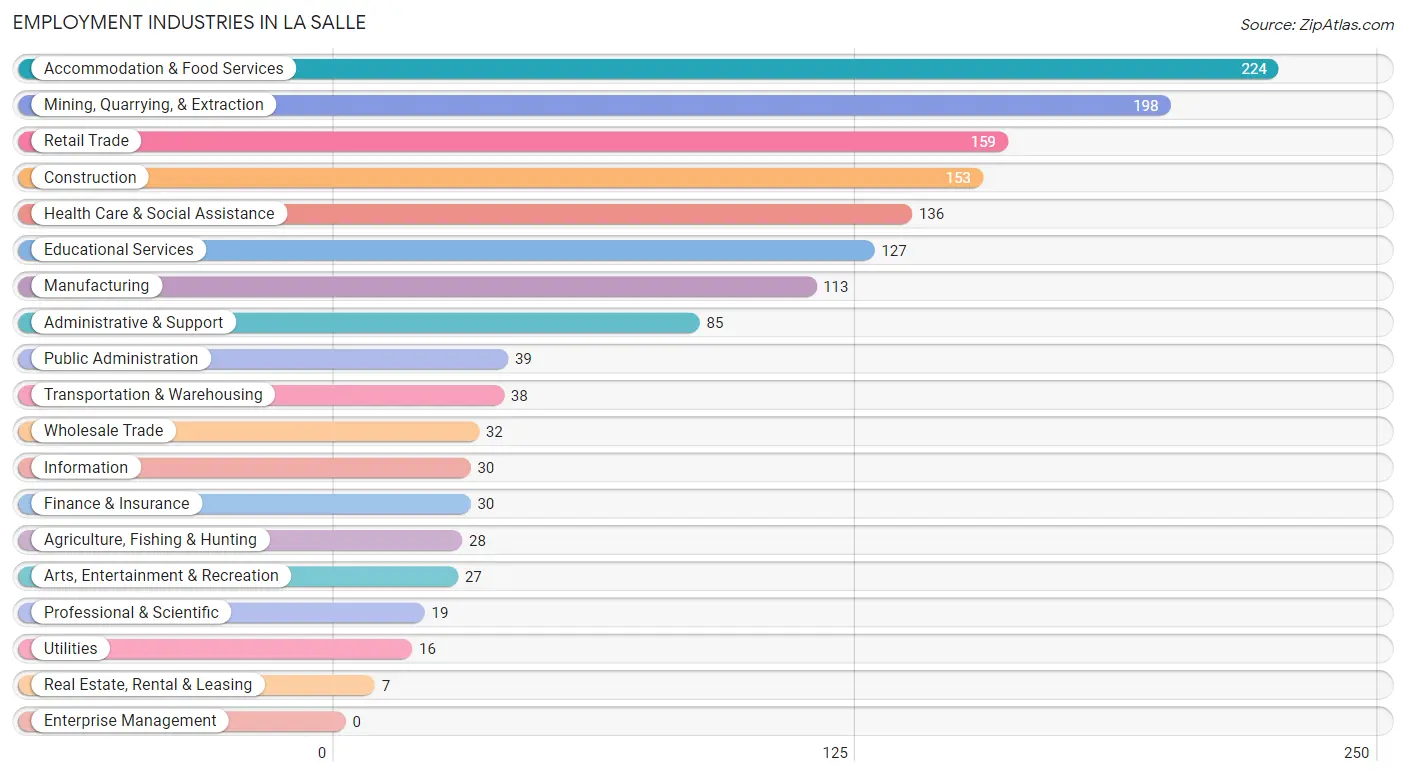
Employment Industries in La Salle
The major employment industries in La Salle include Accommodation & Food Services (224 | 14.7%), Mining, Quarrying, & Extraction (198 | 13.0%), Retail Trade (159 | 10.4%), Construction (153 | 10.0%), and Health Care & Social Assistance (136 | 8.9%).
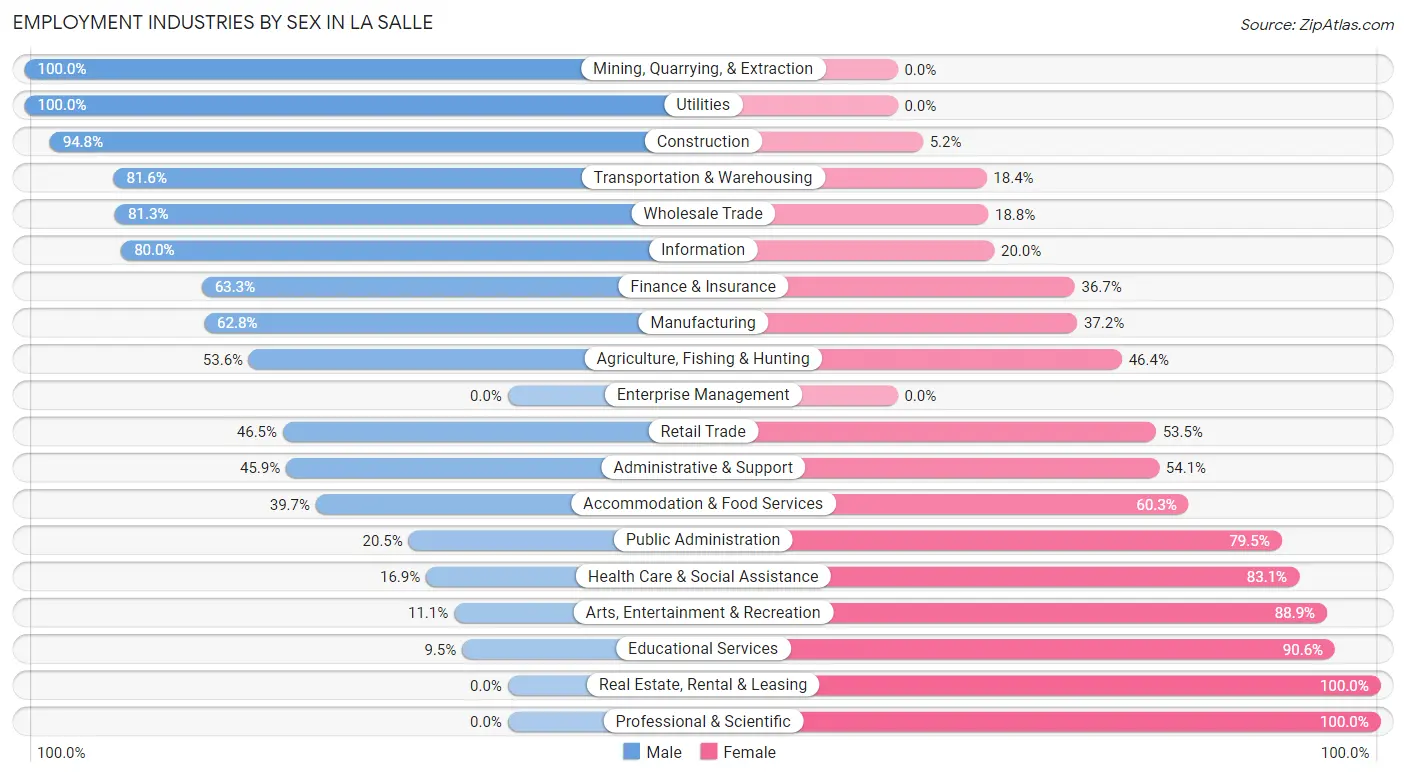
Employment Industries by Sex in La Salle
The La Salle industries that see more men than women are Mining, Quarrying, & Extraction (100.0%), Utilities (100.0%), and Construction (94.8%), whereas the industries that tend to have a higher number of women are Real Estate, Rental & Leasing (100.0%), Professional & Scientific (100.0%), and Educational Services (90.5%).
| Industry | Male | Female |
| Agriculture, Fishing & Hunting | 15 (53.6%) | 13 (46.4%) |
| Mining, Quarrying, & Extraction | 198 (100.0%) | 0 (0.0%) |
| Construction | 145 (94.8%) | 8 (5.2%) |
| Manufacturing | 71 (62.8%) | 42 (37.2%) |
| Wholesale Trade | 26 (81.2%) | 6 (18.8%) |
| Retail Trade | 74 (46.5%) | 85 (53.5%) |
| Transportation & Warehousing | 31 (81.6%) | 7 (18.4%) |
| Utilities | 16 (100.0%) | 0 (0.0%) |
| Information | 24 (80.0%) | 6 (20.0%) |
| Finance & Insurance | 19 (63.3%) | 11 (36.7%) |
| Real Estate, Rental & Leasing | 0 (0.0%) | 7 (100.0%) |
| Professional & Scientific | 0 (0.0%) | 19 (100.0%) |
| Enterprise Management | 0 (0.0%) | 0 (0.0%) |
| Administrative & Support | 39 (45.9%) | 46 (54.1%) |
| Educational Services | 12 (9.5%) | 115 (90.5%) |
| Health Care & Social Assistance | 23 (16.9%) | 113 (83.1%) |
| Arts, Entertainment & Recreation | 3 (11.1%) | 24 (88.9%) |
| Accommodation & Food Services | 89 (39.7%) | 135 (60.3%) |
| Public Administration | 8 (20.5%) | 31 (79.5%) |
| Total | 824 (54.1%) | 700 (45.9%) |
Education in La Salle
School Enrollment in La Salle
The most common levels of schooling among the 888 students in La Salle are high school (261 | 29.4%), middle school (187 | 21.1%), and elementary school (174 | 19.6%).
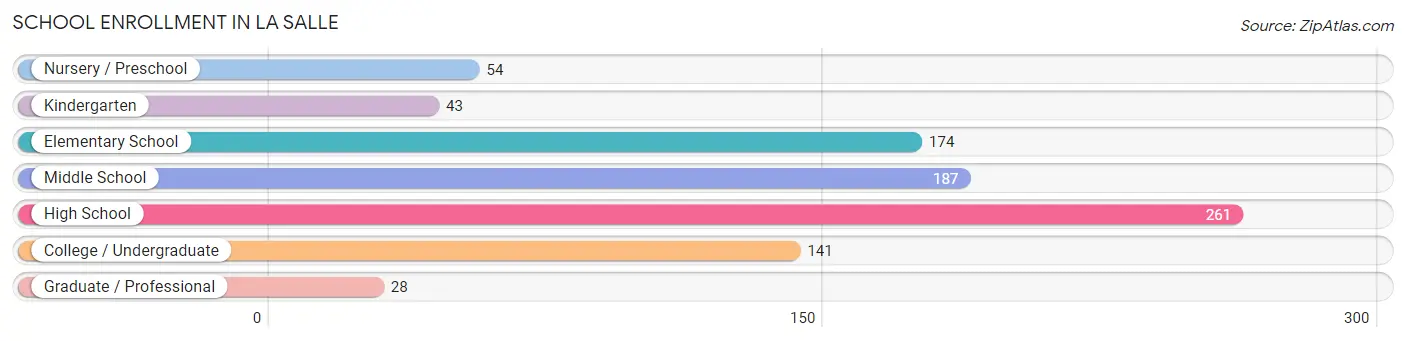
| School Level | # Students | % Students |
| Nursery / Preschool | 54 | 6.1% |
| Kindergarten | 43 | 4.8% |
| Elementary School | 174 | 19.6% |
| Middle School | 187 | 21.1% |
| High School | 261 | 29.4% |
| College / Undergraduate | 141 | 15.9% |
| Graduate / Professional | 28 | 3.2% |
| Total | 888 | 100.0% |
School Enrollment by Age by Funding Source in La Salle
Out of a total of 888 students who are enrolled in schools in La Salle, 22 (2.5%) attend a private institution, while the remaining 866 (97.5%) are enrolled in public schools. The age group of 3 to 4 year olds has the highest likelihood of being enrolled in private schools, with 18 (39.1% in the age bracket) enrolled. Conversely, the age group of 10 to 14 year olds has the lowest likelihood of being enrolled in a private school, with 203 (100.0% in the age bracket) attending a public institution.
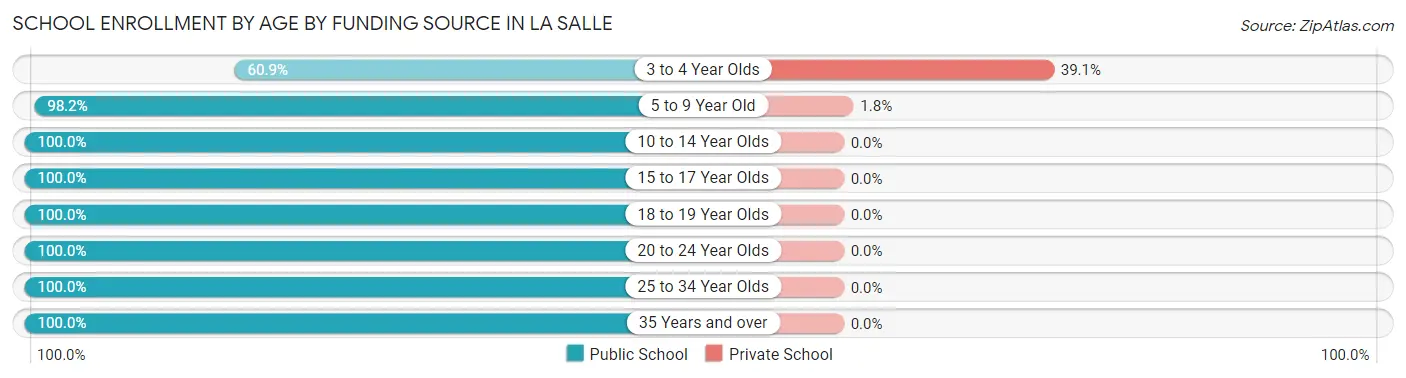
| Age Bracket | Public School | Private School |
| 3 to 4 Year Olds | 28 (60.9%) | 18 (39.1%) |
| 5 to 9 Year Old | 217 (98.2%) | 4 (1.8%) |
| 10 to 14 Year Olds | 203 (100.0%) | 0 (0.0%) |
| 15 to 17 Year Olds | 141 (100.0%) | 0 (0.0%) |
| 18 to 19 Year Olds | 127 (100.0%) | 0 (0.0%) |
| 20 to 24 Year Olds | 39 (100.0%) | 0 (0.0%) |
| 25 to 34 Year Olds | 31 (100.0%) | 0 (0.0%) |
| 35 Years and over | 80 (100.0%) | 0 (0.0%) |
| Total | 866 (97.5%) | 22 (2.5%) |
Educational Attainment by Field of Study in La Salle
Business (116 | 29.9%), education (56 | 14.4%), science & technology (36 | 9.3%), liberal arts & history (32 | 8.3%), and arts & humanities (31 | 8.0%) are the most common fields of study among 388 individuals in La Salle who have obtained a bachelor's degree or higher.
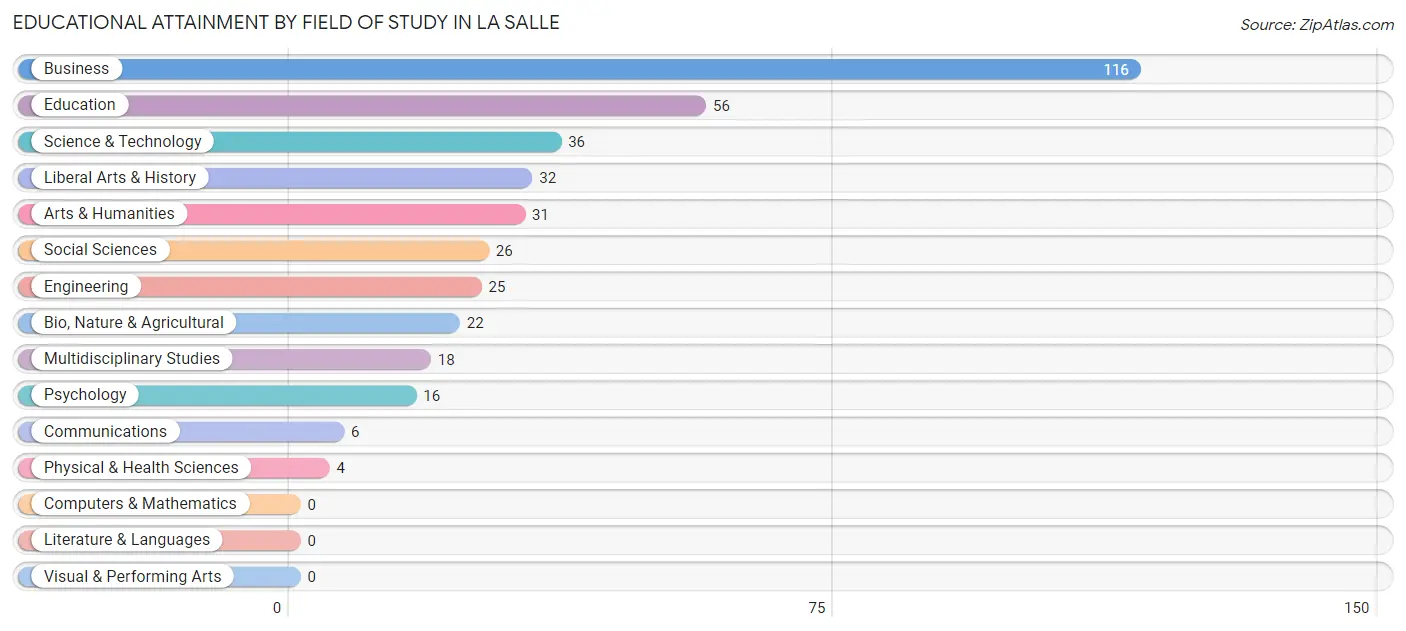
| Field of Study | # Graduates | % Graduates |
| Computers & Mathematics | 0 | 0.0% |
| Bio, Nature & Agricultural | 22 | 5.7% |
| Physical & Health Sciences | 4 | 1.0% |
| Psychology | 16 | 4.1% |
| Social Sciences | 26 | 6.7% |
| Engineering | 25 | 6.4% |
| Multidisciplinary Studies | 18 | 4.6% |
| Science & Technology | 36 | 9.3% |
| Business | 116 | 29.9% |
| Education | 56 | 14.4% |
| Literature & Languages | 0 | 0.0% |
| Liberal Arts & History | 32 | 8.3% |
| Visual & Performing Arts | 0 | 0.0% |
| Communications | 6 | 1.5% |
| Arts & Humanities | 31 | 8.0% |
| Total | 388 | 100.0% |
Transportation & Commute in La Salle
Vehicle Availability by Sex in La Salle
The most prevalent vehicle ownership categories in La Salle are males with 2 vehicles (327, accounting for 40.6%) and females with 2 vehicles (271, making up 47.0%).
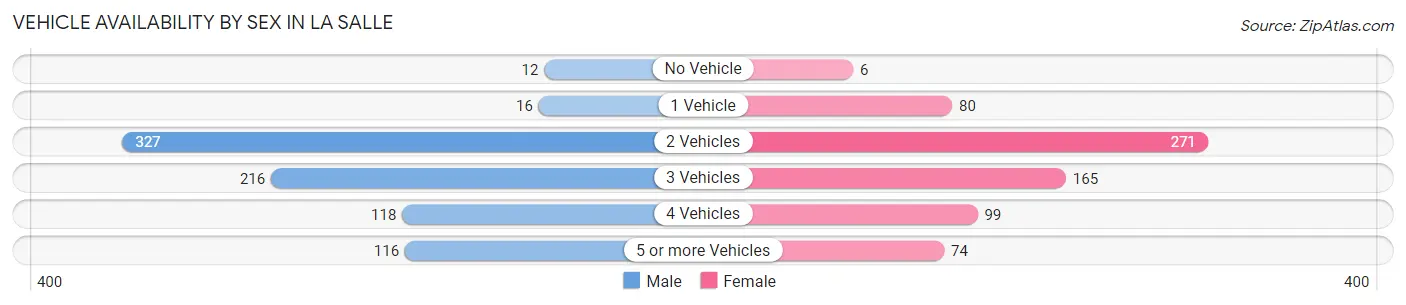
| Vehicles Available | Male | Female |
| No Vehicle | 12 (1.5%) | 6 (0.9%) |
| 1 Vehicle | 16 (2.0%) | 80 (11.5%) |
| 2 Vehicles | 327 (40.6%) | 271 (39.0%) |
| 3 Vehicles | 216 (26.8%) | 165 (23.7%) |
| 4 Vehicles | 118 (14.7%) | 99 (14.2%) |
| 5 or more Vehicles | 116 (14.4%) | 74 (10.6%) |
| Total | 805 (100.0%) | 695 (100.0%) |
Commute Time in La Salle
The most frequently occuring commute durations in La Salle are 30 to 34 minutes (300 commuters, 20.6%), 20 to 24 minutes (240 commuters, 16.5%), and 15 to 19 minutes (203 commuters, 13.9%).
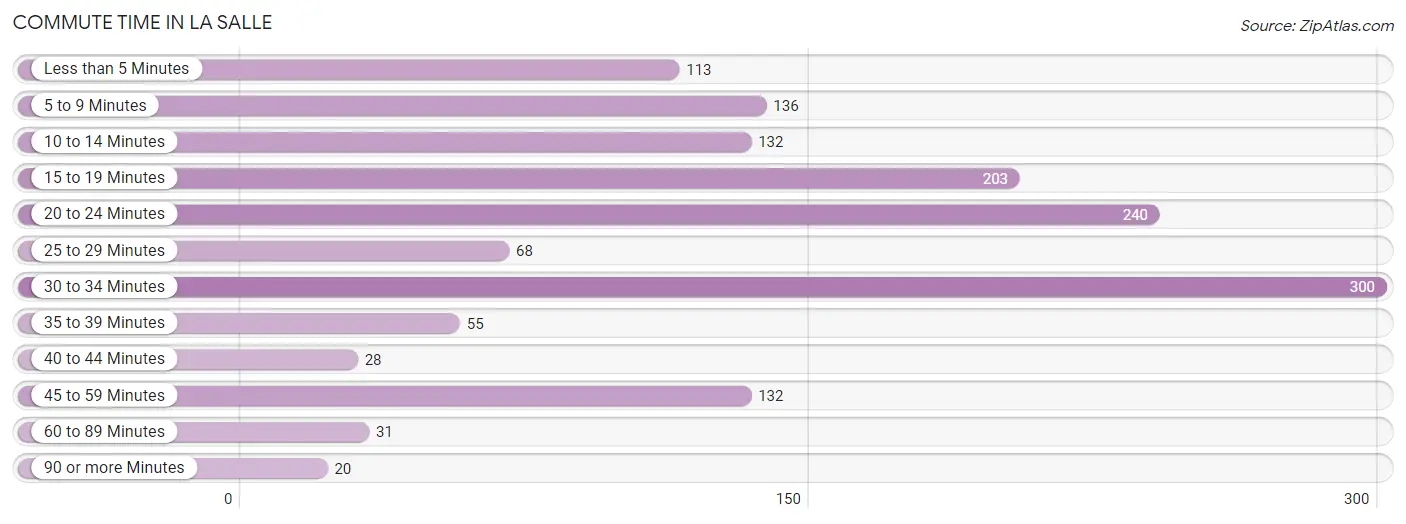
| Commute Time | # Commuters | % Commuters |
| Less than 5 Minutes | 113 | 7.7% |
| 5 to 9 Minutes | 136 | 9.3% |
| 10 to 14 Minutes | 132 | 9.0% |
| 15 to 19 Minutes | 203 | 13.9% |
| 20 to 24 Minutes | 240 | 16.5% |
| 25 to 29 Minutes | 68 | 4.7% |
| 30 to 34 Minutes | 300 | 20.6% |
| 35 to 39 Minutes | 55 | 3.8% |
| 40 to 44 Minutes | 28 | 1.9% |
| 45 to 59 Minutes | 132 | 9.0% |
| 60 to 89 Minutes | 31 | 2.1% |
| 90 or more Minutes | 20 | 1.4% |
Commute Time by Sex in La Salle
The most common commute times in La Salle are 30 to 34 minutes (173 commuters, 21.8%) for males and 15 to 19 minutes (131 commuters, 19.7%) for females.
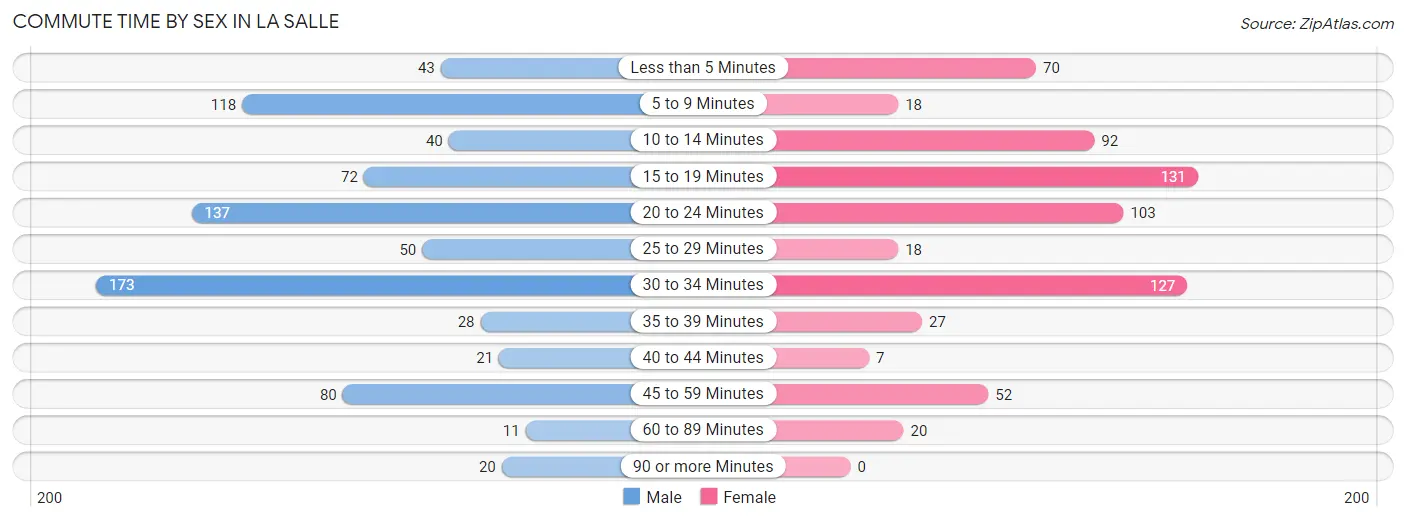
| Commute Time | Male | Female |
| Less than 5 Minutes | 43 (5.4%) | 70 (10.5%) |
| 5 to 9 Minutes | 118 (14.9%) | 18 (2.7%) |
| 10 to 14 Minutes | 40 (5.0%) | 92 (13.8%) |
| 15 to 19 Minutes | 72 (9.1%) | 131 (19.7%) |
| 20 to 24 Minutes | 137 (17.3%) | 103 (15.5%) |
| 25 to 29 Minutes | 50 (6.3%) | 18 (2.7%) |
| 30 to 34 Minutes | 173 (21.8%) | 127 (19.1%) |
| 35 to 39 Minutes | 28 (3.5%) | 27 (4.1%) |
| 40 to 44 Minutes | 21 (2.6%) | 7 (1.1%) |
| 45 to 59 Minutes | 80 (10.1%) | 52 (7.8%) |
| 60 to 89 Minutes | 11 (1.4%) | 20 (3.0%) |
| 90 or more Minutes | 20 (2.5%) | 0 (0.0%) |
Time of Departure to Work by Sex in La Salle
The most frequent times of departure to work in La Salle are 6:30 AM to 6:59 AM (152, 19.2%) for males and 8:30 AM to 8:59 AM (156, 23.5%) for females.
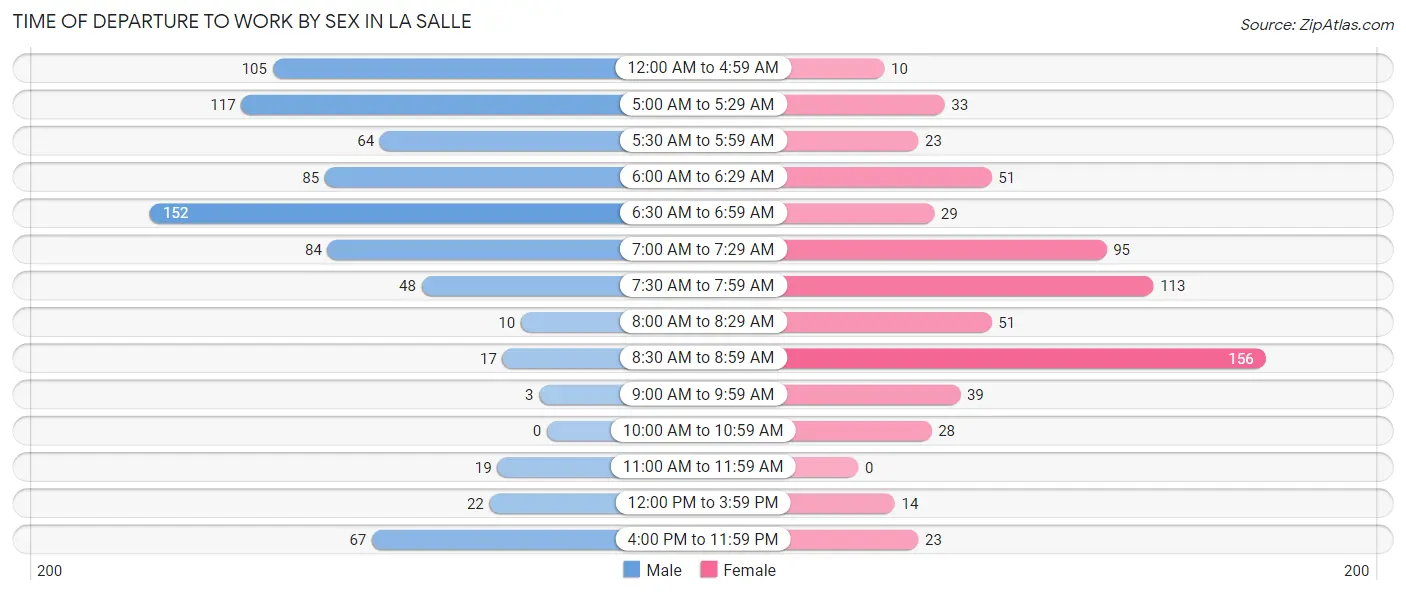
| Time of Departure | Male | Female |
| 12:00 AM to 4:59 AM | 105 (13.2%) | 10 (1.5%) |
| 5:00 AM to 5:29 AM | 117 (14.7%) | 33 (5.0%) |
| 5:30 AM to 5:59 AM | 64 (8.1%) | 23 (3.5%) |
| 6:00 AM to 6:29 AM | 85 (10.7%) | 51 (7.7%) |
| 6:30 AM to 6:59 AM | 152 (19.2%) | 29 (4.4%) |
| 7:00 AM to 7:29 AM | 84 (10.6%) | 95 (14.3%) |
| 7:30 AM to 7:59 AM | 48 (6.0%) | 113 (17.0%) |
| 8:00 AM to 8:29 AM | 10 (1.3%) | 51 (7.7%) |
| 8:30 AM to 8:59 AM | 17 (2.1%) | 156 (23.5%) |
| 9:00 AM to 9:59 AM | 3 (0.4%) | 39 (5.9%) |
| 10:00 AM to 10:59 AM | 0 (0.0%) | 28 (4.2%) |
| 11:00 AM to 11:59 AM | 19 (2.4%) | 0 (0.0%) |
| 12:00 PM to 3:59 PM | 22 (2.8%) | 14 (2.1%) |
| 4:00 PM to 11:59 PM | 67 (8.5%) | 23 (3.5%) |
| Total | 793 (100.0%) | 665 (100.0%) |
Housing Occupancy in La Salle
Occupancy by Ownership in La Salle
Of the total 961 dwellings in La Salle, owner-occupied units account for 837 (87.1%), while renter-occupied units make up 124 (12.9%).
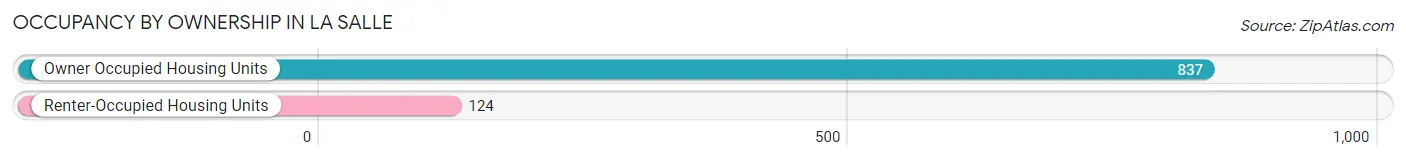
| Occupancy | # Housing Units | % Housing Units |
| Owner Occupied Housing Units | 837 | 87.1% |
| Renter-Occupied Housing Units | 124 | 12.9% |
| Total Occupied Housing Units | 961 | 100.0% |
Occupancy by Household Size in La Salle
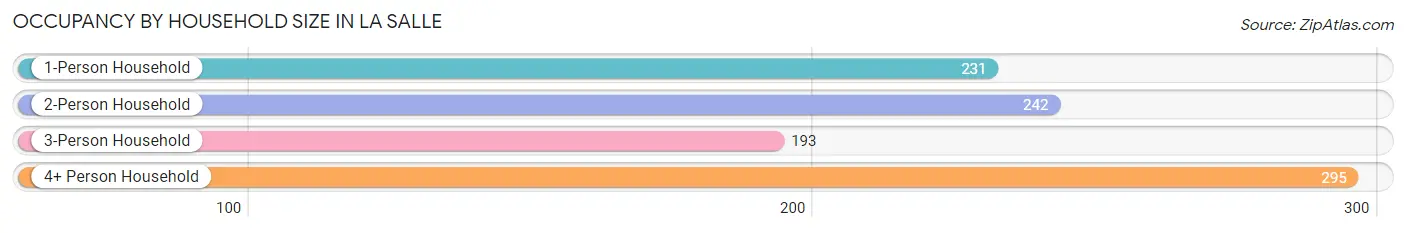
| Household Size | # Housing Units | % Housing Units |
| 1-Person Household | 231 | 24.0% |
| 2-Person Household | 242 | 25.2% |
| 3-Person Household | 193 | 20.1% |
| 4+ Person Household | 295 | 30.7% |
| Total Housing Units | 961 | 100.0% |
Occupancy by Ownership by Household Size in La Salle
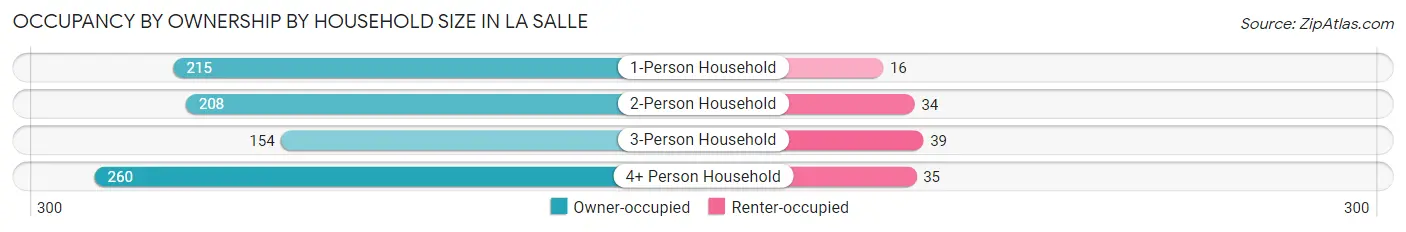
| Household Size | Owner-occupied | Renter-occupied |
| 1-Person Household | 215 (93.1%) | 16 (6.9%) |
| 2-Person Household | 208 (86.0%) | 34 (14.1%) |
| 3-Person Household | 154 (79.8%) | 39 (20.2%) |
| 4+ Person Household | 260 (88.1%) | 35 (11.9%) |
| Total Housing Units | 837 (87.1%) | 124 (12.9%) |
Occupancy by Educational Attainment in La Salle
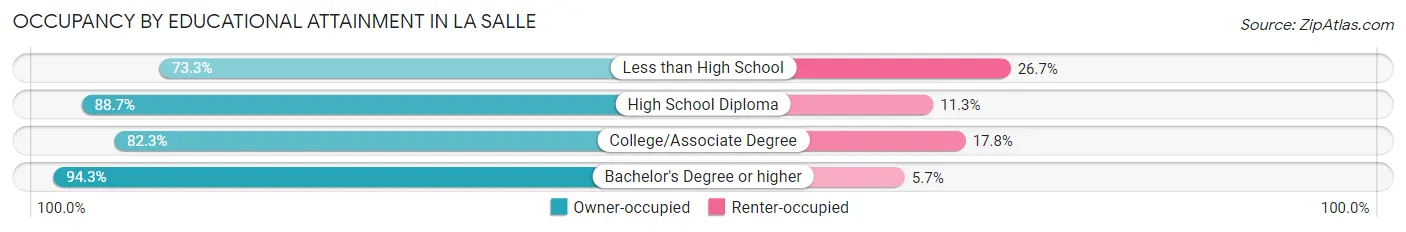
| Household Size | Owner-occupied | Renter-occupied |
| Less than High School | 44 (73.3%) | 16 (26.7%) |
| High School Diploma | 337 (88.7%) | 43 (11.3%) |
| College/Associate Degree | 241 (82.3%) | 52 (17.7%) |
| Bachelor's Degree or higher | 215 (94.3%) | 13 (5.7%) |
Occupancy by Age of Householder in La Salle

| Age Bracket | # Households | % Households |
| Under 35 Years | 211 | 22.0% |
| 35 to 44 Years | 210 | 21.8% |
| 45 to 54 Years | 204 | 21.2% |
| 55 to 64 Years | 126 | 13.1% |
| 65 to 74 Years | 124 | 12.9% |
| 75 to 84 Years | 41 | 4.3% |
| 85 Years and Over | 45 | 4.7% |
| Total | 961 | 100.0% |
Housing Finances in La Salle
Median Income by Occupancy in La Salle
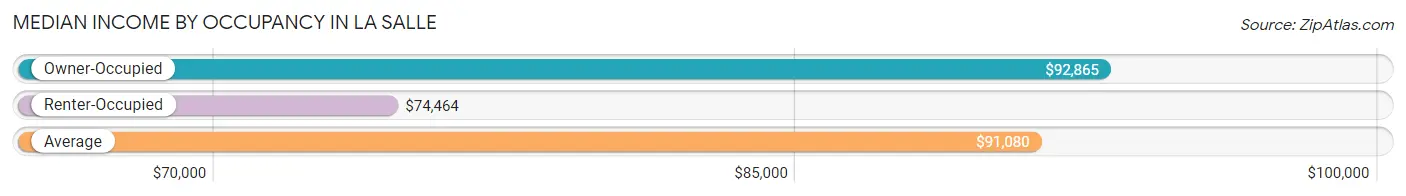
| Occupancy Type | # Households | Median Income |
| Owner-Occupied | 837 (87.1%) | $92,865 |
| Renter-Occupied | 124 (12.9%) | $74,464 |
| Average | 961 (100.0%) | $91,080 |
Occupancy by Householder Income Bracket in La Salle
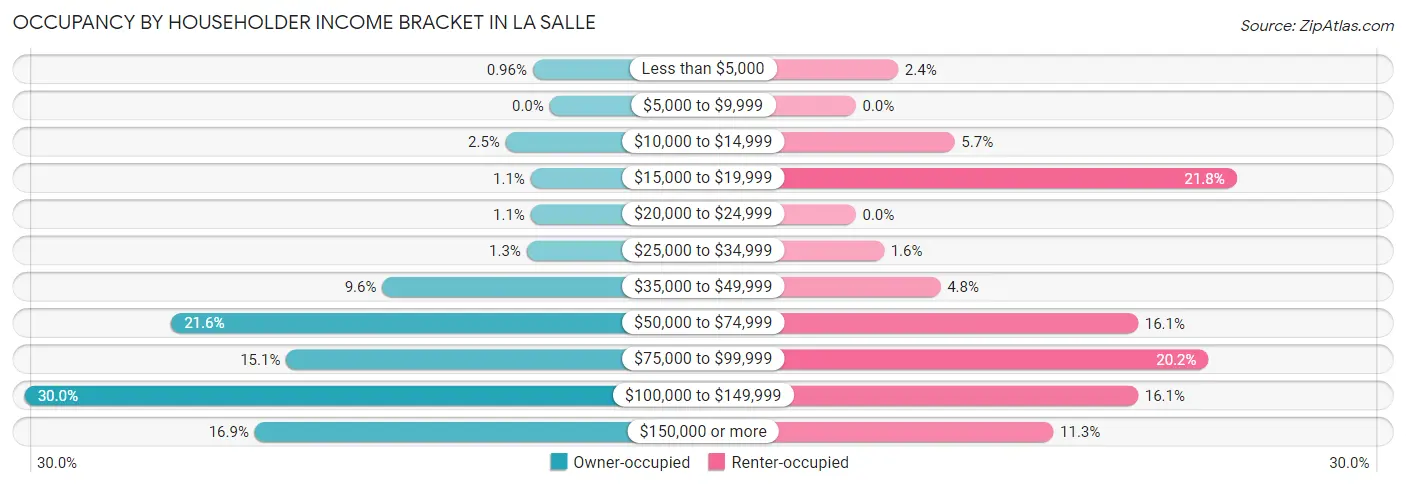
| Income Bracket | Owner-occupied | Renter-occupied |
| Less than $5,000 | 8 (1.0%) | 3 (2.4%) |
| $5,000 to $9,999 | 0 (0.0%) | 0 (0.0%) |
| $10,000 to $14,999 | 21 (2.5%) | 7 (5.7%) |
| $15,000 to $19,999 | 9 (1.1%) | 27 (21.8%) |
| $20,000 to $24,999 | 9 (1.1%) | 0 (0.0%) |
| $25,000 to $34,999 | 11 (1.3%) | 2 (1.6%) |
| $35,000 to $49,999 | 80 (9.6%) | 6 (4.8%) |
| $50,000 to $74,999 | 181 (21.6%) | 20 (16.1%) |
| $75,000 to $99,999 | 126 (15.0%) | 25 (20.2%) |
| $100,000 to $149,999 | 251 (30.0%) | 20 (16.1%) |
| $150,000 or more | 141 (16.9%) | 14 (11.3%) |
| Total | 837 (100.0%) | 124 (100.0%) |
Monthly Housing Cost Tiers in La Salle
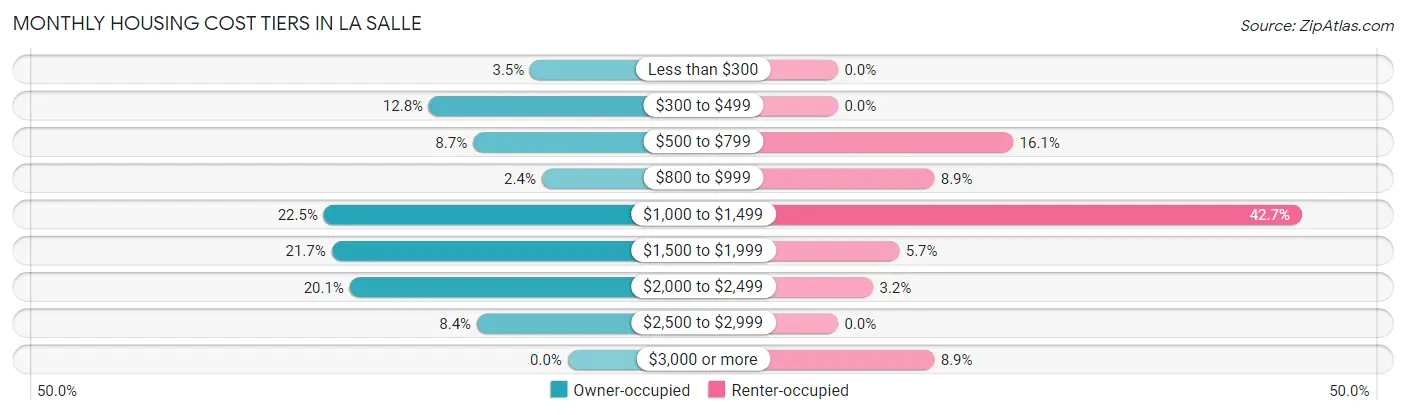
| Monthly Cost | Owner-occupied | Renter-occupied |
| Less than $300 | 29 (3.5%) | 0 (0.0%) |
| $300 to $499 | 107 (12.8%) | 0 (0.0%) |
| $500 to $799 | 73 (8.7%) | 20 (16.1%) |
| $800 to $999 | 20 (2.4%) | 11 (8.9%) |
| $1,000 to $1,499 | 188 (22.5%) | 53 (42.7%) |
| $1,500 to $1,999 | 182 (21.7%) | 7 (5.7%) |
| $2,000 to $2,499 | 168 (20.1%) | 4 (3.2%) |
| $2,500 to $2,999 | 70 (8.4%) | 0 (0.0%) |
| $3,000 or more | 0 (0.0%) | 11 (8.9%) |
| Total | 837 (100.0%) | 124 (100.0%) |
Physical Housing Characteristics in La Salle
Housing Structures in La Salle
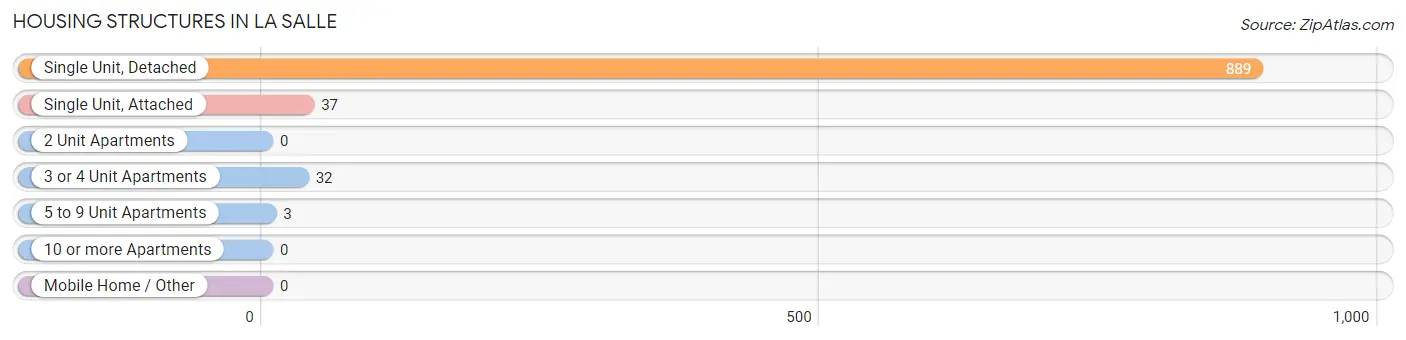
| Structure Type | # Housing Units | % Housing Units |
| Single Unit, Detached | 889 | 92.5% |
| Single Unit, Attached | 37 | 3.8% |
| 2 Unit Apartments | 0 | 0.0% |
| 3 or 4 Unit Apartments | 32 | 3.3% |
| 5 to 9 Unit Apartments | 3 | 0.3% |
| 10 or more Apartments | 0 | 0.0% |
| Mobile Home / Other | 0 | 0.0% |
| Total | 961 | 100.0% |
Housing Structures by Occupancy in La Salle
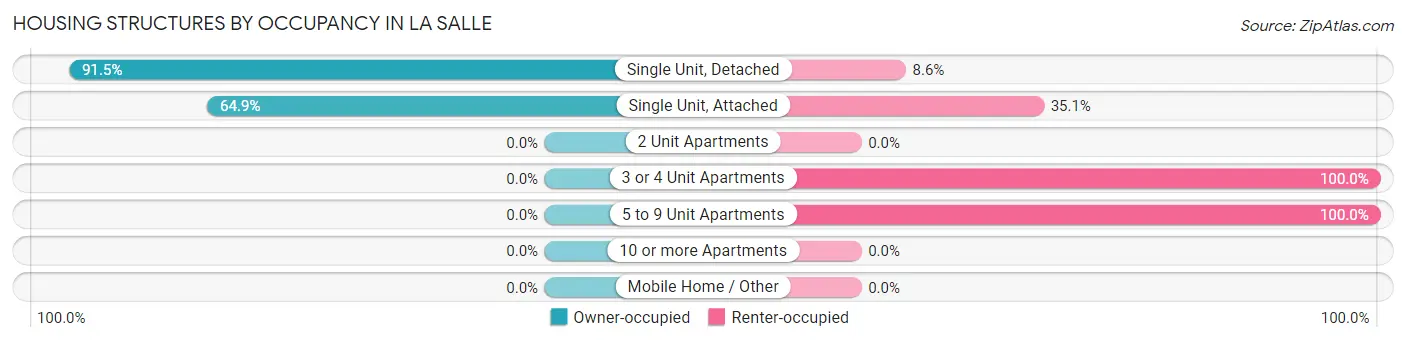
| Structure Type | Owner-occupied | Renter-occupied |
| Single Unit, Detached | 813 (91.4%) | 76 (8.6%) |
| Single Unit, Attached | 24 (64.9%) | 13 (35.1%) |
| 2 Unit Apartments | 0 (0.0%) | 0 (0.0%) |
| 3 or 4 Unit Apartments | 0 (0.0%) | 32 (100.0%) |
| 5 to 9 Unit Apartments | 0 (0.0%) | 3 (100.0%) |
| 10 or more Apartments | 0 (0.0%) | 0 (0.0%) |
| Mobile Home / Other | 0 (0.0%) | 0 (0.0%) |
| Total | 837 (87.1%) | 124 (12.9%) |
Housing Structures by Number of Rooms in La Salle
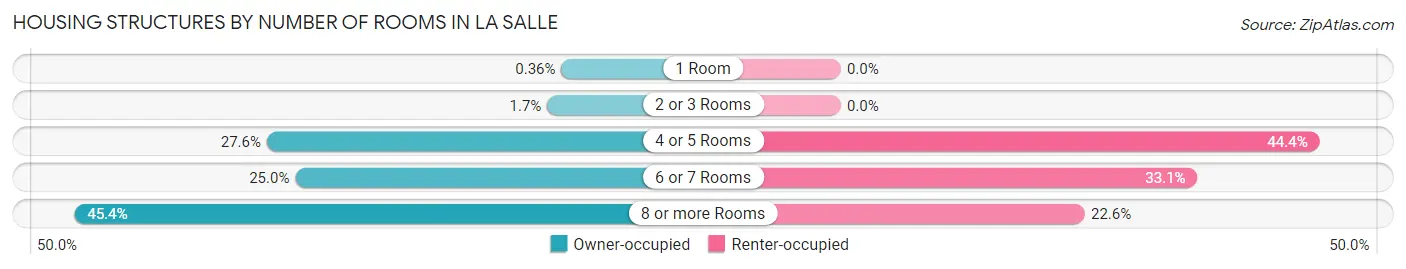
| Number of Rooms | Owner-occupied | Renter-occupied |
| 1 Room | 3 (0.4%) | 0 (0.0%) |
| 2 or 3 Rooms | 14 (1.7%) | 0 (0.0%) |
| 4 or 5 Rooms | 231 (27.6%) | 55 (44.4%) |
| 6 or 7 Rooms | 209 (25.0%) | 41 (33.1%) |
| 8 or more Rooms | 380 (45.4%) | 28 (22.6%) |
| Total | 837 (100.0%) | 124 (100.0%) |
Housing Structure by Heating Type in La Salle
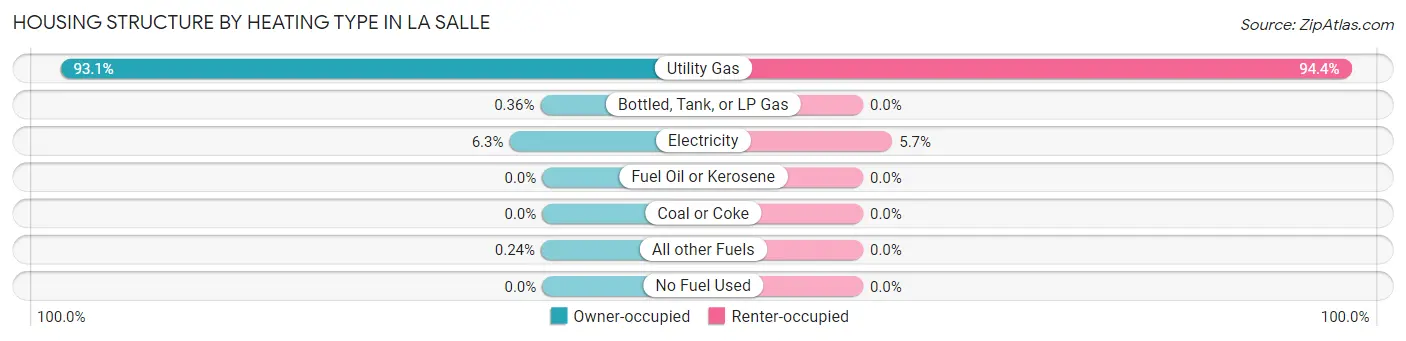
| Heating Type | Owner-occupied | Renter-occupied |
| Utility Gas | 779 (93.1%) | 117 (94.4%) |
| Bottled, Tank, or LP Gas | 3 (0.4%) | 0 (0.0%) |
| Electricity | 53 (6.3%) | 7 (5.7%) |
| Fuel Oil or Kerosene | 0 (0.0%) | 0 (0.0%) |
| Coal or Coke | 0 (0.0%) | 0 (0.0%) |
| All other Fuels | 2 (0.2%) | 0 (0.0%) |
| No Fuel Used | 0 (0.0%) | 0 (0.0%) |
| Total | 837 (100.0%) | 124 (100.0%) |
Household Vehicle Usage in La Salle
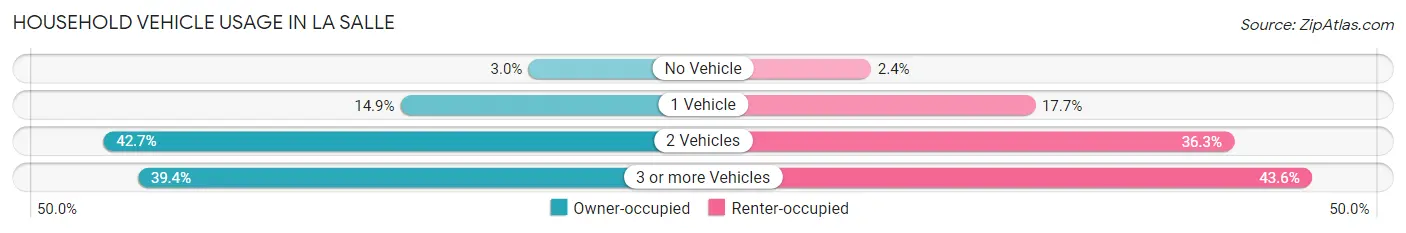
| Vehicles per Household | Owner-occupied | Renter-occupied |
| No Vehicle | 25 (3.0%) | 3 (2.4%) |
| 1 Vehicle | 125 (14.9%) | 22 (17.7%) |
| 2 Vehicles | 357 (42.6%) | 45 (36.3%) |
| 3 or more Vehicles | 330 (39.4%) | 54 (43.5%) |
| Total | 837 (100.0%) | 124 (100.0%) |
Real Estate & Mortgages in La Salle
Real Estate and Mortgage Overview in La Salle
| Characteristic | Without Mortgage | With Mortgage |
| Housing Units | 205 | 632 |
| Median Property Value | $315,700 | $343,400 |
| Median Household Income | $85,750 | $109 |
| Monthly Housing Costs | $439 | $0 |
| Real Estate Taxes | $1,277 | $15 |
Property Value by Mortgage Status in La Salle
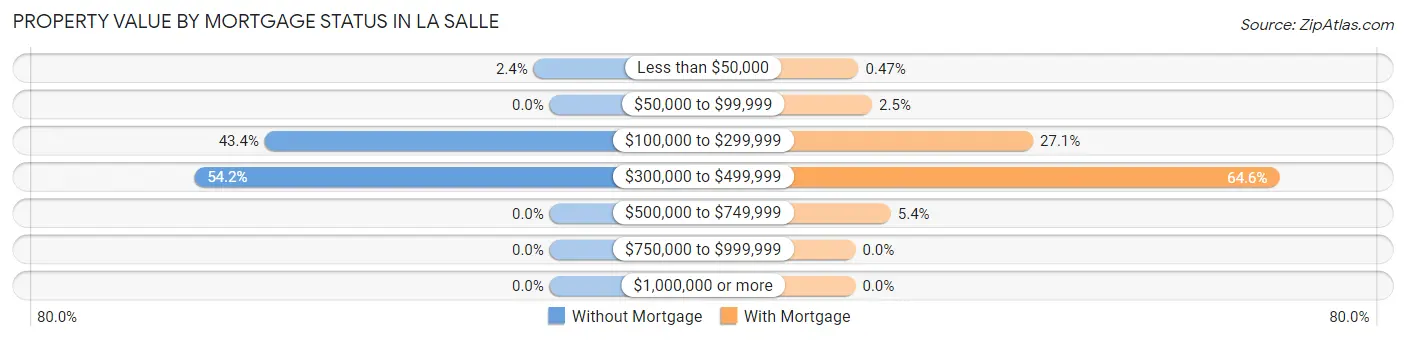
| Property Value | Without Mortgage | With Mortgage |
| Less than $50,000 | 5 (2.4%) | 3 (0.5%) |
| $50,000 to $99,999 | 0 (0.0%) | 16 (2.5%) |
| $100,000 to $299,999 | 89 (43.4%) | 171 (27.1%) |
| $300,000 to $499,999 | 111 (54.1%) | 408 (64.6%) |
| $500,000 to $749,999 | 0 (0.0%) | 34 (5.4%) |
| $750,000 to $999,999 | 0 (0.0%) | 0 (0.0%) |
| $1,000,000 or more | 0 (0.0%) | 0 (0.0%) |
| Total | 205 (100.0%) | 632 (100.0%) |
Household Income by Mortgage Status in La Salle
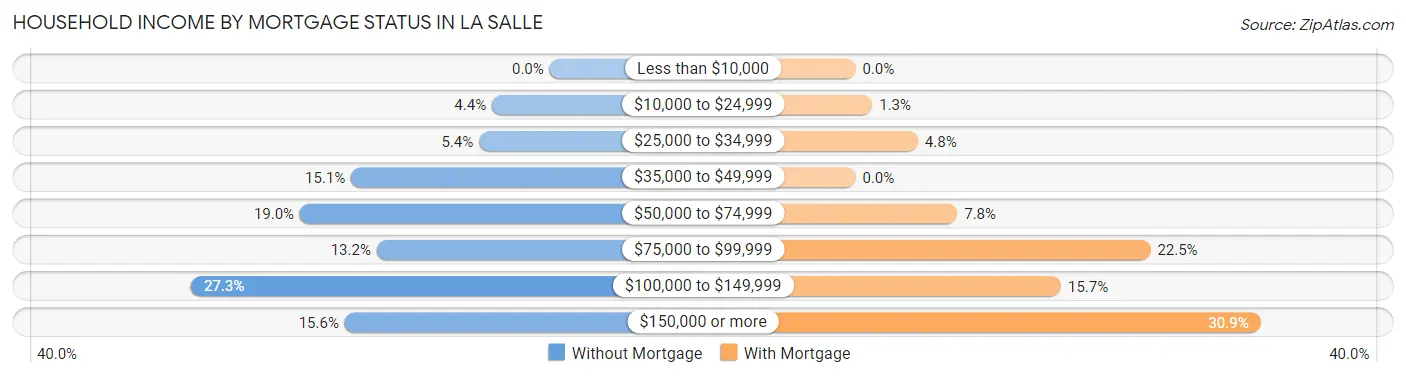
| Household Income | Without Mortgage | With Mortgage |
| Less than $10,000 | 0 (0.0%) | 0 (0.0%) |
| $10,000 to $24,999 | 9 (4.4%) | 8 (1.3%) |
| $25,000 to $34,999 | 11 (5.4%) | 30 (4.8%) |
| $35,000 to $49,999 | 31 (15.1%) | 0 (0.0%) |
| $50,000 to $74,999 | 39 (19.0%) | 49 (7.7%) |
| $75,000 to $99,999 | 27 (13.2%) | 142 (22.5%) |
| $100,000 to $149,999 | 56 (27.3%) | 99 (15.7%) |
| $150,000 or more | 32 (15.6%) | 195 (30.8%) |
| Total | 205 (100.0%) | 632 (100.0%) |
Property Value to Household Income Ratio in La Salle
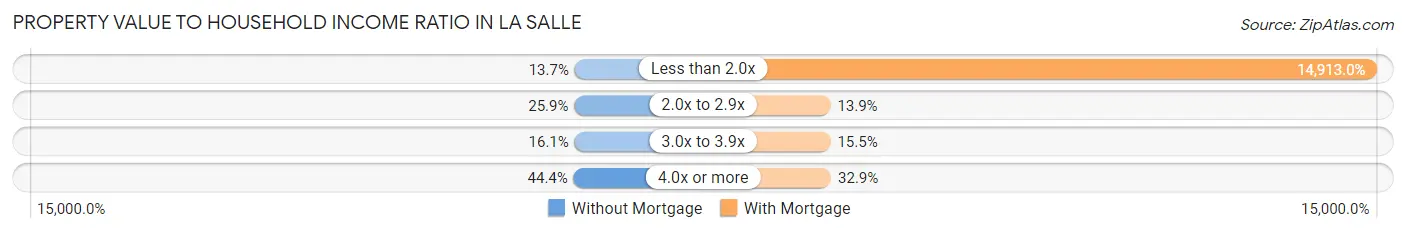
| Value-to-Income Ratio | Without Mortgage | With Mortgage |
| Less than 2.0x | 28 (13.7%) | 94,250 (14,913.0%) |
| 2.0x to 2.9x | 53 (25.9%) | 88 (13.9%) |
| 3.0x to 3.9x | 33 (16.1%) | 98 (15.5%) |
| 4.0x or more | 91 (44.4%) | 208 (32.9%) |
| Total | 205 (100.0%) | 632 (100.0%) |
Real Estate Taxes by Mortgage Status in La Salle
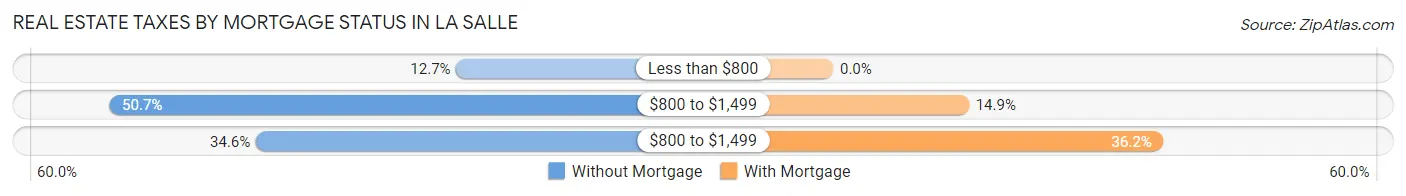
| Property Taxes | Without Mortgage | With Mortgage |
| Less than $800 | 26 (12.7%) | 0 (0.0%) |
| $800 to $1,499 | 104 (50.7%) | 94 (14.9%) |
| $800 to $1,499 | 71 (34.6%) | 229 (36.2%) |
| Total | 205 (100.0%) | 632 (100.0%) |
Health & Disability in La Salle
Health Insurance Coverage by Age in La Salle
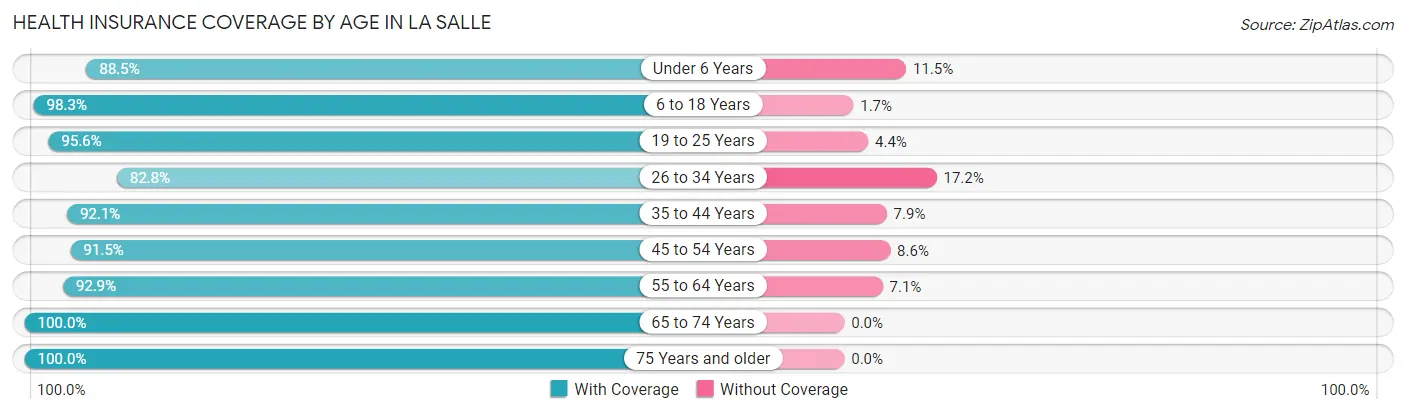
| Age Bracket | With Coverage | Without Coverage |
| Under 6 Years | 246 (88.5%) | 32 (11.5%) |
| 6 to 18 Years | 642 (98.3%) | 11 (1.7%) |
| 19 to 25 Years | 172 (95.6%) | 8 (4.4%) |
| 26 to 34 Years | 284 (82.8%) | 59 (17.2%) |
| 35 to 44 Years | 408 (92.1%) | 35 (7.9%) |
| 45 to 54 Years | 310 (91.4%) | 29 (8.6%) |
| 55 to 64 Years | 273 (92.9%) | 21 (7.1%) |
| 65 to 74 Years | 210 (100.0%) | 0 (0.0%) |
| 75 Years and older | 134 (100.0%) | 0 (0.0%) |
| Total | 2,679 (93.2%) | 195 (6.8%) |
Health Insurance Coverage by Citizenship Status in La Salle
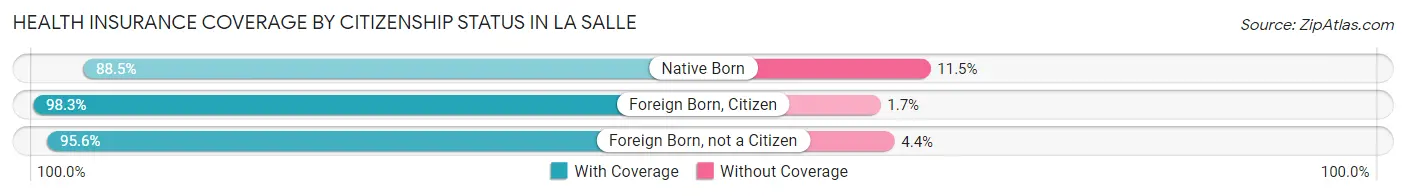
| Citizenship Status | With Coverage | Without Coverage |
| Native Born | 246 (88.5%) | 32 (11.5%) |
| Foreign Born, Citizen | 642 (98.3%) | 11 (1.7%) |
| Foreign Born, not a Citizen | 172 (95.6%) | 8 (4.4%) |
Health Insurance Coverage by Household Income in La Salle
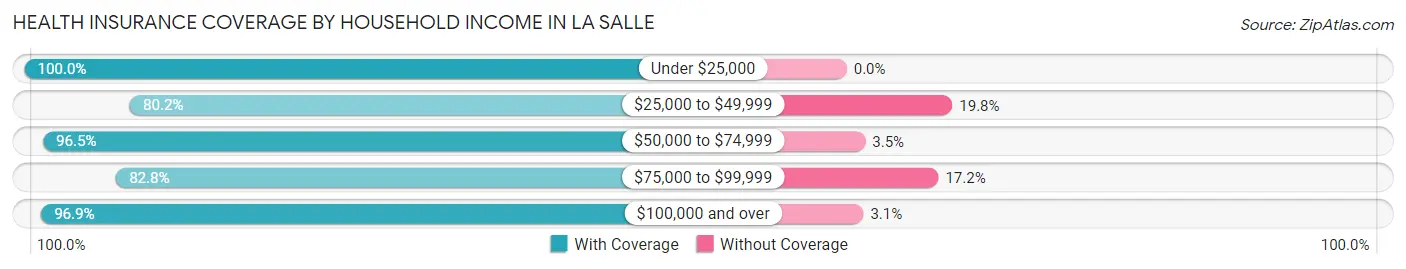
| Household Income | With Coverage | Without Coverage |
| Under $25,000 | 171 (100.0%) | 0 (0.0%) |
| $25,000 to $49,999 | 219 (80.2%) | 54 (19.8%) |
| $50,000 to $74,999 | 361 (96.5%) | 13 (3.5%) |
| $75,000 to $99,999 | 376 (82.8%) | 78 (17.2%) |
| $100,000 and over | 1,552 (96.9%) | 50 (3.1%) |
Public vs Private Health Insurance Coverage by Age in La Salle
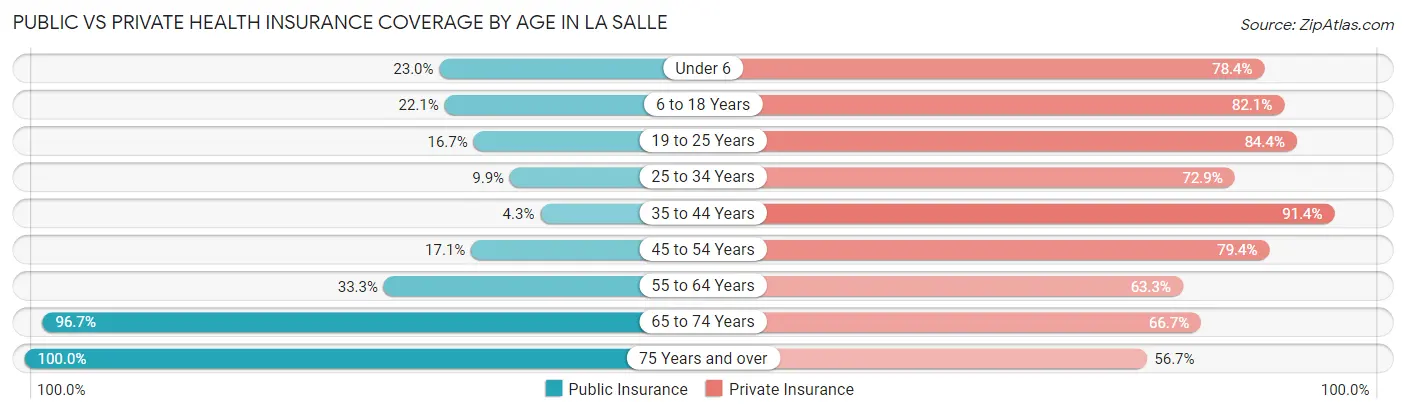
| Age Bracket | Public Insurance | Private Insurance |
| Under 6 | 64 (23.0%) | 218 (78.4%) |
| 6 to 18 Years | 144 (22.1%) | 536 (82.1%) |
| 19 to 25 Years | 30 (16.7%) | 152 (84.4%) |
| 25 to 34 Years | 34 (9.9%) | 250 (72.9%) |
| 35 to 44 Years | 19 (4.3%) | 405 (91.4%) |
| 45 to 54 Years | 58 (17.1%) | 269 (79.3%) |
| 55 to 64 Years | 98 (33.3%) | 186 (63.3%) |
| 65 to 74 Years | 203 (96.7%) | 140 (66.7%) |
| 75 Years and over | 134 (100.0%) | 76 (56.7%) |
| Total | 784 (27.3%) | 2,232 (77.7%) |
Disability Status by Sex by Age in La Salle
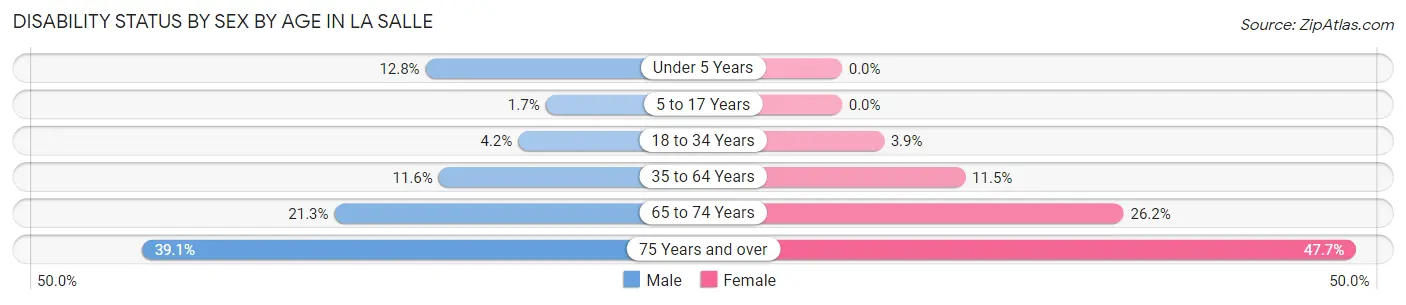
| Age Bracket | Male | Female |
| Under 5 Years | 16 (12.8%) | 0 (0.0%) |
| 5 to 17 Years | 4 (1.7%) | 0 (0.0%) |
| 18 to 34 Years | 11 (4.2%) | 15 (3.9%) |
| 35 to 64 Years | 71 (11.6%) | 53 (11.5%) |
| 65 to 74 Years | 17 (21.2%) | 34 (26.2%) |
| 75 Years and over | 18 (39.1%) | 42 (47.7%) |
Disability Class by Sex by Age in La Salle
Disability Class: Hearing Difficulty
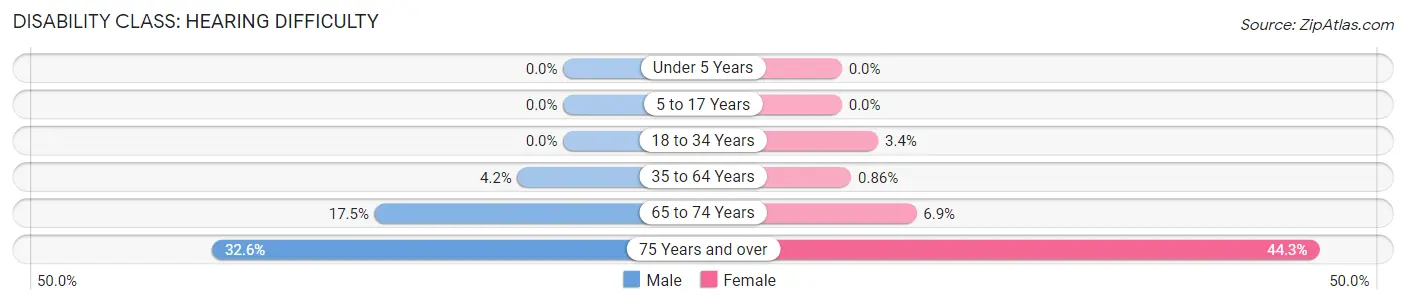
| Age Bracket | Male | Female |
| Under 5 Years | 0 (0.0%) | 0 (0.0%) |
| 5 to 17 Years | 0 (0.0%) | 0 (0.0%) |
| 18 to 34 Years | 0 (0.0%) | 13 (3.4%) |
| 35 to 64 Years | 26 (4.2%) | 4 (0.9%) |
| 65 to 74 Years | 14 (17.5%) | 9 (6.9%) |
| 75 Years and over | 15 (32.6%) | 39 (44.3%) |
Disability Class: Vision Difficulty
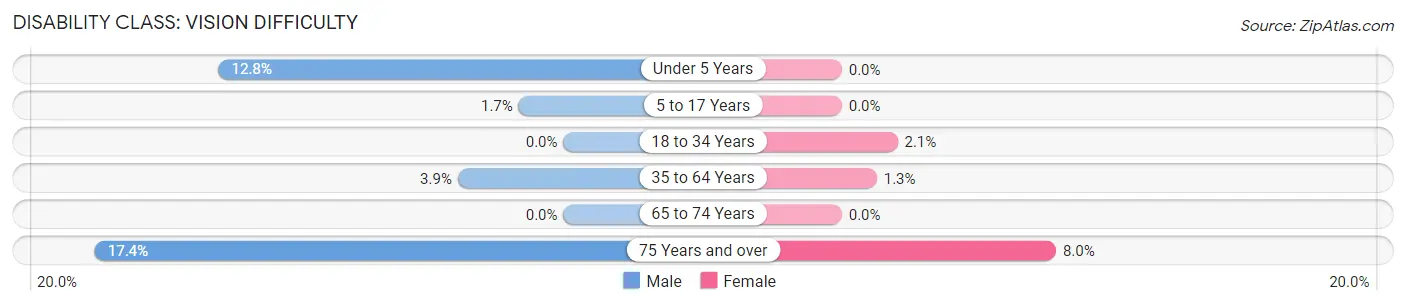
| Age Bracket | Male | Female |
| Under 5 Years | 16 (12.8%) | 0 (0.0%) |
| 5 to 17 Years | 4 (1.7%) | 0 (0.0%) |
| 18 to 34 Years | 0 (0.0%) | 8 (2.1%) |
| 35 to 64 Years | 24 (3.9%) | 6 (1.3%) |
| 65 to 74 Years | 0 (0.0%) | 0 (0.0%) |
| 75 Years and over | 8 (17.4%) | 7 (8.0%) |
Disability Class: Cognitive Difficulty
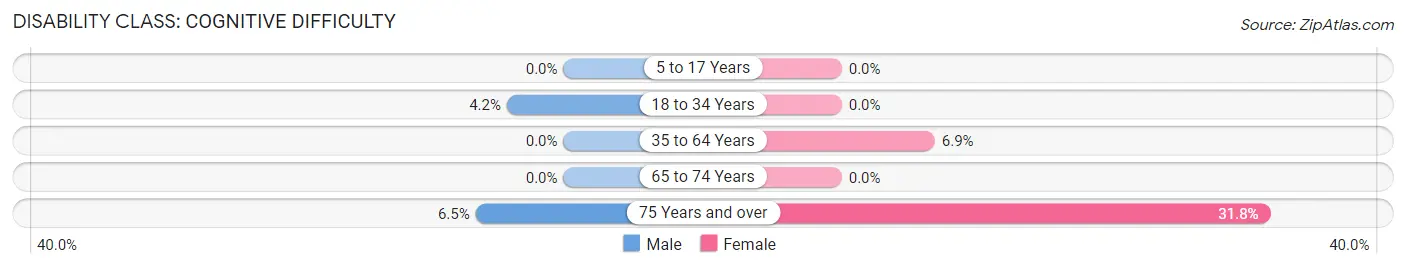
| Age Bracket | Male | Female |
| 5 to 17 Years | 0 (0.0%) | 0 (0.0%) |
| 18 to 34 Years | 11 (4.2%) | 0 (0.0%) |
| 35 to 64 Years | 0 (0.0%) | 32 (6.9%) |
| 65 to 74 Years | 0 (0.0%) | 0 (0.0%) |
| 75 Years and over | 3 (6.5%) | 28 (31.8%) |
Disability Class: Ambulatory Difficulty
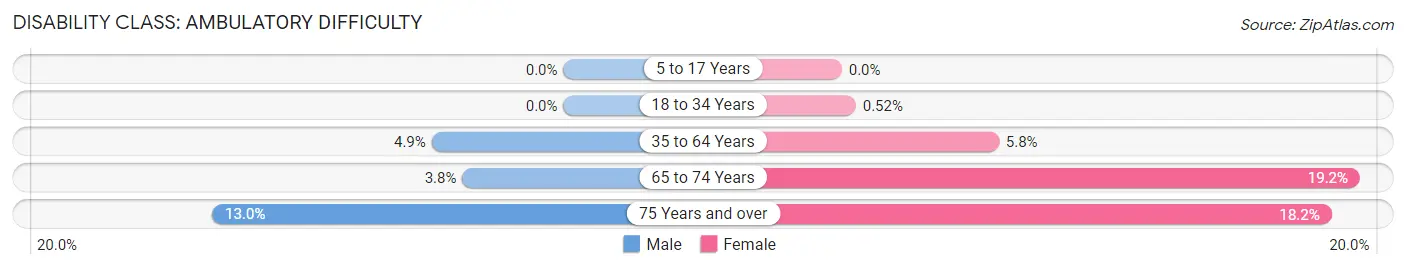
| Age Bracket | Male | Female |
| 5 to 17 Years | 0 (0.0%) | 0 (0.0%) |
| 18 to 34 Years | 0 (0.0%) | 2 (0.5%) |
| 35 to 64 Years | 30 (4.9%) | 27 (5.8%) |
| 65 to 74 Years | 3 (3.7%) | 25 (19.2%) |
| 75 Years and over | 6 (13.0%) | 16 (18.2%) |
Disability Class: Self-Care Difficulty
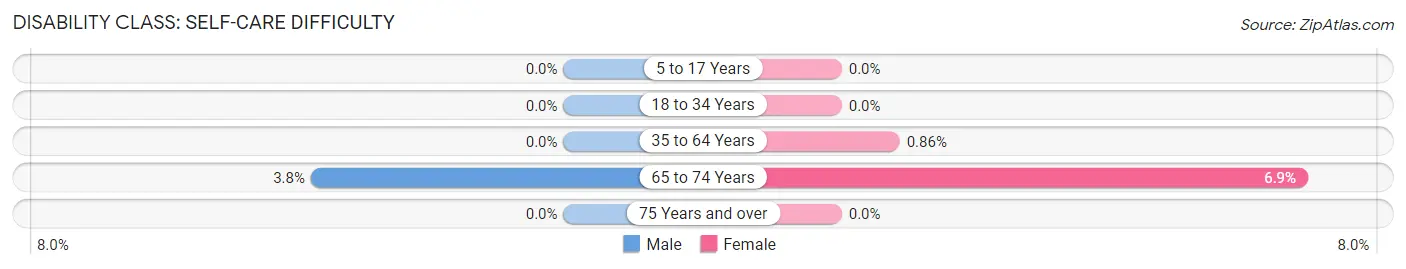
| Age Bracket | Male | Female |
| 5 to 17 Years | 0 (0.0%) | 0 (0.0%) |
| 18 to 34 Years | 0 (0.0%) | 0 (0.0%) |
| 35 to 64 Years | 0 (0.0%) | 4 (0.9%) |
| 65 to 74 Years | 3 (3.7%) | 9 (6.9%) |
| 75 Years and over | 0 (0.0%) | 0 (0.0%) |
Technology Access in La Salle
Computing Device Access in La Salle
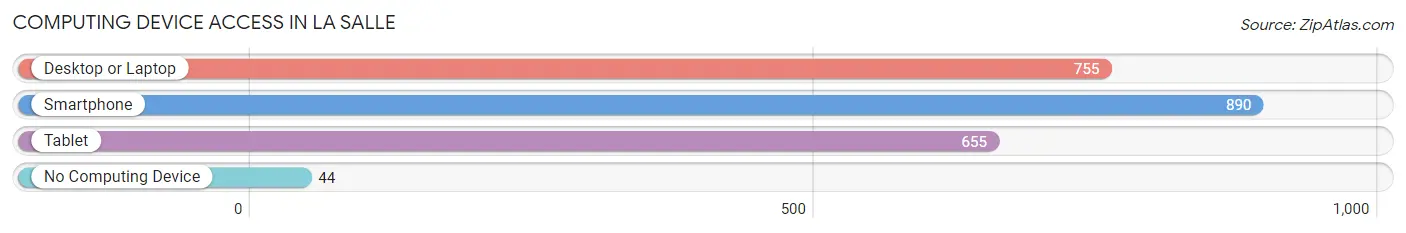
| Device Type | # Households | % Households |
| Desktop or Laptop | 755 | 78.6% |
| Smartphone | 890 | 92.6% |
| Tablet | 655 | 68.2% |
| No Computing Device | 44 | 4.6% |
| Total | 961 | 100.0% |
Internet Access in La Salle
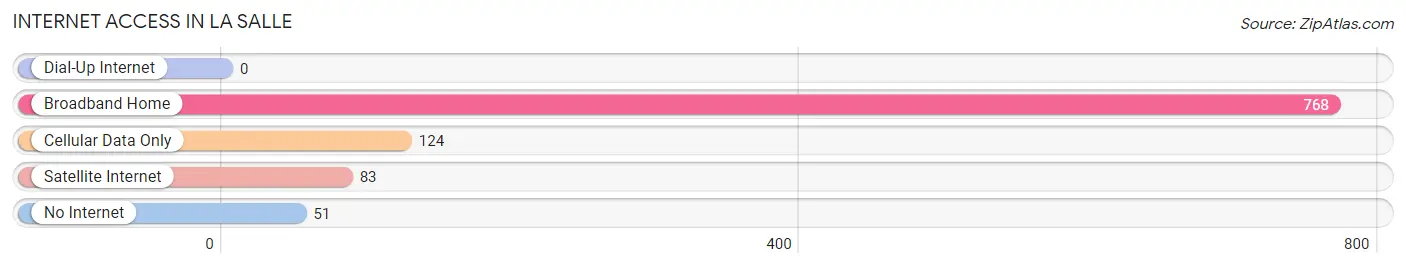
| Internet Type | # Households | % Households |
| Dial-Up Internet | 0 | 0.0% |
| Broadband Home | 768 | 79.9% |
| Cellular Data Only | 124 | 12.9% |
| Satellite Internet | 83 | 8.6% |
| No Internet | 51 | 5.3% |
| Total | 961 | 100.0% |
La Salle Summary
La Salle is a small town located in Weld County, Colorado, United States. It is situated along the South Platte River, approximately 25 miles east of Greeley and 40 miles north of Denver. The town was founded in 1872 and was named after the French explorer, Robert de La Salle. As of the 2010 census, the population of La Salle was 1,890.
History
La Salle was founded in 1872 by a group of settlers from the Midwest. The town was named after the French explorer, Robert de La Salle, who explored the area in the late 1600s. The town was originally a farming community, but it soon became a hub for the coal mining industry. The first coal mine in the area was opened in 1876 and by the early 1900s, the town had become a major coal mining center.
The town experienced a period of growth in the early 1900s, with the population reaching 1,000 by 1910. The town was incorporated in 1912 and the first mayor was elected in 1913. The town continued to grow and by the 1950s, the population had reached 2,000.
Geography
La Salle is located in Weld County, Colorado, United States. It is situated along the South Platte River, approximately 25 miles east of Greeley and 40 miles north of Denver. The town has a total area of 1.2 square miles, all of which is land.
The town is located in the foothills of the Rocky Mountains and is surrounded by rolling hills and farmland. The town is located at an elevation of 5,000 feet above sea level.
Economy
The economy of La Salle is largely based on agriculture and coal mining. The town is home to several large farms, which produce a variety of crops, including corn, wheat, and hay. The town is also home to several coal mines, which produce coal for use in power plants and other industries.
The town is also home to several small businesses, including restaurants, retail stores, and service providers. The town is also home to a small airport, which serves the local area.
Demographics
As of the 2010 census, the population of La Salle was 1,890. The racial makeup of the town was 94.3% White, 0.3% African American, 0.7% Native American, 0.3% Asian, 0.1% Pacific Islander, 2.2% from other races, and 2.3% from two or more races. Hispanic or Latino of any race were 8.2% of the population.
The median income for a household in the town was $45,000 and the median income for a family was $50,000. The per capita income for the town was $20,000. About 8.2% of families and 10.2% of the population were below the poverty line, including 14.2% of those under age 18 and 6.2% of those age 65 or over.
Common Questions
What is Per Capita Income in La Salle?
Per Capita income in La Salle is $39,024.
What is the Median Family Income in La Salle?
Median Family Income in La Salle is $103,523.
What is the Median Household income in La Salle?
Median Household Income in La Salle is $91,080.
What is Income or Wage Gap in La Salle?
Income or Wage Gap in La Salle is 43.2%.
Women in La Salle earn 56.8 cents for every dollar earned by a man.
What is Inequality or Gini Index in La Salle?
Inequality or Gini Index in La Salle is 0.39.
What is the Total Population of La Salle?
Total Population of La Salle is 2,874.
What is the Total Male Population of La Salle?
Total Male Population of La Salle is 1,367.
What is the Total Female Population of La Salle?
Total Female Population of La Salle is 1,507.
What is the Ratio of Males per 100 Females in La Salle?
There are 90.71 Males per 100 Females in La Salle.
What is the Ratio of Females per 100 Males in La Salle?
There are 110.24 Females per 100 Males in La Salle.
What is the Median Population Age in La Salle?
Median Population Age in La Salle is 34.3 Years.
What is the Average Family Size in La Salle
Average Family Size in La Salle is 3.6 People.
What is the Average Household Size in La Salle
Average Household Size in La Salle is 3.0 People.
How Large is the Labor Force in La Salle?
There are 1,547 People in the Labor Forcein in La Salle.
What is the Percentage of People in the Labor Force in La Salle?
71.3% of People are in the Labor Force in La Salle.
What is the Unemployment Rate in La Salle?
Unemployment Rate in La Salle is 1.6%.