Zip Codes with the Highest Percentage of Population Employed in Food Preparation & Serving in Castle Rock, CO
RELATED REPORTS & OPTIONS
Food Preparation & Serving
Castle Rock
Compare Zip Codes
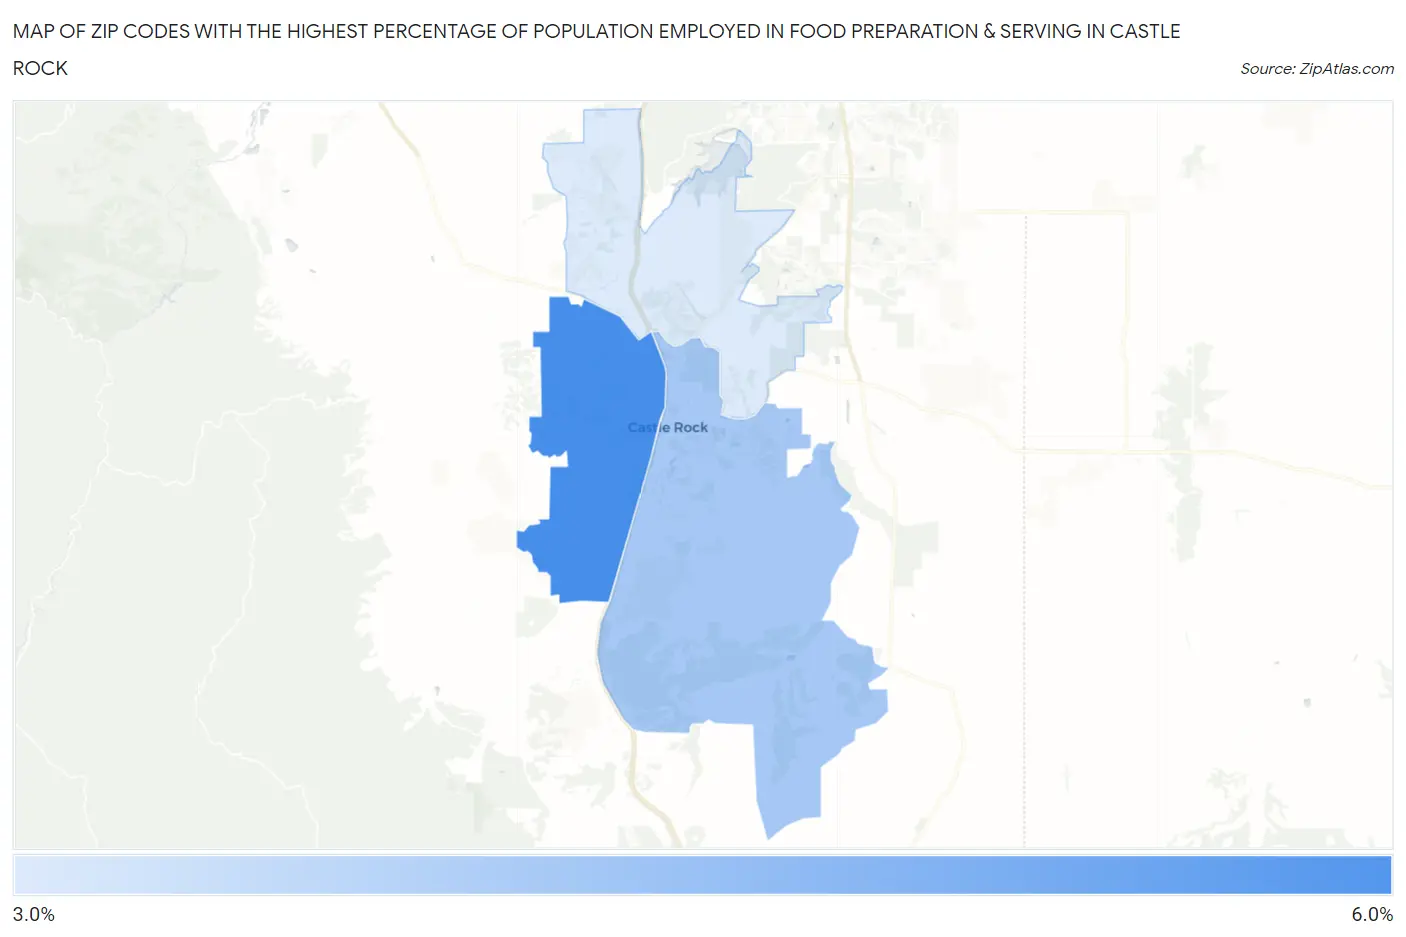
Map of Zip Codes with the Highest Percentage of Population Employed in Food Preparation & Serving in Castle Rock
3.7%
5.5%
Zip Codes with the Highest Percentage of Population Employed in Food Preparation & Serving in Castle Rock, CO
| Zip Code | % Employed | vs State | vs National | |
| 1. | 80109 | 5.5% | 5.2%(+0.366)#160 | 5.3%(+0.262)#10,903 |
| 2. | 80104 | 4.4% | 5.2%(-0.783)#233 | 5.3%(-0.887)#15,423 |
| 3. | 80108 | 3.7% | 5.2%(-1.45)#277 | 5.3%(-1.56)#18,222 |
1
Common Questions
What are the Top Zip Codes with the Highest Percentage of Population Employed in Food Preparation & Serving in Castle Rock, CO?
Top Zip Codes with the Highest Percentage of Population Employed in Food Preparation & Serving in Castle Rock, CO are:
What zip code has the Highest Percentage of Population Employed in Food Preparation & Serving in Castle Rock, CO?
80109 has the Highest Percentage of Population Employed in Food Preparation & Serving in Castle Rock, CO with 5.5%.
What is the Percentage of Population Employed in Food Preparation & Serving in Castle Rock, CO?
Percentage of Population Employed in Food Preparation & Serving in Castle Rock is 4.9%.
What is the Percentage of Population Employed in Food Preparation & Serving in Colorado?
Percentage of Population Employed in Food Preparation & Serving in Colorado is 5.2%.
What is the Percentage of Population Employed in Food Preparation & Serving in the United States?
Percentage of Population Employed in Food Preparation & Serving in the United States is 5.3%.