Paducah, KY Map & Demographics
Paducah Map
Paducah Overview
$37,828
PER CAPITA INCOME
$71,328
AVG FAMILY INCOME
$46,984
AVG HOUSEHOLD INCOME
29.8%
WAGE / INCOME GAP [ % ]
70.2¢/ $1
WAGE / INCOME GAP [ $ ]
$12,337
FAMILY INCOME DEFICIT
0.59
INEQUALITY / GINI INDEX
26,869
TOTAL POPULATION
12,591
MALE POPULATION
14,278
FEMALE POPULATION
88.18
MALES / 100 FEMALES
113.40
FEMALES / 100 MALES
42.7
MEDIAN AGE
3.1
AVG FAMILY SIZE
2.3
AVG HOUSEHOLD SIZE
12,739
LABOR FORCE [ PEOPLE ]
58.2%
PERCENT IN LABOR FORCE
3.8%
UNEMPLOYMENT RATE
Paducah Area Codes
Income in Paducah
Income Overview in Paducah
Per Capita Income in Paducah is $37,828, while median incomes of families and households are $71,328 and $46,984 respectively.
| Characteristic | Number | Measure |
| Per Capita Income | 26,869 | $37,828 |
| Median Family Income | 5,978 | $71,328 |
| Mean Family Income | 5,978 | $115,530 |
| Median Household Income | 11,432 | $46,984 |
| Mean Household Income | 11,432 | $84,686 |
| Income Deficit | 5,978 | $12,337 |
| Wage / Income Gap (%) | 26,869 | 29.81% |
| Wage / Income Gap ($) | 26,869 | 70.19¢ per $1 |
| Gini / Inequality Index | 26,869 | 0.59 |
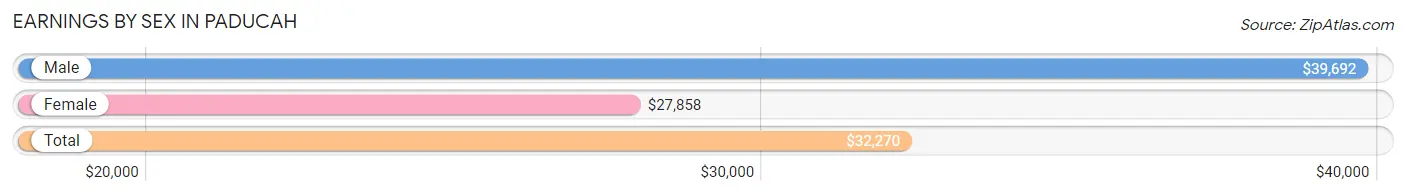
Earnings by Sex in Paducah
Average Earnings in Paducah are $32,270, $39,692 for men and $27,858 for women, a difference of 29.8%.
| Sex | Number | Average Earnings |
| Male | 6,703 (49.1%) | $39,692 |
| Female | 6,941 (50.9%) | $27,858 |
| Total | 13,644 (100.0%) | $32,270 |
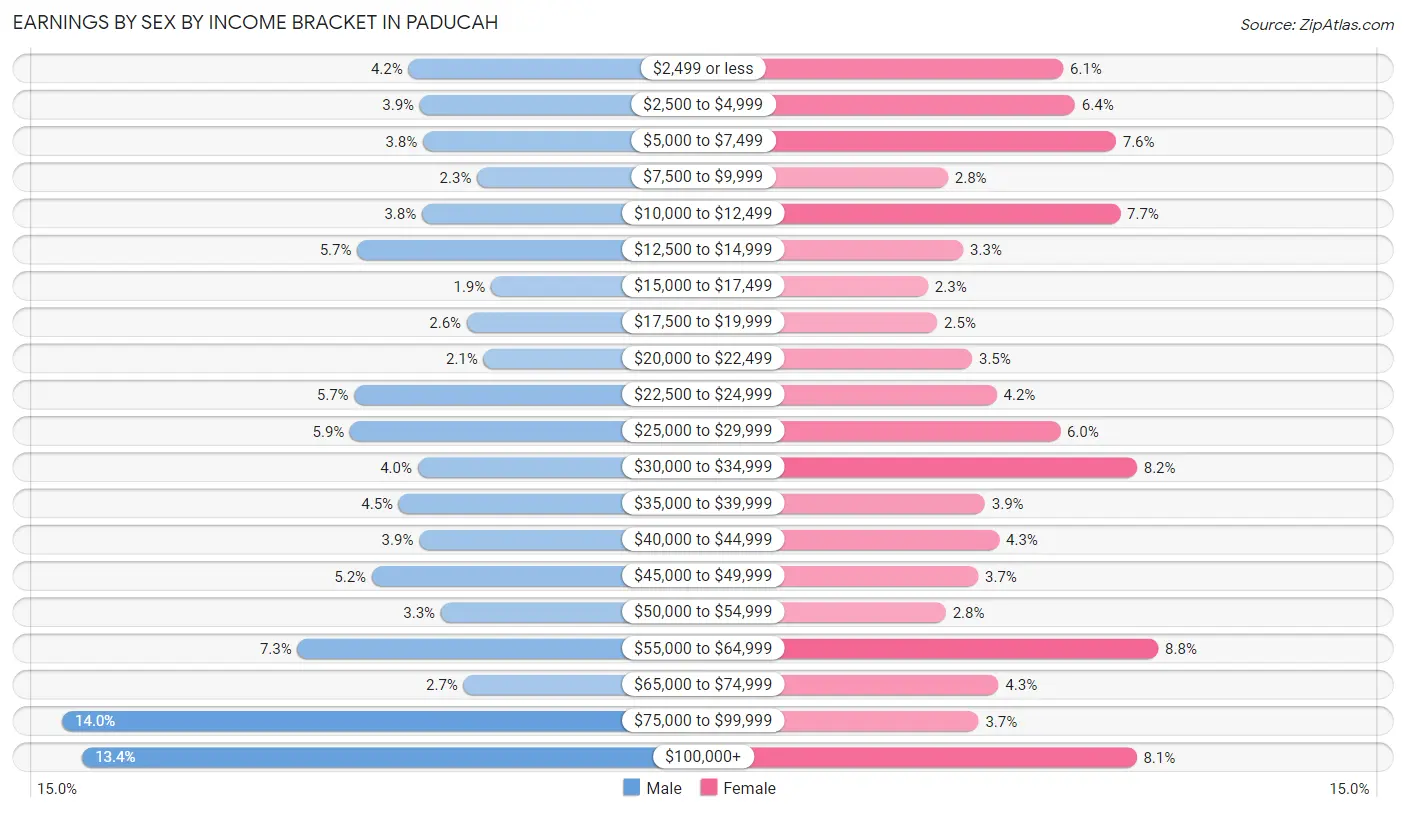
Earnings by Sex by Income Bracket in Paducah
The most common earnings brackets in Paducah are $75,000 to $99,999 for men (935 | 14.0%) and $55,000 to $64,999 for women (607 | 8.7%).
| Income | Male | Female |
| $2,499 or less | 282 (4.2%) | 422 (6.1%) |
| $2,500 to $4,999 | 261 (3.9%) | 445 (6.4%) |
| $5,000 to $7,499 | 255 (3.8%) | 525 (7.6%) |
| $7,500 to $9,999 | 153 (2.3%) | 197 (2.8%) |
| $10,000 to $12,499 | 257 (3.8%) | 533 (7.7%) |
| $12,500 to $14,999 | 379 (5.7%) | 227 (3.3%) |
| $15,000 to $17,499 | 127 (1.9%) | 158 (2.3%) |
| $17,500 to $19,999 | 172 (2.6%) | 176 (2.5%) |
| $20,000 to $22,499 | 141 (2.1%) | 244 (3.5%) |
| $22,500 to $24,999 | 384 (5.7%) | 292 (4.2%) |
| $25,000 to $29,999 | 392 (5.9%) | 416 (6.0%) |
| $30,000 to $34,999 | 265 (4.0%) | 566 (8.2%) |
| $35,000 to $39,999 | 300 (4.5%) | 269 (3.9%) |
| $40,000 to $44,999 | 262 (3.9%) | 297 (4.3%) |
| $45,000 to $49,999 | 351 (5.2%) | 256 (3.7%) |
| $50,000 to $54,999 | 221 (3.3%) | 193 (2.8%) |
| $55,000 to $64,999 | 491 (7.3%) | 607 (8.7%) |
| $65,000 to $74,999 | 178 (2.7%) | 296 (4.3%) |
| $75,000 to $99,999 | 935 (14.0%) | 257 (3.7%) |
| $100,000+ | 897 (13.4%) | 565 (8.1%) |
| Total | 6,703 (100.0%) | 6,941 (100.0%) |
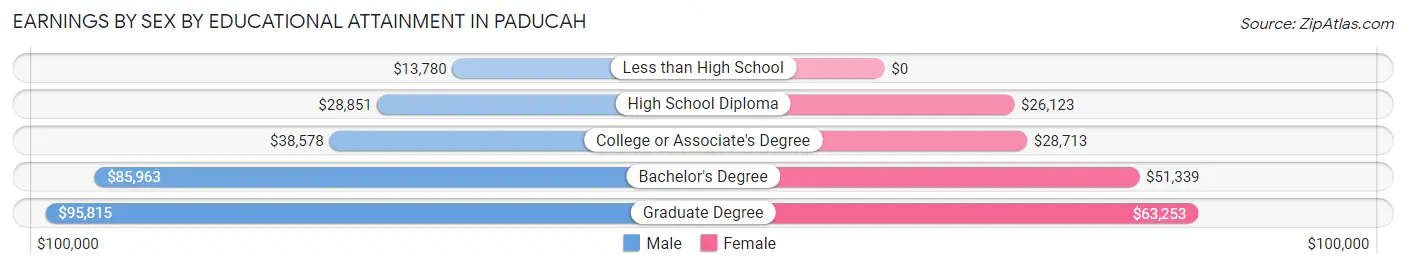
Earnings by Sex by Educational Attainment in Paducah
Average earnings in Paducah are $45,821 for men and $32,437 for women, a difference of 29.2%. Men with an educational attainment of graduate degree enjoy the highest average annual earnings of $95,815, while those with less than high school education earn the least with $13,780. Women with an educational attainment of graduate degree earn the most with the average annual earnings of $63,253, while those with high school diploma education have the smallest earnings of $26,123.
| Educational Attainment | Male Income | Female Income |
| Less than High School | $13,780 | $0 |
| High School Diploma | $28,851 | $26,123 |
| College or Associate's Degree | $38,578 | $28,713 |
| Bachelor's Degree | $85,963 | $51,339 |
| Graduate Degree | $95,815 | $63,253 |
| Total | $45,821 | $32,437 |
Family Income in Paducah
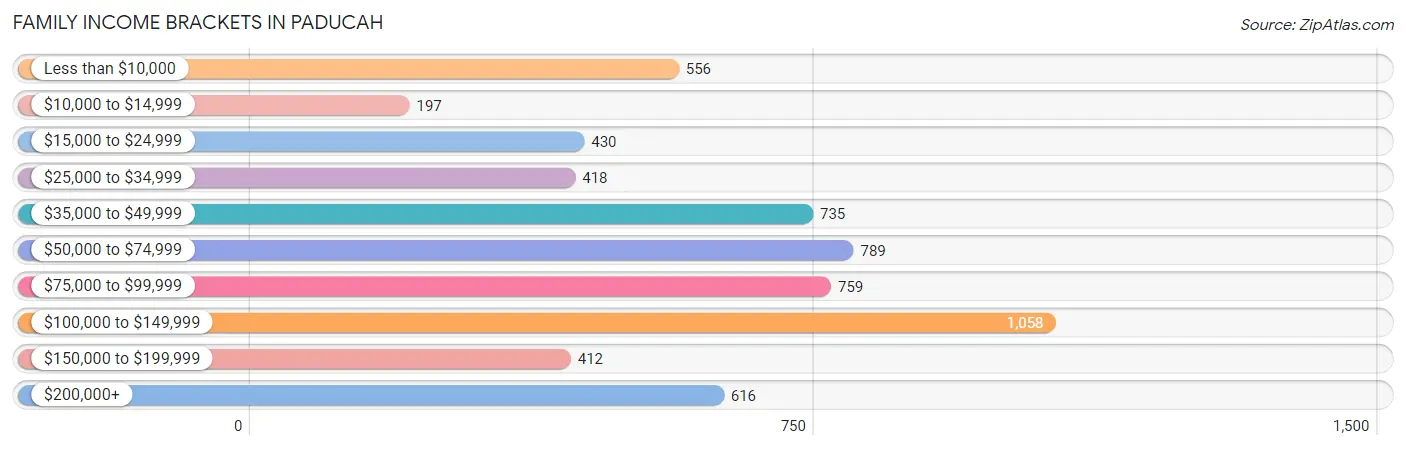
Family Income Brackets in Paducah
According to the Paducah family income data, there are 1,058 families falling into the $100,000 to $149,999 income range, which is the most common income bracket and makes up 17.7% of all families. Conversely, the $10,000 to $14,999 income bracket is the least frequent group with only 197 families (3.3%) belonging to this category.
| Income Bracket | # Families | % Families |
| Less than $10,000 | 556 | 9.3% |
| $10,000 to $14,999 | 197 | 3.3% |
| $15,000 to $24,999 | 430 | 7.2% |
| $25,000 to $34,999 | 418 | 7.0% |
| $35,000 to $49,999 | 735 | 12.3% |
| $50,000 to $74,999 | 789 | 13.2% |
| $75,000 to $99,999 | 759 | 12.7% |
| $100,000 to $149,999 | 1,058 | 17.7% |
| $150,000 to $199,999 | 412 | 6.9% |
| $200,000+ | 616 | 10.3% |
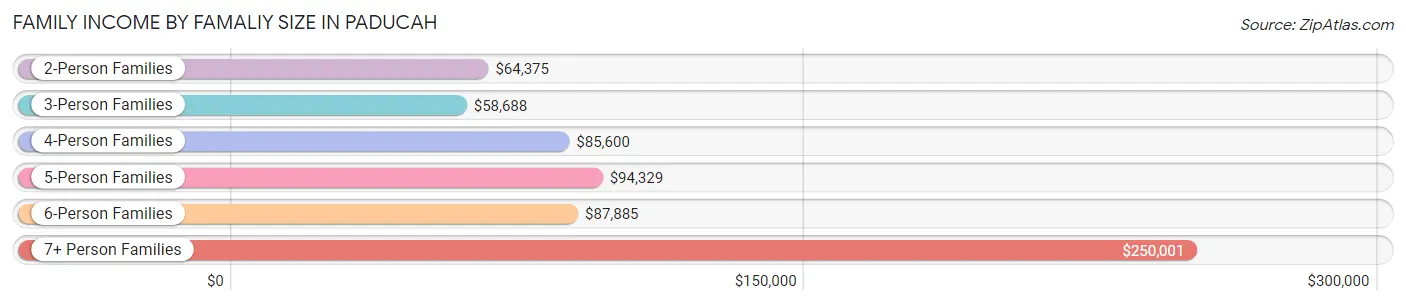
Family Income by Famaliy Size in Paducah
7+ person families (71 | 1.2%) account for the highest median family income in Paducah with $250,001 per family, while 7+ person families (71 | 1.2%) have the highest median income of $35,714 per family member.
| Income Bracket | # Families | Median Income |
| 2-Person Families | 3,176 (53.1%) | $64,375 |
| 3-Person Families | 1,415 (23.7%) | $58,688 |
| 4-Person Families | 964 (16.1%) | $85,600 |
| 5-Person Families | 276 (4.6%) | $94,329 |
| 6-Person Families | 76 (1.3%) | $87,885 |
| 7+ Person Families | 71 (1.2%) | $250,001 |
| Total | 5,978 (100.0%) | $71,328 |
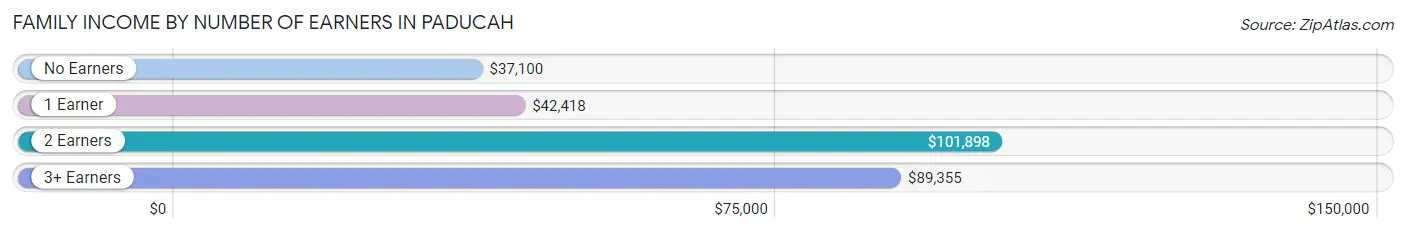
Family Income by Number of Earners in Paducah
The median family income in Paducah is $71,328, with families comprising 2 earners (2,319) having the highest median family income of $101,898, while families with no earners (1,022) have the lowest median family income of $37,100, accounting for 38.8% and 17.1% of families, respectively.
| Number of Earners | # Families | Median Income |
| No Earners | 1,022 (17.1%) | $37,100 |
| 1 Earner | 2,139 (35.8%) | $42,418 |
| 2 Earners | 2,319 (38.8%) | $101,898 |
| 3+ Earners | 498 (8.3%) | $89,355 |
| Total | 5,978 (100.0%) | $71,328 |
Household Income in Paducah
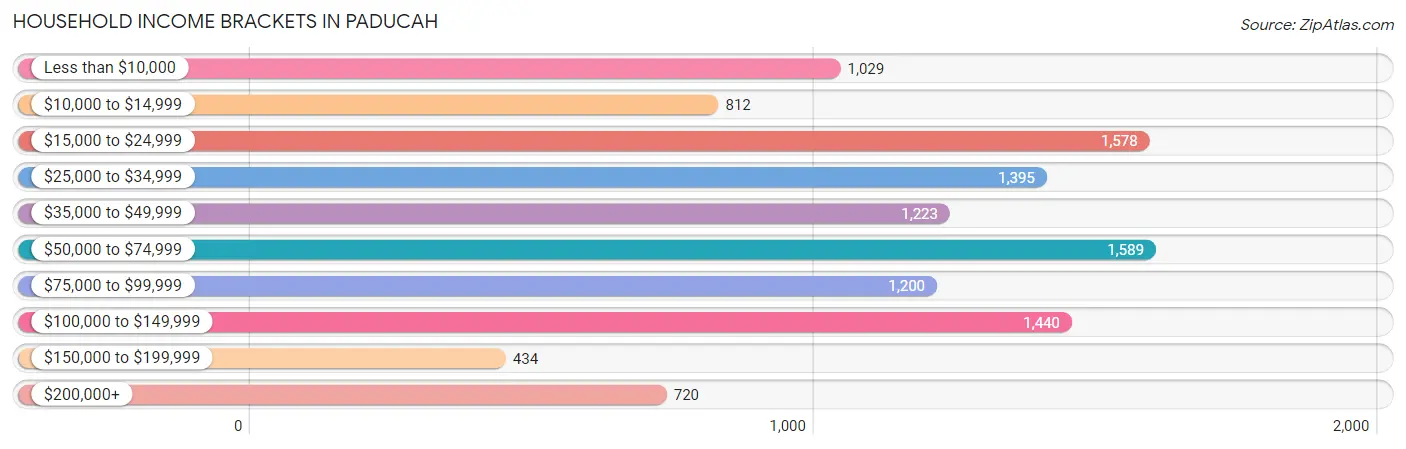
Household Income Brackets in Paducah
With 1,589 households falling in the category, the $50,000 to $74,999 income range is the most frequent in Paducah, accounting for 13.9% of all households. In contrast, only 434 households (3.8%) fall into the $150,000 to $199,999 income bracket, making it the least populous group.
| Income Bracket | # Households | % Households |
| Less than $10,000 | 1,029 | 9.0% |
| $10,000 to $14,999 | 812 | 7.1% |
| $15,000 to $24,999 | 1,578 | 13.8% |
| $25,000 to $34,999 | 1,395 | 12.2% |
| $35,000 to $49,999 | 1,223 | 10.7% |
| $50,000 to $74,999 | 1,589 | 13.9% |
| $75,000 to $99,999 | 1,200 | 10.5% |
| $100,000 to $149,999 | 1,440 | 12.6% |
| $150,000 to $199,999 | 434 | 3.8% |
| $200,000+ | 720 | 6.3% |
Household Income by Householder Age in Paducah
The median household income in Paducah is $46,984, with the highest median household income of $65,989 found in the 45 to 64 years age bracket for the primary householder. A total of 4,413 households (38.6%) fall into this category. Meanwhile, the 15 to 24 years age bracket for the primary householder has the lowest median household income of $21,157, with 379 households (3.3%) in this group.
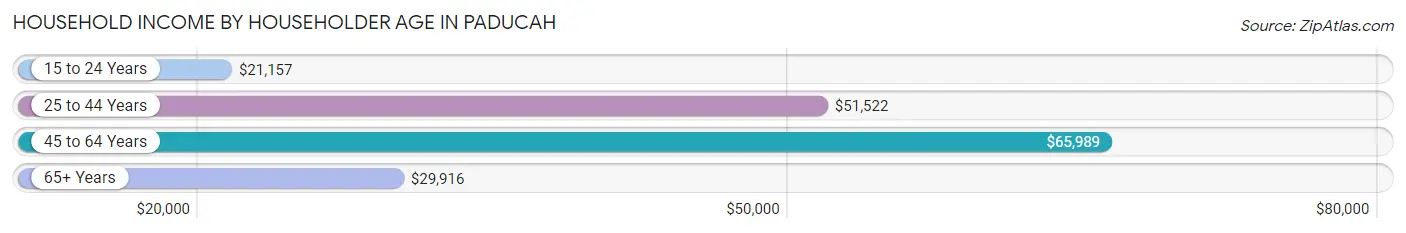
| Income Bracket | # Households | Median Income |
| 15 to 24 Years | 379 (3.3%) | $21,157 |
| 25 to 44 Years | 3,550 (31.0%) | $51,522 |
| 45 to 64 Years | 4,413 (38.6%) | $65,989 |
| 65+ Years | 3,090 (27.0%) | $29,916 |
| Total | 11,432 (100.0%) | $46,984 |
Poverty in Paducah
Income Below Poverty by Sex and Age in Paducah
With 22.0% poverty level for males and 22.7% for females among the residents of Paducah, 5 year old males and 16 and 17 year old females are the most vulnerable to poverty, with 84 males (64.1%) and 151 females (42.4%) in their respective age groups living below the poverty level.
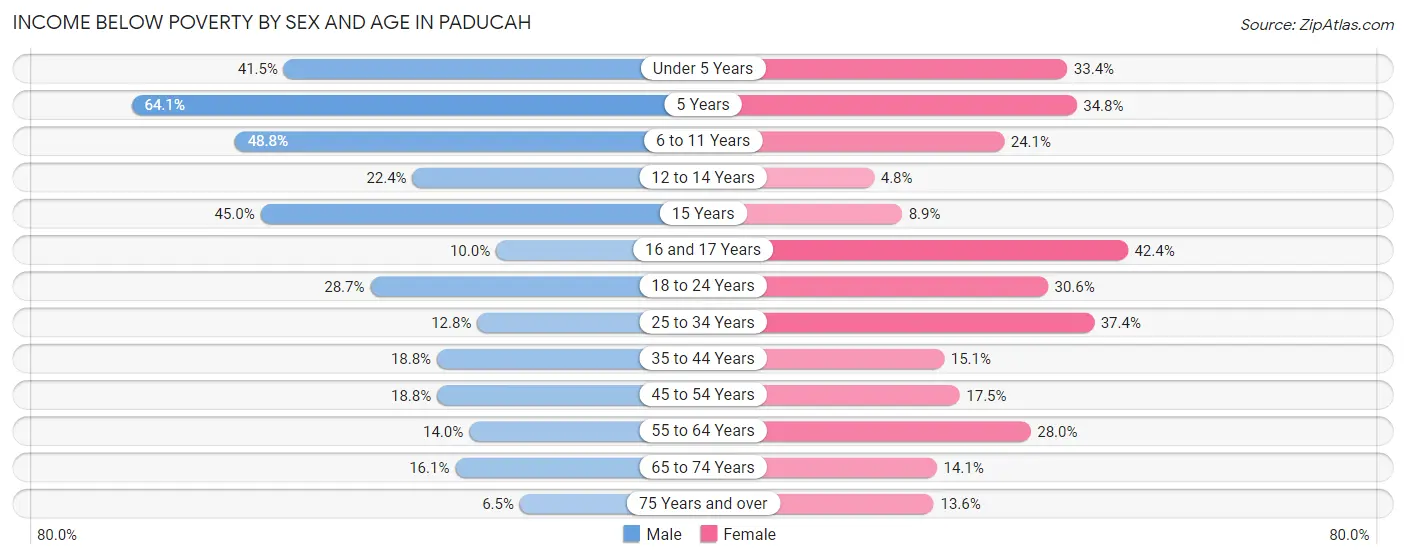
| Age Bracket | Male | Female |
| Under 5 Years | 330 (41.5%) | 235 (33.4%) |
| 5 Years | 84 (64.1%) | 39 (34.8%) |
| 6 to 11 Years | 404 (48.8%) | 275 (24.1%) |
| 12 to 14 Years | 93 (22.4%) | 19 (4.8%) |
| 15 Years | 107 (45.0%) | 13 (8.9%) |
| 16 and 17 Years | 7 (10.0%) | 151 (42.4%) |
| 18 to 24 Years | 322 (28.7%) | 325 (30.5%) |
| 25 to 34 Years | 202 (12.8%) | 541 (37.4%) |
| 35 to 44 Years | 287 (18.8%) | 297 (15.1%) |
| 45 to 54 Years | 338 (18.8%) | 311 (17.5%) |
| 55 to 64 Years | 247 (14.0%) | 532 (28.0%) |
| 65 to 74 Years | 177 (16.1%) | 211 (14.1%) |
| 75 Years and over | 42 (6.5%) | 165 (13.6%) |
| Total | 2,640 (22.0%) | 3,114 (22.7%) |
Income Above Poverty by Sex and Age in Paducah
According to the poverty statistics in Paducah, males aged 75 years and over and females aged 12 to 14 years are the age groups that are most secure financially, with 93.5% of males and 95.3% of females in these age groups living above the poverty line.
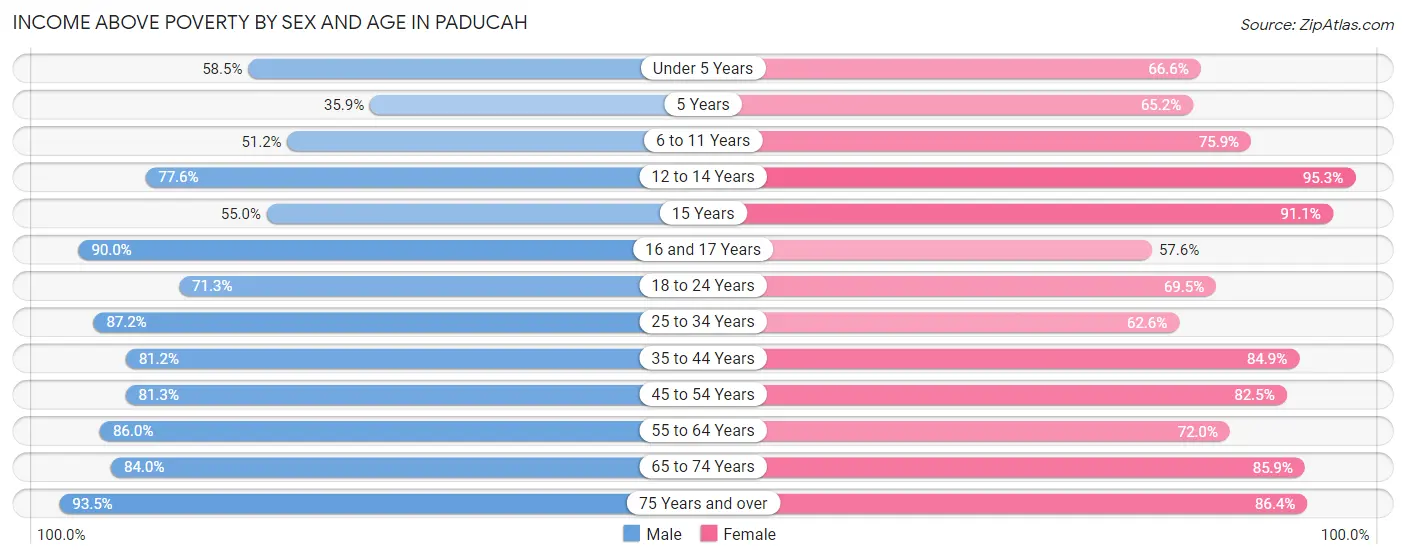
| Age Bracket | Male | Female |
| Under 5 Years | 465 (58.5%) | 468 (66.6%) |
| 5 Years | 47 (35.9%) | 73 (65.2%) |
| 6 to 11 Years | 424 (51.2%) | 868 (75.9%) |
| 12 to 14 Years | 322 (77.6%) | 381 (95.3%) |
| 15 Years | 131 (55.0%) | 133 (91.1%) |
| 16 and 17 Years | 63 (90.0%) | 205 (57.6%) |
| 18 to 24 Years | 801 (71.3%) | 739 (69.5%) |
| 25 to 34 Years | 1,377 (87.2%) | 905 (62.6%) |
| 35 to 44 Years | 1,242 (81.2%) | 1,665 (84.9%) |
| 45 to 54 Years | 1,465 (81.2%) | 1,470 (82.5%) |
| 55 to 64 Years | 1,517 (86.0%) | 1,369 (72.0%) |
| 65 to 74 Years | 926 (84.0%) | 1,289 (85.9%) |
| 75 Years and over | 607 (93.5%) | 1,046 (86.4%) |
| Total | 9,387 (78.0%) | 10,611 (77.3%) |
Income Below Poverty Among Married-Couple Families in Paducah
The poverty statistics for married-couple families in Paducah show that 7.9% or 305 of the total 3,881 families live below the poverty line. Families with 5 or more children have the highest poverty rate of 30.4%, comprising of 17 families. On the other hand, families with no children have the lowest poverty rate of 6.0%, which includes 152 families.
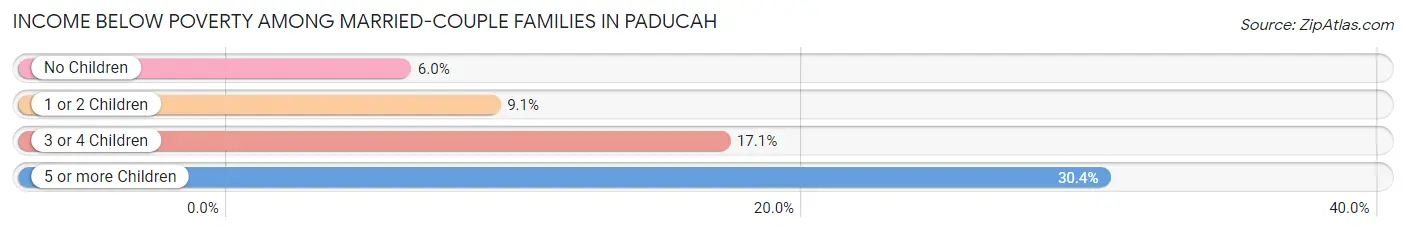
| Children | Above Poverty | Below Poverty |
| No Children | 2,373 (94.0%) | 152 (6.0%) |
| 1 or 2 Children | 985 (90.9%) | 99 (9.1%) |
| 3 or 4 Children | 179 (82.9%) | 37 (17.1%) |
| 5 or more Children | 39 (69.6%) | 17 (30.4%) |
| Total | 3,576 (92.1%) | 305 (7.9%) |
Income Below Poverty Among Single-Parent Households in Paducah
According to the poverty data in Paducah, 9.2% or 36 single-father households and 42.4% or 724 single-mother households are living below the poverty line. Among single-father households, those with no children have the highest poverty rate, with 16 households (10.5%) experiencing poverty. Likewise, among single-mother households, those with 5 or more children have the highest poverty rate, with 18 households (100.0%) falling below the poverty line.
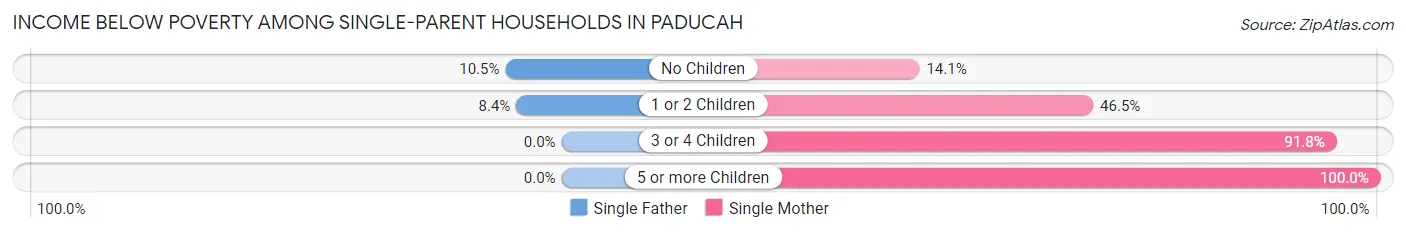
| Children | Single Father | Single Mother |
| No Children | 16 (10.5%) | 73 (14.1%) |
| 1 or 2 Children | 20 (8.4%) | 454 (46.5%) |
| 3 or 4 Children | 0 (0.0%) | 179 (91.8%) |
| 5 or more Children | 0 (0.0%) | 18 (100.0%) |
| Total | 36 (9.2%) | 724 (42.4%) |
Income Below Poverty Among Married-Couple vs Single-Parent Households in Paducah
The poverty data for Paducah shows that 305 of the married-couple family households (7.9%) and 760 of the single-parent households (36.2%) are living below the poverty level. Within the married-couple family households, those with 5 or more children have the highest poverty rate, with 17 households (30.4%) falling below the poverty line. Among the single-parent households, those with 5 or more children have the highest poverty rate, with 18 household (100.0%) living below poverty.
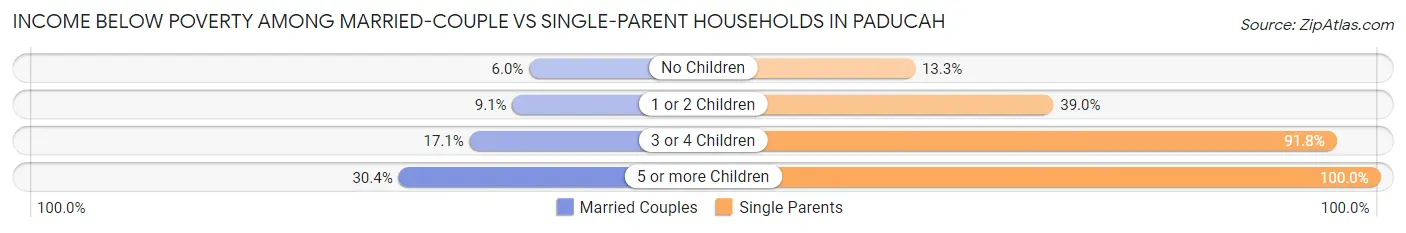
| Children | Married-Couple Families | Single-Parent Households |
| No Children | 152 (6.0%) | 89 (13.3%) |
| 1 or 2 Children | 99 (9.1%) | 474 (39.0%) |
| 3 or 4 Children | 37 (17.1%) | 179 (91.8%) |
| 5 or more Children | 17 (30.4%) | 18 (100.0%) |
| Total | 305 (7.9%) | 760 (36.2%) |
Race in Paducah
The most populous races in Paducah are White / Caucasian (18,942 | 70.5%), Black / African American (5,871 | 21.8%), and Two or more Races (1,416 | 5.3%).
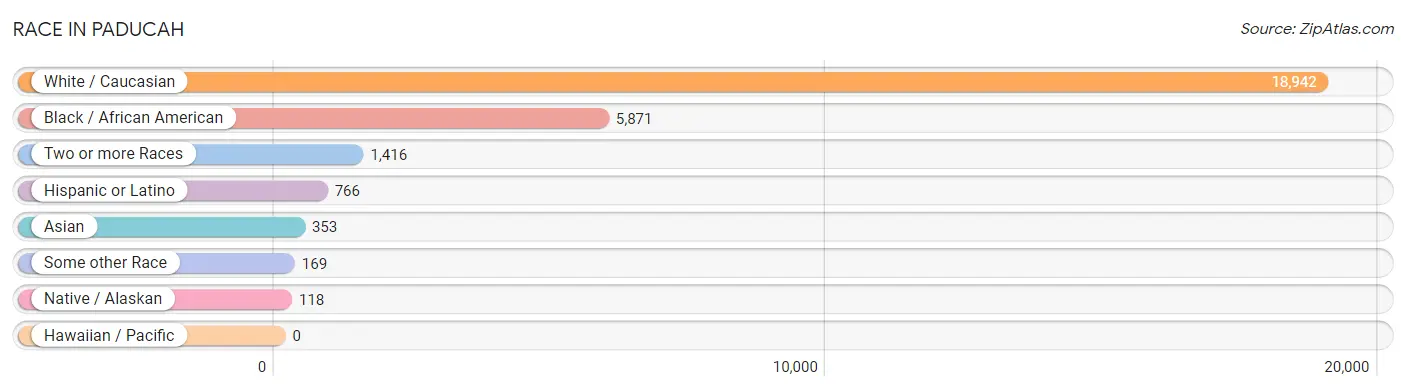
| Race | # Population | % Population |
| Asian | 353 | 1.3% |
| Black / African American | 5,871 | 21.8% |
| Hawaiian / Pacific | 0 | 0.0% |
| Hispanic or Latino | 766 | 2.9% |
| Native / Alaskan | 118 | 0.4% |
| White / Caucasian | 18,942 | 70.5% |
| Two or more Races | 1,416 | 5.3% |
| Some other Race | 169 | 0.6% |
| Total | 26,869 | 100.0% |
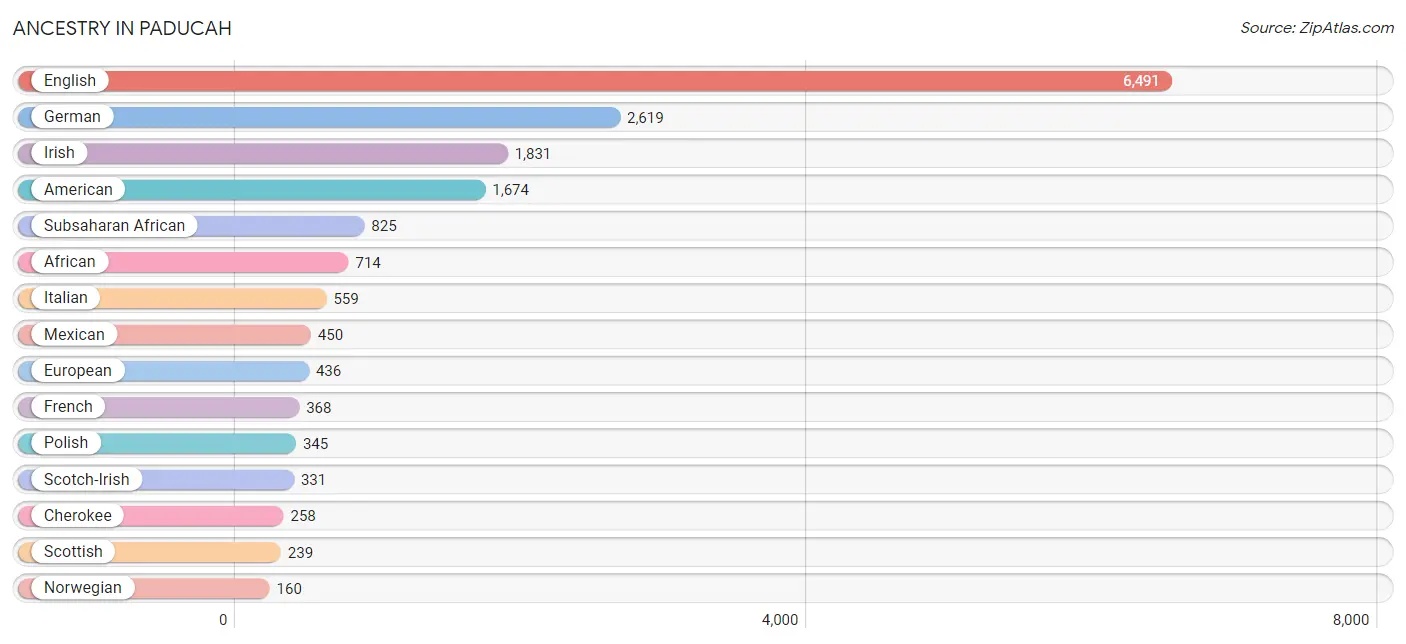
Ancestry in Paducah
The most populous ancestries reported in Paducah are English (6,491 | 24.2%), German (2,619 | 9.8%), Irish (1,831 | 6.8%), American (1,674 | 6.2%), and Subsaharan African (825 | 3.1%), together accounting for 50.0% of all Paducah residents.
| Ancestry | # Population | % Population |
| African | 714 | 2.7% |
| Alaska Native | 4 | 0.0% |
| American | 1,674 | 6.2% |
| Arab | 33 | 0.1% |
| Argentinean | 55 | 0.2% |
| Austrian | 44 | 0.2% |
| Belgian | 14 | 0.1% |
| Bhutanese | 50 | 0.2% |
| Blackfeet | 32 | 0.1% |
| British | 70 | 0.3% |
| Burmese | 62 | 0.2% |
| Canadian | 5 | 0.0% |
| Central American | 12 | 0.0% |
| Cherokee | 258 | 1.0% |
| Chickasaw | 8 | 0.0% |
| Colombian | 43 | 0.2% |
| Cuban | 30 | 0.1% |
| Czech | 35 | 0.1% |
| Dutch | 76 | 0.3% |
| Eastern European | 14 | 0.1% |
| English | 6,491 | 24.2% |
| Ethiopian | 98 | 0.4% |
| European | 436 | 1.6% |
| Filipino | 5 | 0.0% |
| Finnish | 10 | 0.0% |
| French | 368 | 1.4% |
| French Canadian | 57 | 0.2% |
| German | 2,619 | 9.8% |
| Greek | 35 | 0.1% |
| Guatemalan | 12 | 0.0% |
| Indian (Asian) | 83 | 0.3% |
| Iranian | 8 | 0.0% |
| Irish | 1,831 | 6.8% |
| Iroquois | 21 | 0.1% |
| Italian | 559 | 2.1% |
| Jamaican | 20 | 0.1% |
| Korean | 35 | 0.1% |
| Lebanese | 23 | 0.1% |
| Lithuanian | 26 | 0.1% |
| Mexican | 450 | 1.7% |
| Mexican American Indian | 4 | 0.0% |
| Nigerian | 13 | 0.1% |
| Northern European | 38 | 0.1% |
| Norwegian | 160 | 0.6% |
| Polish | 345 | 1.3% |
| Puerto Rican | 138 | 0.5% |
| Romanian | 7 | 0.0% |
| Russian | 15 | 0.1% |
| Scandinavian | 98 | 0.4% |
| Scotch-Irish | 331 | 1.2% |
| Scottish | 239 | 0.9% |
| Sioux | 23 | 0.1% |
| Slovak | 28 | 0.1% |
| South American | 98 | 0.4% |
| Spaniard | 12 | 0.0% |
| Spanish | 3 | 0.0% |
| Sri Lankan | 102 | 0.4% |
| Subsaharan African | 825 | 3.1% |
| Swedish | 32 | 0.1% |
| Swiss | 10 | 0.0% |
| Thai | 87 | 0.3% |
| Welsh | 128 | 0.5% | View All 62 Rows |
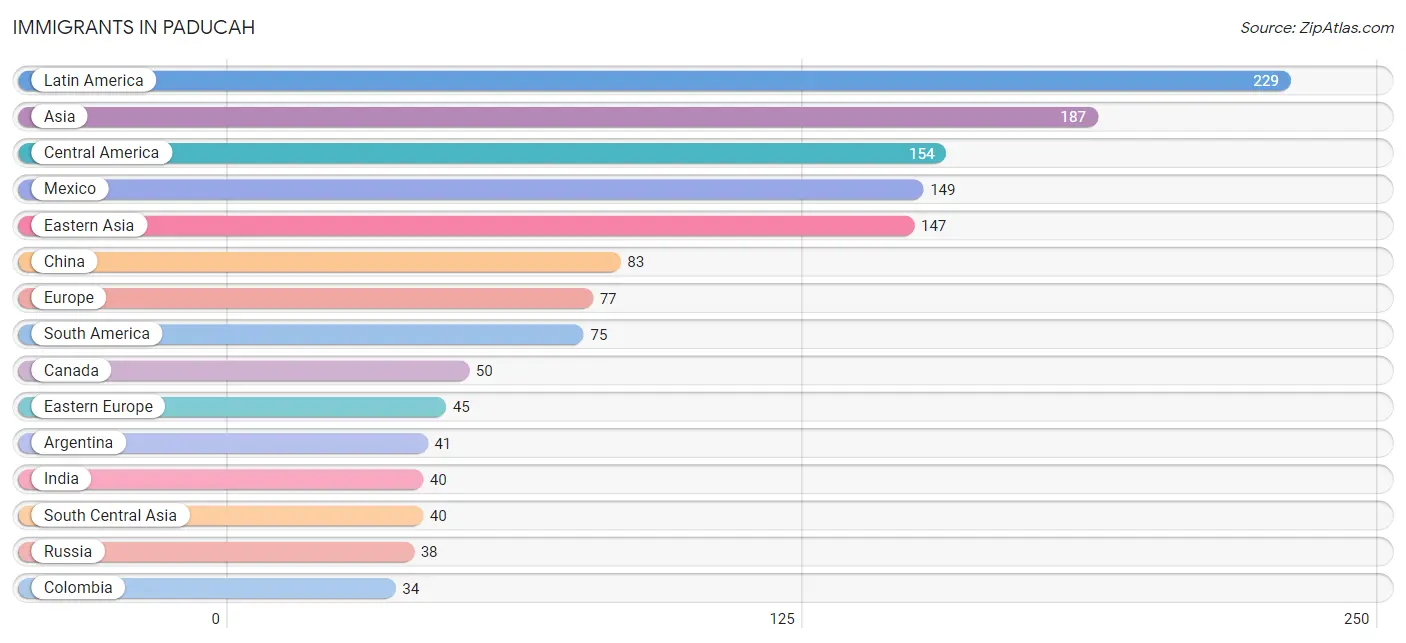
Immigrants in Paducah
The most numerous immigrant groups reported in Paducah came from Latin America (229 | 0.9%), Asia (187 | 0.7%), Central America (154 | 0.6%), Mexico (149 | 0.5%), and Eastern Asia (147 | 0.5%), together accounting for 3.2% of all Paducah residents.
| Immigration Origin | # Population | % Population |
| Africa | 13 | 0.1% |
| Argentina | 41 | 0.2% |
| Asia | 187 | 0.7% |
| Canada | 50 | 0.2% |
| Central America | 154 | 0.6% |
| China | 83 | 0.3% |
| Colombia | 34 | 0.1% |
| Eastern Asia | 147 | 0.5% |
| Eastern Europe | 45 | 0.2% |
| England | 24 | 0.1% |
| Europe | 77 | 0.3% |
| Germany | 8 | 0.0% |
| Guatemala | 5 | 0.0% |
| India | 40 | 0.2% |
| Japan | 32 | 0.1% |
| Korea | 32 | 0.1% |
| Latin America | 229 | 0.9% |
| Mexico | 149 | 0.5% |
| Nigeria | 13 | 0.1% |
| Northern Europe | 24 | 0.1% |
| Romania | 7 | 0.0% |
| Russia | 38 | 0.1% |
| South America | 75 | 0.3% |
| South Central Asia | 40 | 0.2% |
| Taiwan | 15 | 0.1% |
| Western Africa | 13 | 0.1% |
| Western Europe | 8 | 0.0% | View All 27 Rows |
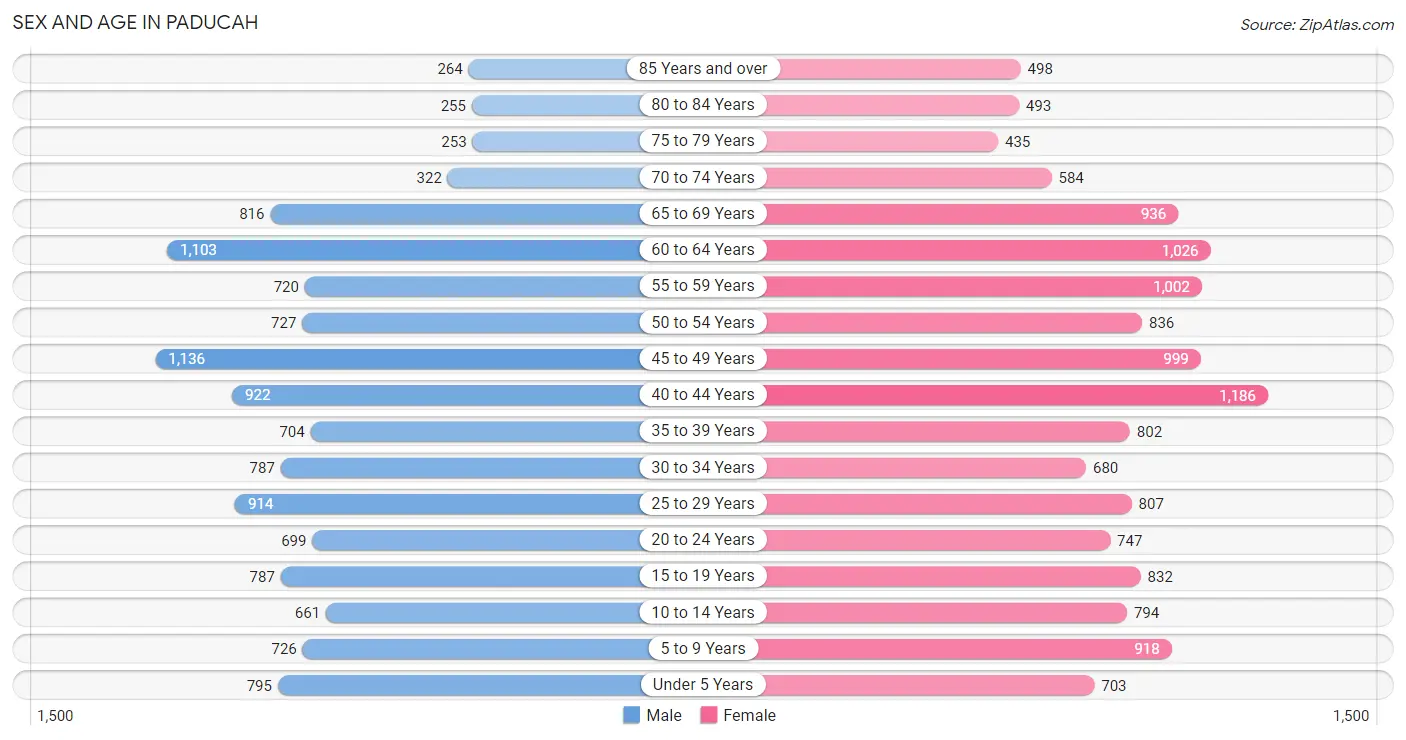
Sex and Age in Paducah
Sex and Age in Paducah
The most populous age groups in Paducah are 45 to 49 Years (1,136 | 9.0%) for men and 40 to 44 Years (1,186 | 8.3%) for women.
| Age Bracket | Male | Female |
| Under 5 Years | 795 (6.3%) | 703 (4.9%) |
| 5 to 9 Years | 726 (5.8%) | 918 (6.4%) |
| 10 to 14 Years | 661 (5.2%) | 794 (5.6%) |
| 15 to 19 Years | 787 (6.2%) | 832 (5.8%) |
| 20 to 24 Years | 699 (5.6%) | 747 (5.2%) |
| 25 to 29 Years | 914 (7.3%) | 807 (5.7%) |
| 30 to 34 Years | 787 (6.2%) | 680 (4.8%) |
| 35 to 39 Years | 704 (5.6%) | 802 (5.6%) |
| 40 to 44 Years | 922 (7.3%) | 1,186 (8.3%) |
| 45 to 49 Years | 1,136 (9.0%) | 999 (7.0%) |
| 50 to 54 Years | 727 (5.8%) | 836 (5.9%) |
| 55 to 59 Years | 720 (5.7%) | 1,002 (7.0%) |
| 60 to 64 Years | 1,103 (8.8%) | 1,026 (7.2%) |
| 65 to 69 Years | 816 (6.5%) | 936 (6.6%) |
| 70 to 74 Years | 322 (2.6%) | 584 (4.1%) |
| 75 to 79 Years | 253 (2.0%) | 435 (3.0%) |
| 80 to 84 Years | 255 (2.0%) | 493 (3.5%) |
| 85 Years and over | 264 (2.1%) | 498 (3.5%) |
| Total | 12,591 (100.0%) | 14,278 (100.0%) |
Families and Households in Paducah
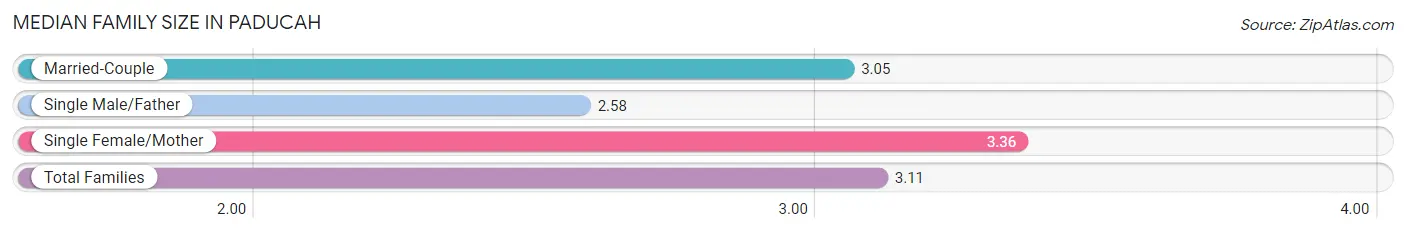
Median Family Size in Paducah
The median family size in Paducah is 3.11 persons per family, with single female/mother families (1,707 | 28.5%) accounting for the largest median family size of 3.36 persons per family. On the other hand, single male/father families (390 | 6.5%) represent the smallest median family size with 2.58 persons per family.
| Family Type | # Families | Family Size |
| Married-Couple | 3,881 (64.9%) | 3.05 |
| Single Male/Father | 390 (6.5%) | 2.58 |
| Single Female/Mother | 1,707 (28.5%) | 3.36 |
| Total Families | 5,978 (100.0%) | 3.11 |
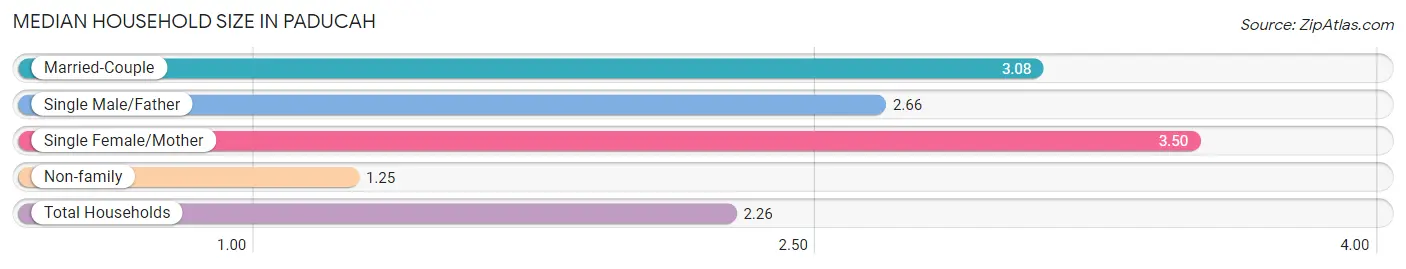
Median Household Size in Paducah
The median household size in Paducah is 2.26 persons per household, with single female/mother households (1,707 | 14.9%) accounting for the largest median household size of 3.5 persons per household. non-family households (5,454 | 47.7%) represent the smallest median household size with 1.25 persons per household.
| Household Type | # Households | Household Size |
| Married-Couple | 3,881 (34.0%) | 3.08 |
| Single Male/Father | 390 (3.4%) | 2.66 |
| Single Female/Mother | 1,707 (14.9%) | 3.50 |
| Non-family | 5,454 (47.7%) | 1.25 |
| Total Households | 11,432 (100.0%) | 2.26 |
Household Size by Marriage Status in Paducah
Out of a total of 11,432 households in Paducah, 5,978 (52.3%) are family households, while 5,454 (47.7%) are nonfamily households. The most numerous type of family households are 2-person households, comprising 3,053, and the most common type of nonfamily households are 1-person households, comprising 4,481.
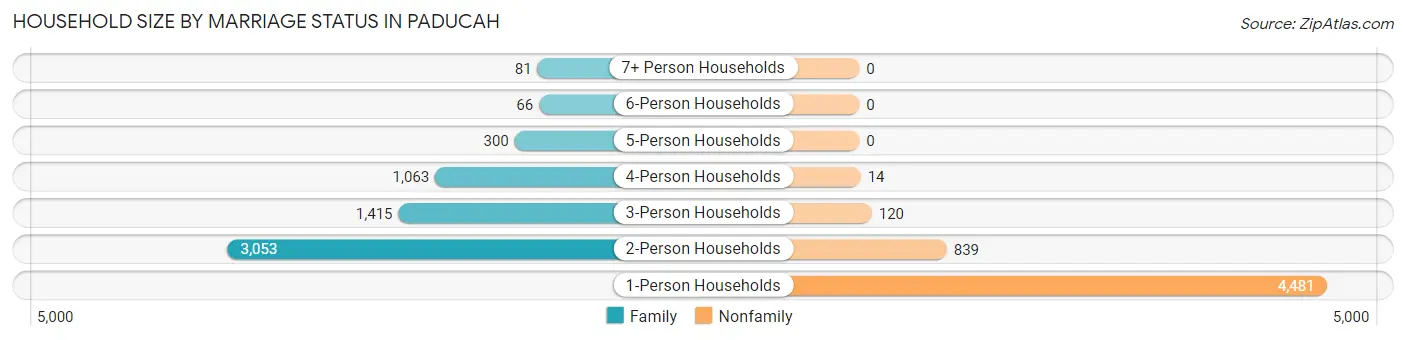
| Household Size | Family Households | Nonfamily Households |
| 1-Person Households | - | 4,481 (39.2%) |
| 2-Person Households | 3,053 (26.7%) | 839 (7.3%) |
| 3-Person Households | 1,415 (12.4%) | 120 (1.1%) |
| 4-Person Households | 1,063 (9.3%) | 14 (0.1%) |
| 5-Person Households | 300 (2.6%) | 0 (0.0%) |
| 6-Person Households | 66 (0.6%) | 0 (0.0%) |
| 7+ Person Households | 81 (0.7%) | 0 (0.0%) |
| Total | 5,978 (52.3%) | 5,454 (47.7%) |
Female Fertility in Paducah
Fertility by Age in Paducah
Average fertility rate in Paducah is 59.0 births per 1,000 women. Women in the age bracket of 20 to 34 years have the highest fertility rate with 92.0 births per 1,000 women. Women in the age bracket of 20 to 34 years acount for 56.1% of all women with births.
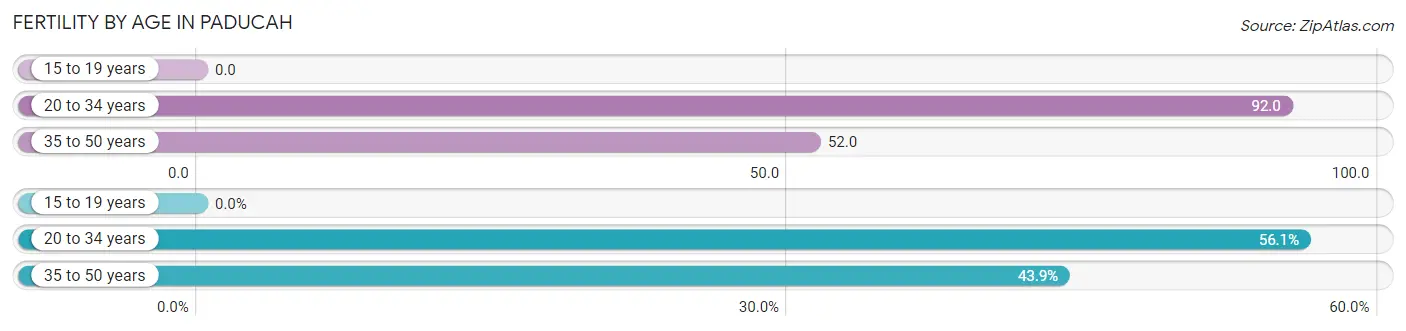
| Age Bracket | Women with Births | Births / 1,000 Women |
| 15 to 19 years | 0 (0.0%) | 0.0 |
| 20 to 34 years | 206 (56.1%) | 92.0 |
| 35 to 50 years | 161 (43.9%) | 52.0 |
| Total | 367 (100.0%) | 59.0 |
Fertility by Age by Marriage Status in Paducah
51.2% of women with births (367) in Paducah are married. The highest percentage of unmarried women with births falls into 20 to 34 years age bracket with 67.0% of them unmarried at the time of birth, while the lowest percentage of unmarried women with births belong to 35 to 50 years age bracket with 25.5% of them unmarried.
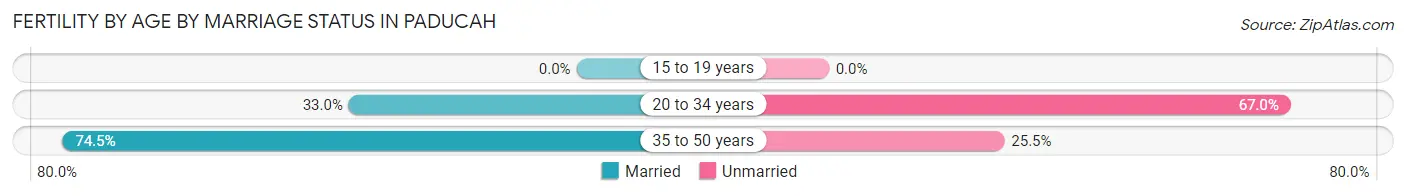
| Age Bracket | Married | Unmarried |
| 15 to 19 years | 0 (0.0%) | 0 (0.0%) |
| 20 to 34 years | 68 (33.0%) | 138 (67.0%) |
| 35 to 50 years | 120 (74.5%) | 41 (25.5%) |
| Total | 188 (51.2%) | 179 (48.8%) |
Fertility by Education in Paducah
Average fertility rate in Paducah is 59.0 births per 1,000 women. Women with the education attainment of graduate degree have the highest fertility rate of 144.0 births per 1,000 women, while women with the education attainment of high school diploma have the lowest fertility at 19.0 births per 1,000 women. Women with the education attainment of graduate degree represent 30.2% of all women with births.
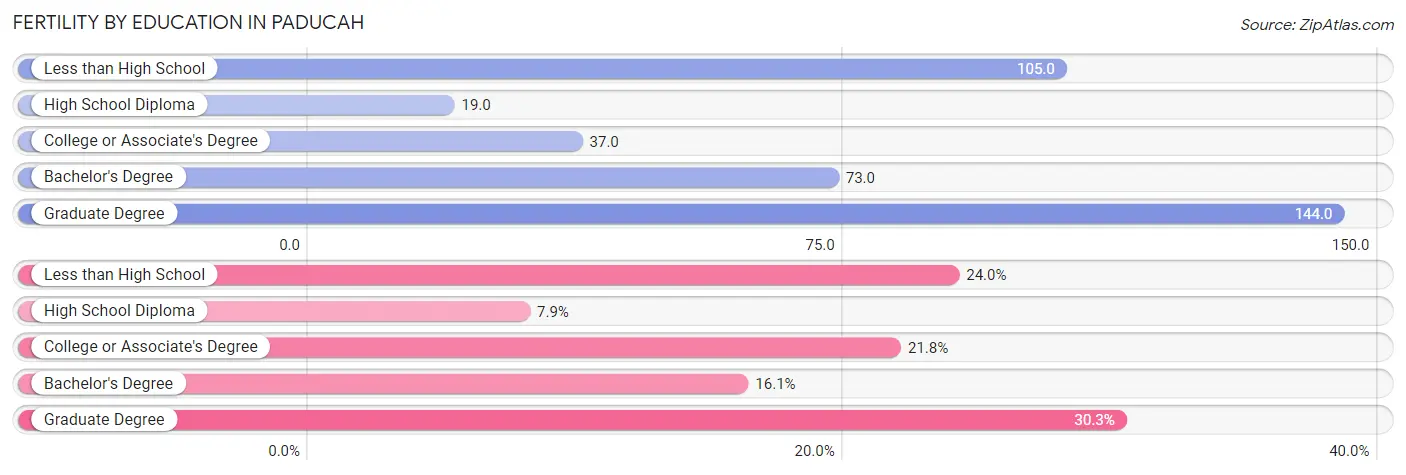
| Educational Attainment | Women with Births | Births / 1,000 Women |
| Less than High School | 88 (24.0%) | 105.0 |
| High School Diploma | 29 (7.9%) | 19.0 |
| College or Associate's Degree | 80 (21.8%) | 37.0 |
| Bachelor's Degree | 59 (16.1%) | 73.0 |
| Graduate Degree | 111 (30.2%) | 144.0 |
| Total | 367 (100.0%) | 59.0 |
Fertility by Education by Marriage Status in Paducah
48.8% of women with births in Paducah are unmarried. Women with the educational attainment of graduate degree are most likely to be married with 95.5% of them married at childbirth, while women with the educational attainment of less than high school are least likely to be married with 100.0% of them unmarried at childbirth.
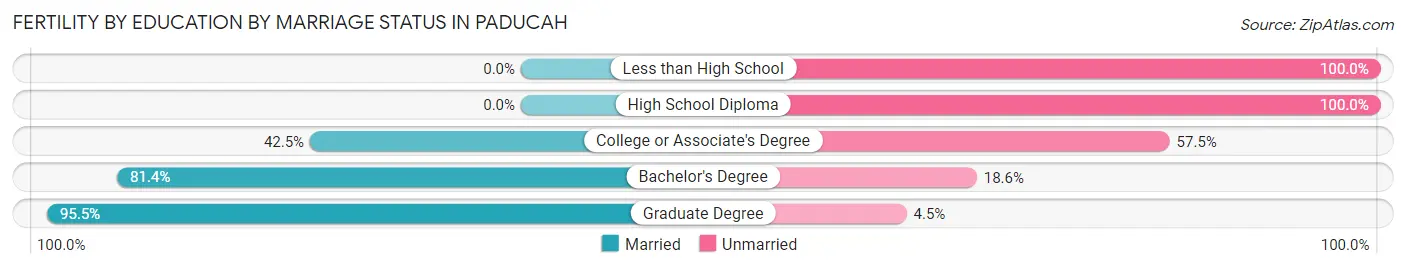
| Educational Attainment | Married | Unmarried |
| Less than High School | 0 (0.0%) | 88 (100.0%) |
| High School Diploma | 0 (0.0%) | 29 (100.0%) |
| College or Associate's Degree | 34 (42.5%) | 46 (57.5%) |
| Bachelor's Degree | 48 (81.4%) | 11 (18.6%) |
| Graduate Degree | 106 (95.5%) | 5 (4.5%) |
| Total | 188 (51.2%) | 179 (48.8%) |
Employment Characteristics in Paducah
Employment by Class of Employer in Paducah
Among the 12,027 employed individuals in Paducah, private company employees (8,743 | 72.7%), local government employees (770 | 6.4%), and not-for-profit organizations (764 | 6.4%) make up the most common classes of employment.
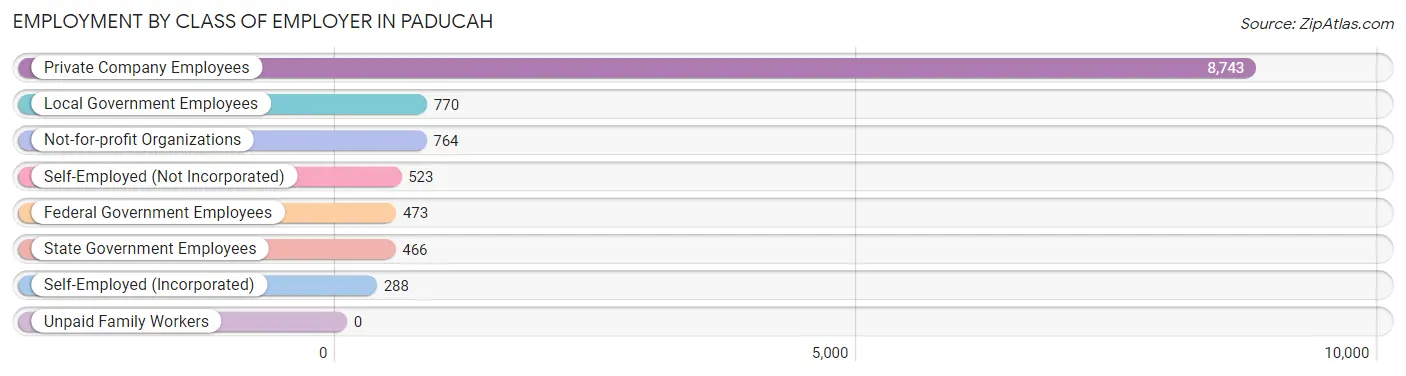
| Employer Class | # Employees | % Employees |
| Private Company Employees | 8,743 | 72.7% |
| Self-Employed (Incorporated) | 288 | 2.4% |
| Self-Employed (Not Incorporated) | 523 | 4.3% |
| Not-for-profit Organizations | 764 | 6.4% |
| Local Government Employees | 770 | 6.4% |
| State Government Employees | 466 | 3.9% |
| Federal Government Employees | 473 | 3.9% |
| Unpaid Family Workers | 0 | 0.0% |
| Total | 12,027 | 100.0% |
Employment Status by Age in Paducah
According to the labor force statistics for Paducah, out of the total population over 16 years of age (21,888), 58.2% or 12,739 individuals are in the labor force, with 3.8% or 484 of them unemployed. The age group with the highest labor force participation rate is 25 to 29 years, with 81.9% or 1,409 individuals in the labor force. Within the labor force, the 30 to 34 years age range has the highest percentage of unemployed individuals, with 8.9% or 98 of them being unemployed.
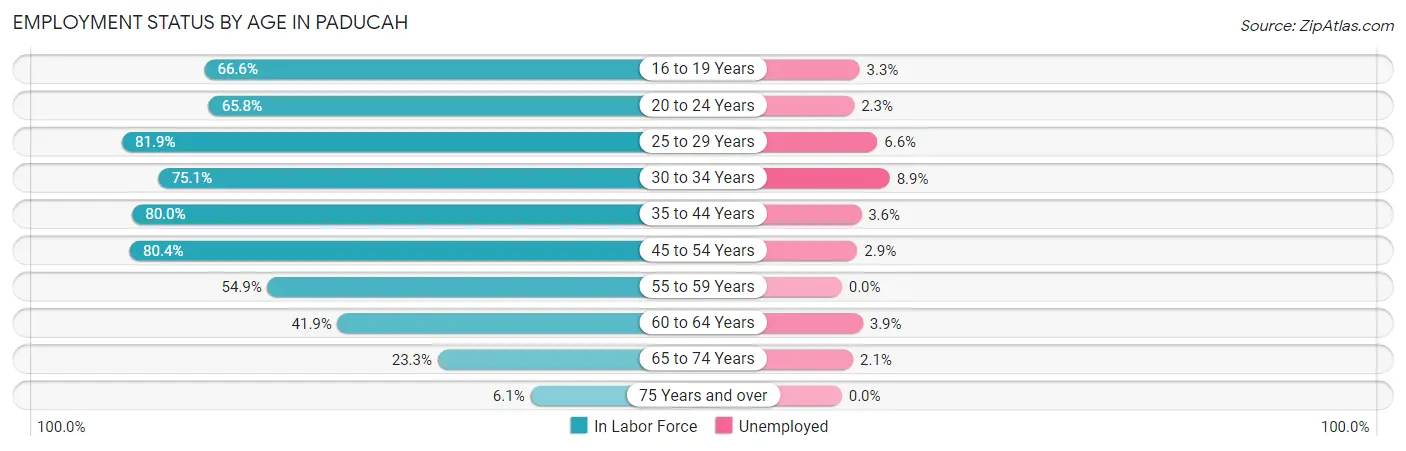
| Age Bracket | In Labor Force | Unemployed |
| 16 to 19 Years | 823 (66.6%) | 27 (3.3%) |
| 20 to 24 Years | 951 (65.8%) | 22 (2.3%) |
| 25 to 29 Years | 1,409 (81.9%) | 93 (6.6%) |
| 30 to 34 Years | 1,102 (75.1%) | 98 (8.9%) |
| 35 to 44 Years | 2,891 (80.0%) | 104 (3.6%) |
| 45 to 54 Years | 2,973 (80.4%) | 86 (2.9%) |
| 55 to 59 Years | 945 (54.9%) | 0 (0.0%) |
| 60 to 64 Years | 892 (41.9%) | 35 (3.9%) |
| 65 to 74 Years | 619 (23.3%) | 13 (2.1%) |
| 75 Years and over | 134 (6.1%) | 0 (0.0%) |
| Total | 12,739 (58.2%) | 484 (3.8%) |
Employment Status by Educational Attainment in Paducah
According to labor force statistics for Paducah, 71.2% of individuals (10,218) out of the total population between 25 and 64 years of age (14,351) are in the labor force, with 4.1% or 419 of them being unemployed. The group with the highest labor force participation rate are those with the educational attainment of bachelor's degree or higher, with 87.6% or 3,801 individuals in the labor force. Within the labor force, individuals with less than high school education have the highest percentage of unemployment, with 13.8% or 68 of them being unemployed.
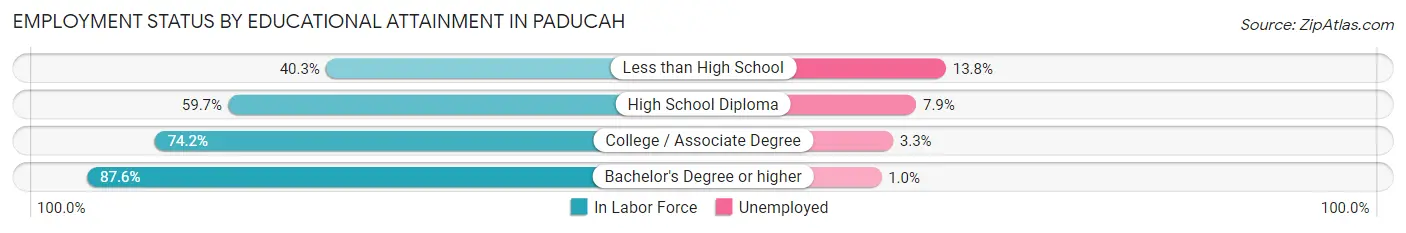
| Educational Attainment | In Labor Force | Unemployed |
| Less than High School | 494 (40.3%) | 169 (13.8%) |
| High School Diploma | 2,489 (59.7%) | 329 (7.9%) |
| College / Associate Degree | 3,425 (74.2%) | 152 (3.3%) |
| Bachelor's Degree or higher | 3,801 (87.6%) | 43 (1.0%) |
| Total | 10,218 (71.2%) | 588 (4.1%) |
Employment Occupations by Sex in Paducah
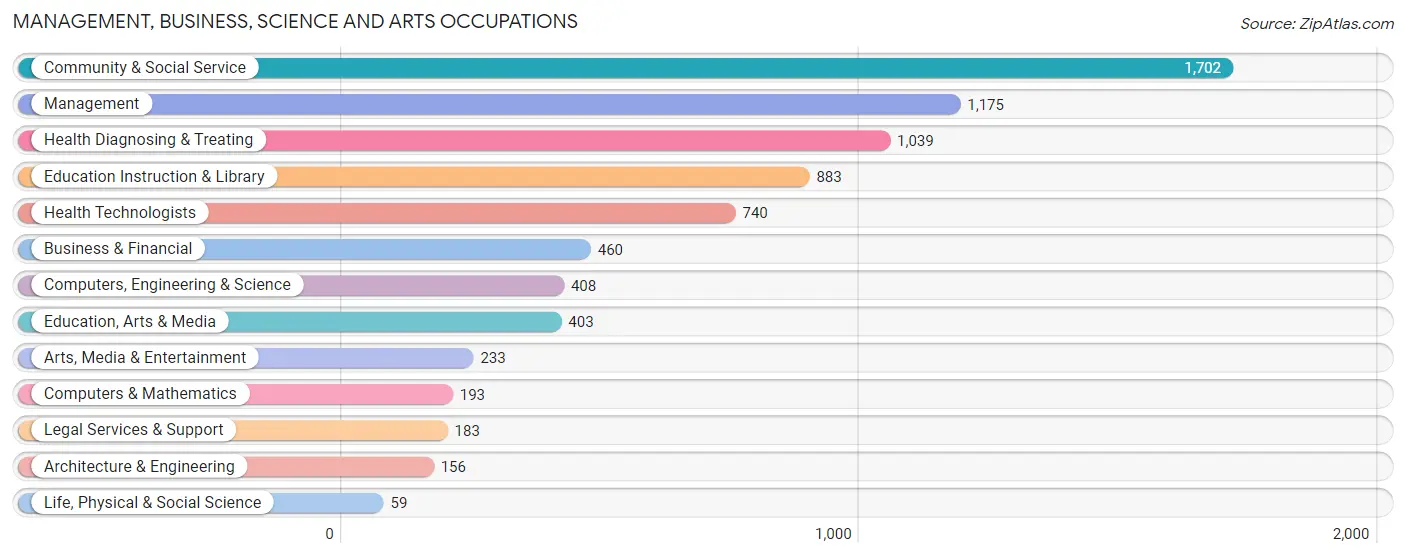
Management, Business, Science and Arts Occupations
The most common Management, Business, Science and Arts occupations in Paducah are Community & Social Service (1,702 | 13.9%), Management (1,175 | 9.6%), Health Diagnosing & Treating (1,039 | 8.5%), Education Instruction & Library (883 | 7.2%), and Health Technologists (740 | 6.0%).
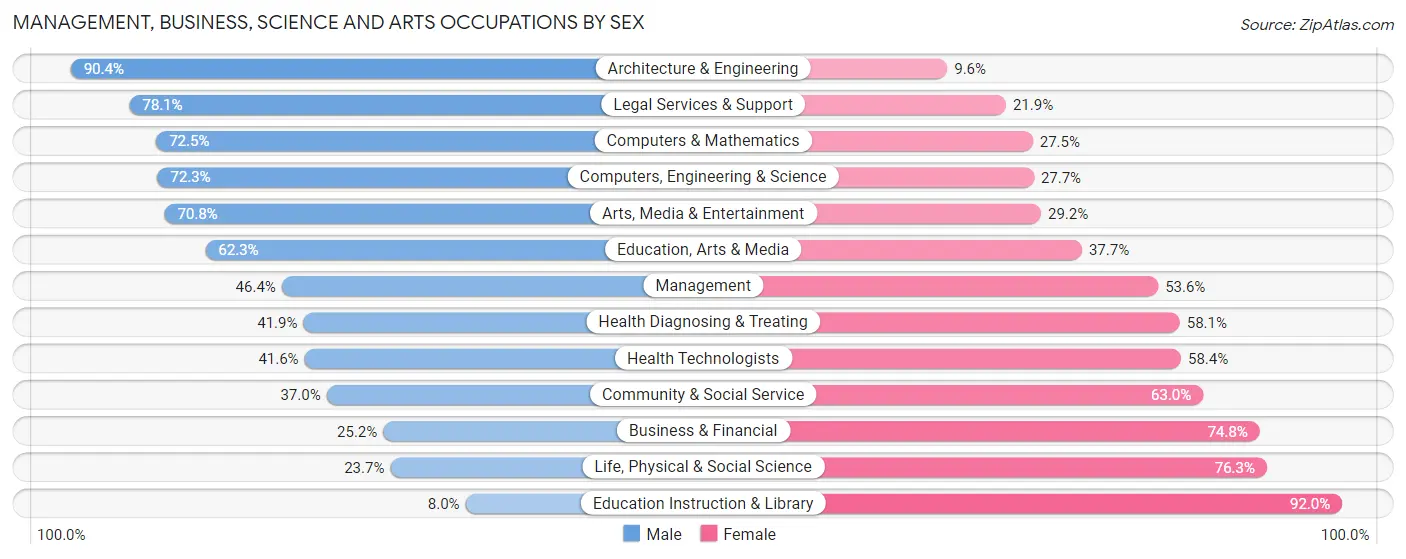
Management, Business, Science and Arts Occupations by Sex
Within the Management, Business, Science and Arts occupations in Paducah, the most male-oriented occupations are Architecture & Engineering (90.4%), Legal Services & Support (78.1%), and Computers & Mathematics (72.5%), while the most female-oriented occupations are Education Instruction & Library (92.0%), Life, Physical & Social Science (76.3%), and Business & Financial (74.8%).
| Occupation | Male | Female |
| Management | 545 (46.4%) | 630 (53.6%) |
| Business & Financial | 116 (25.2%) | 344 (74.8%) |
| Computers, Engineering & Science | 295 (72.3%) | 113 (27.7%) |
| Computers & Mathematics | 140 (72.5%) | 53 (27.5%) |
| Architecture & Engineering | 141 (90.4%) | 15 (9.6%) |
| Life, Physical & Social Science | 14 (23.7%) | 45 (76.3%) |
| Community & Social Service | 630 (37.0%) | 1,072 (63.0%) |
| Education, Arts & Media | 251 (62.3%) | 152 (37.7%) |
| Legal Services & Support | 143 (78.1%) | 40 (21.9%) |
| Education Instruction & Library | 71 (8.0%) | 812 (92.0%) |
| Arts, Media & Entertainment | 165 (70.8%) | 68 (29.2%) |
| Health Diagnosing & Treating | 435 (41.9%) | 604 (58.1%) |
| Health Technologists | 308 (41.6%) | 432 (58.4%) |
| Total (Category) | 2,021 (42.2%) | 2,763 (57.8%) |
| Total (Overall) | 5,907 (48.2%) | 6,344 (51.8%) |
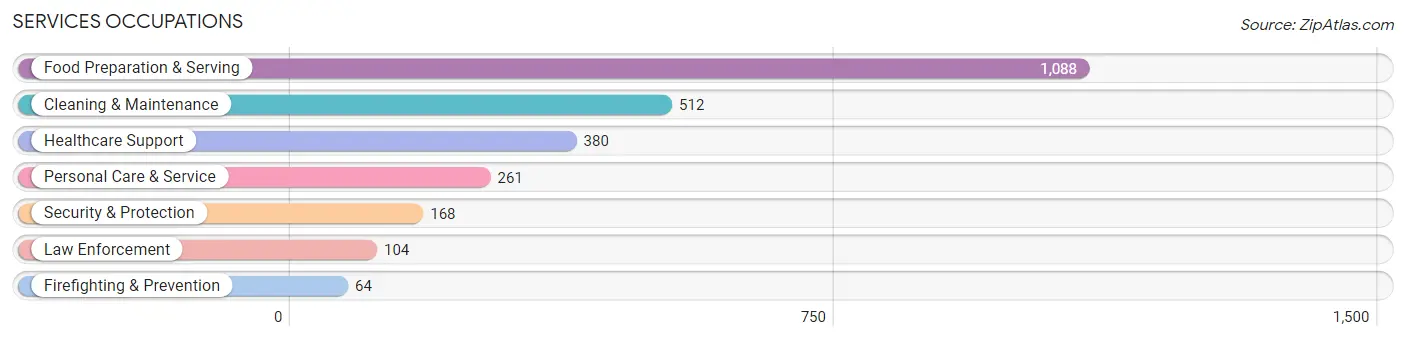
Services Occupations
The most common Services occupations in Paducah are Food Preparation & Serving (1,088 | 8.9%), Cleaning & Maintenance (512 | 4.2%), Healthcare Support (380 | 3.1%), Personal Care & Service (261 | 2.1%), and Security & Protection (168 | 1.4%).
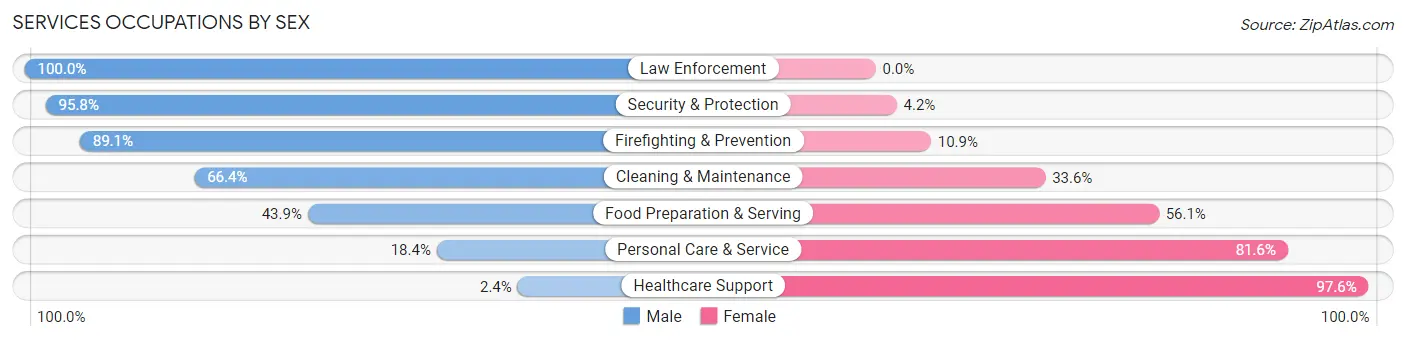
Services Occupations by Sex
Within the Services occupations in Paducah, the most male-oriented occupations are Law Enforcement (100.0%), Security & Protection (95.8%), and Firefighting & Prevention (89.1%), while the most female-oriented occupations are Healthcare Support (97.6%), Personal Care & Service (81.6%), and Food Preparation & Serving (56.1%).
| Occupation | Male | Female |
| Healthcare Support | 9 (2.4%) | 371 (97.6%) |
| Security & Protection | 161 (95.8%) | 7 (4.2%) |
| Firefighting & Prevention | 57 (89.1%) | 7 (10.9%) |
| Law Enforcement | 104 (100.0%) | 0 (0.0%) |
| Food Preparation & Serving | 478 (43.9%) | 610 (56.1%) |
| Cleaning & Maintenance | 340 (66.4%) | 172 (33.6%) |
| Personal Care & Service | 48 (18.4%) | 213 (81.6%) |
| Total (Category) | 1,036 (43.0%) | 1,373 (57.0%) |
| Total (Overall) | 5,907 (48.2%) | 6,344 (51.8%) |
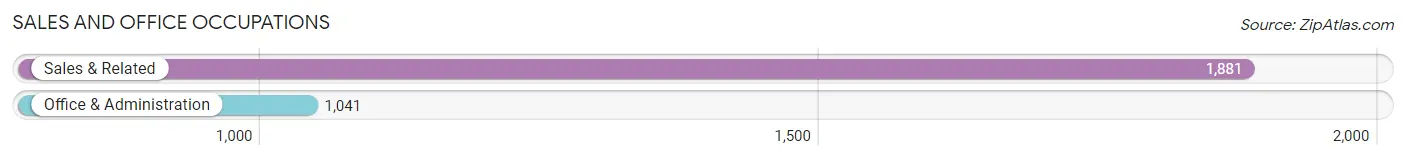
Sales and Office Occupations
The most common Sales and Office occupations in Paducah are Sales & Related (1,881 | 15.3%), and Office & Administration (1,041 | 8.5%).
Sales and Office Occupations by Sex
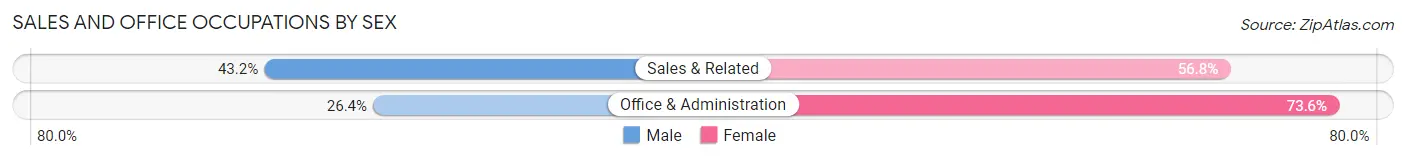
| Occupation | Male | Female |
| Sales & Related | 812 (43.2%) | 1,069 (56.8%) |
| Office & Administration | 275 (26.4%) | 766 (73.6%) |
| Total (Category) | 1,087 (37.2%) | 1,835 (62.8%) |
| Total (Overall) | 5,907 (48.2%) | 6,344 (51.8%) |
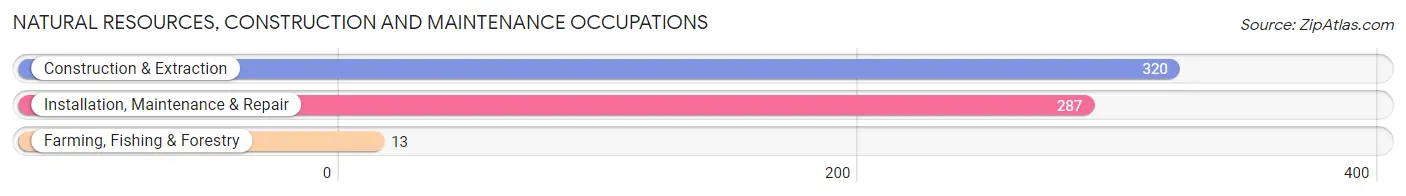
Natural Resources, Construction and Maintenance Occupations
The most common Natural Resources, Construction and Maintenance occupations in Paducah are Construction & Extraction (320 | 2.6%), Installation, Maintenance & Repair (287 | 2.3%), and Farming, Fishing & Forestry (13 | 0.1%).
Natural Resources, Construction and Maintenance Occupations by Sex
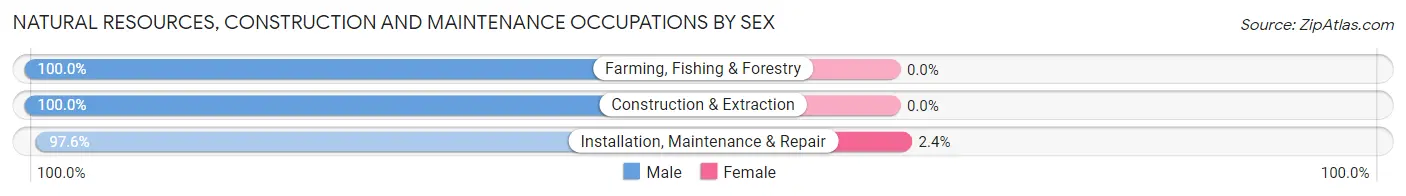
| Occupation | Male | Female |
| Farming, Fishing & Forestry | 13 (100.0%) | 0 (0.0%) |
| Construction & Extraction | 320 (100.0%) | 0 (0.0%) |
| Installation, Maintenance & Repair | 280 (97.6%) | 7 (2.4%) |
| Total (Category) | 613 (98.9%) | 7 (1.1%) |
| Total (Overall) | 5,907 (48.2%) | 6,344 (51.8%) |
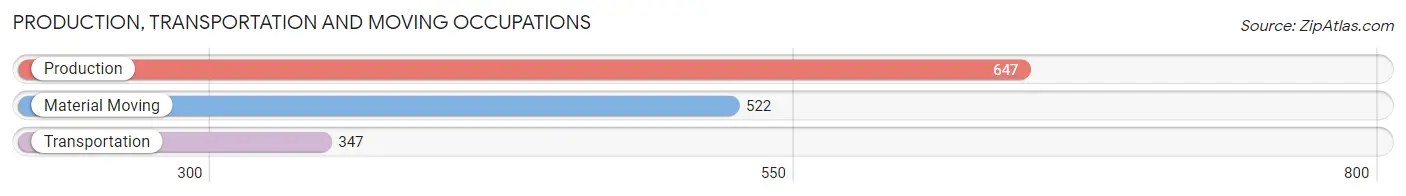
Production, Transportation and Moving Occupations
The most common Production, Transportation and Moving occupations in Paducah are Production (647 | 5.3%), Material Moving (522 | 4.3%), and Transportation (347 | 2.8%).
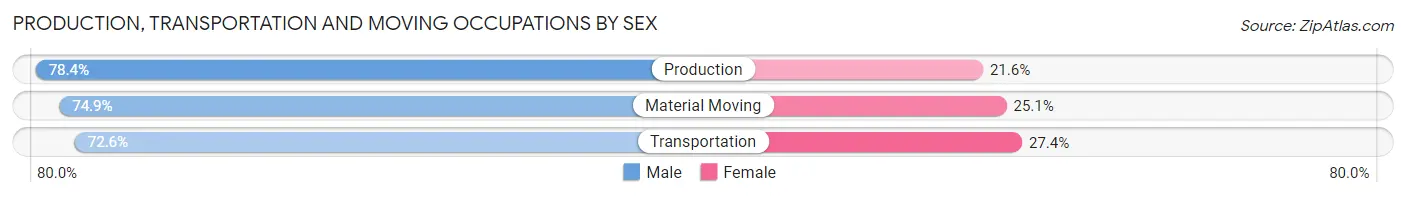
Production, Transportation and Moving Occupations by Sex
| Occupation | Male | Female |
| Production | 507 (78.4%) | 140 (21.6%) |
| Transportation | 252 (72.6%) | 95 (27.4%) |
| Material Moving | 391 (74.9%) | 131 (25.1%) |
| Total (Category) | 1,150 (75.9%) | 366 (24.1%) |
| Total (Overall) | 5,907 (48.2%) | 6,344 (51.8%) |
Employment Industries by Sex in Paducah
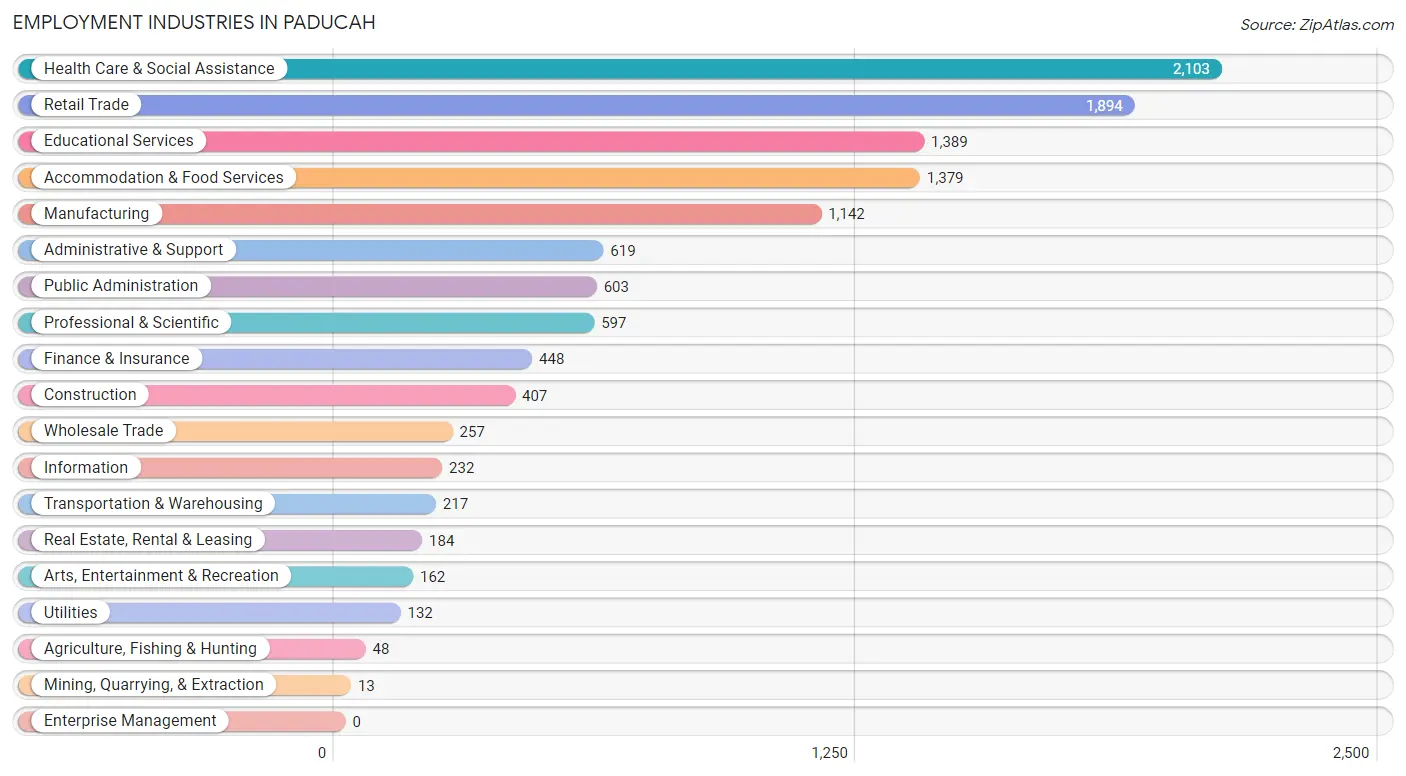
Employment Industries in Paducah
The major employment industries in Paducah include Health Care & Social Assistance (2,103 | 17.2%), Retail Trade (1,894 | 15.5%), Educational Services (1,389 | 11.3%), Accommodation & Food Services (1,379 | 11.3%), and Manufacturing (1,142 | 9.3%).
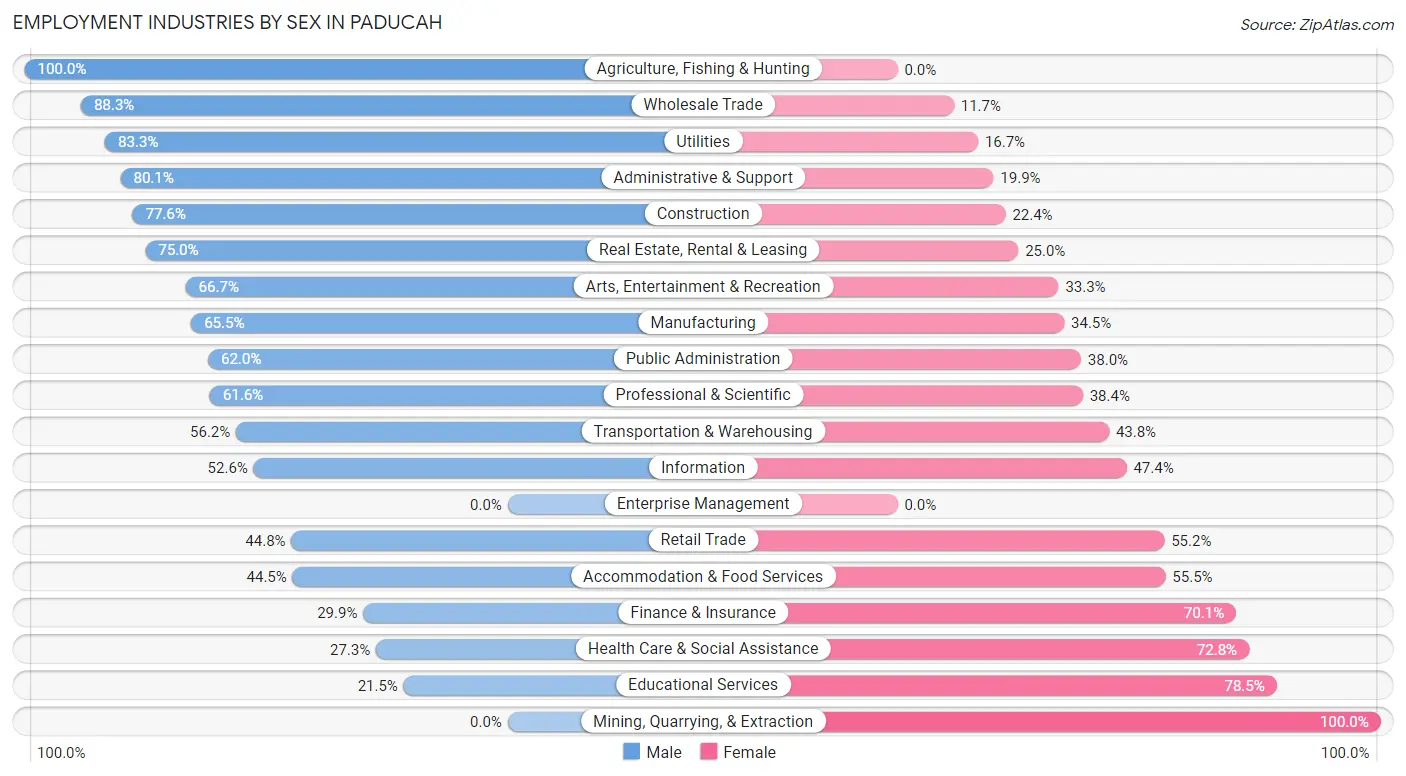
Employment Industries by Sex in Paducah
The Paducah industries that see more men than women are Agriculture, Fishing & Hunting (100.0%), Wholesale Trade (88.3%), and Utilities (83.3%), whereas the industries that tend to have a higher number of women are Mining, Quarrying, & Extraction (100.0%), Educational Services (78.5%), and Health Care & Social Assistance (72.8%).
| Industry | Male | Female |
| Agriculture, Fishing & Hunting | 48 (100.0%) | 0 (0.0%) |
| Mining, Quarrying, & Extraction | 0 (0.0%) | 13 (100.0%) |
| Construction | 316 (77.6%) | 91 (22.4%) |
| Manufacturing | 748 (65.5%) | 394 (34.5%) |
| Wholesale Trade | 227 (88.3%) | 30 (11.7%) |
| Retail Trade | 848 (44.8%) | 1,046 (55.2%) |
| Transportation & Warehousing | 122 (56.2%) | 95 (43.8%) |
| Utilities | 110 (83.3%) | 22 (16.7%) |
| Information | 122 (52.6%) | 110 (47.4%) |
| Finance & Insurance | 134 (29.9%) | 314 (70.1%) |
| Real Estate, Rental & Leasing | 138 (75.0%) | 46 (25.0%) |
| Professional & Scientific | 368 (61.6%) | 229 (38.4%) |
| Enterprise Management | 0 (0.0%) | 0 (0.0%) |
| Administrative & Support | 496 (80.1%) | 123 (19.9%) |
| Educational Services | 299 (21.5%) | 1,090 (78.5%) |
| Health Care & Social Assistance | 573 (27.3%) | 1,530 (72.8%) |
| Arts, Entertainment & Recreation | 108 (66.7%) | 54 (33.3%) |
| Accommodation & Food Services | 614 (44.5%) | 765 (55.5%) |
| Public Administration | 374 (62.0%) | 229 (38.0%) |
| Total | 5,907 (48.2%) | 6,344 (51.8%) |
Education in Paducah
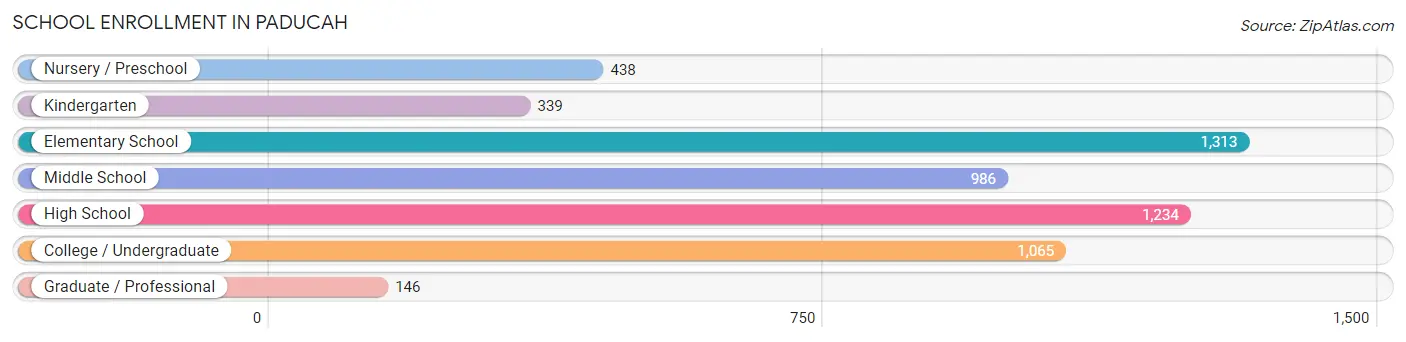
School Enrollment in Paducah
The most common levels of schooling among the 5,521 students in Paducah are elementary school (1,313 | 23.8%), high school (1,234 | 22.4%), and college / undergraduate (1,065 | 19.3%).
| School Level | # Students | % Students |
| Nursery / Preschool | 438 | 7.9% |
| Kindergarten | 339 | 6.1% |
| Elementary School | 1,313 | 23.8% |
| Middle School | 986 | 17.9% |
| High School | 1,234 | 22.4% |
| College / Undergraduate | 1,065 | 19.3% |
| Graduate / Professional | 146 | 2.6% |
| Total | 5,521 | 100.0% |
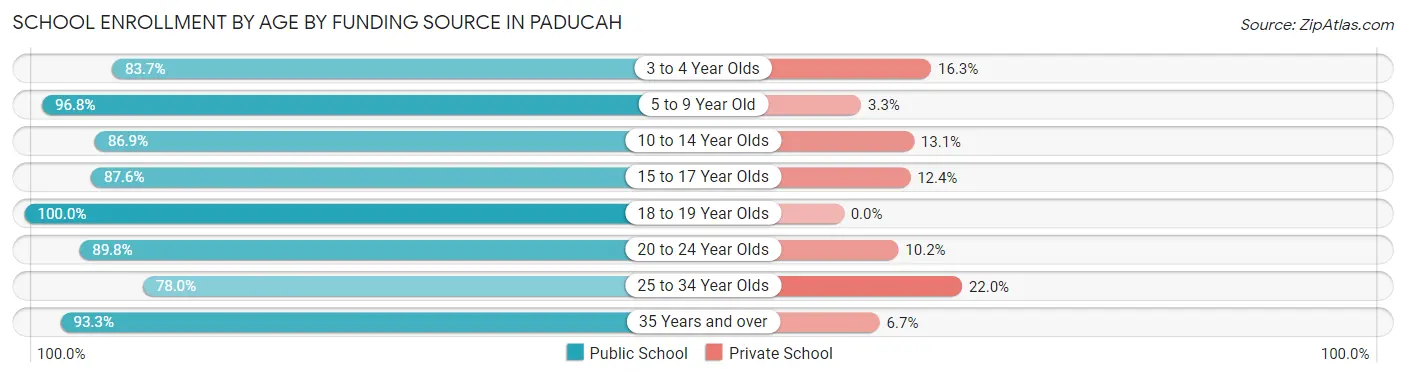
School Enrollment by Age by Funding Source in Paducah
Out of a total of 5,521 students who are enrolled in schools in Paducah, 491 (8.9%) attend a private institution, while the remaining 5,030 (91.1%) are enrolled in public schools. The age group of 25 to 34 year olds has the highest likelihood of being enrolled in private schools, with 50 (22.0% in the age bracket) enrolled. Conversely, the age group of 18 to 19 year olds has the lowest likelihood of being enrolled in a private school, with 628 (100.0% in the age bracket) attending a public institution.
| Age Bracket | Public School | Private School |
| 3 to 4 Year Olds | 293 (83.7%) | 57 (16.3%) |
| 5 to 9 Year Old | 1,488 (96.8%) | 50 (3.3%) |
| 10 to 14 Year Olds | 1,216 (86.9%) | 183 (13.1%) |
| 15 to 17 Year Olds | 622 (87.6%) | 88 (12.4%) |
| 18 to 19 Year Olds | 628 (100.0%) | 0 (0.0%) |
| 20 to 24 Year Olds | 440 (89.8%) | 50 (10.2%) |
| 25 to 34 Year Olds | 177 (78.0%) | 50 (22.0%) |
| 35 Years and over | 167 (93.3%) | 12 (6.7%) |
| Total | 5,030 (91.1%) | 491 (8.9%) |
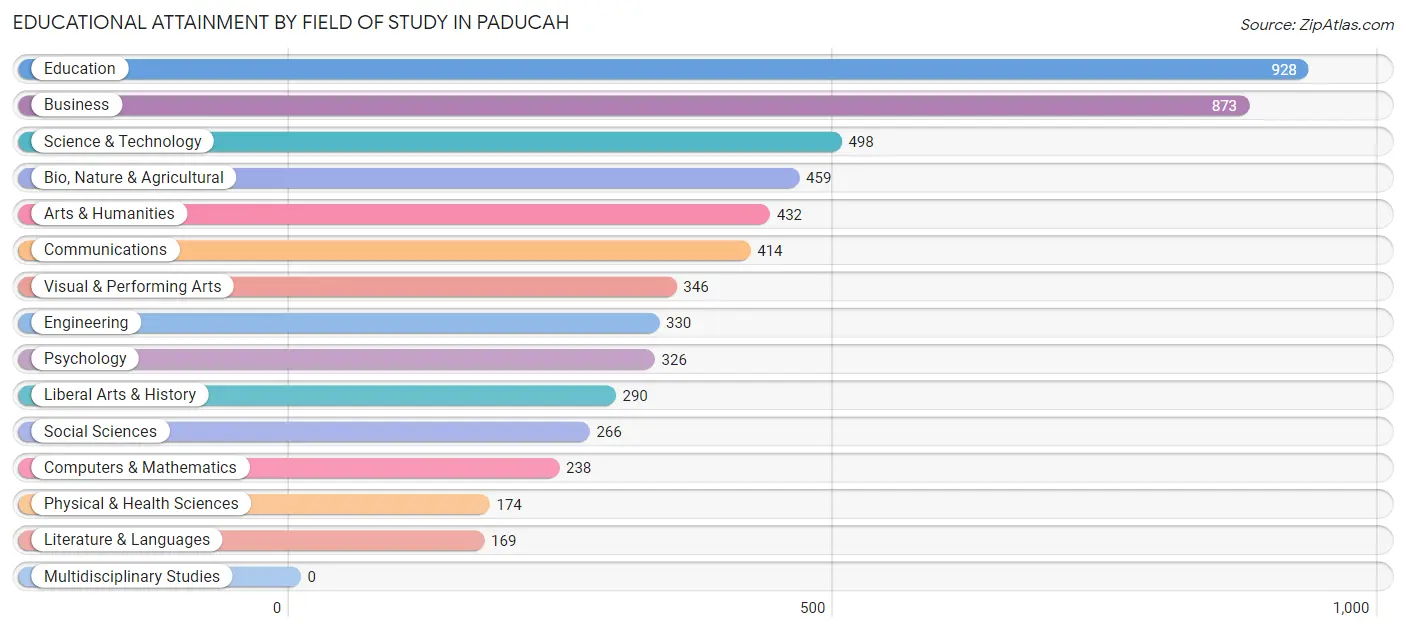
Educational Attainment by Field of Study in Paducah
Education (928 | 16.2%), business (873 | 15.2%), science & technology (498 | 8.7%), bio, nature & agricultural (459 | 8.0%), and arts & humanities (432 | 7.5%) are the most common fields of study among 5,743 individuals in Paducah who have obtained a bachelor's degree or higher.
| Field of Study | # Graduates | % Graduates |
| Computers & Mathematics | 238 | 4.1% |
| Bio, Nature & Agricultural | 459 | 8.0% |
| Physical & Health Sciences | 174 | 3.0% |
| Psychology | 326 | 5.7% |
| Social Sciences | 266 | 4.6% |
| Engineering | 330 | 5.8% |
| Multidisciplinary Studies | 0 | 0.0% |
| Science & Technology | 498 | 8.7% |
| Business | 873 | 15.2% |
| Education | 928 | 16.2% |
| Literature & Languages | 169 | 2.9% |
| Liberal Arts & History | 290 | 5.1% |
| Visual & Performing Arts | 346 | 6.0% |
| Communications | 414 | 7.2% |
| Arts & Humanities | 432 | 7.5% |
| Total | 5,743 | 100.0% |
Transportation & Commute in Paducah
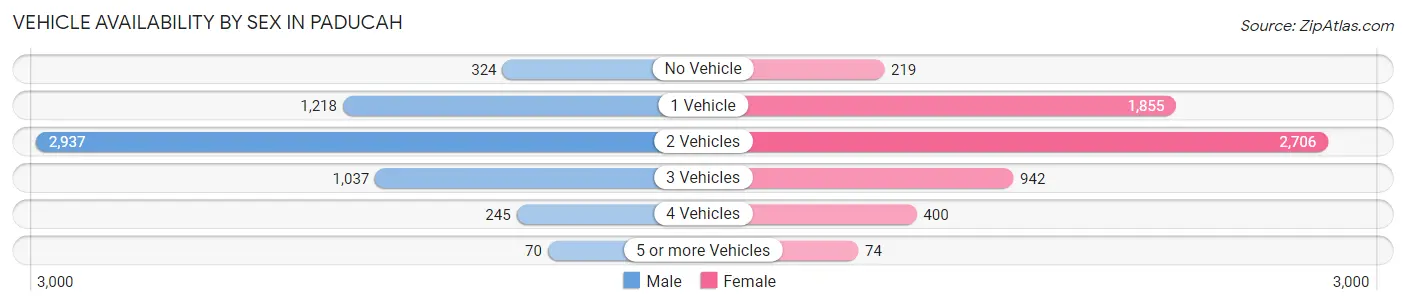
Vehicle Availability by Sex in Paducah
The most prevalent vehicle ownership categories in Paducah are males with 2 vehicles (2,937, accounting for 50.4%) and females with 2 vehicles (2,706, making up 47.4%).
| Vehicles Available | Male | Female |
| No Vehicle | 324 (5.6%) | 219 (3.5%) |
| 1 Vehicle | 1,218 (20.9%) | 1,855 (29.9%) |
| 2 Vehicles | 2,937 (50.4%) | 2,706 (43.7%) |
| 3 Vehicles | 1,037 (17.8%) | 942 (15.2%) |
| 4 Vehicles | 245 (4.2%) | 400 (6.5%) |
| 5 or more Vehicles | 70 (1.2%) | 74 (1.2%) |
| Total | 5,831 (100.0%) | 6,196 (100.0%) |
Commute Time in Paducah
The most frequently occuring commute durations in Paducah are 10 to 14 minutes (3,978 commuters, 35.1%), 5 to 9 minutes (2,386 commuters, 21.0%), and 15 to 19 minutes (1,946 commuters, 17.2%).
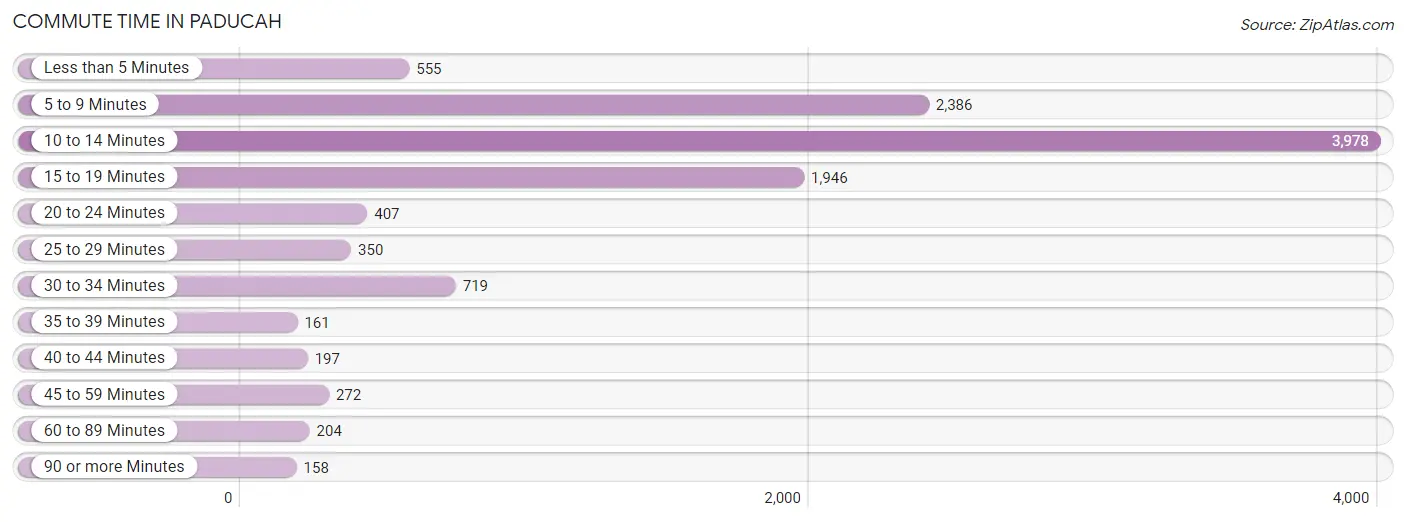
| Commute Time | # Commuters | % Commuters |
| Less than 5 Minutes | 555 | 4.9% |
| 5 to 9 Minutes | 2,386 | 21.0% |
| 10 to 14 Minutes | 3,978 | 35.1% |
| 15 to 19 Minutes | 1,946 | 17.2% |
| 20 to 24 Minutes | 407 | 3.6% |
| 25 to 29 Minutes | 350 | 3.1% |
| 30 to 34 Minutes | 719 | 6.3% |
| 35 to 39 Minutes | 161 | 1.4% |
| 40 to 44 Minutes | 197 | 1.7% |
| 45 to 59 Minutes | 272 | 2.4% |
| 60 to 89 Minutes | 204 | 1.8% |
| 90 or more Minutes | 158 | 1.4% |
Commute Time by Sex in Paducah
The most common commute times in Paducah are 10 to 14 minutes (2,094 commuters, 37.8%) for males and 10 to 14 minutes (1,884 commuters, 32.6%) for females.
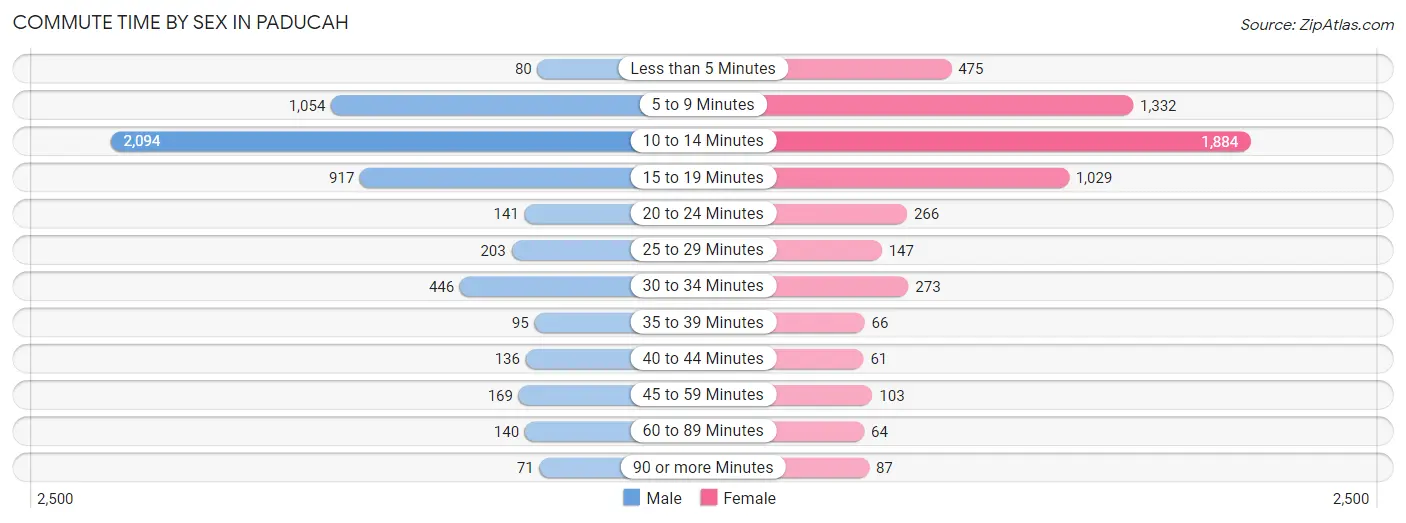
| Commute Time | Male | Female |
| Less than 5 Minutes | 80 (1.4%) | 475 (8.2%) |
| 5 to 9 Minutes | 1,054 (19.0%) | 1,332 (23.0%) |
| 10 to 14 Minutes | 2,094 (37.8%) | 1,884 (32.6%) |
| 15 to 19 Minutes | 917 (16.5%) | 1,029 (17.8%) |
| 20 to 24 Minutes | 141 (2.5%) | 266 (4.6%) |
| 25 to 29 Minutes | 203 (3.7%) | 147 (2.5%) |
| 30 to 34 Minutes | 446 (8.0%) | 273 (4.7%) |
| 35 to 39 Minutes | 95 (1.7%) | 66 (1.1%) |
| 40 to 44 Minutes | 136 (2.5%) | 61 (1.1%) |
| 45 to 59 Minutes | 169 (3.0%) | 103 (1.8%) |
| 60 to 89 Minutes | 140 (2.5%) | 64 (1.1%) |
| 90 or more Minutes | 71 (1.3%) | 87 (1.5%) |
Time of Departure to Work by Sex in Paducah
The most frequent times of departure to work in Paducah are 8:00 AM to 8:29 AM (1,025, 18.5%) for males and 7:00 AM to 7:29 AM (1,201, 20.7%) for females.
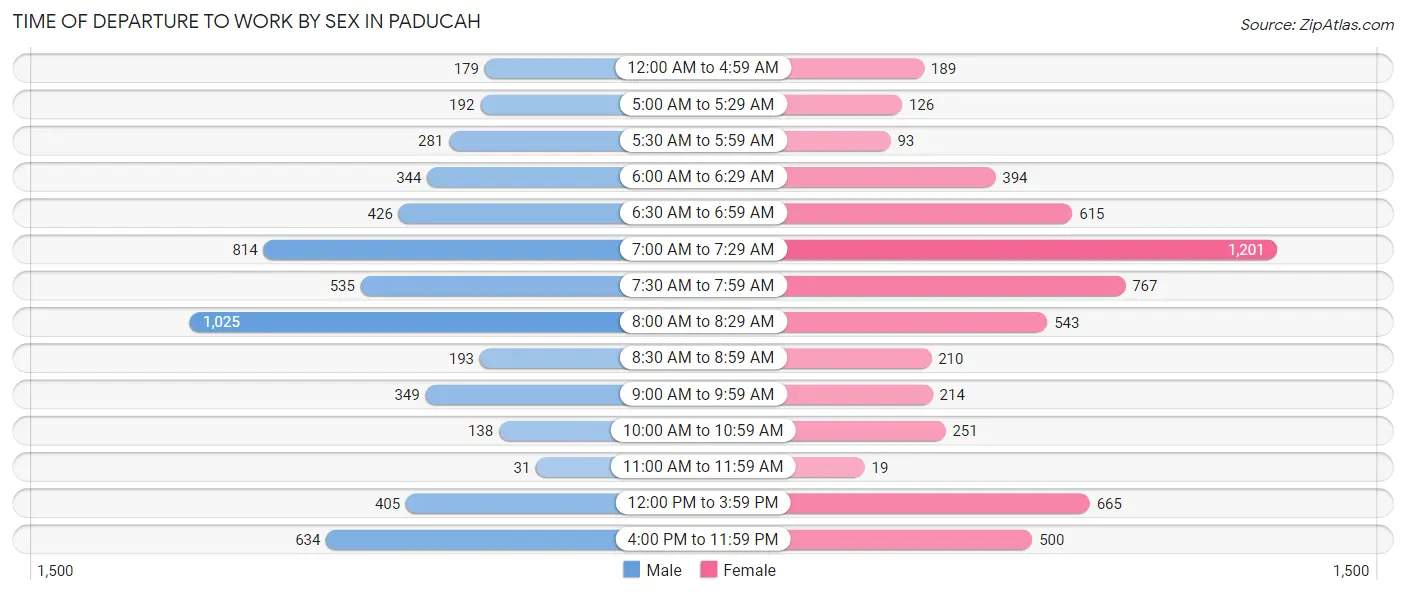
| Time of Departure | Male | Female |
| 12:00 AM to 4:59 AM | 179 (3.2%) | 189 (3.3%) |
| 5:00 AM to 5:29 AM | 192 (3.5%) | 126 (2.2%) |
| 5:30 AM to 5:59 AM | 281 (5.1%) | 93 (1.6%) |
| 6:00 AM to 6:29 AM | 344 (6.2%) | 394 (6.8%) |
| 6:30 AM to 6:59 AM | 426 (7.7%) | 615 (10.6%) |
| 7:00 AM to 7:29 AM | 814 (14.7%) | 1,201 (20.7%) |
| 7:30 AM to 7:59 AM | 535 (9.7%) | 767 (13.3%) |
| 8:00 AM to 8:29 AM | 1,025 (18.5%) | 543 (9.4%) |
| 8:30 AM to 8:59 AM | 193 (3.5%) | 210 (3.6%) |
| 9:00 AM to 9:59 AM | 349 (6.3%) | 214 (3.7%) |
| 10:00 AM to 10:59 AM | 138 (2.5%) | 251 (4.3%) |
| 11:00 AM to 11:59 AM | 31 (0.6%) | 19 (0.3%) |
| 12:00 PM to 3:59 PM | 405 (7.3%) | 665 (11.5%) |
| 4:00 PM to 11:59 PM | 634 (11.4%) | 500 (8.6%) |
| Total | 5,546 (100.0%) | 5,787 (100.0%) |
Housing Occupancy in Paducah
Occupancy by Ownership in Paducah
Of the total 11,432 dwellings in Paducah, owner-occupied units account for 6,142 (53.7%), while renter-occupied units make up 5,290 (46.3%).
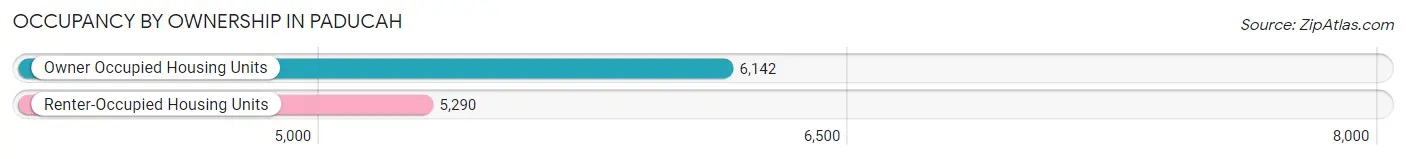
| Occupancy | # Housing Units | % Housing Units |
| Owner Occupied Housing Units | 6,142 | 53.7% |
| Renter-Occupied Housing Units | 5,290 | 46.3% |
| Total Occupied Housing Units | 11,432 | 100.0% |
Occupancy by Household Size in Paducah
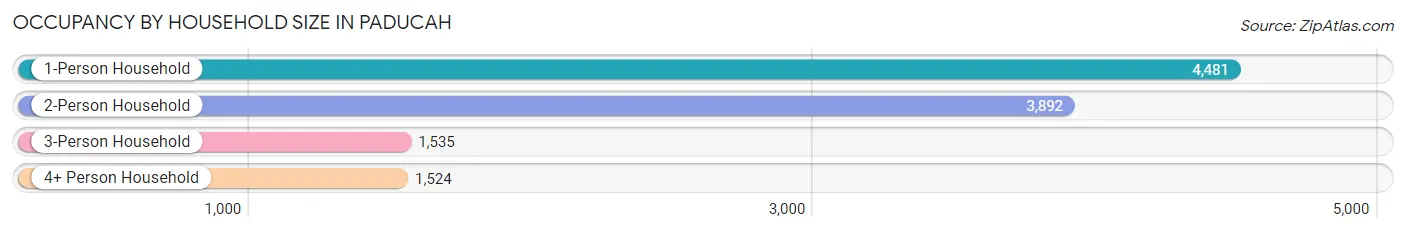
| Household Size | # Housing Units | % Housing Units |
| 1-Person Household | 4,481 | 39.2% |
| 2-Person Household | 3,892 | 34.0% |
| 3-Person Household | 1,535 | 13.4% |
| 4+ Person Household | 1,524 | 13.3% |
| Total Housing Units | 11,432 | 100.0% |
Occupancy by Ownership by Household Size in Paducah
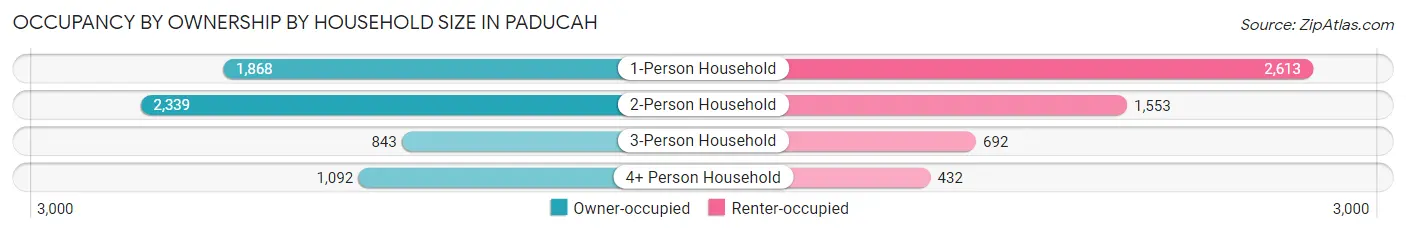
| Household Size | Owner-occupied | Renter-occupied |
| 1-Person Household | 1,868 (41.7%) | 2,613 (58.3%) |
| 2-Person Household | 2,339 (60.1%) | 1,553 (39.9%) |
| 3-Person Household | 843 (54.9%) | 692 (45.1%) |
| 4+ Person Household | 1,092 (71.7%) | 432 (28.3%) |
| Total Housing Units | 6,142 (53.7%) | 5,290 (46.3%) |
Occupancy by Educational Attainment in Paducah
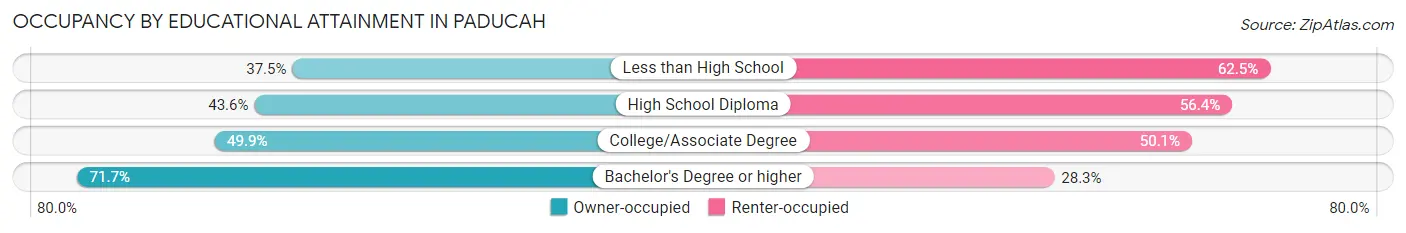
| Household Size | Owner-occupied | Renter-occupied |
| Less than High School | 318 (37.5%) | 529 (62.5%) |
| High School Diploma | 1,458 (43.6%) | 1,888 (56.4%) |
| College/Associate Degree | 1,894 (49.9%) | 1,899 (50.1%) |
| Bachelor's Degree or higher | 2,472 (71.7%) | 974 (28.3%) |
Occupancy by Age of Householder in Paducah
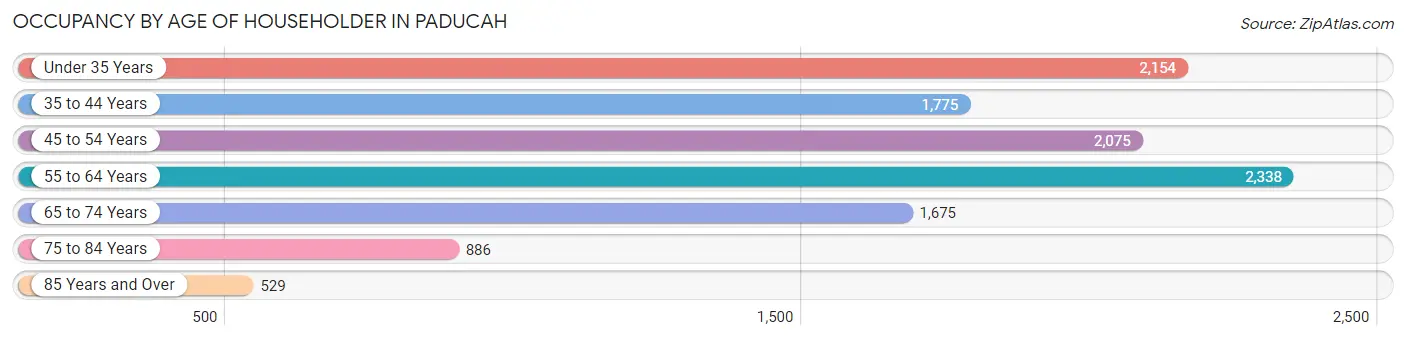
| Age Bracket | # Households | % Households |
| Under 35 Years | 2,154 | 18.8% |
| 35 to 44 Years | 1,775 | 15.5% |
| 45 to 54 Years | 2,075 | 18.1% |
| 55 to 64 Years | 2,338 | 20.4% |
| 65 to 74 Years | 1,675 | 14.6% |
| 75 to 84 Years | 886 | 7.7% |
| 85 Years and Over | 529 | 4.6% |
| Total | 11,432 | 100.0% |
Housing Finances in Paducah
Median Income by Occupancy in Paducah
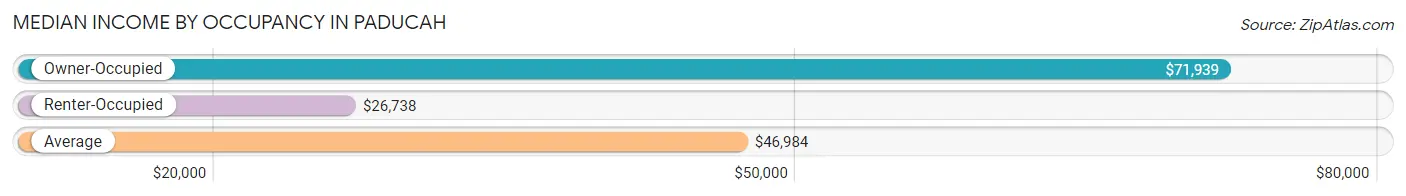
| Occupancy Type | # Households | Median Income |
| Owner-Occupied | 6,142 (53.7%) | $71,939 |
| Renter-Occupied | 5,290 (46.3%) | $26,738 |
| Average | 11,432 (100.0%) | $46,984 |
Occupancy by Householder Income Bracket in Paducah
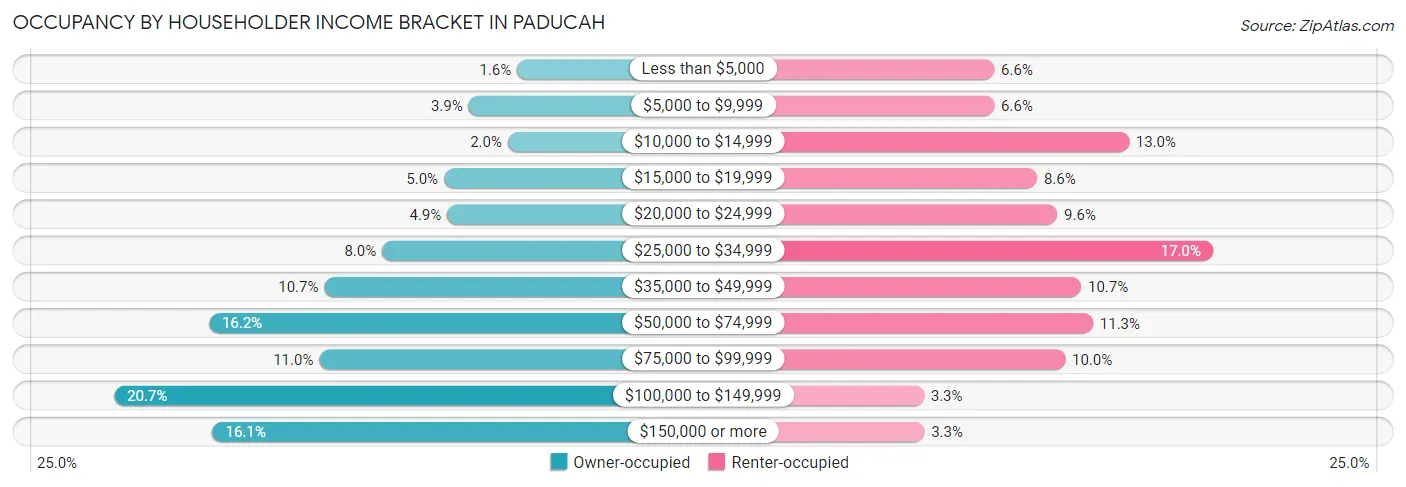
| Income Bracket | Owner-occupied | Renter-occupied |
| Less than $5,000 | 95 (1.5%) | 349 (6.6%) |
| $5,000 to $9,999 | 237 (3.9%) | 349 (6.6%) |
| $10,000 to $14,999 | 122 (2.0%) | 688 (13.0%) |
| $15,000 to $19,999 | 309 (5.0%) | 457 (8.6%) |
| $20,000 to $24,999 | 300 (4.9%) | 508 (9.6%) |
| $25,000 to $34,999 | 490 (8.0%) | 900 (17.0%) |
| $35,000 to $49,999 | 659 (10.7%) | 568 (10.7%) |
| $50,000 to $74,999 | 996 (16.2%) | 598 (11.3%) |
| $75,000 to $99,999 | 674 (11.0%) | 528 (10.0%) |
| $100,000 to $149,999 | 1,274 (20.7%) | 172 (3.3%) |
| $150,000 or more | 986 (16.1%) | 173 (3.3%) |
| Total | 6,142 (100.0%) | 5,290 (100.0%) |
Monthly Housing Cost Tiers in Paducah
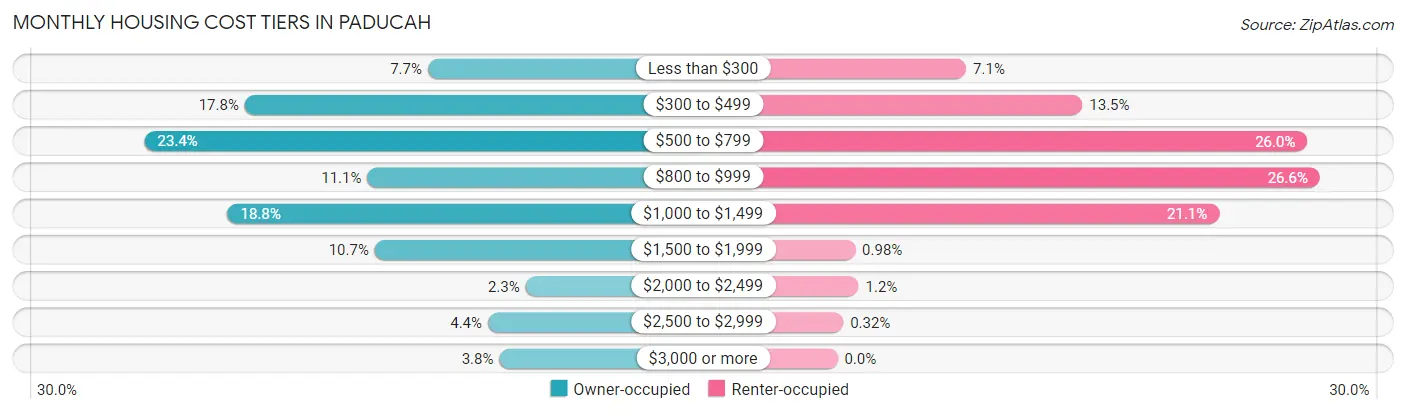
| Monthly Cost | Owner-occupied | Renter-occupied |
| Less than $300 | 475 (7.7%) | 376 (7.1%) |
| $300 to $499 | 1,096 (17.8%) | 716 (13.5%) |
| $500 to $799 | 1,436 (23.4%) | 1,373 (26.0%) |
| $800 to $999 | 680 (11.1%) | 1,409 (26.6%) |
| $1,000 to $1,499 | 1,154 (18.8%) | 1,115 (21.1%) |
| $1,500 to $1,999 | 655 (10.7%) | 52 (1.0%) |
| $2,000 to $2,499 | 143 (2.3%) | 62 (1.2%) |
| $2,500 to $2,999 | 271 (4.4%) | 17 (0.3%) |
| $3,000 or more | 232 (3.8%) | 0 (0.0%) |
| Total | 6,142 (100.0%) | 5,290 (100.0%) |
Physical Housing Characteristics in Paducah
Housing Structures in Paducah
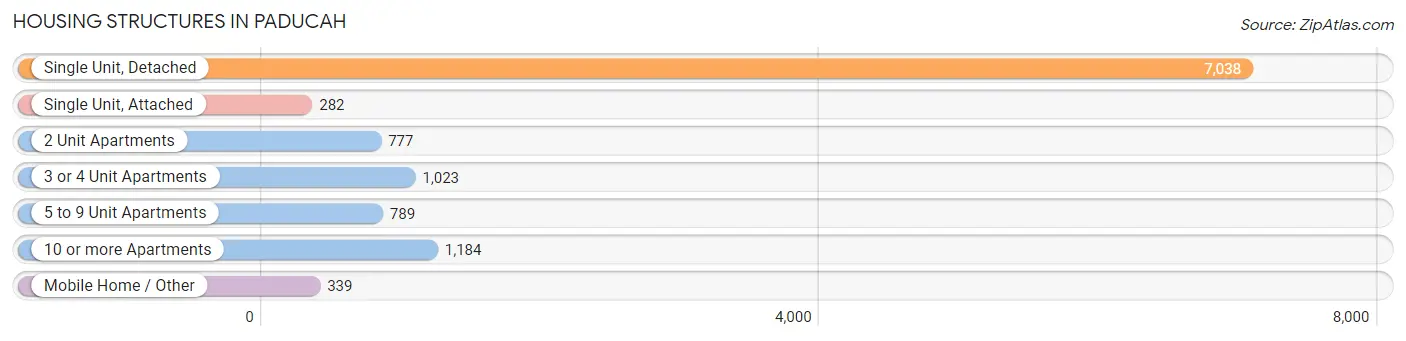
| Structure Type | # Housing Units | % Housing Units |
| Single Unit, Detached | 7,038 | 61.6% |
| Single Unit, Attached | 282 | 2.5% |
| 2 Unit Apartments | 777 | 6.8% |
| 3 or 4 Unit Apartments | 1,023 | 8.9% |
| 5 to 9 Unit Apartments | 789 | 6.9% |
| 10 or more Apartments | 1,184 | 10.4% |
| Mobile Home / Other | 339 | 3.0% |
| Total | 11,432 | 100.0% |
Housing Structures by Occupancy in Paducah
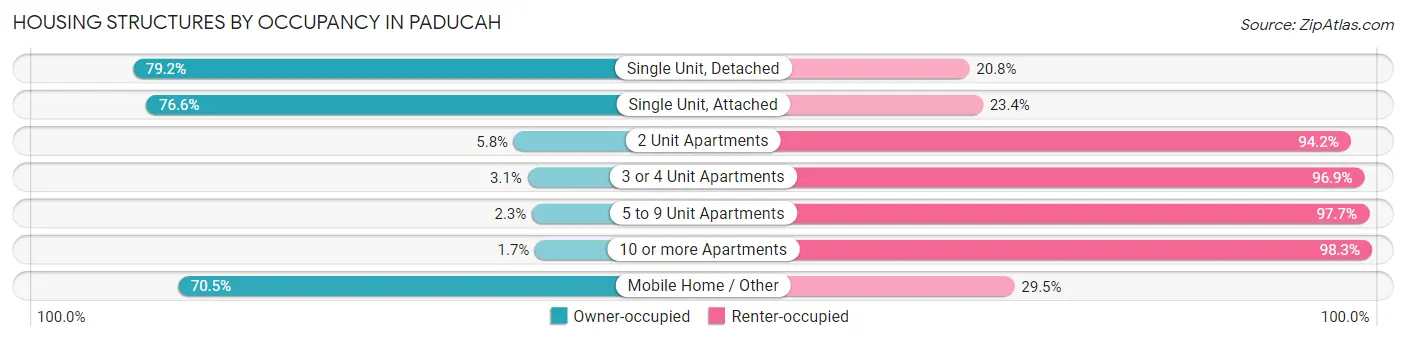
| Structure Type | Owner-occupied | Renter-occupied |
| Single Unit, Detached | 5,572 (79.2%) | 1,466 (20.8%) |
| Single Unit, Attached | 216 (76.6%) | 66 (23.4%) |
| 2 Unit Apartments | 45 (5.8%) | 732 (94.2%) |
| 3 or 4 Unit Apartments | 32 (3.1%) | 991 (96.9%) |
| 5 to 9 Unit Apartments | 18 (2.3%) | 771 (97.7%) |
| 10 or more Apartments | 20 (1.7%) | 1,164 (98.3%) |
| Mobile Home / Other | 239 (70.5%) | 100 (29.5%) |
| Total | 6,142 (53.7%) | 5,290 (46.3%) |
Housing Structures by Number of Rooms in Paducah
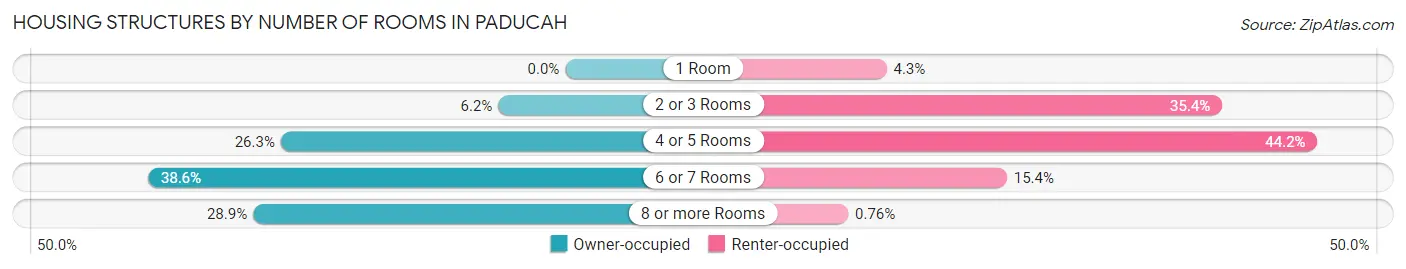
| Number of Rooms | Owner-occupied | Renter-occupied |
| 1 Room | 0 (0.0%) | 228 (4.3%) |
| 2 or 3 Rooms | 381 (6.2%) | 1,870 (35.3%) |
| 4 or 5 Rooms | 1,616 (26.3%) | 2,336 (44.2%) |
| 6 or 7 Rooms | 2,371 (38.6%) | 816 (15.4%) |
| 8 or more Rooms | 1,774 (28.9%) | 40 (0.8%) |
| Total | 6,142 (100.0%) | 5,290 (100.0%) |
Housing Structure by Heating Type in Paducah
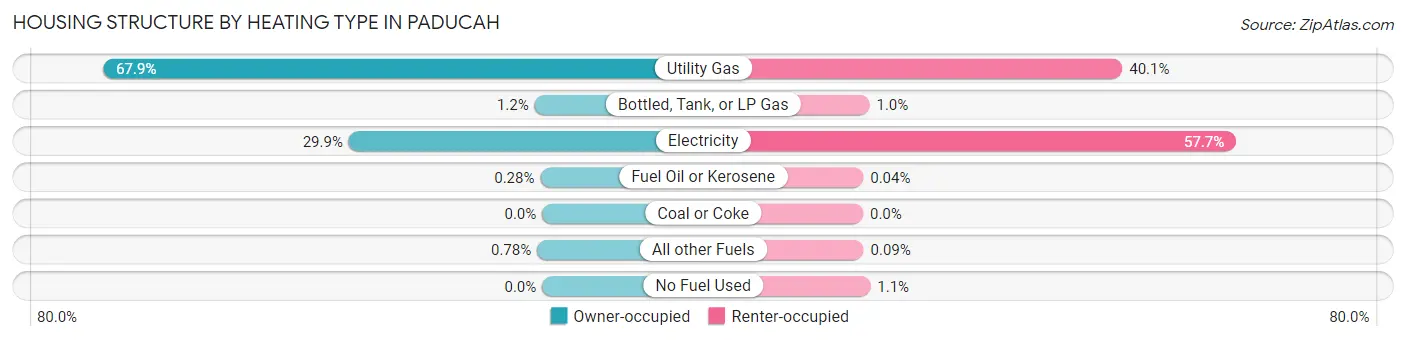
| Heating Type | Owner-occupied | Renter-occupied |
| Utility Gas | 4,169 (67.9%) | 2,120 (40.1%) |
| Bottled, Tank, or LP Gas | 72 (1.2%) | 53 (1.0%) |
| Electricity | 1,836 (29.9%) | 3,050 (57.7%) |
| Fuel Oil or Kerosene | 17 (0.3%) | 2 (0.0%) |
| Coal or Coke | 0 (0.0%) | 0 (0.0%) |
| All other Fuels | 48 (0.8%) | 5 (0.1%) |
| No Fuel Used | 0 (0.0%) | 60 (1.1%) |
| Total | 6,142 (100.0%) | 5,290 (100.0%) |
Household Vehicle Usage in Paducah
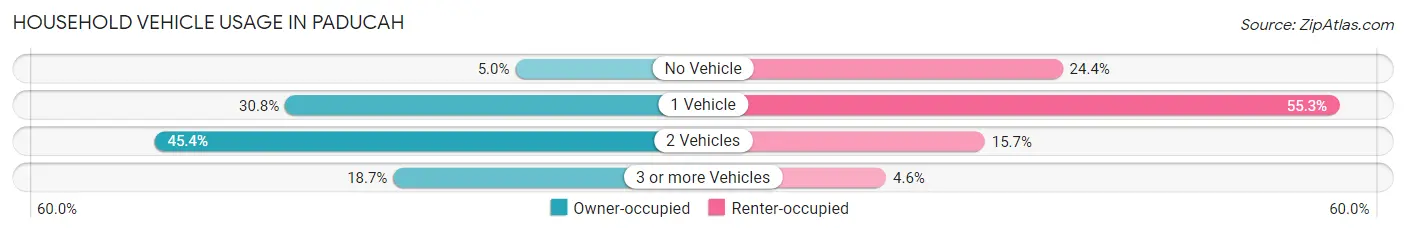
| Vehicles per Household | Owner-occupied | Renter-occupied |
| No Vehicle | 309 (5.0%) | 1,290 (24.4%) |
| 1 Vehicle | 1,893 (30.8%) | 2,927 (55.3%) |
| 2 Vehicles | 2,791 (45.4%) | 829 (15.7%) |
| 3 or more Vehicles | 1,149 (18.7%) | 244 (4.6%) |
| Total | 6,142 (100.0%) | 5,290 (100.0%) |
Real Estate & Mortgages in Paducah
Real Estate and Mortgage Overview in Paducah
| Characteristic | Without Mortgage | With Mortgage |
| Housing Units | 2,604 | 3,538 |
| Median Property Value | $131,000 | $165,900 |
| Median Household Income | $54,333 | $515 |
| Monthly Housing Costs | $467 | $203 |
| Real Estate Taxes | $967 | $81 |
Property Value by Mortgage Status in Paducah
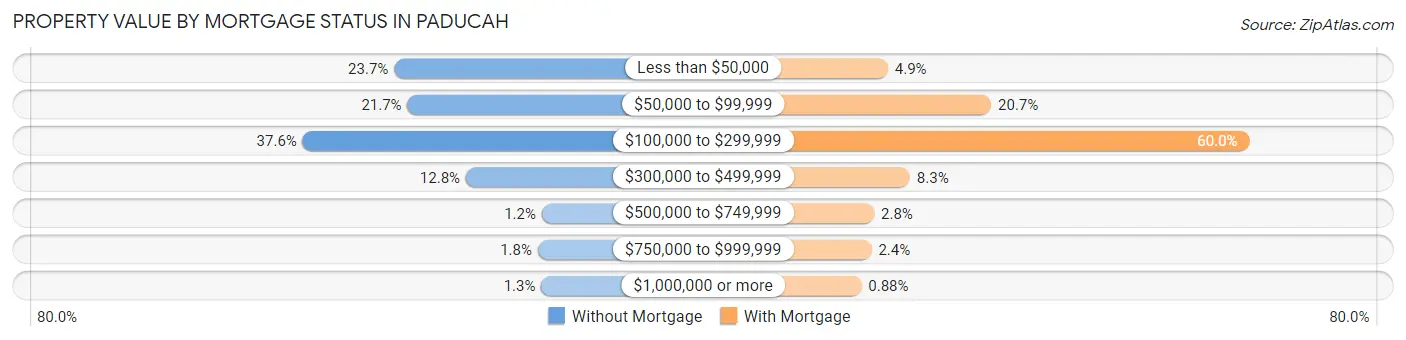
| Property Value | Without Mortgage | With Mortgage |
| Less than $50,000 | 617 (23.7%) | 174 (4.9%) |
| $50,000 to $99,999 | 564 (21.7%) | 731 (20.7%) |
| $100,000 to $299,999 | 980 (37.6%) | 2,123 (60.0%) |
| $300,000 to $499,999 | 332 (12.8%) | 293 (8.3%) |
| $500,000 to $749,999 | 31 (1.2%) | 100 (2.8%) |
| $750,000 to $999,999 | 47 (1.8%) | 86 (2.4%) |
| $1,000,000 or more | 33 (1.3%) | 31 (0.9%) |
| Total | 2,604 (100.0%) | 3,538 (100.0%) |
Household Income by Mortgage Status in Paducah
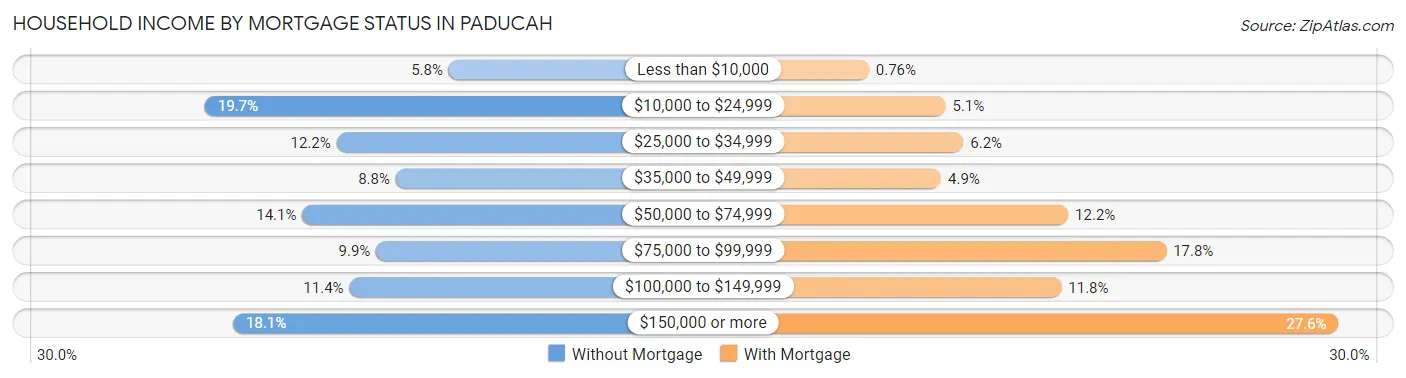
| Household Income | Without Mortgage | With Mortgage |
| Less than $10,000 | 150 (5.8%) | 27 (0.8%) |
| $10,000 to $24,999 | 513 (19.7%) | 182 (5.1%) |
| $25,000 to $34,999 | 317 (12.2%) | 218 (6.2%) |
| $35,000 to $49,999 | 229 (8.8%) | 173 (4.9%) |
| $50,000 to $74,999 | 368 (14.1%) | 430 (12.1%) |
| $75,000 to $99,999 | 258 (9.9%) | 628 (17.7%) |
| $100,000 to $149,999 | 298 (11.4%) | 416 (11.8%) |
| $150,000 or more | 471 (18.1%) | 976 (27.6%) |
| Total | 2,604 (100.0%) | 3,538 (100.0%) |
Property Value to Household Income Ratio in Paducah
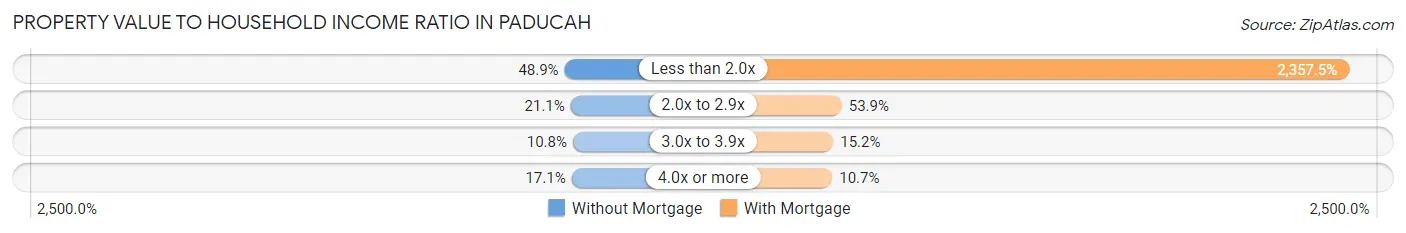
| Value-to-Income Ratio | Without Mortgage | With Mortgage |
| Less than 2.0x | 1,274 (48.9%) | 83,409 (2,357.5%) |
| 2.0x to 2.9x | 549 (21.1%) | 1,906 (53.9%) |
| 3.0x to 3.9x | 282 (10.8%) | 537 (15.2%) |
| 4.0x or more | 445 (17.1%) | 377 (10.7%) |
| Total | 2,604 (100.0%) | 3,538 (100.0%) |
Real Estate Taxes by Mortgage Status in Paducah
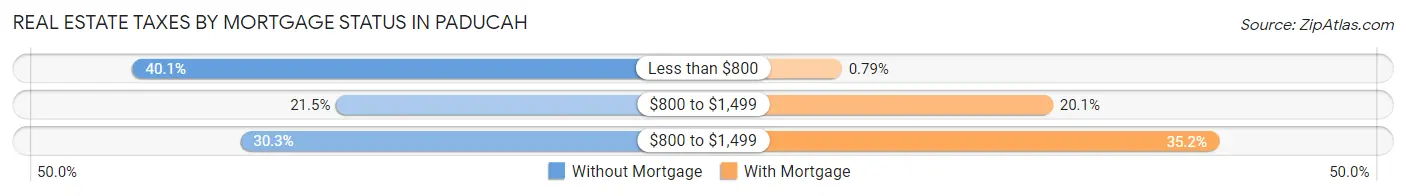
| Property Taxes | Without Mortgage | With Mortgage |
| Less than $800 | 1,045 (40.1%) | 28 (0.8%) |
| $800 to $1,499 | 561 (21.5%) | 710 (20.1%) |
| $800 to $1,499 | 789 (30.3%) | 1,246 (35.2%) |
| Total | 2,604 (100.0%) | 3,538 (100.0%) |
Health & Disability in Paducah
Health Insurance Coverage by Age in Paducah
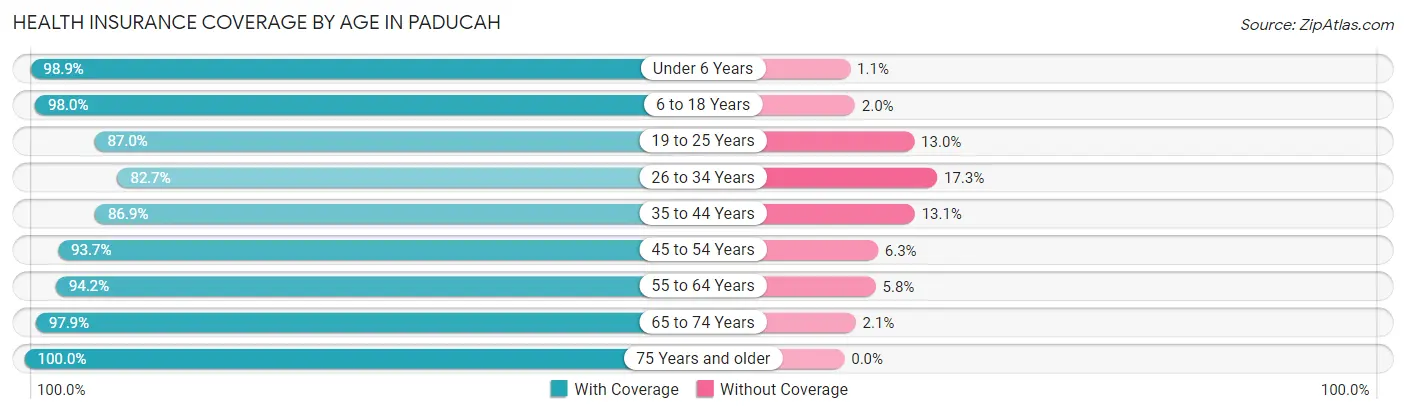
| Age Bracket | With Coverage | Without Coverage |
| Under 6 Years | 1,730 (98.9%) | 19 (1.1%) |
| 6 to 18 Years | 4,001 (98.0%) | 80 (2.0%) |
| 19 to 25 Years | 1,676 (87.0%) | 251 (13.0%) |
| 26 to 34 Years | 2,363 (82.7%) | 494 (17.3%) |
| 35 to 44 Years | 3,029 (86.9%) | 458 (13.1%) |
| 45 to 54 Years | 3,356 (93.7%) | 224 (6.3%) |
| 55 to 64 Years | 3,451 (94.2%) | 214 (5.8%) |
| 65 to 74 Years | 2,548 (97.9%) | 55 (2.1%) |
| 75 Years and older | 1,860 (100.0%) | 0 (0.0%) |
| Total | 24,014 (93.0%) | 1,795 (7.0%) |
Health Insurance Coverage by Citizenship Status in Paducah
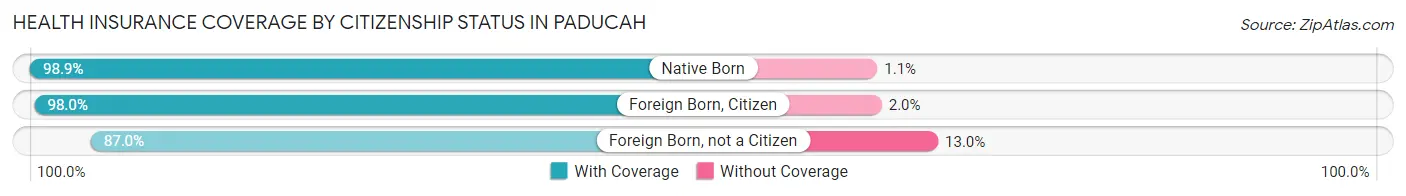
| Citizenship Status | With Coverage | Without Coverage |
| Native Born | 1,730 (98.9%) | 19 (1.1%) |
| Foreign Born, Citizen | 4,001 (98.0%) | 80 (2.0%) |
| Foreign Born, not a Citizen | 1,676 (87.0%) | 251 (13.0%) |
Health Insurance Coverage by Household Income in Paducah
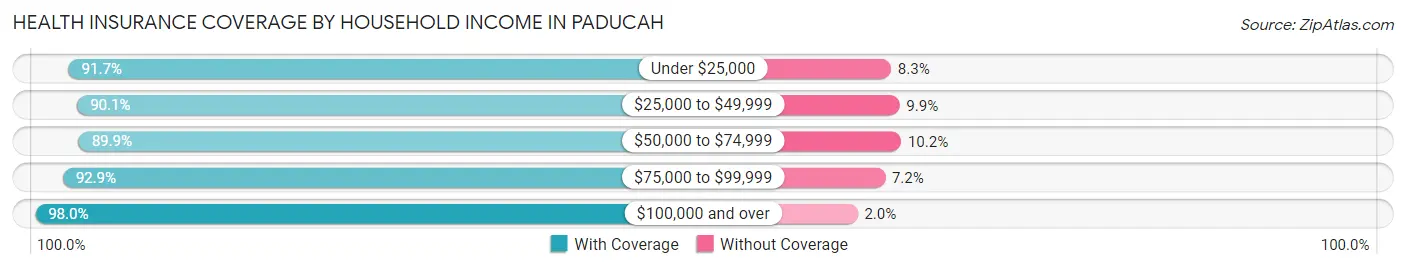
| Household Income | With Coverage | Without Coverage |
| Under $25,000 | 5,374 (91.7%) | 484 (8.3%) |
| $25,000 to $49,999 | 4,990 (90.1%) | 546 (9.9%) |
| $50,000 to $74,999 | 3,153 (89.8%) | 356 (10.2%) |
| $75,000 to $99,999 | 3,131 (92.8%) | 241 (7.1%) |
| $100,000 and over | 7,351 (98.0%) | 150 (2.0%) |
Public vs Private Health Insurance Coverage by Age in Paducah
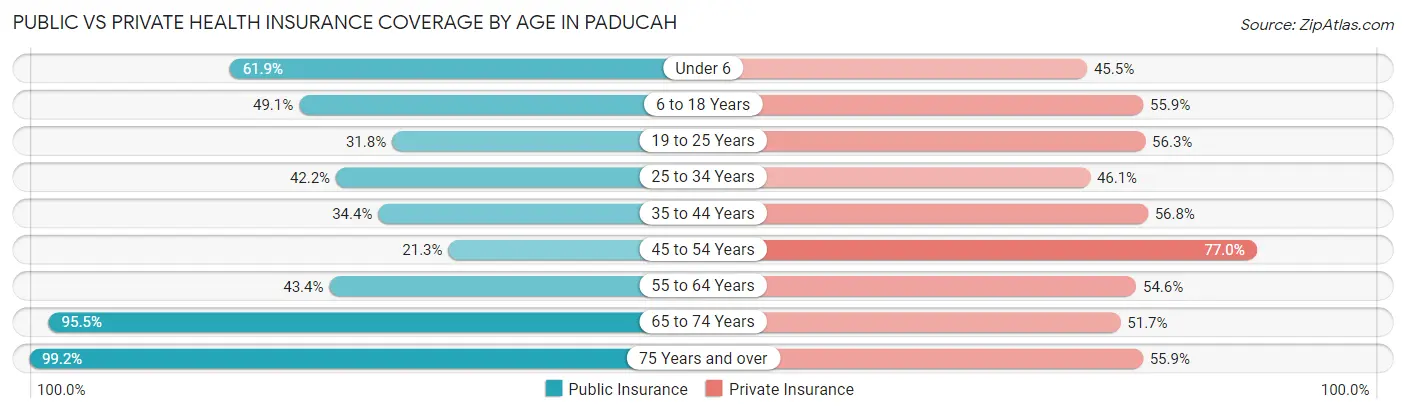
| Age Bracket | Public Insurance | Private Insurance |
| Under 6 | 1,083 (61.9%) | 796 (45.5%) |
| 6 to 18 Years | 2,002 (49.1%) | 2,282 (55.9%) |
| 19 to 25 Years | 613 (31.8%) | 1,085 (56.3%) |
| 25 to 34 Years | 1,206 (42.2%) | 1,316 (46.1%) |
| 35 to 44 Years | 1,198 (34.4%) | 1,980 (56.8%) |
| 45 to 54 Years | 764 (21.3%) | 2,756 (77.0%) |
| 55 to 64 Years | 1,592 (43.4%) | 2,002 (54.6%) |
| 65 to 74 Years | 2,487 (95.5%) | 1,346 (51.7%) |
| 75 Years and over | 1,845 (99.2%) | 1,039 (55.9%) |
| Total | 12,790 (49.6%) | 14,602 (56.6%) |
Disability Status by Sex by Age in Paducah
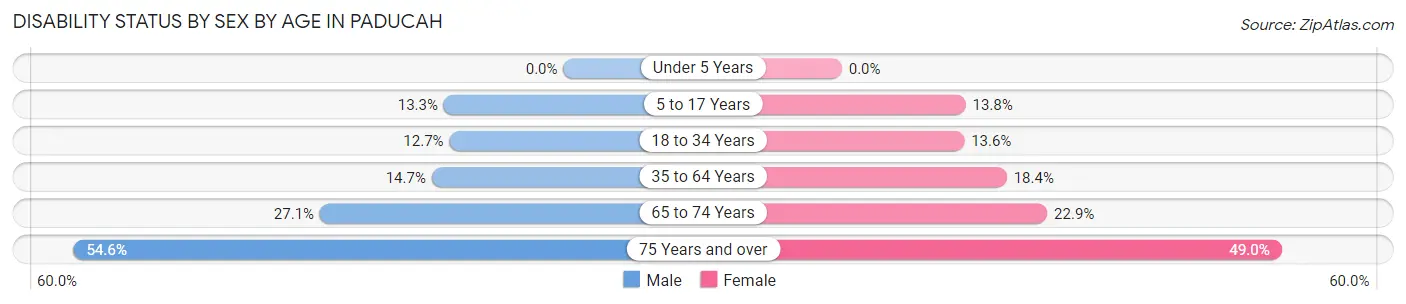
| Age Bracket | Male | Female |
| Under 5 Years | 0 (0.0%) | 0 (0.0%) |
| 5 to 17 Years | 225 (13.3%) | 305 (13.8%) |
| 18 to 34 Years | 343 (12.7%) | 342 (13.6%) |
| 35 to 64 Years | 746 (14.7%) | 1,037 (18.4%) |
| 65 to 74 Years | 299 (27.1%) | 343 (22.9%) |
| 75 Years and over | 354 (54.5%) | 593 (49.0%) |
Disability Class by Sex by Age in Paducah
Disability Class: Hearing Difficulty
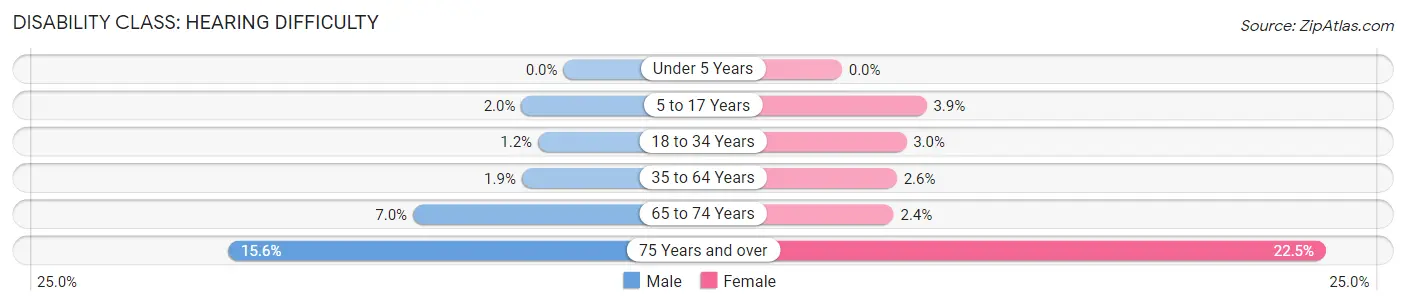
| Age Bracket | Male | Female |
| Under 5 Years | 0 (0.0%) | 0 (0.0%) |
| 5 to 17 Years | 33 (1.9%) | 87 (3.9%) |
| 18 to 34 Years | 32 (1.2%) | 75 (3.0%) |
| 35 to 64 Years | 98 (1.9%) | 144 (2.5%) |
| 65 to 74 Years | 77 (7.0%) | 36 (2.4%) |
| 75 Years and over | 101 (15.6%) | 272 (22.5%) |
Disability Class: Vision Difficulty
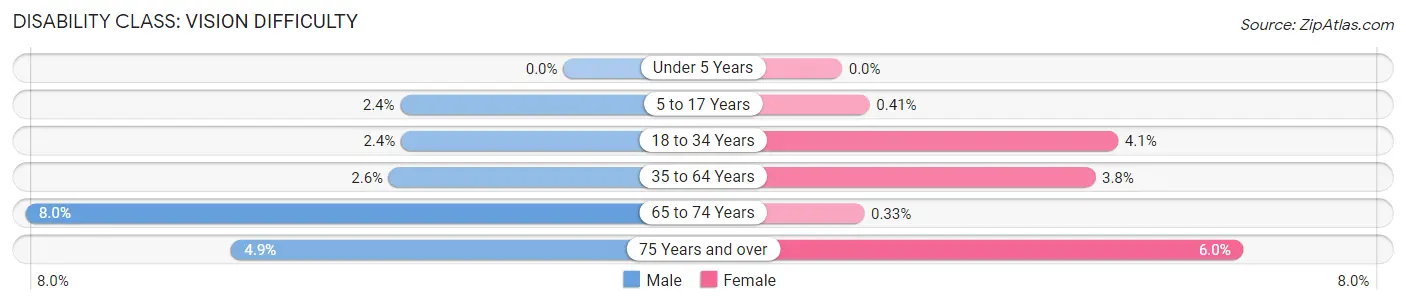
| Age Bracket | Male | Female |
| Under 5 Years | 0 (0.0%) | 0 (0.0%) |
| 5 to 17 Years | 41 (2.4%) | 9 (0.4%) |
| 18 to 34 Years | 65 (2.4%) | 103 (4.1%) |
| 35 to 64 Years | 132 (2.6%) | 212 (3.8%) |
| 65 to 74 Years | 88 (8.0%) | 5 (0.3%) |
| 75 Years and over | 32 (4.9%) | 72 (5.9%) |
Disability Class: Cognitive Difficulty
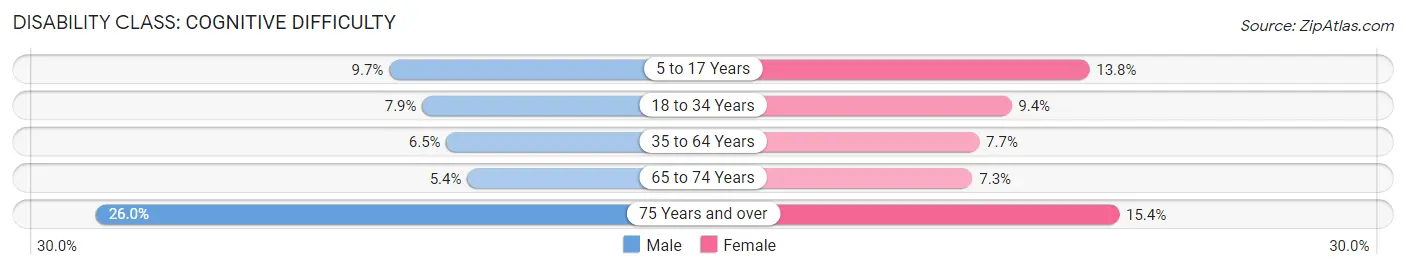
| Age Bracket | Male | Female |
| 5 to 17 Years | 164 (9.7%) | 305 (13.8%) |
| 18 to 34 Years | 212 (7.9%) | 237 (9.4%) |
| 35 to 64 Years | 331 (6.5%) | 432 (7.6%) |
| 65 to 74 Years | 59 (5.3%) | 109 (7.3%) |
| 75 Years and over | 169 (26.0%) | 187 (15.4%) |
Disability Class: Ambulatory Difficulty
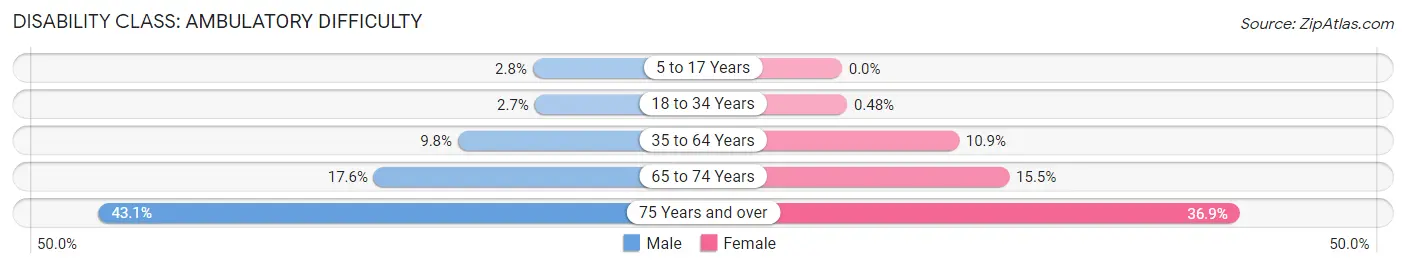
| Age Bracket | Male | Female |
| 5 to 17 Years | 48 (2.8%) | 0 (0.0%) |
| 18 to 34 Years | 72 (2.7%) | 12 (0.5%) |
| 35 to 64 Years | 498 (9.8%) | 613 (10.9%) |
| 65 to 74 Years | 194 (17.6%) | 233 (15.5%) |
| 75 Years and over | 280 (43.1%) | 447 (36.9%) |
Disability Class: Self-Care Difficulty
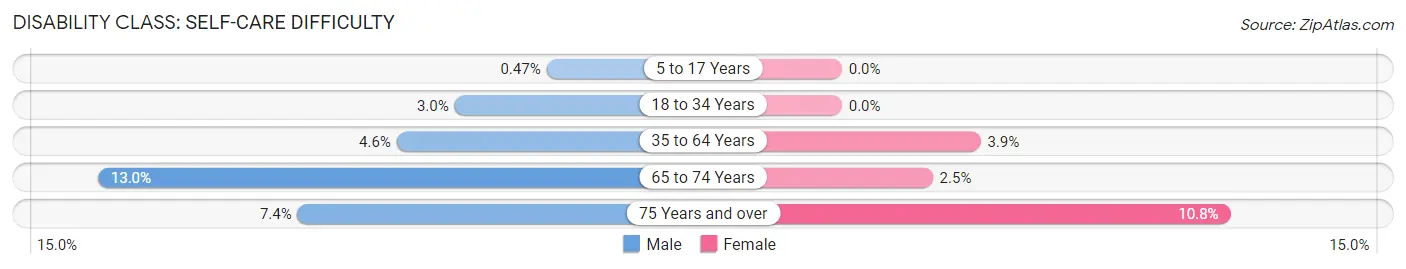
| Age Bracket | Male | Female |
| 5 to 17 Years | 8 (0.5%) | 0 (0.0%) |
| 18 to 34 Years | 82 (3.0%) | 0 (0.0%) |
| 35 to 64 Years | 236 (4.6%) | 218 (3.9%) |
| 65 to 74 Years | 143 (13.0%) | 38 (2.5%) |
| 75 Years and over | 48 (7.4%) | 131 (10.8%) |
Technology Access in Paducah
Computing Device Access in Paducah
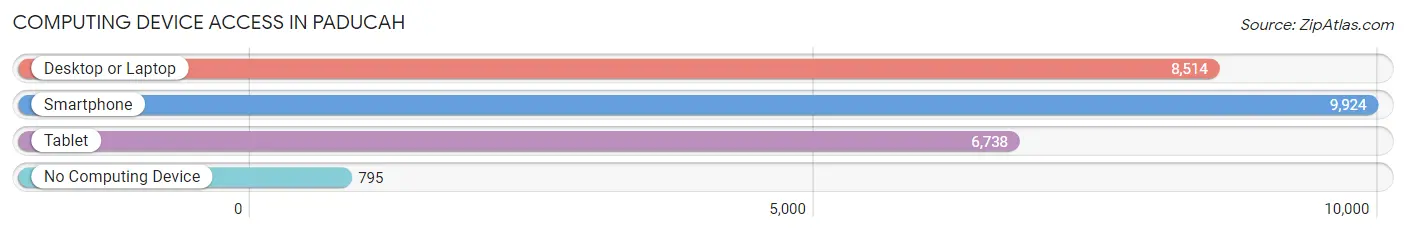
| Device Type | # Households | % Households |
| Desktop or Laptop | 8,514 | 74.5% |
| Smartphone | 9,924 | 86.8% |
| Tablet | 6,738 | 58.9% |
| No Computing Device | 795 | 7.0% |
| Total | 11,432 | 100.0% |
Internet Access in Paducah
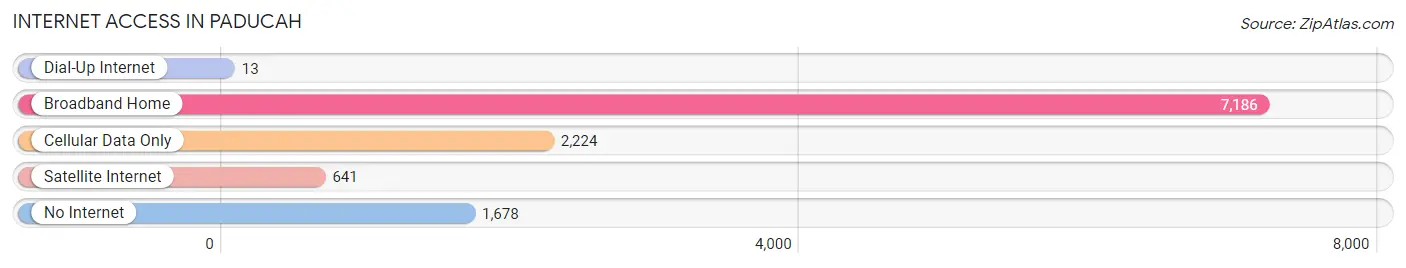
| Internet Type | # Households | % Households |
| Dial-Up Internet | 13 | 0.1% |
| Broadband Home | 7,186 | 62.9% |
| Cellular Data Only | 2,224 | 19.5% |
| Satellite Internet | 641 | 5.6% |
| No Internet | 1,678 | 14.7% |
| Total | 11,432 | 100.0% |
Paducah Summary
Paducah, Kentucky is a city located in the western part of the state, along the Ohio River. It is the county seat of McCracken County and is the fourth-largest city in the state. The city has a population of 24,941 as of the 2010 census, and is part of the Paducah Micropolitan Statistical Area.
History
Paducah was founded in 1827 by William Clark, who named the city after the local Native American tribe, the Padouca. The city was incorporated in 1838 and became a major port on the Ohio River. During the Civil War, Paducah was a major supply center for the Union Army. After the war, the city experienced a period of growth and prosperity, becoming a major center for the cotton and tobacco industries.
In the late 19th century, Paducah was a major center for the steamboat industry, with dozens of boats docking at the city’s wharves. The city was also a major hub for the railroad industry, with several lines running through the city.
In the early 20th century, Paducah experienced a period of decline, as the steamboat and railroad industries declined. The city was also hit hard by the Great Depression, with many businesses closing and unemployment rising.
Geography
Paducah is located in western Kentucky, along the Ohio River. The city is situated at the confluence of the Tennessee and Cumberland Rivers, and is located about 120 miles west of Louisville. The city has a total area of 16.2 square miles, of which 15.9 square miles is land and 0.3 square miles is water.
The city is located in a humid subtropical climate zone, with hot, humid summers and mild winters. The average annual temperature is 61.3°F, with an average high of 79.2°F in July and an average low of 43.2°F in January. The average annual precipitation is 45.2 inches, with an average of 4.3 inches of snowfall per year.
Economy
Paducah’s economy is largely based on manufacturing, with several major employers in the city. The largest employers in the city are the Paducah & Louisville Railway, the Paducah Power System, and the Paducah Gaseous Diffusion Plant. Other major employers include the Paducah Sun newspaper, the Paducah Bank & Trust, and the Paducah Public Schools.
The city is also home to several major tourist attractions, including the National Quilt Museum, the Paducah Riverwalk, and the Paducah Railroad Museum.
Demographics
As of the 2010 census, Paducah had a population of 24,941. The racial makeup of the city was 79.2% White, 17.3% African American, 0.4% Native American, 0.7% Asian, 0.1% Pacific Islander, 0.7% from other races, and 1.6% from two or more races. Hispanic or Latino of any race were 2.2% of the population.
The median income for a household in the city was $31,945, and the median income for a family was $41,945. The per capita income for the city was $19,945. About 17.3% of the population was below the poverty line.
Common Questions
What is Per Capita Income in Paducah?
Per Capita income in Paducah is $37,828.
What is the Median Family Income in Paducah?
Median Family Income in Paducah is $71,328.
What is the Median Household income in Paducah?
Median Household Income in Paducah is $46,984.
What is Income or Wage Gap in Paducah?
Income or Wage Gap in Paducah is 29.8%.
Women in Paducah earn 70.2 cents for every dollar earned by a man.
What is Family Income Deficit in Paducah?
Family Income Deficit in Paducah is $12,337.
Families that are below poverty line in Paducah earn $12,337 less on average than the poverty threshold level.
What is Inequality or Gini Index in Paducah?
Inequality or Gini Index in Paducah is 0.59.
What is the Total Population of Paducah?
Total Population of Paducah is 26,869.
What is the Total Male Population of Paducah?
Total Male Population of Paducah is 12,591.
What is the Total Female Population of Paducah?
Total Female Population of Paducah is 14,278.
What is the Ratio of Males per 100 Females in Paducah?
There are 88.18 Males per 100 Females in Paducah.
What is the Ratio of Females per 100 Males in Paducah?
There are 113.40 Females per 100 Males in Paducah.
What is the Median Population Age in Paducah?
Median Population Age in Paducah is 42.7 Years.
What is the Average Family Size in Paducah
Average Family Size in Paducah is 3.1 People.
What is the Average Household Size in Paducah
Average Household Size in Paducah is 2.3 People.
How Large is the Labor Force in Paducah?
There are 12,739 People in the Labor Forcein in Paducah.
What is the Percentage of People in the Labor Force in Paducah?
58.2% of People are in the Labor Force in Paducah.
What is the Unemployment Rate in Paducah?
Unemployment Rate in Paducah is 3.8%.