Area Code 502 Map & Demographics
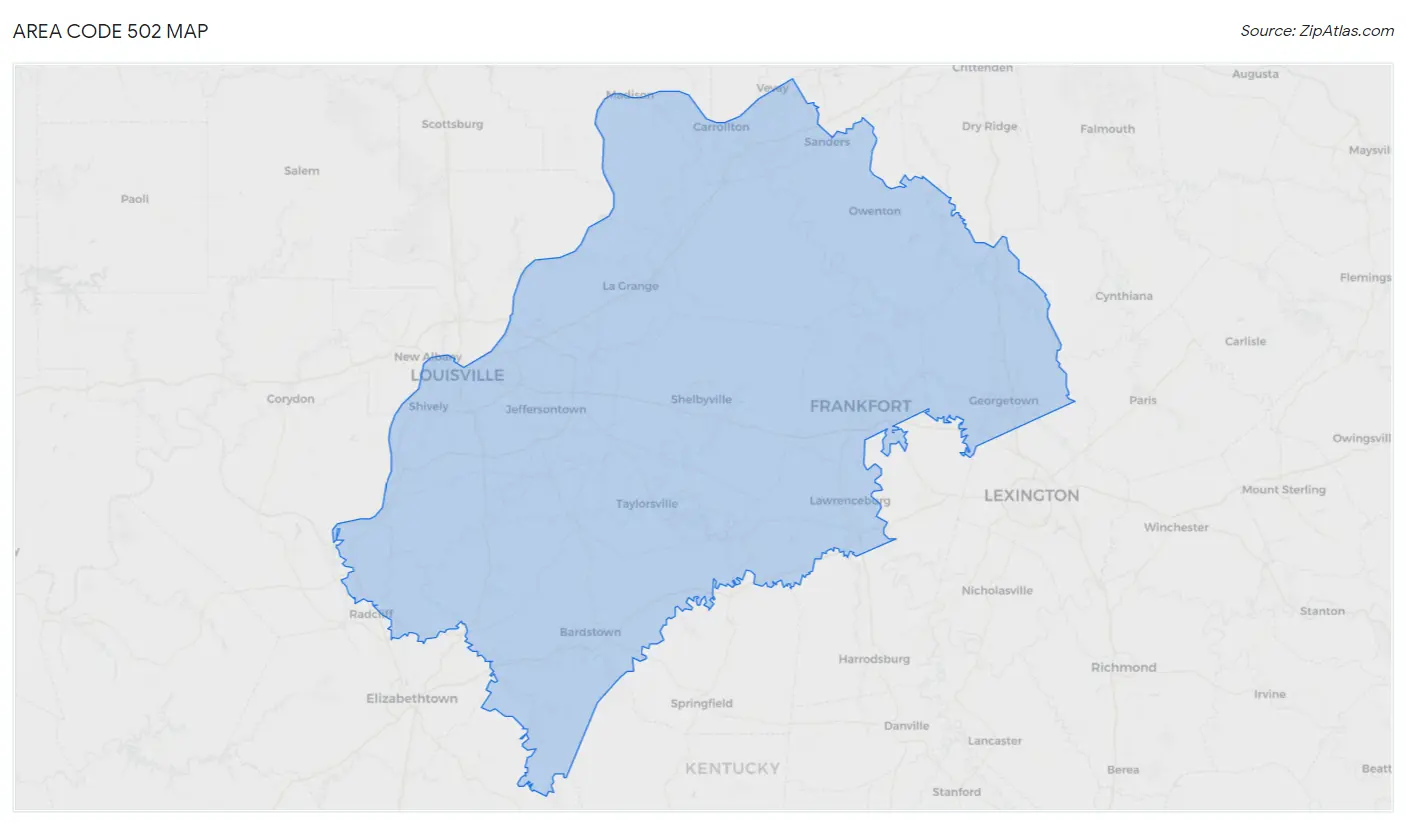
Area Code 502 Map
Area Code 502 Overview
$37,554
PER CAPITA INCOME
$88,414
AVG FAMILY INCOME
$72,151
AVG HOUSEHOLD INCOME
26.9%
WAGE / INCOME GAP [ % ]
73.1¢/ $1
WAGE / INCOME GAP [ $ ]
$11,547
FAMILY INCOME DEFICIT
37.58
INEQUALITY / GINI INDEX
1,283,189
TOTAL POPULATION
632,404
MALE POPULATION
650,785
FEMALE POPULATION
97.18
MALES / 100 FEMALES
102.91
FEMALES / 100 MALES
41.1
MEDIAN AGE
3.0
AVG FAMILY SIZE
2.5
AVG HOUSEHOLD SIZE
636,259
LABOR FORCE [ PEOPLE ]
61.9%
PERCENT IN LABOR FORCE
5.0%
UNEMPLOYMENT RATE
Income in Area Code 502
Income Overview in Area Code 502
Per Capita Income in Area Code 502 is $37,554, while median incomes of families and households are $88,414 and $72,151 respectively.
| Characteristic | Number | Measure |
| Per Capita Income | 1,283,189 | $37,554 |
| Median Family Income | 324,151 | $88,414 |
| Mean Family Income | 324,151 | $9,727,568 |
| Median Household Income | 515,911 | $72,151 |
| Mean Household Income | 515,911 | $8,306,920 |
| Income Deficit | 324,151 | $11,547 |
| Wage / Income Gap (%) | 1,283,189 | 26.92% |
| Wage / Income Gap ($) | 1,283,189 | 73.08¢ per $1 |
| Gini / Inequality Index | 1,283,189 | 37.58 |
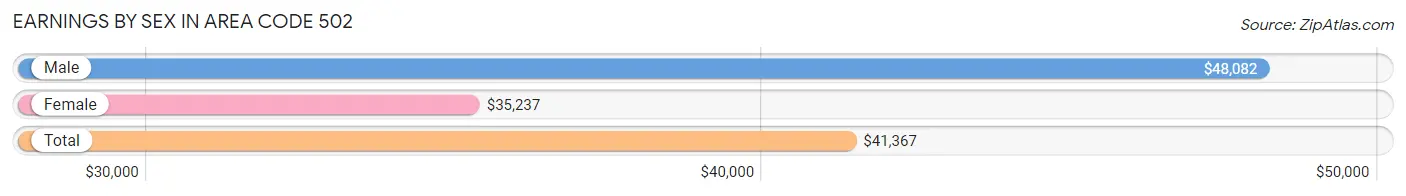
Earnings by Sex in Area Code 502
Average Earnings in Area Code 502 are $41,367, $48,082 for men and $35,237 for women, a difference of 26.7%.
| Sex | Number | Average Earnings |
| Male | 361,744 (51.8%) | $48,082 |
| Female | 336,897 (48.2%) | $35,237 |
| Total | 698,641 (100.0%) | $41,367 |
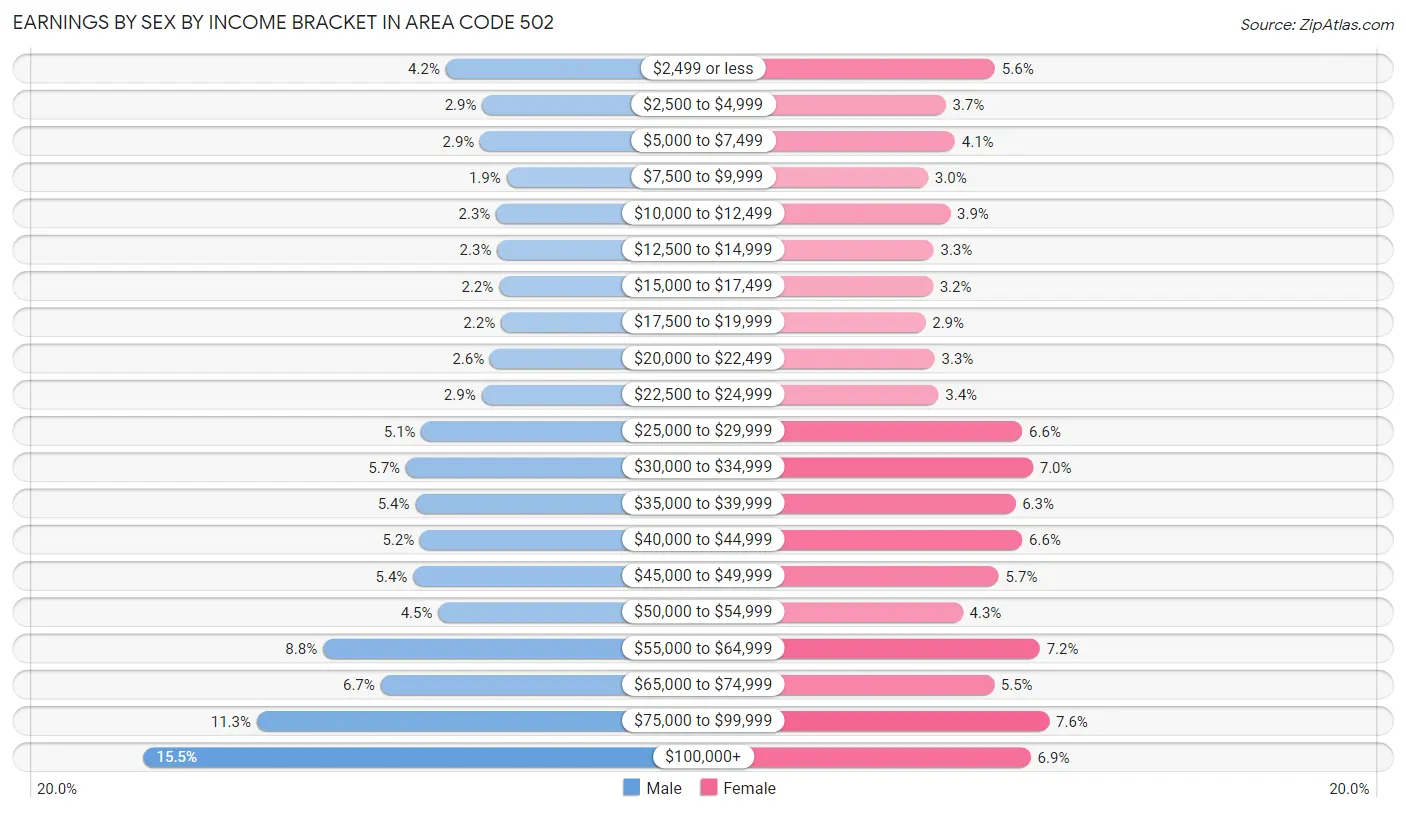
Earnings by Sex by Income Bracket in Area Code 502
The most common earnings brackets in Area Code 502 are $100,000+ for men (56,203 | 15.5%) and $75,000 to $99,999 for women (25,526 | 7.6%).
| Income | Male | Female |
| $2,499 or less | 15,251 (4.2%) | 18,707 (5.6%) |
| $2,500 to $4,999 | 10,326 (2.9%) | 12,468 (3.7%) |
| $5,000 to $7,499 | 10,598 (2.9%) | 13,655 (4.1%) |
| $7,500 to $9,999 | 7,032 (1.9%) | 10,243 (3.0%) |
| $10,000 to $12,499 | 8,437 (2.3%) | 13,024 (3.9%) |
| $12,500 to $14,999 | 8,271 (2.3%) | 10,934 (3.3%) |
| $15,000 to $17,499 | 8,014 (2.2%) | 10,844 (3.2%) |
| $17,500 to $19,999 | 7,773 (2.1%) | 9,914 (2.9%) |
| $20,000 to $22,499 | 9,261 (2.6%) | 11,069 (3.3%) |
| $22,500 to $24,999 | 10,413 (2.9%) | 11,569 (3.4%) |
| $25,000 to $29,999 | 18,547 (5.1%) | 22,148 (6.6%) |
| $30,000 to $34,999 | 20,672 (5.7%) | 23,485 (7.0%) |
| $35,000 to $39,999 | 19,376 (5.4%) | 21,252 (6.3%) |
| $40,000 to $44,999 | 18,756 (5.2%) | 22,129 (6.6%) |
| $45,000 to $49,999 | 19,670 (5.4%) | 19,186 (5.7%) |
| $50,000 to $54,999 | 16,289 (4.5%) | 14,624 (4.3%) |
| $55,000 to $64,999 | 31,911 (8.8%) | 24,345 (7.2%) |
| $65,000 to $74,999 | 24,081 (6.7%) | 18,564 (5.5%) |
| $75,000 to $99,999 | 40,863 (11.3%) | 25,526 (7.6%) |
| $100,000+ | 56,203 (15.5%) | 23,211 (6.9%) |
| Total | 361,744 (100.0%) | 336,897 (100.0%) |
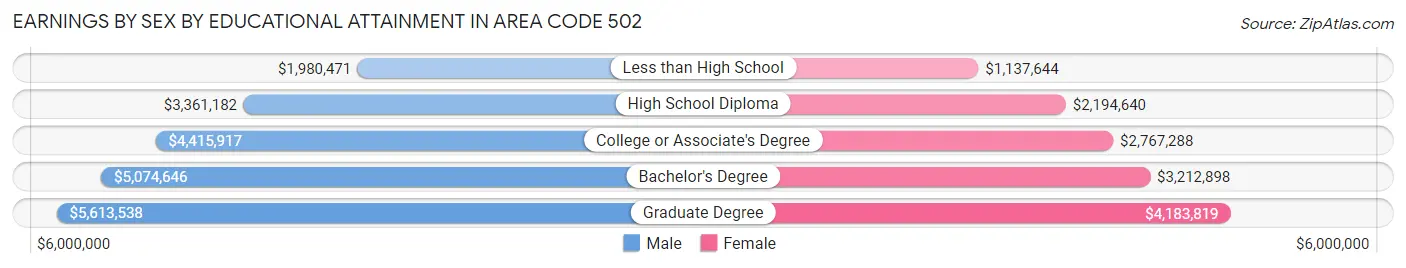
Earnings by Sex by Educational Attainment in Area Code 502
Average earnings in Area Code 502 are $4,625,024 for men and $3,184,325 for women, a difference of 31.1%. Men with an educational attainment of graduate degree enjoy the highest average annual earnings of $5,613,538, while those with less than high school education earn the least with $1,980,471. Women with an educational attainment of graduate degree earn the most with the average annual earnings of $4,183,819, while those with less than high school education have the smallest earnings of $1,137,644.
| Educational Attainment | Male Income | Female Income |
| Less than High School | $1,980,471 | $1,137,644 |
| High School Diploma | $3,361,182 | $2,194,640 |
| College or Associate's Degree | $4,415,917 | $2,767,288 |
| Bachelor's Degree | $5,074,646 | $3,212,898 |
| Graduate Degree | $5,613,538 | $4,183,819 |
| Total | $4,625,024 | $3,184,325 |
Family Income in Area Code 502
Family Income Brackets in Area Code 502
According to the Area Code 502 family income data, there are 5,707,651 families falling into the $100,000 to $149,999 income range, which is the most common income bracket and makes up 1,760.8% of all families. Conversely, the $10,000 to $14,999 income bracket is the least frequent group with only 539,063 families (166.3%) belonging to this category.
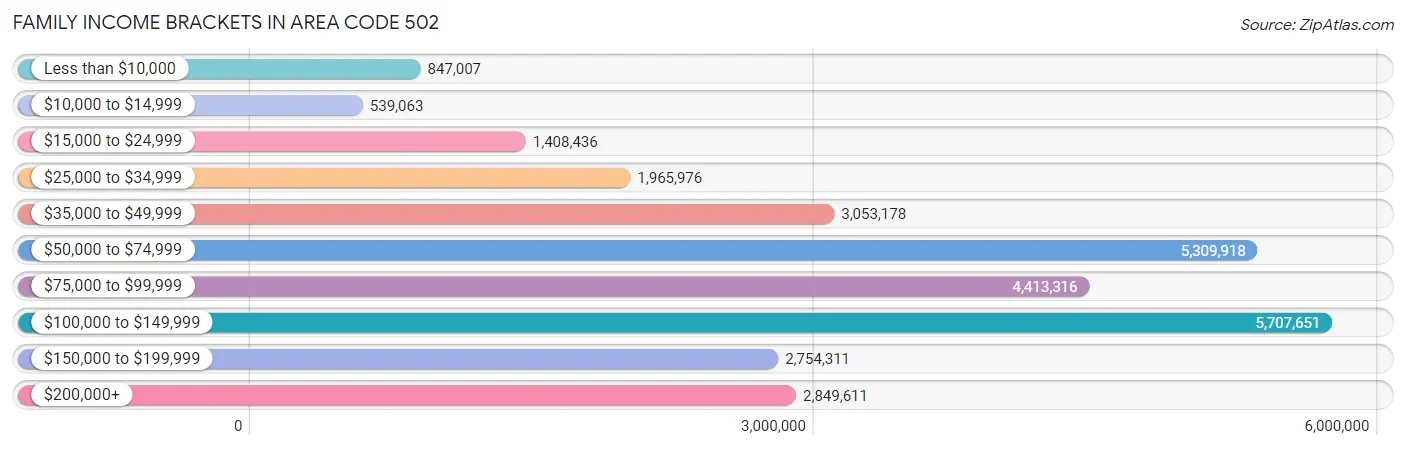
| Income Bracket | # Families | % Families |
| Less than $10,000 | 847,007 | 261.3% |
| $10,000 to $14,999 | 539,063 | 166.3% |
| $15,000 to $24,999 | 1,408,436 | 434.5% |
| $25,000 to $34,999 | 1,965,976 | 606.5% |
| $35,000 to $49,999 | 3,053,178 | 941.9% |
| $50,000 to $74,999 | 5,309,918 | 1,638.1% |
| $75,000 to $99,999 | 4,413,316 | 1,361.5% |
| $100,000 to $149,999 | 5,707,651 | 1,760.8% |
| $150,000 to $199,999 | 2,754,311 | 849.7% |
| $200,000+ | 2,849,611 | 879.1% |
Family Income by Famaliy Size in Area Code 502
7+ person families (3,826 | 1.2%) account for the highest median family income in Area Code 502 with $123,493 per family, while 2-person families (159,151 | 49.1%) have the highest median income of $38,925 per family member.
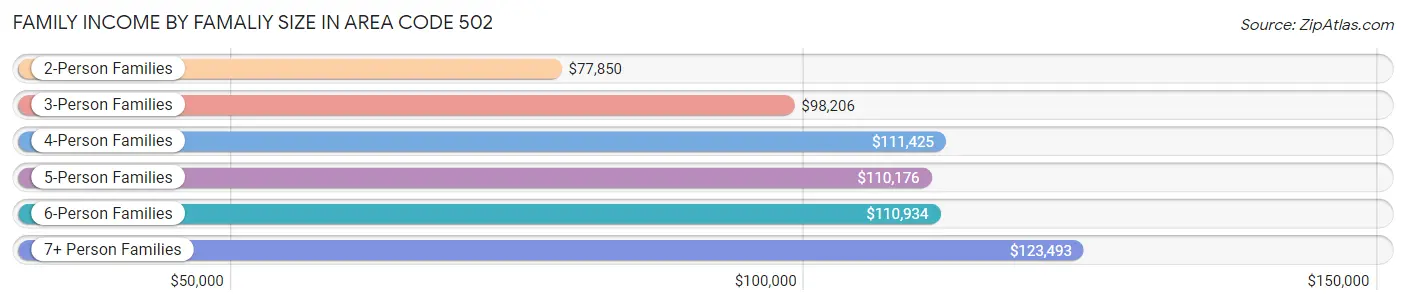
| Income Bracket | # Families | Median Income |
| 2-Person Families | 159,151 (49.1%) | $77,850 |
| 3-Person Families | 74,495 (23.0%) | $98,206 |
| 4-Person Families | 55,419 (17.1%) | $111,425 |
| 5-Person Families | 23,599 (7.3%) | $110,176 |
| 6-Person Families | 7,661 (2.4%) | $110,934 |
| 7+ Person Families | 3,826 (1.2%) | $123,493 |
| Total | 324,151 (100.0%) | $88,414 |
Family Income by Number of Earners in Area Code 502
The median family income in Area Code 502 is $88,414, with families comprising 3+ earners (34,090) having the highest median family income of $142,757, while families with no earners (45,888) have the lowest median family income of $51,345, accounting for 10.5% and 14.2% of families, respectively.
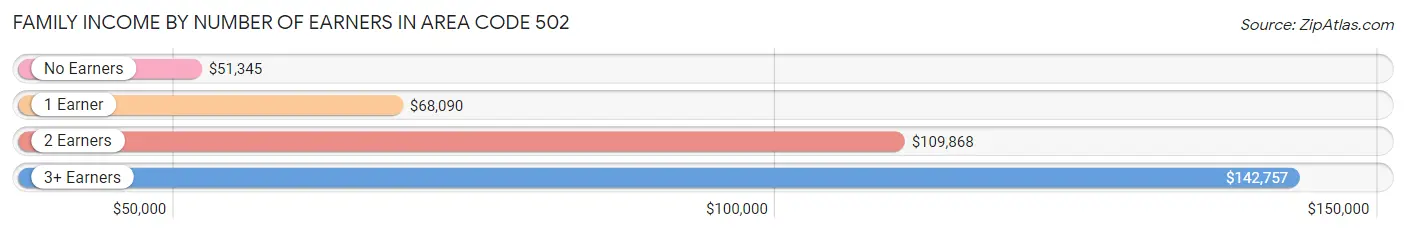
| Number of Earners | # Families | Median Income |
| No Earners | 45,888 (14.2%) | $51,345 |
| 1 Earner | 104,225 (32.2%) | $68,090 |
| 2 Earners | 139,948 (43.2%) | $109,868 |
| 3+ Earners | 34,090 (10.5%) | $142,757 |
| Total | 324,151 (100.0%) | $88,414 |
Household Income in Area Code 502
Household Income Brackets in Area Code 502
With 8,152,426 households falling in the category, the $50,000 to $74,999 income range is the most frequent in Area Code 502, accounting for 1,580.2% of all households. In contrast, only 2,429,941 households (471.0%) fall into the less than $10,000 income bracket, making it the least populous group.
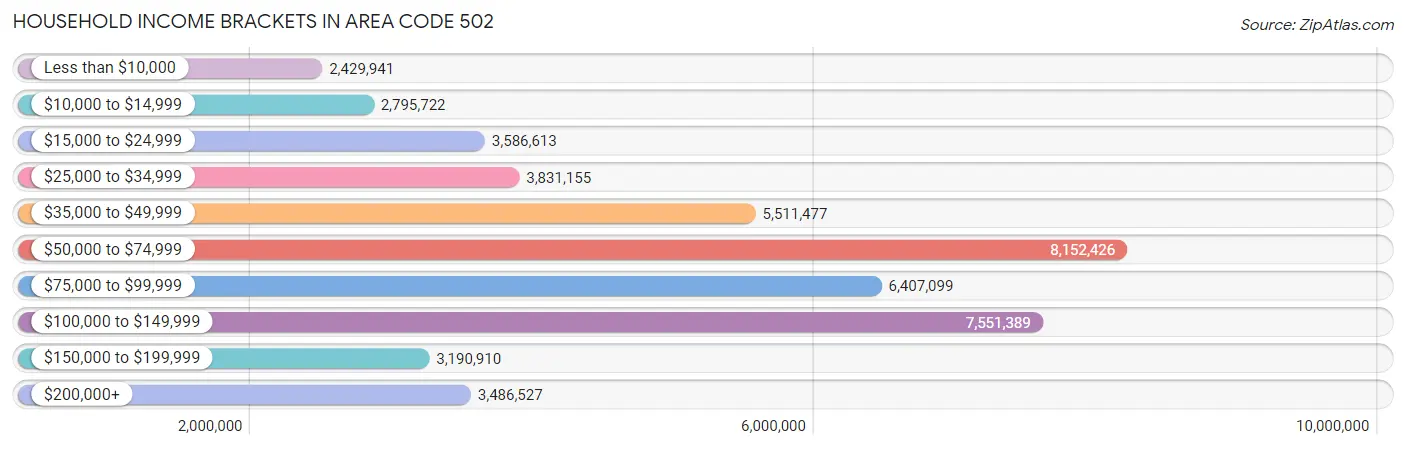
| Income Bracket | # Households | % Households |
| Less than $10,000 | 2,429,941 | 471.0% |
| $10,000 to $14,999 | 2,795,722 | 541.9% |
| $15,000 to $24,999 | 3,586,613 | 695.2% |
| $25,000 to $34,999 | 3,831,155 | 742.6% |
| $35,000 to $49,999 | 5,511,477 | 1,068.3% |
| $50,000 to $74,999 | 8,152,426 | 1,580.2% |
| $75,000 to $99,999 | 6,407,099 | 1,241.9% |
| $100,000 to $149,999 | 7,551,389 | 1,463.7% |
| $150,000 to $199,999 | 3,190,910 | 618.5% |
| $200,000+ | 3,486,527 | 675.8% |
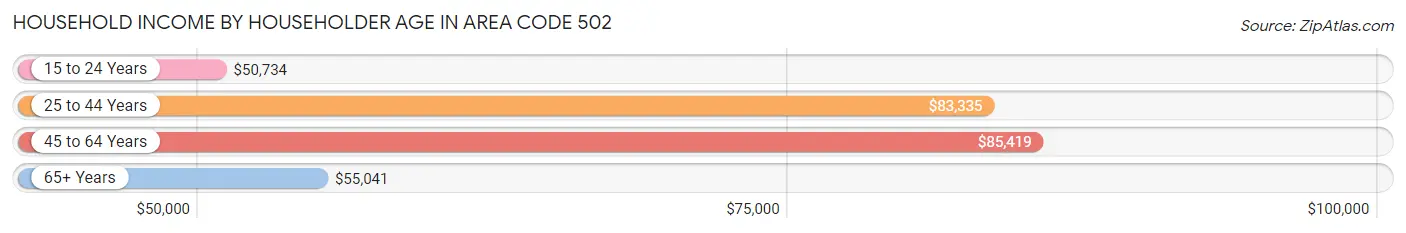
Household Income by Householder Age in Area Code 502
The median household income in Area Code 502 is $72,151, with the highest median household income of $85,419 found in the 45 to 64 years age bracket for the primary householder. A total of 189,335 households (36.7%) fall into this category. Meanwhile, the 15 to 24 years age bracket for the primary householder has the lowest median household income of $50,734, with 19,876 households (3.8%) in this group.
| Income Bracket | # Households | Median Income |
| 15 to 24 Years | 19,876 (3.8%) | $50,734 |
| 25 to 44 Years | 173,781 (33.7%) | $83,335 |
| 45 to 64 Years | 189,335 (36.7%) | $85,419 |
| 65+ Years | 132,919 (25.8%) | $55,041 |
| Total | 515,911 (100.0%) | $72,151 |
Poverty in Area Code 502
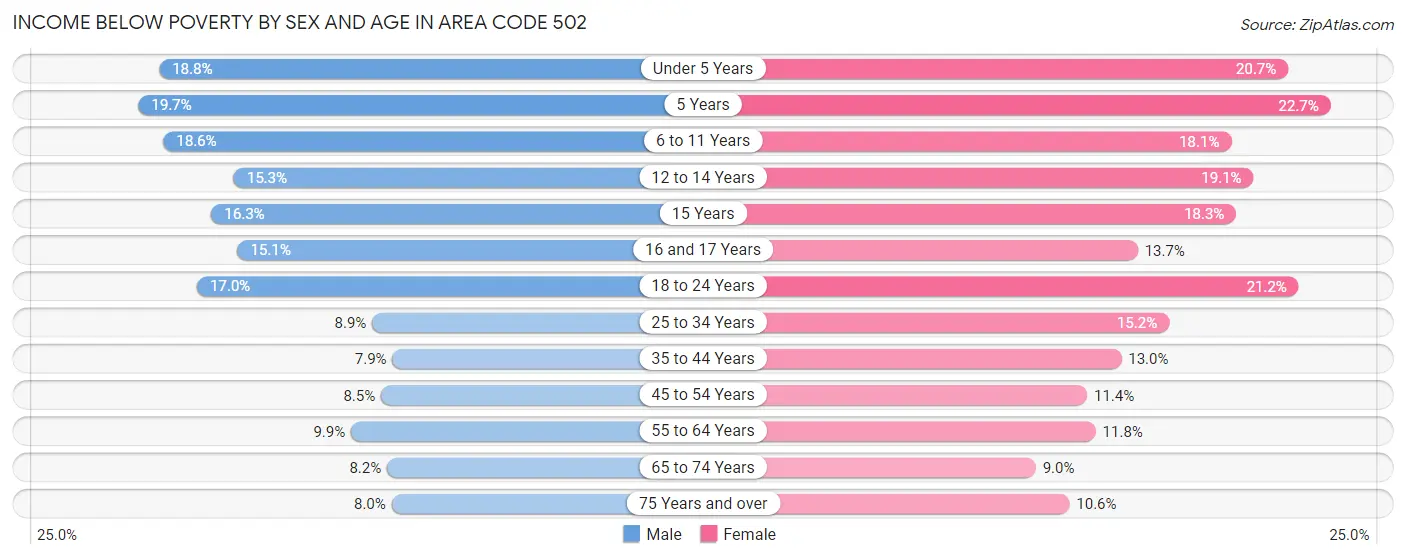
Income Below Poverty by Sex and Age in Area Code 502
With 11.5% poverty level for males and 14.2% for females among the residents of Area Code 502, 5 year old males and 5 year old females are the most vulnerable to poverty, with 1,539 males (19.7%) and 1,954 females (22.7%) in their respective age groups living below the poverty level.
| Age Bracket | Male | Female |
| Under 5 Years | 7,133 (18.8%) | 7,495 (20.7%) |
| 5 Years | 1,539 (19.7%) | 1,954 (22.7%) |
| 6 to 11 Years | 9,084 (18.6%) | 8,099 (18.1%) |
| 12 to 14 Years | 3,797 (15.3%) | 4,683 (19.1%) |
| 15 Years | 1,381 (16.3%) | 1,434 (18.3%) |
| 16 and 17 Years | 2,510 (15.1%) | 2,212 (13.7%) |
| 18 to 24 Years | 8,825 (17.0%) | 10,607 (21.2%) |
| 25 to 34 Years | 7,789 (8.9%) | 13,463 (15.2%) |
| 35 to 44 Years | 6,545 (7.9%) | 10,747 (13.0%) |
| 45 to 54 Years | 6,646 (8.5%) | 9,179 (11.4%) |
| 55 to 64 Years | 7,905 (9.9%) | 10,229 (11.8%) |
| 65 to 74 Years | 4,727 (8.2%) | 5,938 (9.0%) |
| 75 Years and over | 2,475 (8.0%) | 4,760 (10.6%) |
| Total | 70,356 (11.5%) | 90,800 (14.2%) |
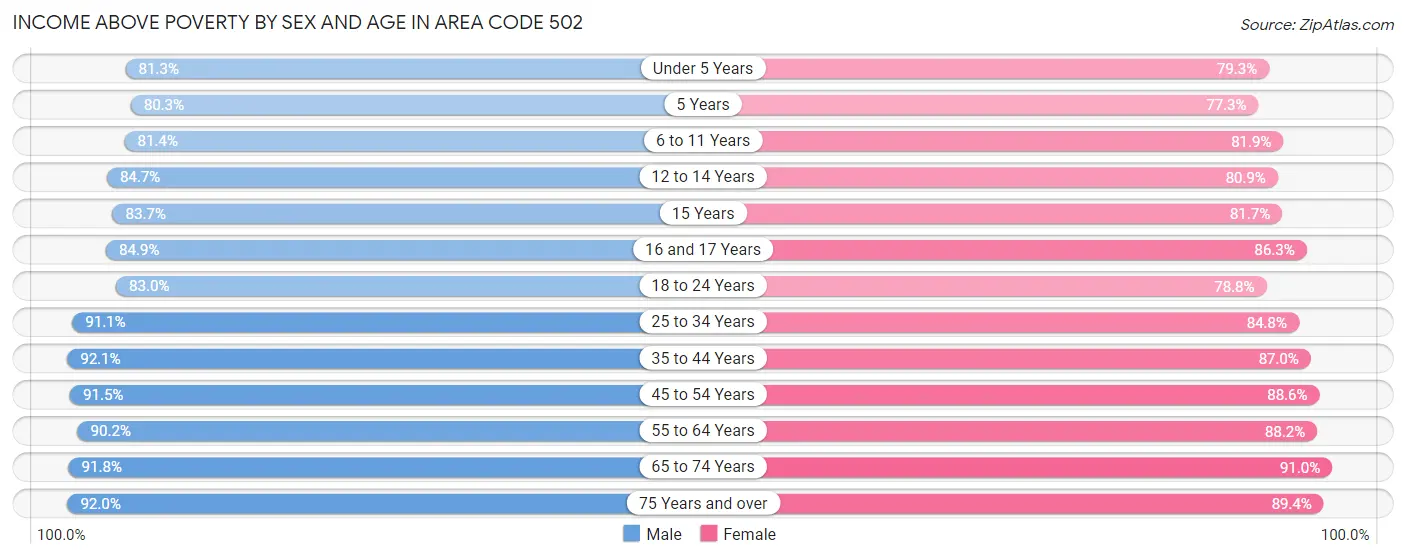
Income Above Poverty by Sex and Age in Area Code 502
According to the poverty statistics in Area Code 502, males aged 35 to 44 years and females aged 65 to 74 years are the age groups that are most secure financially, with 92.1% of males and 91.0% of females in these age groups living above the poverty line.
| Age Bracket | Male | Female |
| Under 5 Years | 30,919 (81.2%) | 28,694 (79.3%) |
| 5 Years | 6,265 (80.3%) | 6,663 (77.3%) |
| 6 to 11 Years | 39,864 (81.4%) | 36,715 (81.9%) |
| 12 to 14 Years | 21,032 (84.7%) | 19,835 (80.9%) |
| 15 Years | 7,078 (83.7%) | 6,402 (81.7%) |
| 16 and 17 Years | 14,090 (84.9%) | 13,903 (86.3%) |
| 18 to 24 Years | 43,089 (83.0%) | 39,436 (78.8%) |
| 25 to 34 Years | 80,023 (91.1%) | 75,231 (84.8%) |
| 35 to 44 Years | 76,034 (92.1%) | 72,122 (87.0%) |
| 45 to 54 Years | 71,950 (91.5%) | 71,502 (88.6%) |
| 55 to 64 Years | 72,348 (90.1%) | 76,572 (88.2%) |
| 65 to 74 Years | 53,045 (91.8%) | 60,021 (91.0%) |
| 75 Years and over | 28,594 (92.0%) | 40,333 (89.4%) |
| Total | 544,331 (88.5%) | 547,429 (85.8%) |
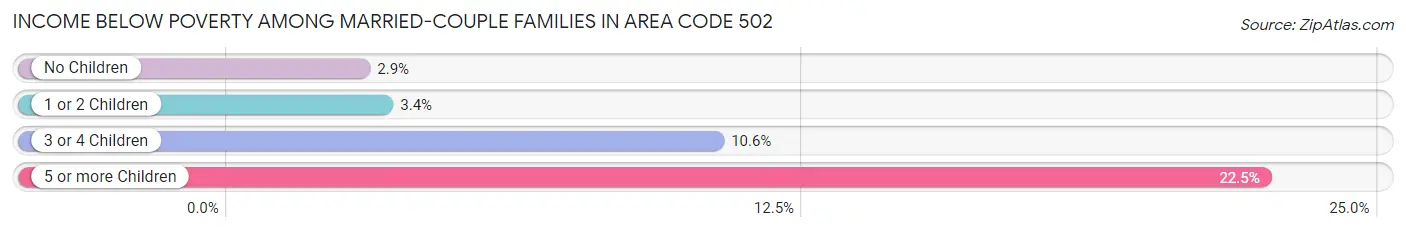
Income Below Poverty Among Married-Couple Families in Area Code 502
The poverty statistics for married-couple families in Area Code 502 show that 3.8% or 8,681 of the total 229,177 families live below the poverty line. Families with 5 or more children have the highest poverty rate of 22.5%, comprising of 412 families. On the other hand, families with no children have the lowest poverty rate of 2.9%, which includes 3,933 families.
| Children | Above Poverty | Below Poverty |
| No Children | 132,696 (97.1%) | 3,933 (2.9%) |
| 1 or 2 Children | 70,642 (96.6%) | 2,474 (3.4%) |
| 3 or 4 Children | 15,738 (89.4%) | 1,862 (10.6%) |
| 5 or more Children | 1,420 (77.5%) | 412 (22.5%) |
| Total | 220,496 (96.2%) | 8,681 (3.8%) |
Income Below Poverty Among Single-Parent Households in Area Code 502
According to the poverty data in Area Code 502, 12.1% or 3,219 single-father households and 26.3% or 17,977 single-mother households are living below the poverty line. Among single-father households, those with 5 or more children have the highest poverty rate, with 134 households (52.3%) experiencing poverty. Likewise, among single-mother households, those with 5 or more children have the highest poverty rate, with 534 households (74.5%) falling below the poverty line.
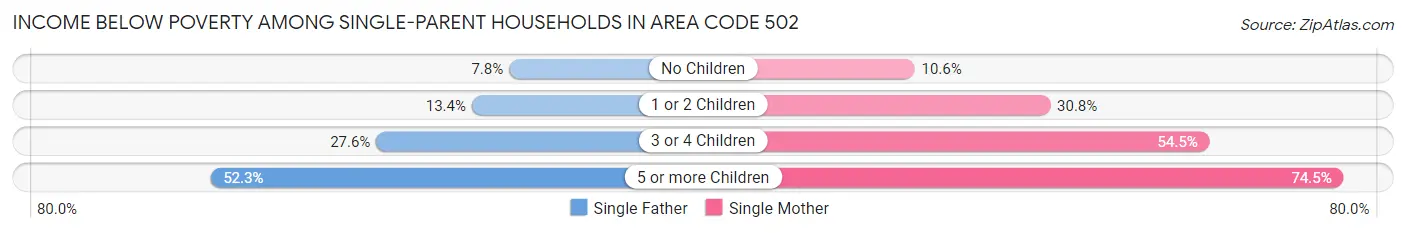
| Children | Single Father | Single Mother |
| No Children | 932 (7.8%) | 2,646 (10.6%) |
| 1 or 2 Children | 1,732 (13.4%) | 10,875 (30.8%) |
| 3 or 4 Children | 421 (27.6%) | 3,922 (54.5%) |
| 5 or more Children | 134 (52.3%) | 534 (74.5%) |
| Total | 3,219 (12.1%) | 17,977 (26.3%) |
Income Below Poverty Among Married-Couple vs Single-Parent Households in Area Code 502
The poverty data for Area Code 502 shows that 8,681 of the married-couple family households (3.8%) and 21,196 of the single-parent households (22.3%) are living below the poverty level. Within the married-couple family households, those with 5 or more children have the highest poverty rate, with 412 households (22.5%) falling below the poverty line. Among the single-parent households, those with 5 or more children have the highest poverty rate, with 668 household (68.6%) living below poverty.
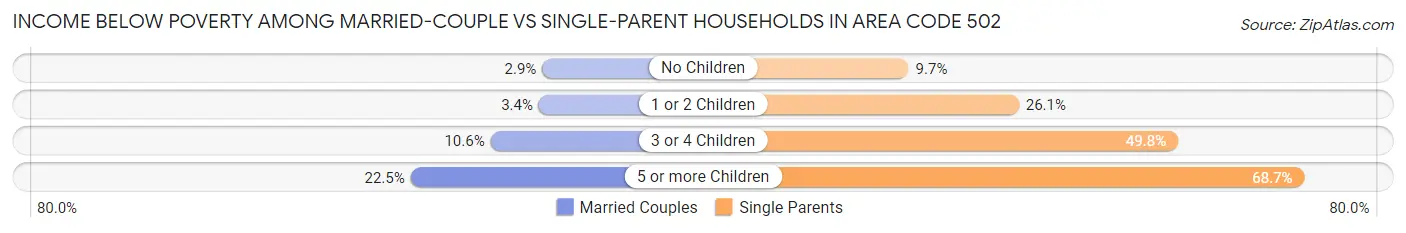
| Children | Married-Couple Families | Single-Parent Households |
| No Children | 3,933 (2.9%) | 3,578 (9.7%) |
| 1 or 2 Children | 2,474 (3.4%) | 12,607 (26.1%) |
| 3 or 4 Children | 1,862 (10.6%) | 4,343 (49.8%) |
| 5 or more Children | 412 (22.5%) | 668 (68.6%) |
| Total | 8,681 (3.8%) | 21,196 (22.3%) |
Race in Area Code 502
The most populous races in Area Code 502 are White / Caucasian (953,479 | 74.3%), Black / African American (206,974 | 16.1%), and Hispanic or Latino (75,997 | 5.9%).
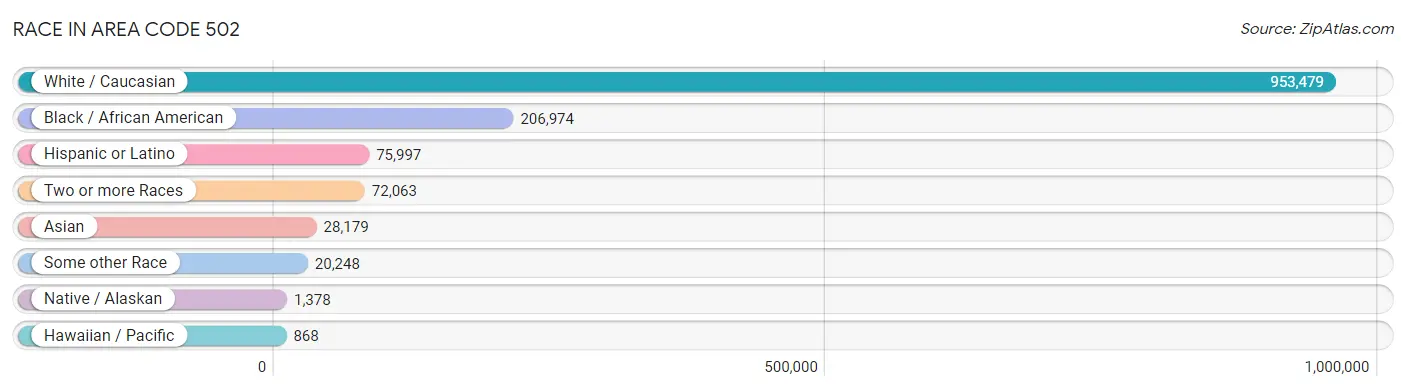
| Race | # Population | % Population |
| Asian | 28,179 | 2.2% |
| Black / African American | 206,974 | 16.1% |
| Hawaiian / Pacific | 868 | 0.1% |
| Hispanic or Latino | 75,997 | 5.9% |
| Native / Alaskan | 1,378 | 0.1% |
| White / Caucasian | 953,479 | 74.3% |
| Two or more Races | 72,063 | 5.6% |
| Some other Race | 20,248 | 1.6% |
| Total | 1,283,189 | 100.0% |
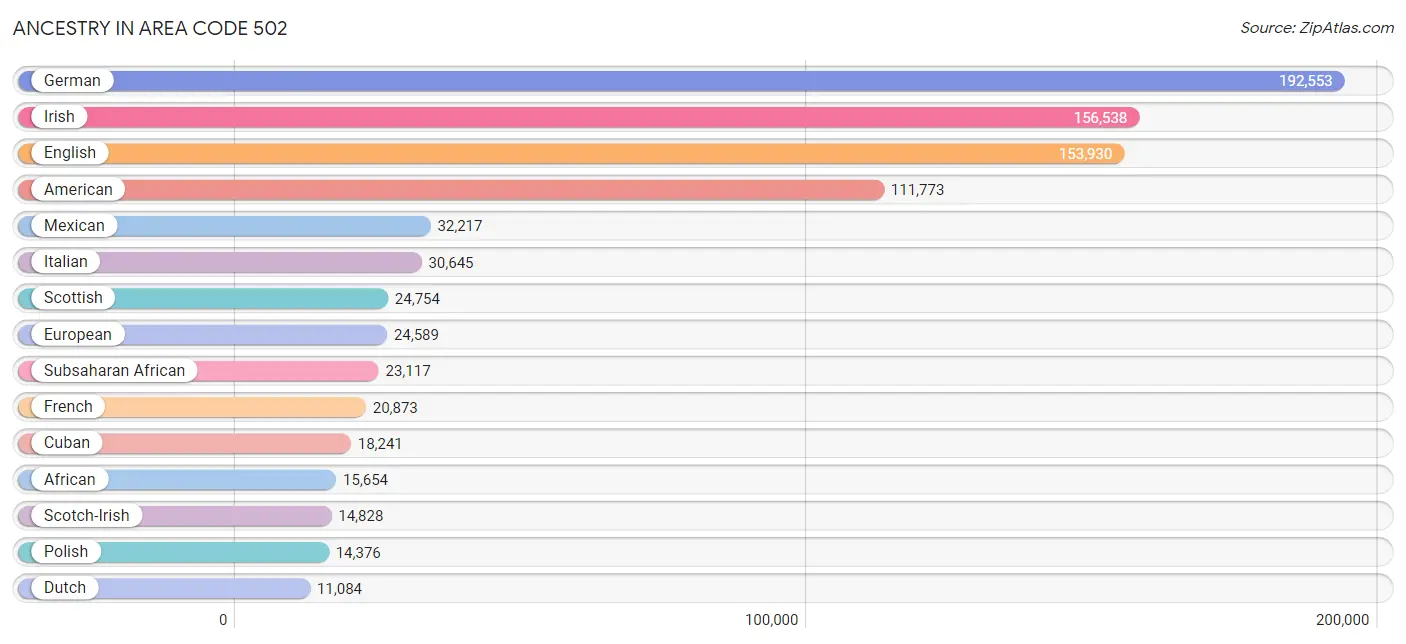
Ancestry in Area Code 502
The most populous ancestries reported in Area Code 502 are German (192,553 | 15.0%), Irish (156,538 | 12.2%), English (153,930 | 12.0%), American (111,773 | 8.7%), and Mexican (32,217 | 2.5%), together accounting for 50.4% of all Area Code 502 residents.
| Ancestry | # Population | % Population |
| Afghan | 323 | 0.0% |
| African | 15,654 | 1.2% |
| Alaska Native | 23 | 0.0% |
| Albanian | 581 | 0.1% |
| Aleut | 11 | 0.0% |
| Alsatian | 71 | 0.0% |
| American | 111,773 | 8.7% |
| Apache | 47 | 0.0% |
| Arab | 7,144 | 0.6% |
| Argentinean | 417 | 0.0% |
| Armenian | 188 | 0.0% |
| Assyrian / Chaldean / Syriac | 23 | 0.0% |
| Australian | 293 | 0.0% |
| Austrian | 1,077 | 0.1% |
| Bahamian | 4 | 0.0% |
| Bangladeshi | 316 | 0.0% |
| Barbadian | 89 | 0.0% |
| Basque | 42 | 0.0% |
| Belgian | 640 | 0.1% |
| Belizean | 37 | 0.0% |
| Bermudan | 106 | 0.0% |
| Bhutanese | 2,190 | 0.2% |
| Blackfeet | 860 | 0.1% |
| Bolivian | 151 | 0.0% |
| Brazilian | 255 | 0.0% |
| British | 7,572 | 0.6% |
| British West Indian | 222 | 0.0% |
| Bulgarian | 78 | 0.0% |
| Burmese | 3,994 | 0.3% |
| Cajun | 47 | 0.0% |
| Cambodian | 47 | 0.0% |
| Canadian | 1,016 | 0.1% |
| Cape Verdean | 79 | 0.0% |
| Celtic | 141 | 0.0% |
| Central American | 9,635 | 0.7% |
| Central American Indian | 482 | 0.0% |
| Cherokee | 4,135 | 0.3% |
| Cheyenne | 17 | 0.0% |
| Chickasaw | 116 | 0.0% |
| Chilean | 310 | 0.0% |
| Chinese | 13 | 0.0% |
| Chippewa | 95 | 0.0% |
| Choctaw | 138 | 0.0% |
| Colombian | 1,301 | 0.1% |
| Comanche | 54 | 0.0% |
| Costa Rican | 97 | 0.0% |
| Cree | 23 | 0.0% |
| Creek | 21 | 0.0% |
| Croatian | 1,040 | 0.1% |
| Crow | 17 | 0.0% |
| Cuban | 18,241 | 1.4% |
| Czech | 1,686 | 0.1% |
| Czechoslovakian | 562 | 0.0% |
| Danish | 1,314 | 0.1% |
| Delaware | 15 | 0.0% |
| Dominican | 463 | 0.0% |
| Dutch | 11,084 | 0.9% |
| Dutch West Indian | 14 | 0.0% |
| Eastern European | 2,254 | 0.2% |
| Ecuadorian | 144 | 0.0% |
| Egyptian | 151 | 0.0% |
| English | 153,930 | 12.0% |
| Estonian | 12 | 0.0% |
| Ethiopian | 987 | 0.1% |
| European | 24,589 | 1.9% |
| Fijian | 16 | 0.0% |
| Filipino | 278 | 0.0% |
| Finnish | 586 | 0.1% |
| French | 20,873 | 1.6% |
| French American Indian | 60 | 0.0% |
| French Canadian | 2,498 | 0.2% |
| German | 192,553 | 15.0% |
| German Russian | 4 | 0.0% |
| Ghanaian | 102 | 0.0% |
| Greek | 1,251 | 0.1% |
| Guamanian / Chamorro | 158 | 0.0% |
| Guatemalan | 3,988 | 0.3% |
| Guyanese | 9 | 0.0% |
| Haitian | 1,223 | 0.1% |
| Hmong | 90 | 0.0% |
| Honduran | 3,487 | 0.3% |
| Hopi | 23 | 0.0% |
| Hungarian | 2,100 | 0.2% |
| Icelander | 137 | 0.0% |
| Indian (Asian) | 4,408 | 0.3% |
| Indonesian | 1,429 | 0.1% |
| Inupiat | 27 | 0.0% |
| Iranian | 743 | 0.1% |
| Iraqi | 959 | 0.1% |
| Irish | 156,538 | 12.2% |
| Iroquois | 80 | 0.0% |
| Israeli | 232 | 0.0% |
| Italian | 30,645 | 2.4% |
| Jamaican | 971 | 0.1% |
| Japanese | 564 | 0.0% |
| Jordanian | 696 | 0.1% |
| Kenyan | 376 | 0.0% |
| Kiowa | 4 | 0.0% |
| Korean | 6,439 | 0.5% |
| Laotian | 64 | 0.0% |
| Latvian | 611 | 0.1% |
| Lebanese | 1,388 | 0.1% |
| Liberian | 386 | 0.0% |
| Lithuanian | 1,404 | 0.1% |
| Lumbee | 26 | 0.0% |
| Luxembourger | 28 | 0.0% |
| Malaysian | 96 | 0.0% |
| Maltese | 32 | 0.0% |
| Menominee | 8 | 0.0% |
| Mexican | 32,217 | 2.5% |
| Mexican American Indian | 385 | 0.0% |
| Mongolian | 57 | 0.0% |
| Moroccan | 681 | 0.1% |
| Native Hawaiian | 578 | 0.1% |
| Navajo | 54 | 0.0% |
| New Zealander | 51 | 0.0% |
| Nicaraguan | 249 | 0.0% |
| Nigerian | 752 | 0.1% |
| Northern European | 1,226 | 0.1% |
| Norwegian | 5,403 | 0.4% |
| Osage | 37 | 0.0% |
| Ottawa | 2 | 0.0% |
| Paiute | 20 | 0.0% |
| Pakistani | 563 | 0.0% |
| Palestinian | 266 | 0.0% |
| Panamanian | 1,077 | 0.1% |
| Paraguayan | 54 | 0.0% |
| Pennsylvania German | 61 | 0.0% |
| Peruvian | 1,158 | 0.1% |
| Polish | 14,376 | 1.1% |
| Portuguese | 1,883 | 0.2% |
| Potawatomi | 20 | 0.0% |
| Pueblo | 43 | 0.0% |
| Puerto Rican | 7,310 | 0.6% |
| Puget Sound Salish | 10 | 0.0% |
| Romanian | 407 | 0.0% |
| Russian | 4,172 | 0.3% |
| Salvadoran | 729 | 0.1% |
| Samoan | 160 | 0.0% |
| Scandinavian | 3,376 | 0.3% |
| Scotch-Irish | 14,828 | 1.2% |
| Scottish | 24,754 | 1.9% |
| Seminole | 13 | 0.0% |
| Senegalese | 342 | 0.0% |
| Serbian | 430 | 0.0% |
| Shoshone | 17 | 0.0% |
| Sioux | 118 | 0.0% |
| Slavic | 452 | 0.0% |
| Slovak | 1,113 | 0.1% |
| Slovene | 342 | 0.0% |
| Somali | 1,440 | 0.1% |
| South African | 189 | 0.0% |
| South American | 4,285 | 0.3% |
| South American Indian | 27 | 0.0% |
| Soviet Union | 16 | 0.0% |
| Spaniard | 998 | 0.1% |
| Spanish | 1,076 | 0.1% |
| Spanish American | 35 | 0.0% |
| Spanish American Indian | 32 | 0.0% |
| Sri Lankan | 3,729 | 0.3% |
| Subsaharan African | 23,117 | 1.8% |
| Sudanese | 293 | 0.0% |
| Swedish | 7,140 | 0.6% |
| Swiss | 3,866 | 0.3% |
| Syrian | 259 | 0.0% |
| Taiwanese | 38 | 0.0% |
| Thai | 9,538 | 0.7% |
| Tlingit-Haida | 8 | 0.0% |
| Tohono O'Odham | 222 | 0.0% |
| Tongan | 4 | 0.0% |
| Trinidadian and Tobagonian | 261 | 0.0% |
| Turkish | 496 | 0.0% |
| U.S. Virgin Islander | 48 | 0.0% |
| Ugandan | 99 | 0.0% |
| Ukrainian | 1,345 | 0.1% |
| Uruguayan | 24 | 0.0% |
| Venezuelan | 610 | 0.1% |
| Vietnamese | 55 | 0.0% |
| Welsh | 8,208 | 0.6% |
| West Indian | 147 | 0.0% |
| Yugoslavian | 1,857 | 0.1% |
| Zimbabwean | 5 | 0.0% | View All 182 Rows |
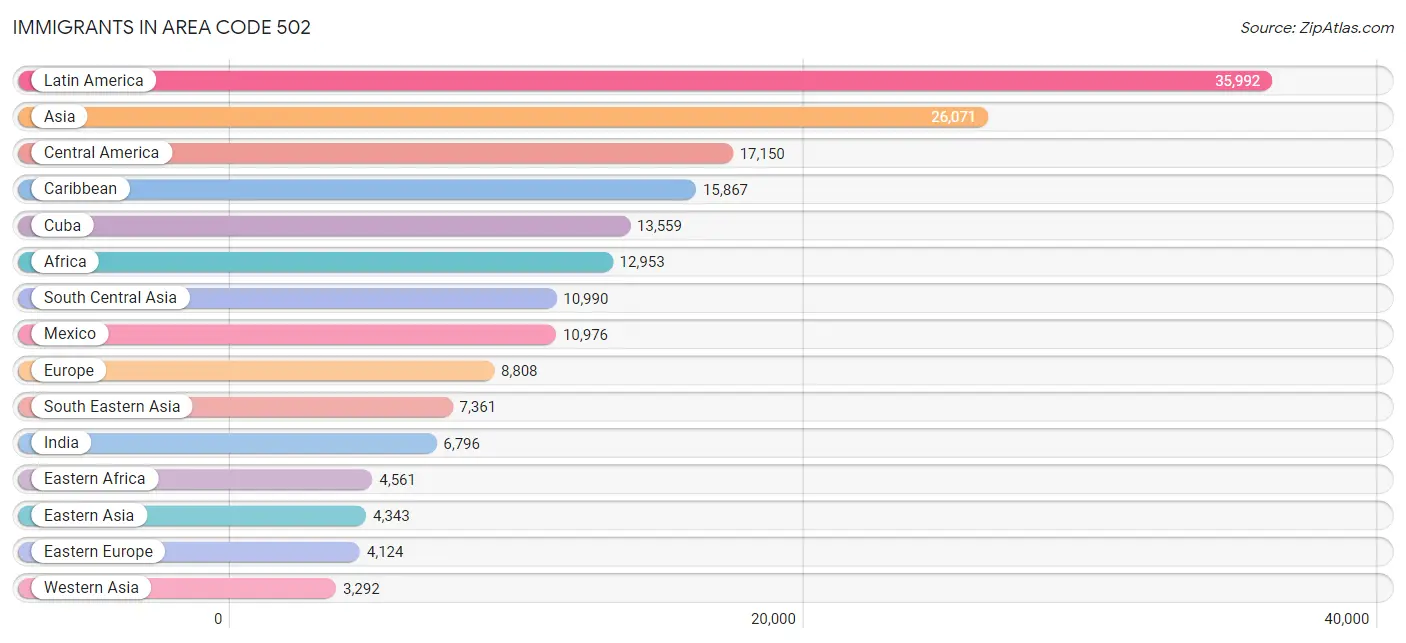
Immigrants in Area Code 502
The most numerous immigrant groups reported in Area Code 502 came from Latin America (35,992 | 2.8%), Asia (26,071 | 2.0%), Central America (17,150 | 1.3%), Caribbean (15,867 | 1.2%), and Cuba (13,559 | 1.1%), together accounting for 8.5% of all Area Code 502 residents.
| Immigration Origin | # Population | % Population |
| Afghanistan | 276 | 0.0% |
| Africa | 12,953 | 1.0% |
| Albania | 113 | 0.0% |
| Argentina | 203 | 0.0% |
| Armenia | 1 | 0.0% |
| Asia | 26,071 | 2.0% |
| Australia | 177 | 0.0% |
| Austria | 123 | 0.0% |
| Bahamas | 11 | 0.0% |
| Bangladesh | 96 | 0.0% |
| Barbados | 38 | 0.0% |
| Belarus | 256 | 0.0% |
| Belgium | 43 | 0.0% |
| Belize | 37 | 0.0% |
| Bolivia | 100 | 0.0% |
| Bosnia and Herzegovina | 1,424 | 0.1% |
| Brazil | 265 | 0.0% |
| Bulgaria | 48 | 0.0% |
| Cambodia | 270 | 0.0% |
| Cameroon | 25 | 0.0% |
| Canada | 1,388 | 0.1% |
| Caribbean | 15,867 | 1.2% |
| Central America | 17,150 | 1.3% |
| Chile | 176 | 0.0% |
| China | 2,201 | 0.2% |
| Colombia | 766 | 0.1% |
| Congo | 1,456 | 0.1% |
| Costa Rica | 124 | 0.0% |
| Croatia | 200 | 0.0% |
| Cuba | 13,559 | 1.1% |
| Czechoslovakia | 51 | 0.0% |
| Denmark | 18 | 0.0% |
| Dominican Republic | 119 | 0.0% |
| Eastern Africa | 4,561 | 0.4% |
| Eastern Asia | 4,343 | 0.3% |
| Eastern Europe | 4,124 | 0.3% |
| Ecuador | 37 | 0.0% |
| Egypt | 67 | 0.0% |
| El Salvador | 352 | 0.0% |
| England | 465 | 0.0% |
| Eritrea | 197 | 0.0% |
| Ethiopia | 1,117 | 0.1% |
| Europe | 8,808 | 0.7% |
| Fiji | 9 | 0.0% |
| France | 351 | 0.0% |
| Germany | 1,965 | 0.2% |
| Ghana | 220 | 0.0% |
| Greece | 10 | 0.0% |
| Grenada | 21 | 0.0% |
| Guatemala | 2,718 | 0.2% |
| Guyana | 184 | 0.0% |
| Haiti | 860 | 0.1% |
| Honduras | 2,469 | 0.2% |
| Hong Kong | 182 | 0.0% |
| Hungary | 50 | 0.0% |
| India | 6,796 | 0.5% |
| Indonesia | 6 | 0.0% |
| Iran | 490 | 0.0% |
| Iraq | 1,828 | 0.1% |
| Ireland | 299 | 0.0% |
| Israel | 35 | 0.0% |
| Italy | 94 | 0.0% |
| Jamaica | 869 | 0.1% |
| Japan | 599 | 0.1% |
| Jordan | 731 | 0.1% |
| Kazakhstan | 72 | 0.0% |
| Kenya | 684 | 0.1% |
| Korea | 1,477 | 0.1% |
| Kuwait | 105 | 0.0% |
| Laos | 224 | 0.0% |
| Latin America | 35,992 | 2.8% |
| Latvia | 8 | 0.0% |
| Lebanon | 43 | 0.0% |
| Liberia | 545 | 0.0% |
| Lithuania | 46 | 0.0% |
| Malaysia | 152 | 0.0% |
| Mexico | 10,976 | 0.9% |
| Micronesia | 139 | 0.0% |
| Middle Africa | 3,258 | 0.3% |
| Moldova | 107 | 0.0% |
| Morocco | 449 | 0.0% |
| Nepal | 811 | 0.1% |
| Netherlands | 77 | 0.0% |
| Nicaragua | 183 | 0.0% |
| Nigeria | 374 | 0.0% |
| Northern Africa | 1,217 | 0.1% |
| Northern Europe | 1,655 | 0.1% |
| Norway | 16 | 0.0% |
| Oceania | 461 | 0.0% |
| Pakistan | 531 | 0.0% |
| Panama | 283 | 0.0% |
| Peru | 602 | 0.1% |
| Philippines | 2,983 | 0.2% |
| Poland | 30 | 0.0% |
| Portugal | 57 | 0.0% |
| Romania | 37 | 0.0% |
| Russia | 570 | 0.0% |
| Saudi Arabia | 67 | 0.0% |
| Scotland | 190 | 0.0% |
| Senegal | 370 | 0.0% |
| Serbia | 179 | 0.0% |
| Singapore | 32 | 0.0% |
| Somalia | 1,407 | 0.1% |
| South Africa | 384 | 0.0% |
| South America | 2,975 | 0.2% |
| South Central Asia | 10,990 | 0.9% |
| South Eastern Asia | 7,361 | 0.6% |
| Southern Europe | 443 | 0.0% |
| Spain | 277 | 0.0% |
| Sri Lanka | 189 | 0.0% |
| St. Vincent and the Grenadines | 14 | 0.0% |
| Sudan | 161 | 0.0% |
| Sweden | 53 | 0.0% |
| Syria | 155 | 0.0% |
| Taiwan | 219 | 0.0% |
| Thailand | 860 | 0.1% |
| Trinidad and Tobago | 202 | 0.0% |
| Turkey | 73 | 0.0% |
| Uganda | 90 | 0.0% |
| Ukraine | 509 | 0.0% |
| Uruguay | 21 | 0.0% |
| Uzbekistan | 497 | 0.0% |
| Venezuela | 566 | 0.0% |
| Vietnam | 2,178 | 0.2% |
| West Indies | 99 | 0.0% |
| Western Africa | 2,221 | 0.2% |
| Western Asia | 3,292 | 0.3% |
| Western Europe | 2,567 | 0.2% |
| Zaire | 1,533 | 0.1% |
| Zimbabwe | 34 | 0.0% | View All 130 Rows |
Sex and Age in Area Code 502
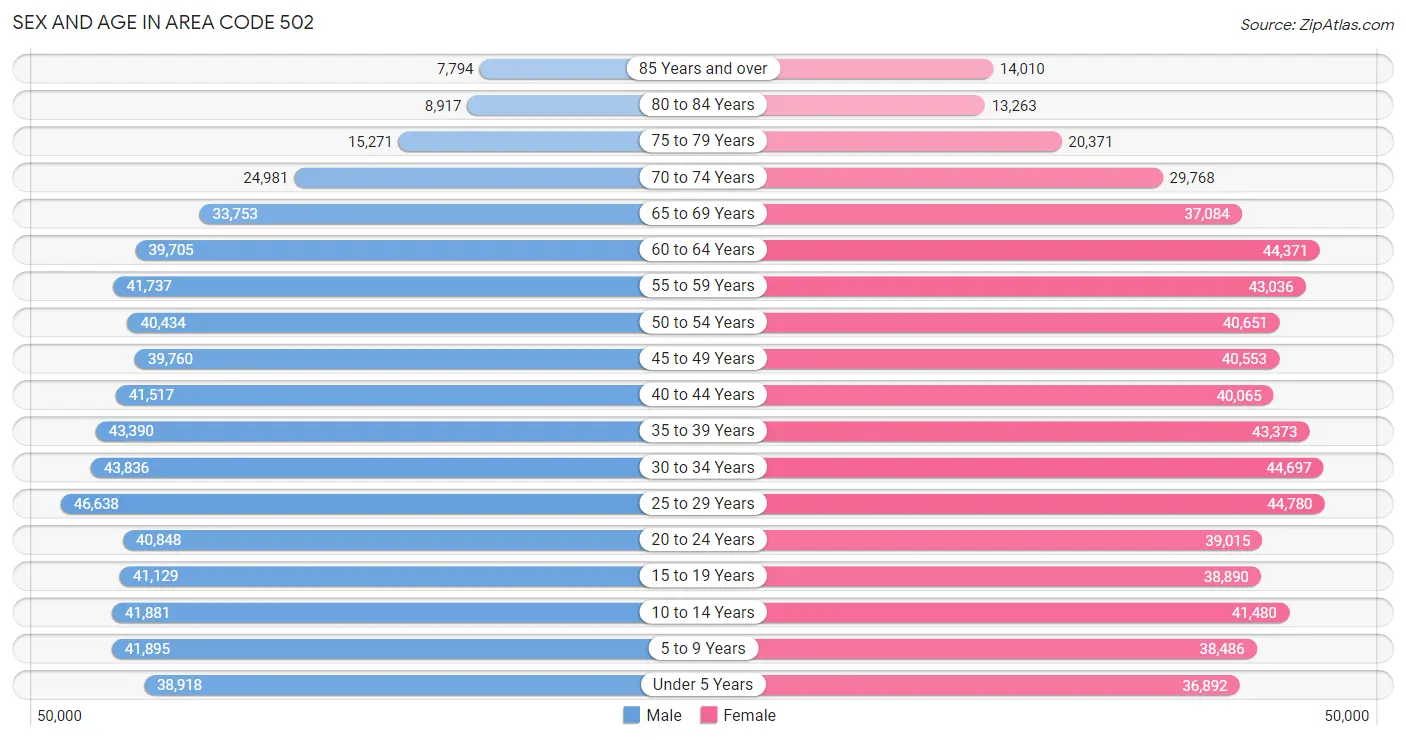
Sex and Age in Area Code 502
The most populous age groups in Area Code 502 are 25 to 29 Years (46,638 | 7.4%) for men and 25 to 29 Years (44,780 | 6.9%) for women.
| Age Bracket | Male | Female |
| Under 5 Years | 38,918 (6.1%) | 36,892 (5.7%) |
| 5 to 9 Years | 41,895 (6.6%) | 38,486 (5.9%) |
| 10 to 14 Years | 41,881 (6.6%) | 41,480 (6.4%) |
| 15 to 19 Years | 41,129 (6.5%) | 38,890 (6.0%) |
| 20 to 24 Years | 40,848 (6.5%) | 39,015 (6.0%) |
| 25 to 29 Years | 46,638 (7.4%) | 44,780 (6.9%) |
| 30 to 34 Years | 43,836 (6.9%) | 44,697 (6.9%) |
| 35 to 39 Years | 43,390 (6.9%) | 43,373 (6.7%) |
| 40 to 44 Years | 41,517 (6.6%) | 40,065 (6.2%) |
| 45 to 49 Years | 39,760 (6.3%) | 40,553 (6.2%) |
| 50 to 54 Years | 40,434 (6.4%) | 40,651 (6.2%) |
| 55 to 59 Years | 41,737 (6.6%) | 43,036 (6.6%) |
| 60 to 64 Years | 39,705 (6.3%) | 44,371 (6.8%) |
| 65 to 69 Years | 33,753 (5.3%) | 37,084 (5.7%) |
| 70 to 74 Years | 24,981 (4.0%) | 29,768 (4.6%) |
| 75 to 79 Years | 15,271 (2.4%) | 20,371 (3.1%) |
| 80 to 84 Years | 8,917 (1.4%) | 13,263 (2.0%) |
| 85 Years and over | 7,794 (1.2%) | 14,010 (2.1%) |
| Total | 632,404 (100.0%) | 650,785 (100.0%) |
Families and Households in Area Code 502
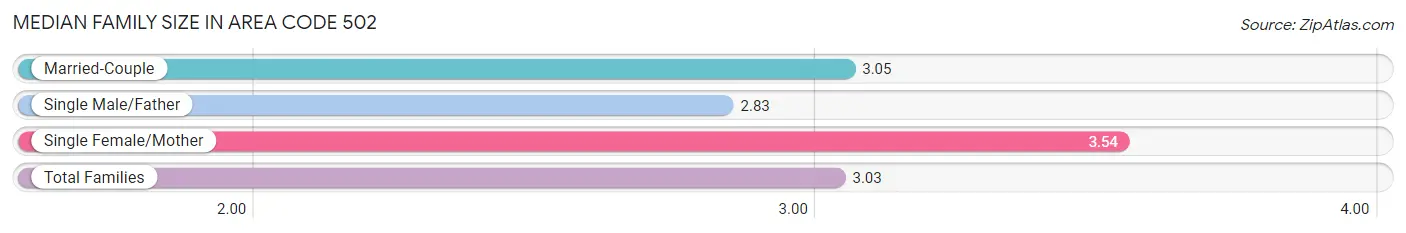
Median Family Size in Area Code 502
The median family size in Area Code 502 is 3.03 persons per family, with single female/mother families (68,306 | 21.1%) accounting for the largest median family size of 3.54144 persons per family. On the other hand, single male/father families (26,668 | 8.2%) represent the smallest median family size with 2.83 persons per family.
| Family Type | # Families | Family Size |
| Married-Couple | 229,177 (70.7%) | 3.05 |
| Single Male/Father | 26,668 (8.2%) | 2.83 |
| Single Female/Mother | 68,306 (21.1%) | 3.54 |
| Total Families | 324,151 (100.0%) | 3.03 |
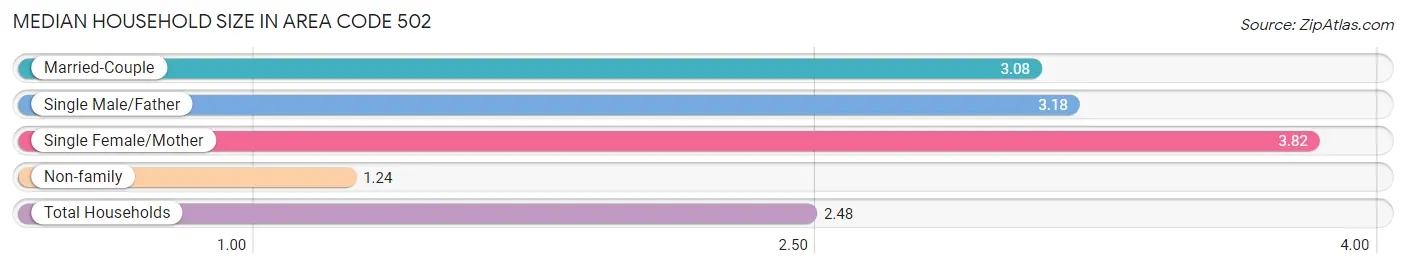
Median Household Size in Area Code 502
The median household size in Area Code 502 is 2.48 persons per household, with single female/mother households (68,306 | 13.2%) accounting for the largest median household size of 3.82024 persons per household. non-family households (191,760 | 37.2%) represent the smallest median household size with 1.24 persons per household.
| Household Type | # Households | Household Size |
| Married-Couple | 229,177 (44.4%) | 3.08 |
| Single Male/Father | 26,668 (5.2%) | 3.18 |
| Single Female/Mother | 68,306 (13.2%) | 3.82 |
| Non-family | 191,760 (37.2%) | 1.24 |
| Total Households | 515,911 (100.0%) | 2.48 |
Household Size by Marriage Status in Area Code 502
Out of a total of 515,911 households in Area Code 502, 324,151 (62.8%) are family households, while 191,760 (37.2%) are nonfamily households. The most numerous type of family households are 2-person households, comprising 147,805, and the most common type of nonfamily households are 1-person households, comprising 156,920.
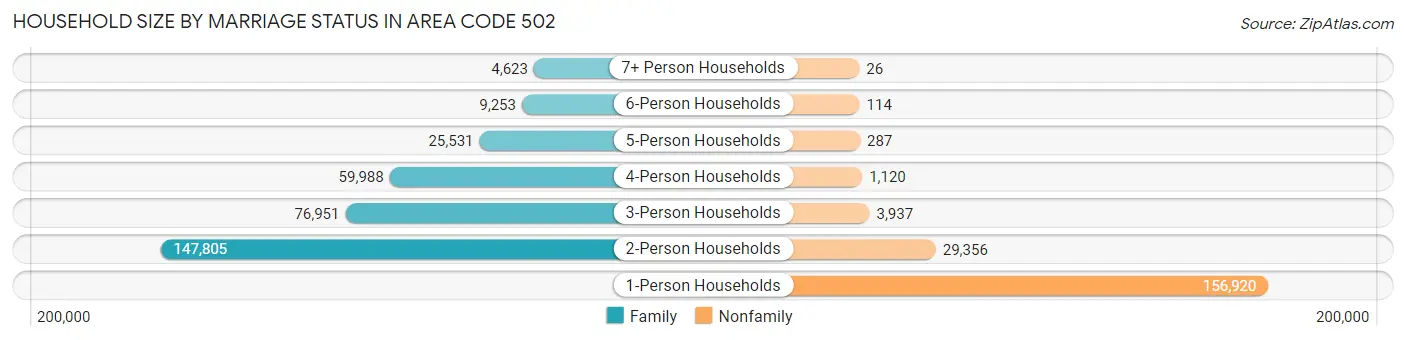
| Household Size | Family Households | Nonfamily Households |
| 1-Person Households | - | 156,920 (30.4%) |
| 2-Person Households | 147,805 (28.6%) | 29,356 (5.7%) |
| 3-Person Households | 76,951 (14.9%) | 3,937 (0.8%) |
| 4-Person Households | 59,988 (11.6%) | 1,120 (0.2%) |
| 5-Person Households | 25,531 (5.0%) | 287 (0.1%) |
| 6-Person Households | 9,253 (1.8%) | 114 (0.0%) |
| 7+ Person Households | 4,623 (0.9%) | 26 (0.0%) |
| Total | 324,151 (62.8%) | 191,760 (37.2%) |
Female Fertility in Area Code 502
Fertility by Age in Area Code 502
Average fertility rate in Area Code 502 is 53.7 births per 1,000 women. Women in the age bracket of 20 to 34 years have the highest fertility rate with 106.1 births per 1,000 women. Women in the age bracket of 20 to 34 years acount for 76.5% of all women with births.
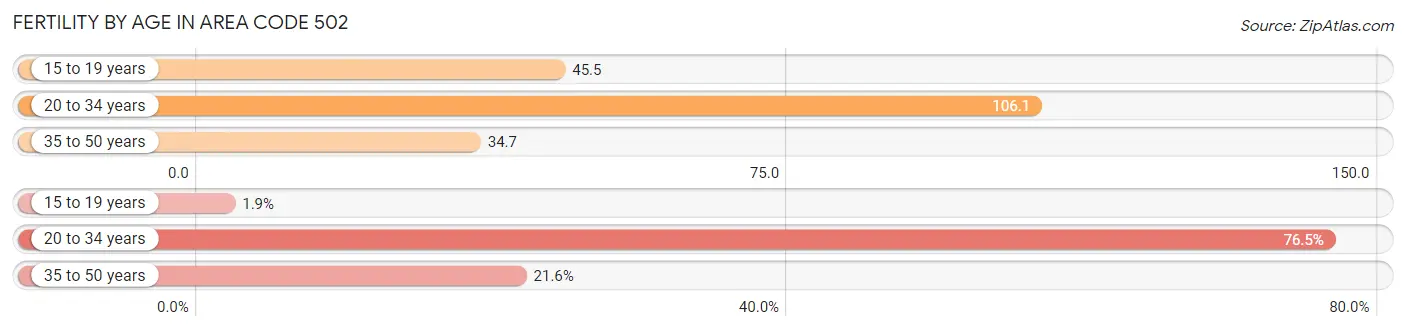
| Age Bracket | Women with Births | Births / 1,000 Women |
| 15 to 19 years | 280 (1.8%) | 45.5 |
| 20 to 34 years | 11,558 (76.5%) | 106.1 |
| 35 to 50 years | 3,265 (21.6%) | 34.7 |
| Total | 15,103 (100.0%) | 53.7 |
Fertility by Age by Marriage Status in Area Code 502
56.2% of women with births (15,103) in Area Code 502 are married. The highest percentage of unmarried women with births falls into 15 to 19 years age bracket with 100.0% of them unmarried at the time of birth, while the lowest percentage of unmarried women with births belong to 20 to 34 years age bracket with 45.9% of them unmarried.
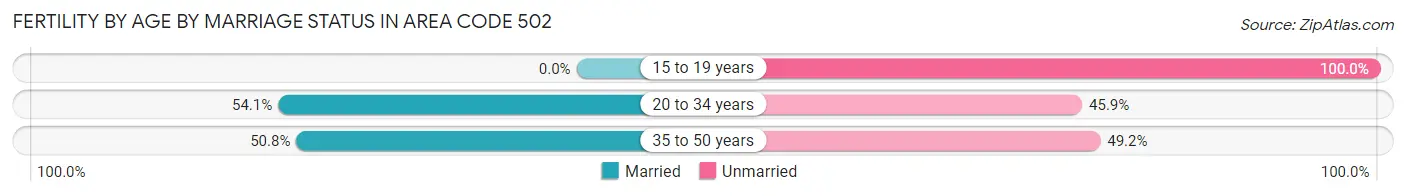
| Age Bracket | Married | Unmarried |
| 15 to 19 years | 0 (0.0%) | 280 (100.0%) |
| 20 to 34 years | 6,250 (54.1%) | 5,308 (45.9%) |
| 35 to 50 years | 1,658 (50.8%) | 1,607 (49.2%) |
| Total | 8,487 (56.2%) | 6,616 (43.8%) |
Fertility by Education in Area Code 502
Average fertility rate in Area Code 502 is 53.7 births per 1,000 women. Women with the education attainment of high school diploma have the highest fertility rate of 93.3 births per 1,000 women, while women with the education attainment of college or associate's degree have the lowest fertility at 54.1 births per 1,000 women. Women with the education attainment of college or associate's degree represent 28.9% of all women with births.
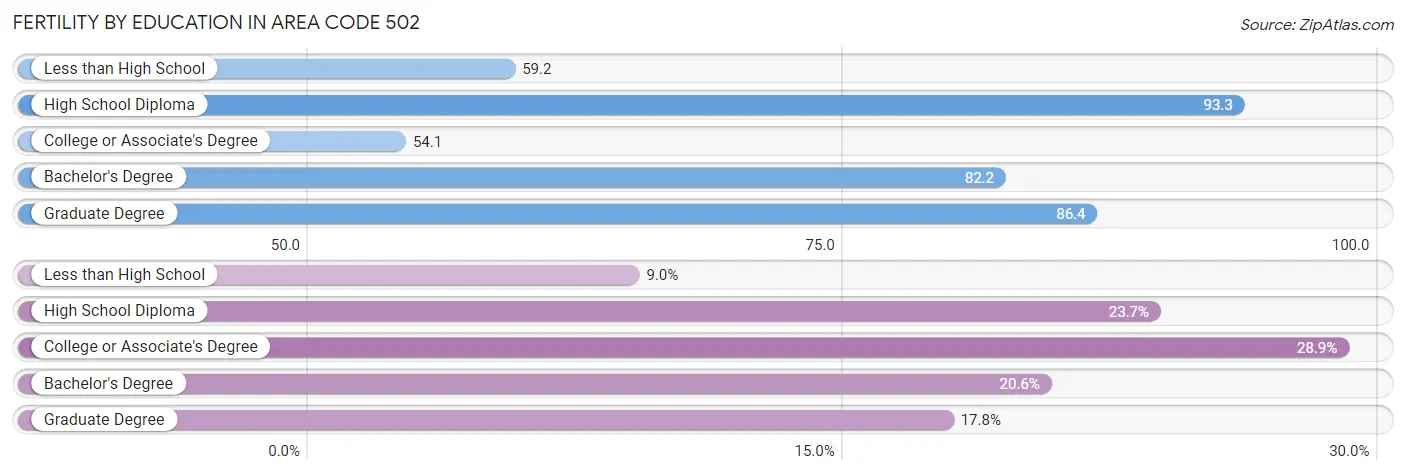
| Educational Attainment | Women with Births | Births / 1,000 Women |
| Less than High School | 1,359 (9.0%) | 59.2 |
| High School Diploma | 3,572 (23.6%) | 93.3 |
| College or Associate's Degree | 4,371 (28.9%) | 54.1 |
| Bachelor's Degree | 3,108 (20.6%) | 82.2 |
| Graduate Degree | 2,693 (17.8%) | 86.4 |
| Total | 15,103 (100.0%) | 53.7 |
Fertility by Education by Marriage Status in Area Code 502
43.8% of women with births in Area Code 502 are unmarried. Women with the educational attainment of graduate degree are most likely to be married with 65.1% of them married at childbirth, while women with the educational attainment of less than high school are least likely to be married with 81.1% of them unmarried at childbirth.
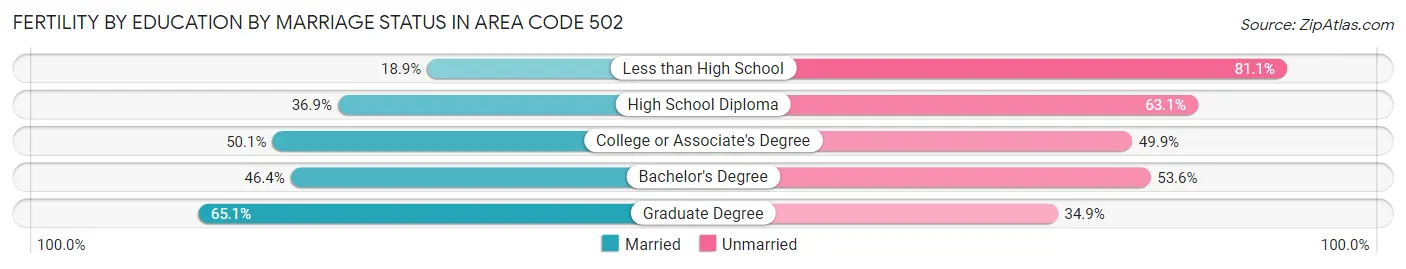
| Educational Attainment | Married | Unmarried |
| Less than High School | 257 (18.9%) | 1,102 (81.1%) |
| High School Diploma | 1,318 (36.9%) | 2,254 (63.1%) |
| College or Associate's Degree | 2,190 (50.1%) | 2,181 (49.9%) |
| Bachelor's Degree | 1,442 (46.4%) | 1,666 (53.6%) |
| Graduate Degree | 1,753 (65.1%) | 940 (34.9%) |
| Total | 8,487 (56.2%) | 6,616 (43.8%) |
Employment Characteristics in Area Code 502
Employment by Class of Employer in Area Code 502
Among the 624,397 employed individuals in Area Code 502, private company employees (439,481 | 70.4%), not-for-profit organizations (49,729 | 8.0%), and local government employees (37,491 | 6.0%) make up the most common classes of employment.
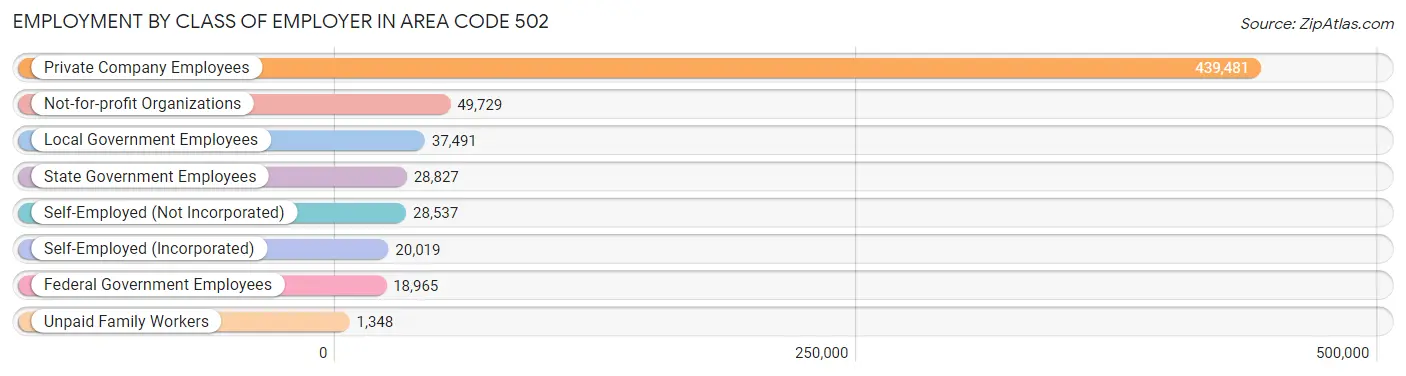
| Employer Class | # Employees | % Employees |
| Private Company Employees | 439,481 | 70.4% |
| Self-Employed (Incorporated) | 20,019 | 3.2% |
| Self-Employed (Not Incorporated) | 28,537 | 4.6% |
| Not-for-profit Organizations | 49,729 | 8.0% |
| Local Government Employees | 37,491 | 6.0% |
| State Government Employees | 28,827 | 4.6% |
| Federal Government Employees | 18,965 | 3.0% |
| Unpaid Family Workers | 1,348 | 0.2% |
| Total | 624,397 | 100.0% |
Employment Status by Age in Area Code 502
According to the labor force statistics for Area Code 502, out of the total population over 16 years of age (1,027,273), 61.9% or 636,293 individuals are in the labor force, with 5.0% or 32,006 of them unemployed. The age group with the highest labor force participation rate is 30 to 34 years, with 86.6% or 76,643 individuals in the labor force. Within the labor force, the 16 to 19 years age range has the highest percentage of unemployed individuals, with 1,098.1% or 325,806 of them being unemployed.
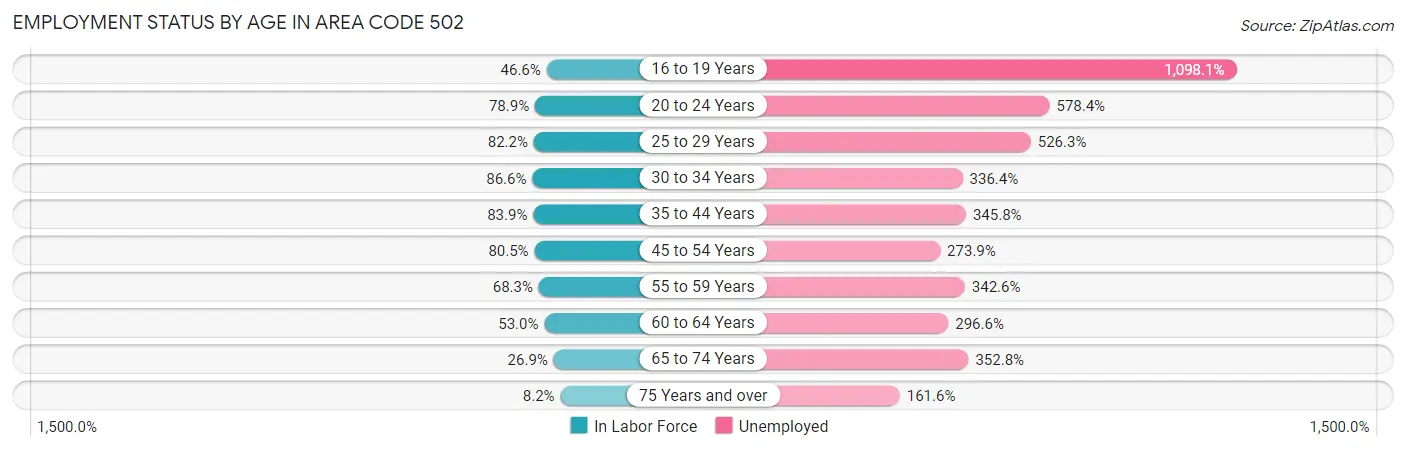
| Age Bracket | In Labor Force | Unemployed |
| 16 to 19 Years | 29,667 (46.6%) | 325,806 (1,098.1%) |
| 20 to 24 Years | 63,032 (78.9%) | 364,600 (578.4%) |
| 25 to 29 Years | 75,185 (82.2%) | 395,683 (526.3%) |
| 30 to 34 Years | 76,647 (86.6%) | 257,827 (336.4%) |
| 35 to 44 Years | 141,165 (83.9%) | 488,121 (345.8%) |
| 45 to 54 Years | 129,907 (80.5%) | 355,821 (273.9%) |
| 55 to 59 Years | 57,877 (68.3%) | 198,280 (342.6%) |
| 60 to 64 Years | 44,540 (53.0%) | 132,115 (296.6%) |
| 65 to 74 Years | 33,834 (26.9%) | 119,363 (352.8%) |
| 75 Years and over | 6,527 (8.2%) | 10,551 (161.6%) |
| Total | 636,259 (61.9%) | 32,008 (5.0%) |
Employment Status by Educational Attainment in Area Code 502
According to labor force statistics for Area Code 502, 75.7% of individuals (513,793) out of the total population between 25 and 64 years of age (678,543) are in the labor force, with 330.3% or 1,697,058 of them being unemployed. The group with the highest labor force participation rate are those with the educational attainment of bachelor's degree or higher, with 87.6% or 200,983 individuals in the labor force. Within the labor force, individuals with less than high school education have the highest percentage of unemployment, with 588.6% or 189,111 of them being unemployed.
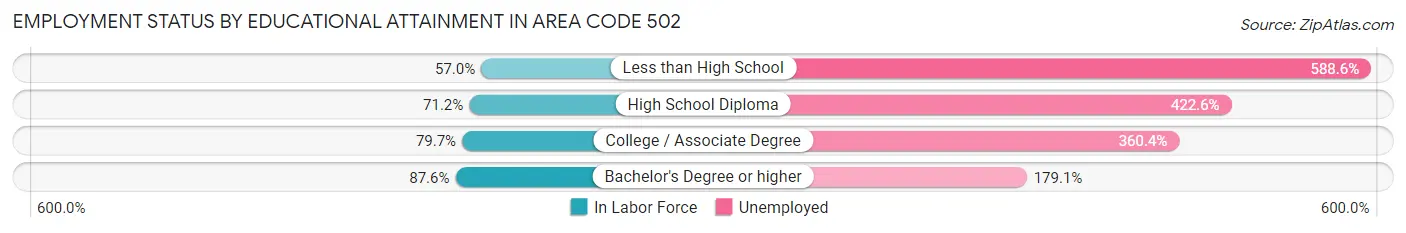
| Educational Attainment | In Labor Force | Unemployed |
| Less than High School | 32,130 (57.0%) | 331,658 (588.6%) |
| High School Diploma | 130,147 (71.2%) | 772,475 (422.6%) |
| College / Associate Degree | 167,441 (79.7%) | 756,833 (360.4%) |
| Bachelor's Degree or higher | 200,990 (87.6%) | 410,868 (179.1%) |
| Total | 513,819 (75.7%) | 2,241,228 (330.3%) |
Employment Occupations by Sex in Area Code 502
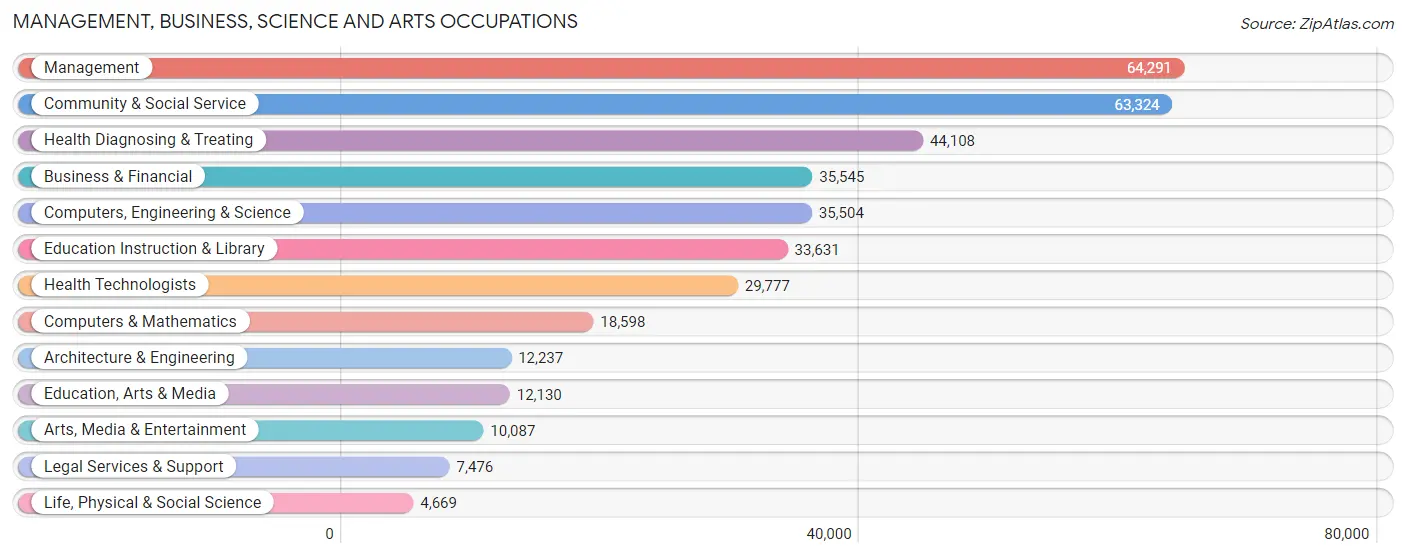
Management, Business, Science and Arts Occupations
The most common Management, Business, Science and Arts occupations in Area Code 502 are Management (64,291 | 10.2%), Community & Social Service (63,324 | 10.0%), Health Diagnosing & Treating (44,108 | 7.0%), Business & Financial (35,545 | 5.6%), and Computers, Engineering & Science (35,504 | 5.6%).
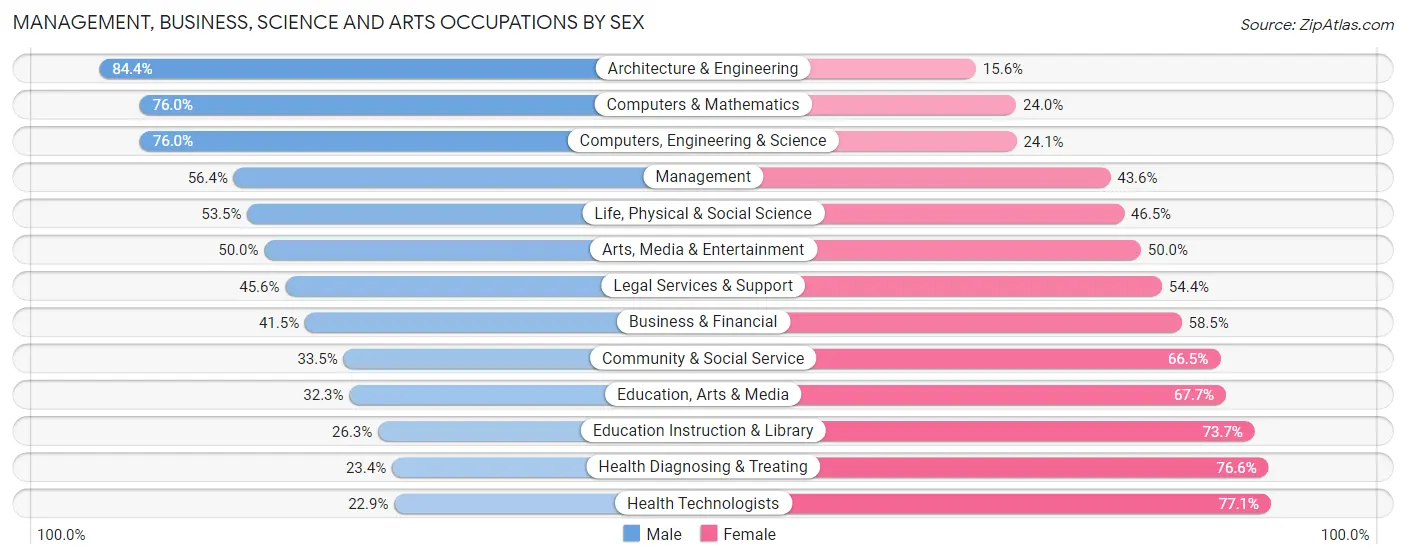
Management, Business, Science and Arts Occupations by Sex
Within the Management, Business, Science and Arts occupations in Area Code 502, the most male-oriented occupations are Architecture & Engineering (84.4%), Computers & Mathematics (76.0%), and Computers, Engineering & Science (75.9%), while the most female-oriented occupations are Health Technologists (77.1%), Health Diagnosing & Treating (76.6%), and Education Instruction & Library (73.7%).
| Occupation | Male | Female |
| Management | 36,238 (56.4%) | 28,053 (43.6%) |
| Business & Financial | 14,753 (41.5%) | 20,792 (58.5%) |
| Computers, Engineering & Science | 26,967 (75.9%) | 8,537 (24.0%) |
| Computers & Mathematics | 14,138 (76.0%) | 4,460 (24.0%) |
| Architecture & Engineering | 10,329 (84.4%) | 1,908 (15.6%) |
| Life, Physical & Social Science | 2,500 (53.5%) | 2,169 (46.5%) |
| Community & Social Service | 21,198 (33.5%) | 42,126 (66.5%) |
| Education, Arts & Media | 3,913 (32.3%) | 8,217 (67.7%) |
| Legal Services & Support | 3,410 (45.6%) | 4,066 (54.4%) |
| Education Instruction & Library | 8,832 (26.3%) | 24,799 (73.7%) |
| Arts, Media & Entertainment | 5,043 (50.0%) | 5,044 (50.0%) |
| Health Diagnosing & Treating | 10,305 (23.4%) | 33,803 (76.6%) |
| Health Technologists | 6,817 (22.9%) | 22,960 (77.1%) |
| Total (Category) | 109,461 (45.1%) | 133,311 (54.9%) |
| Total (Overall) | 327,410 (51.8%) | 304,685 (48.2%) |
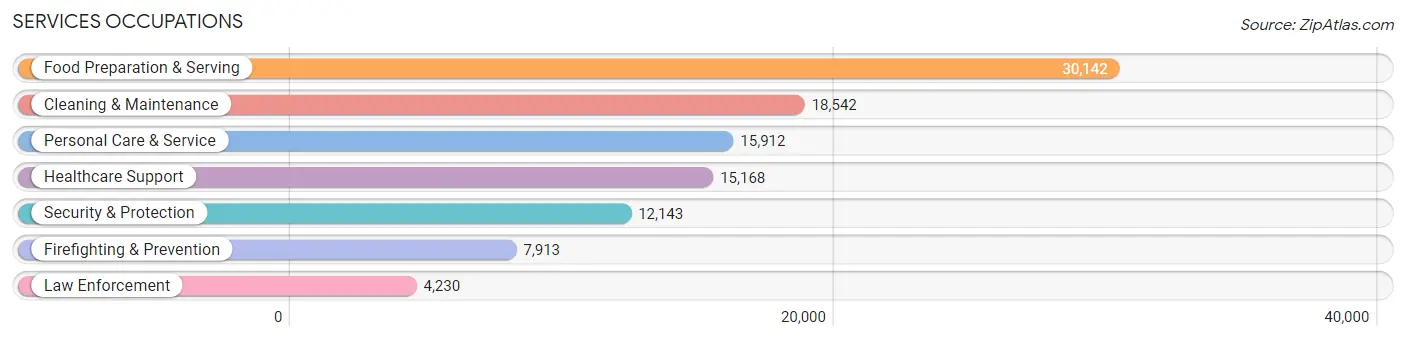
Services Occupations
The most common Services occupations in Area Code 502 are Food Preparation & Serving (30,142 | 4.8%), Cleaning & Maintenance (18,542 | 2.9%), Personal Care & Service (15,912 | 2.5%), Healthcare Support (15,168 | 2.4%), and Security & Protection (12,143 | 1.9%).
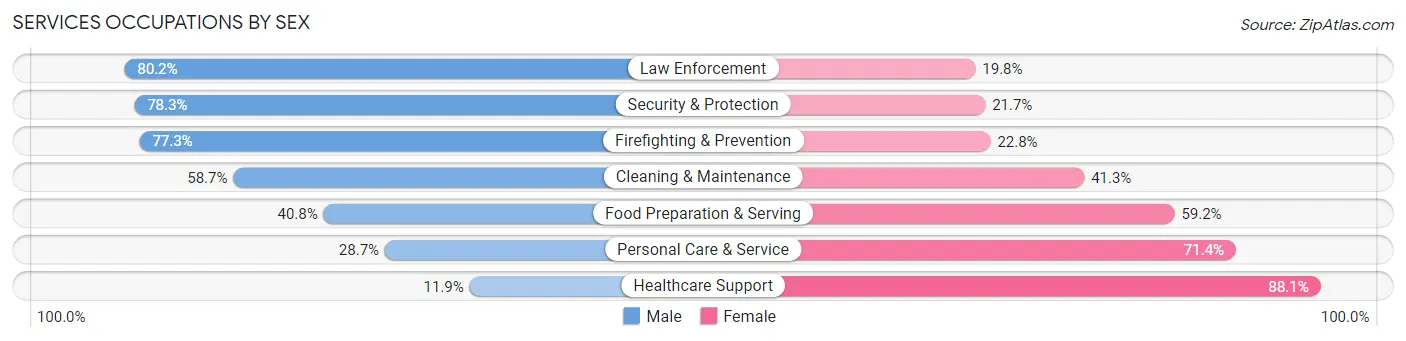
Services Occupations by Sex
Within the Services occupations in Area Code 502, the most male-oriented occupations are Law Enforcement (80.2%), Security & Protection (78.3%), and Firefighting & Prevention (77.2%), while the most female-oriented occupations are Healthcare Support (88.1%), Personal Care & Service (71.4%), and Food Preparation & Serving (59.2%).
| Occupation | Male | Female |
| Healthcare Support | 1,804 (11.9%) | 13,364 (88.1%) |
| Security & Protection | 9,507 (78.3%) | 2,636 (21.7%) |
| Firefighting & Prevention | 6,113 (77.2%) | 1,800 (22.8%) |
| Law Enforcement | 3,394 (80.2%) | 836 (19.8%) |
| Food Preparation & Serving | 12,301 (40.8%) | 17,841 (59.2%) |
| Cleaning & Maintenance | 10,881 (58.7%) | 7,661 (41.3%) |
| Personal Care & Service | 4,558 (28.6%) | 11,354 (71.4%) |
| Total (Category) | 39,051 (42.5%) | 52,856 (57.5%) |
| Total (Overall) | 327,410 (51.8%) | 304,685 (48.2%) |
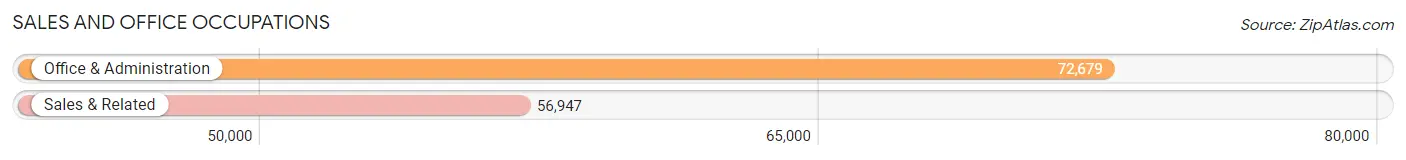
Sales and Office Occupations
The most common Sales and Office occupations in Area Code 502 are Office & Administration (72,679 | 11.5%), and Sales & Related (56,947 | 9.0%).
Sales and Office Occupations by Sex
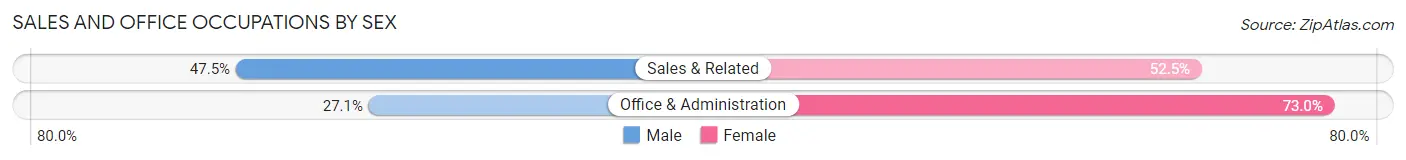
| Occupation | Male | Female |
| Sales & Related | 27,046 (47.5%) | 29,901 (52.5%) |
| Office & Administration | 19,659 (27.1%) | 53,020 (73.0%) |
| Total (Category) | 46,705 (36.0%) | 82,921 (64.0%) |
| Total (Overall) | 327,410 (51.8%) | 304,685 (48.2%) |
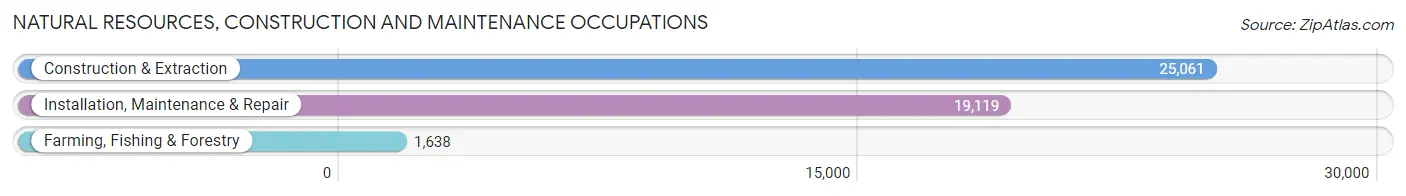
Natural Resources, Construction and Maintenance Occupations
The most common Natural Resources, Construction and Maintenance occupations in Area Code 502 are Construction & Extraction (25,061 | 4.0%), Installation, Maintenance & Repair (19,119 | 3.0%), and Farming, Fishing & Forestry (1,638 | 0.3%).
Natural Resources, Construction and Maintenance Occupations by Sex
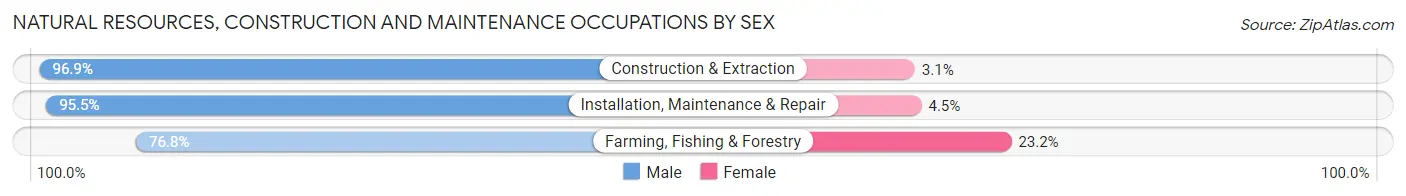
| Occupation | Male | Female |
| Farming, Fishing & Forestry | 1,258 (76.8%) | 380 (23.2%) |
| Construction & Extraction | 24,280 (96.9%) | 781 (3.1%) |
| Installation, Maintenance & Repair | 18,258 (95.5%) | 861 (4.5%) |
| Total (Category) | 43,796 (95.6%) | 2,022 (4.4%) |
| Total (Overall) | 327,410 (51.8%) | 304,685 (48.2%) |
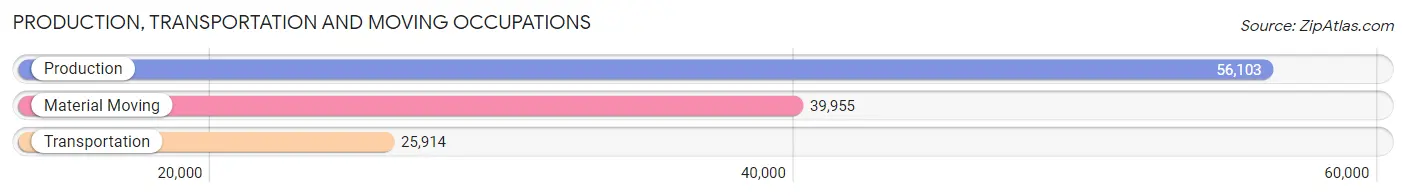
Production, Transportation and Moving Occupations
The most common Production, Transportation and Moving occupations in Area Code 502 are Production (56,103 | 8.9%), Material Moving (39,955 | 6.3%), and Transportation (25,914 | 4.1%).
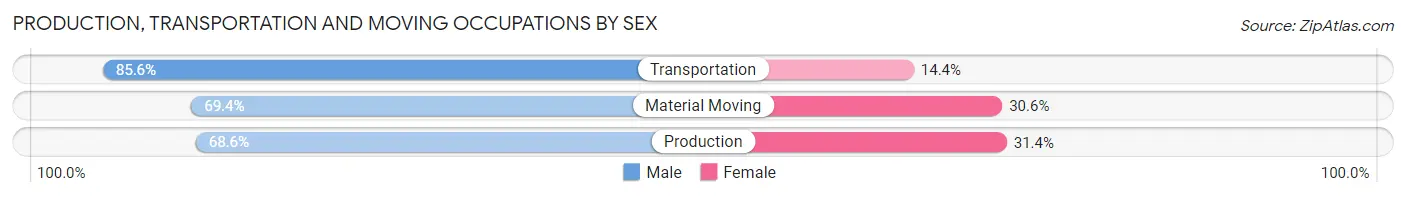
Production, Transportation and Moving Occupations by Sex
| Occupation | Male | Female |
| Production | 38,475 (68.6%) | 17,628 (31.4%) |
| Transportation | 22,191 (85.6%) | 3,723 (14.4%) |
| Material Moving | 27,731 (69.4%) | 12,224 (30.6%) |
| Total (Category) | 88,397 (72.5%) | 33,575 (27.5%) |
| Total (Overall) | 327,410 (51.8%) | 304,685 (48.2%) |
Employment Industries by Sex in Area Code 502
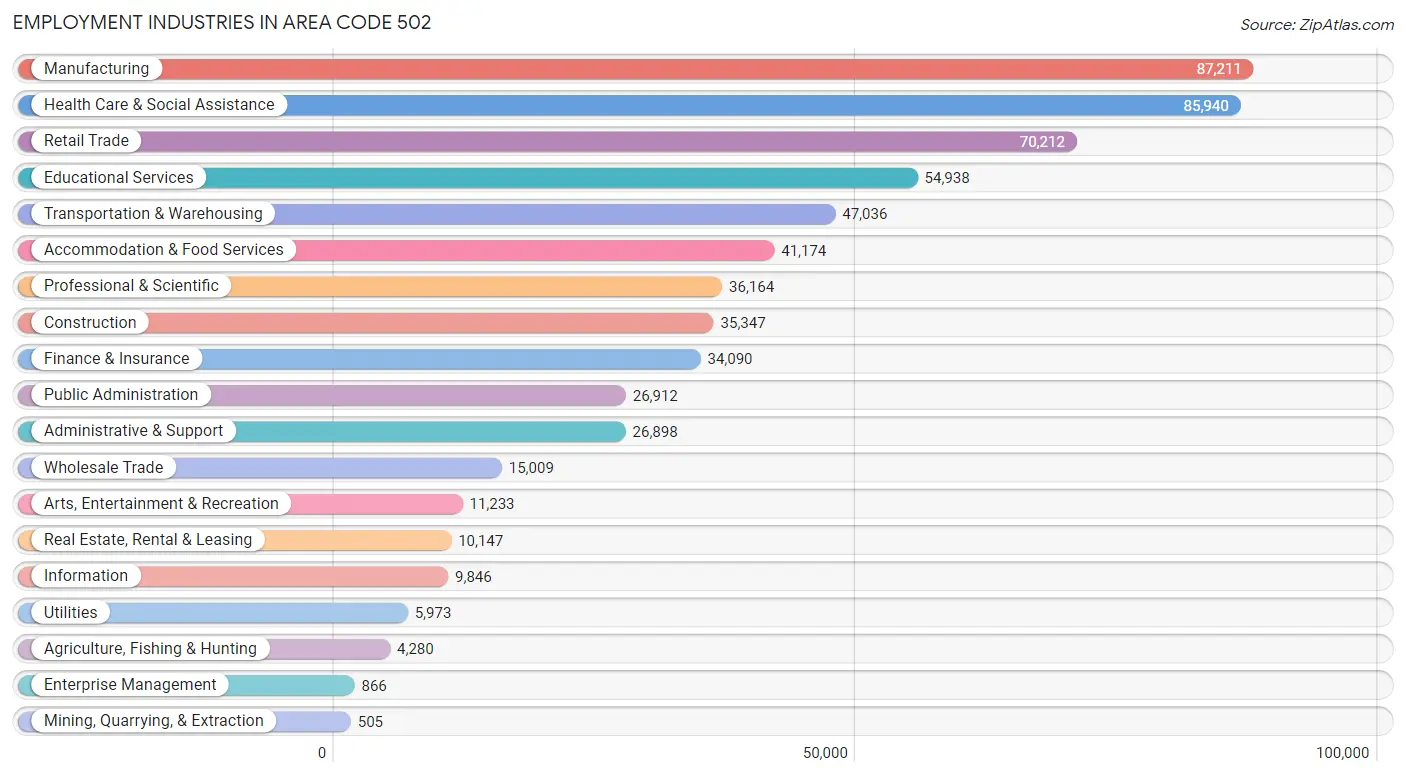
Employment Industries in Area Code 502
The major employment industries in Area Code 502 include Manufacturing (87,211 | 13.8%), Health Care & Social Assistance (85,940 | 13.6%), Retail Trade (70,212 | 11.1%), Educational Services (54,938 | 8.7%), and Transportation & Warehousing (47,036 | 7.4%).
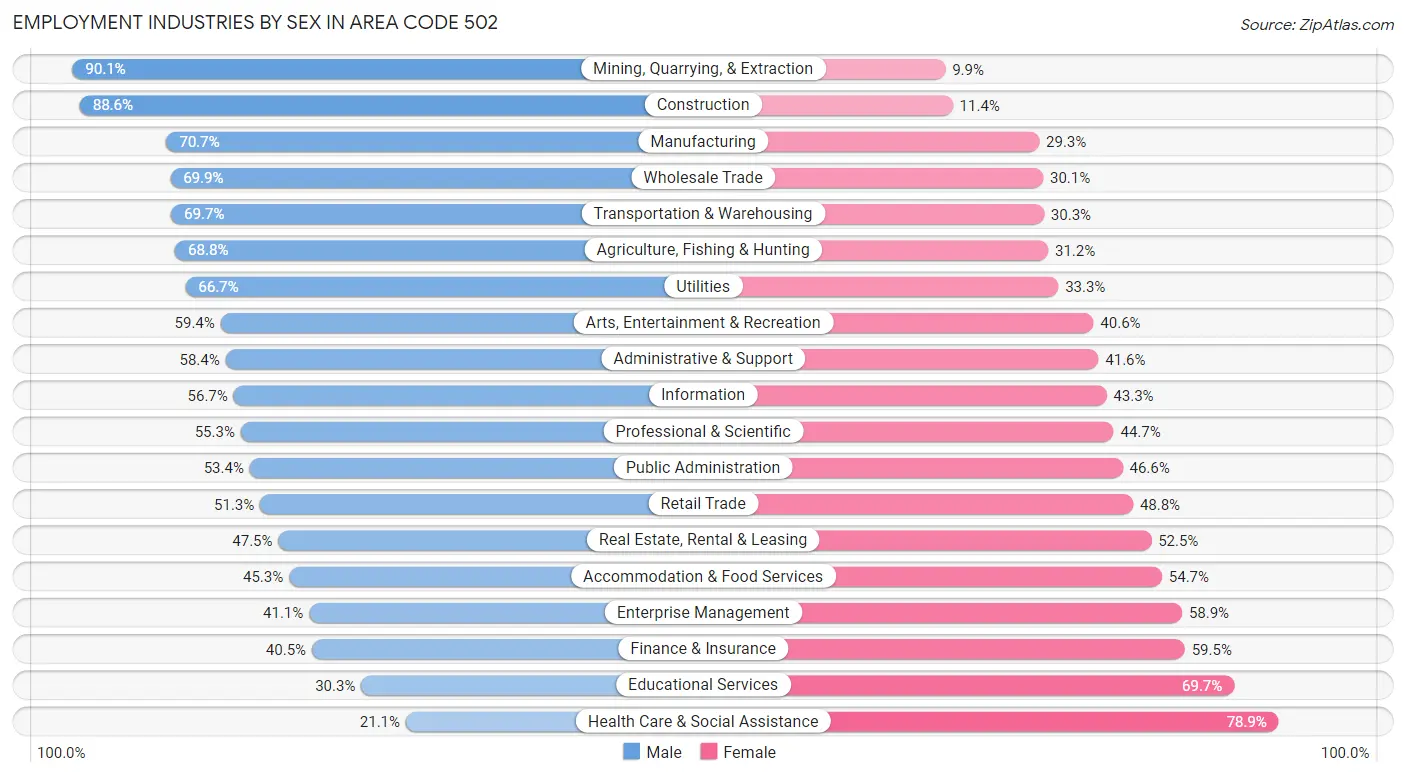
Employment Industries by Sex in Area Code 502
The Area Code 502 industries that see more men than women are Mining, Quarrying, & Extraction (90.1%), Construction (88.6%), and Manufacturing (70.7%), whereas the industries that tend to have a higher number of women are Health Care & Social Assistance (78.9%), Educational Services (69.7%), and Finance & Insurance (59.5%).
| Industry | Male | Female |
| Agriculture, Fishing & Hunting | 2,946 (68.8%) | 1,334 (31.2%) |
| Mining, Quarrying, & Extraction | 455 (90.1%) | 50 (9.9%) |
| Construction | 31,308 (88.6%) | 4,039 (11.4%) |
| Manufacturing | 61,629 (70.7%) | 25,582 (29.3%) |
| Wholesale Trade | 10,485 (69.9%) | 4,524 (30.1%) |
| Retail Trade | 35,985 (51.2%) | 34,227 (48.7%) |
| Transportation & Warehousing | 32,777 (69.7%) | 14,259 (30.3%) |
| Utilities | 3,985 (66.7%) | 1,988 (33.3%) |
| Information | 5,587 (56.7%) | 4,259 (43.3%) |
| Finance & Insurance | 13,815 (40.5%) | 20,275 (59.5%) |
| Real Estate, Rental & Leasing | 4,817 (47.5%) | 5,330 (52.5%) |
| Professional & Scientific | 19,984 (55.3%) | 16,180 (44.7%) |
| Enterprise Management | 356 (41.1%) | 510 (58.9%) |
| Administrative & Support | 15,711 (58.4%) | 11,187 (41.6%) |
| Educational Services | 16,659 (30.3%) | 38,279 (69.7%) |
| Health Care & Social Assistance | 18,121 (21.1%) | 67,819 (78.9%) |
| Arts, Entertainment & Recreation | 6,676 (59.4%) | 4,557 (40.6%) |
| Accommodation & Food Services | 18,637 (45.3%) | 22,537 (54.7%) |
| Public Administration | 14,372 (53.4%) | 12,540 (46.6%) |
| Total | 327,410 (51.8%) | 304,685 (48.2%) |
Education in Area Code 502
School Enrollment in Area Code 502
The most common levels of schooling among the 294,037 students in Area Code 502 are middle school (66,757 | 22.7%), high school (64,737 | 22.0%), and elementary school (60,216 | 20.5%).
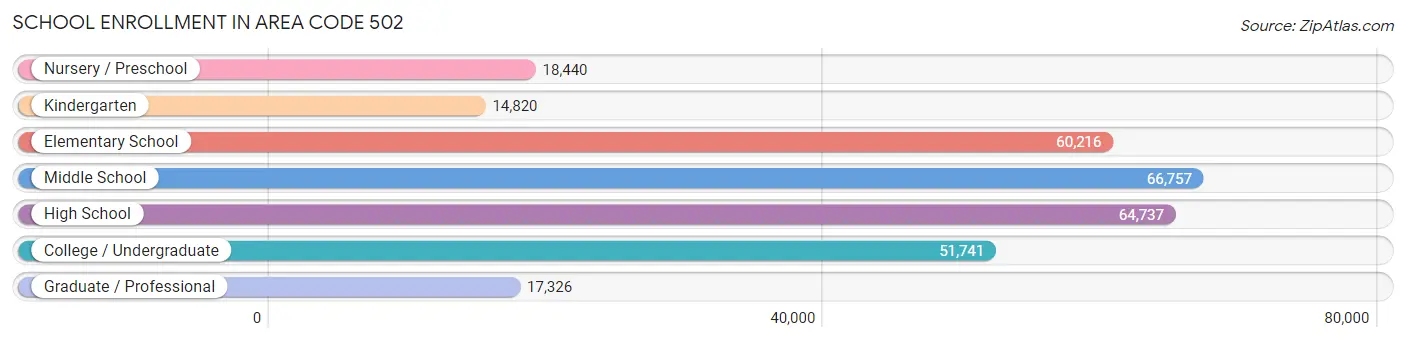
| School Level | # Students | % Students |
| Nursery / Preschool | 18,440 | 6.3% |
| Kindergarten | 14,820 | 5.0% |
| Elementary School | 60,216 | 20.5% |
| Middle School | 66,757 | 22.7% |
| High School | 64,737 | 22.0% |
| College / Undergraduate | 51,741 | 17.6% |
| Graduate / Professional | 17,326 | 5.9% |
| Total | 294,037 | 100.0% |
School Enrollment by Age by Funding Source in Area Code 502
Out of a total of 294,037 students who are enrolled in schools in Area Code 502, 63,655 (21.6%) attend a private institution, while the remaining 230,382 (78.3%) are enrolled in public schools. The age group of 3 to 4 year olds has the highest likelihood of being enrolled in private schools, with 5,887 (45.0% in the age bracket) enrolled. Conversely, the age group of 10 to 14 year olds has the lowest likelihood of being enrolled in a private school, with 67,714 (83.6% in the age bracket) attending a public institution.
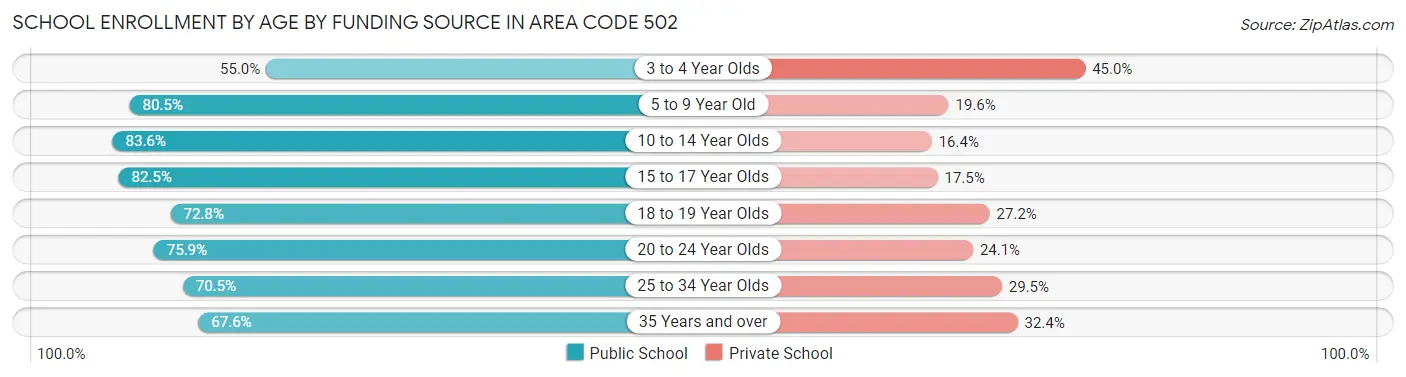
| Age Bracket | Public School | Private School |
| 3 to 4 Year Olds | 7,197 (55.0%) | 5,887 (45.0%) |
| 5 to 9 Year Old | 59,457 (80.4%) | 14,447 (19.6%) |
| 10 to 14 Year Olds | 67,714 (83.6%) | 13,284 (16.4%) |
| 15 to 17 Year Olds | 39,060 (82.5%) | 8,283 (17.5%) |
| 18 to 19 Year Olds | 14,024 (72.8%) | 5,237 (27.2%) |
| 20 to 24 Year Olds | 20,234 (75.9%) | 6,416 (24.1%) |
| 25 to 34 Year Olds | 12,943 (70.5%) | 5,409 (29.5%) |
| 35 Years and over | 9,767 (67.6%) | 4,678 (32.4%) |
| Total | 230,382 (78.3%) | 63,655 (21.6%) |
Educational Attainment by Field of Study in Area Code 502
Business (61,665 | 20.2%), science & technology (34,002 | 11.1%), education (33,030 | 10.8%), social sciences (20,933 | 6.9%), and arts & humanities (20,681 | 6.8%) are the most common fields of study among 305,568 individuals in Area Code 502 who have obtained a bachelor's degree or higher.
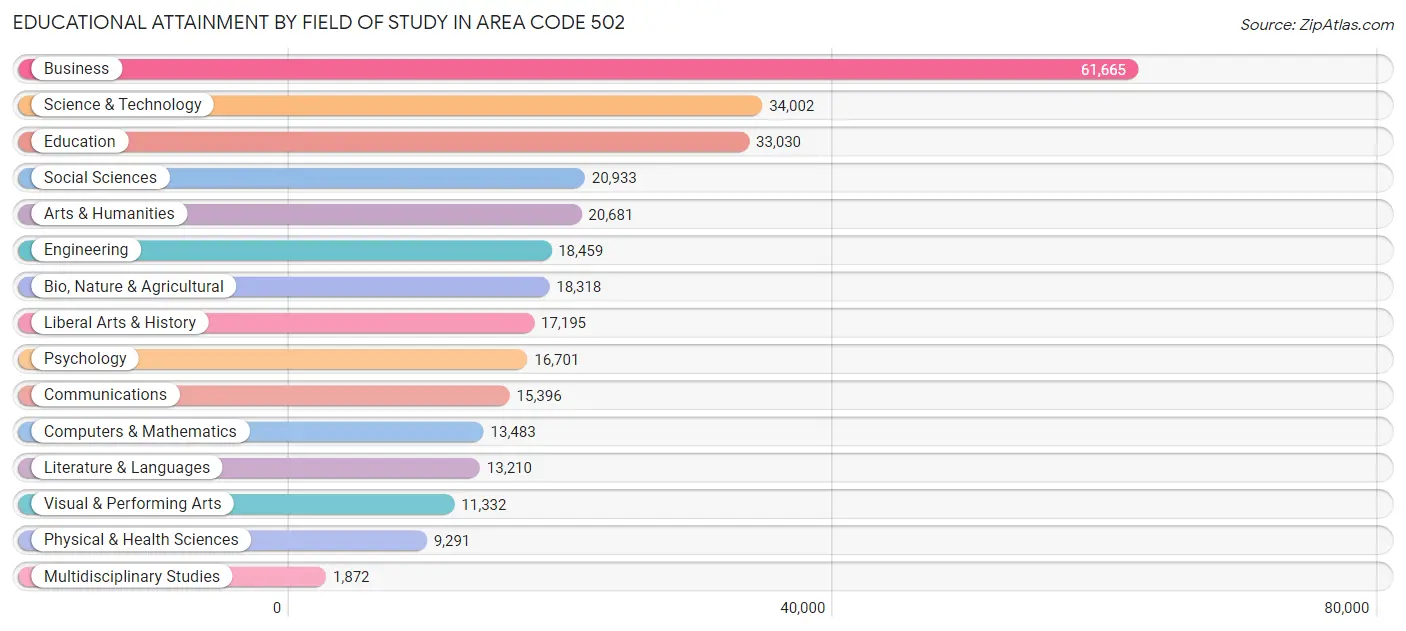
| Field of Study | # Graduates | % Graduates |
| Computers & Mathematics | 13,483 | 4.4% |
| Bio, Nature & Agricultural | 18,318 | 6.0% |
| Physical & Health Sciences | 9,291 | 3.0% |
| Psychology | 16,701 | 5.5% |
| Social Sciences | 20,933 | 6.9% |
| Engineering | 18,459 | 6.0% |
| Multidisciplinary Studies | 1,872 | 0.6% |
| Science & Technology | 34,002 | 11.1% |
| Business | 61,665 | 20.2% |
| Education | 33,030 | 10.8% |
| Literature & Languages | 13,210 | 4.3% |
| Liberal Arts & History | 17,195 | 5.6% |
| Visual & Performing Arts | 11,332 | 3.7% |
| Communications | 15,396 | 5.0% |
| Arts & Humanities | 20,681 | 6.8% |
| Total | 305,568 | 100.0% |
Transportation & Commute in Area Code 502
Vehicle Availability by Sex in Area Code 502
The most prevalent vehicle ownership categories in Area Code 502 are males with 2 vehicles (142,908, accounting for 44.4%) and females with 2 vehicles (123,821, making up 48.2%).
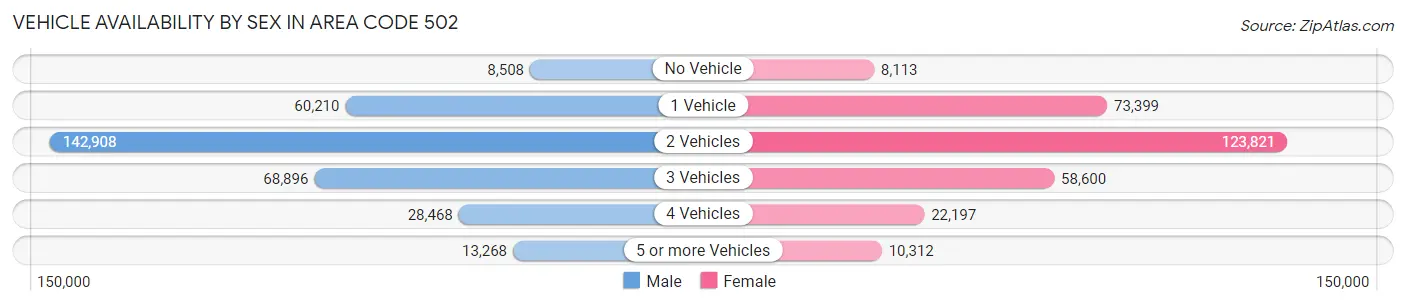
| Vehicles Available | Male | Female |
| No Vehicle | 8,508 (2.6%) | 8,113 (2.7%) |
| 1 Vehicle | 60,210 (18.7%) | 73,399 (24.8%) |
| 2 Vehicles | 142,908 (44.4%) | 123,821 (41.8%) |
| 3 Vehicles | 68,896 (21.4%) | 58,600 (19.8%) |
| 4 Vehicles | 28,468 (8.8%) | 22,197 (7.5%) |
| 5 or more Vehicles | 13,268 (4.1%) | 10,312 (3.5%) |
| Total | 322,258 (100.0%) | 296,442 (100.0%) |
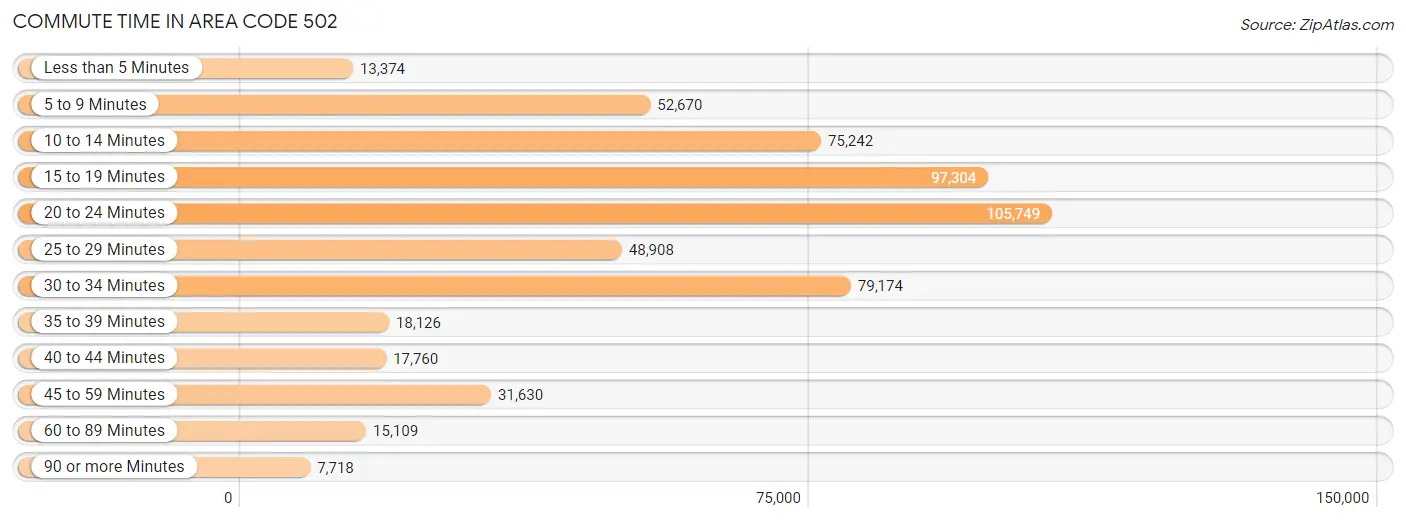
Commute Time in Area Code 502
The most frequently occuring commute durations in Area Code 502 are 20 to 24 minutes (105,749 commuters, 18.8%), 15 to 19 minutes (97,304 commuters, 17.3%), and 30 to 34 minutes (79,174 commuters, 14.1%).
| Commute Time | # Commuters | % Commuters |
| Less than 5 Minutes | 13,374 | 2.4% |
| 5 to 9 Minutes | 52,670 | 9.4% |
| 10 to 14 Minutes | 75,242 | 13.4% |
| 15 to 19 Minutes | 97,304 | 17.3% |
| 20 to 24 Minutes | 105,749 | 18.8% |
| 25 to 29 Minutes | 48,908 | 8.7% |
| 30 to 34 Minutes | 79,174 | 14.1% |
| 35 to 39 Minutes | 18,126 | 3.2% |
| 40 to 44 Minutes | 17,760 | 3.2% |
| 45 to 59 Minutes | 31,630 | 5.6% |
| 60 to 89 Minutes | 15,109 | 2.7% |
| 90 or more Minutes | 7,718 | 1.4% |
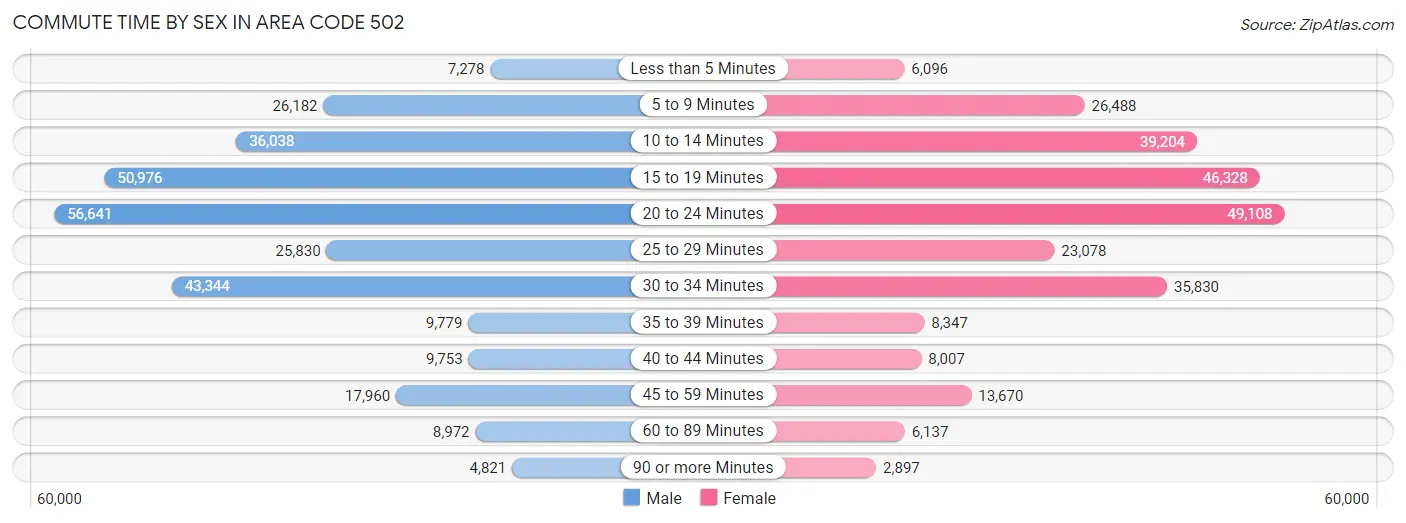
Commute Time by Sex in Area Code 502
The most common commute times in Area Code 502 are 20 to 24 minutes (56,641 commuters, 19.0%) for males and 20 to 24 minutes (49,108 commuters, 18.5%) for females.
| Commute Time | Male | Female |
| Less than 5 Minutes | 7,278 (2.5%) | 6,096 (2.3%) |
| 5 to 9 Minutes | 26,182 (8.8%) | 26,488 (10.0%) |
| 10 to 14 Minutes | 36,038 (12.1%) | 39,204 (14.8%) |
| 15 to 19 Minutes | 50,976 (17.1%) | 46,328 (17.5%) |
| 20 to 24 Minutes | 56,641 (19.0%) | 49,108 (18.5%) |
| 25 to 29 Minutes | 25,830 (8.7%) | 23,078 (8.7%) |
| 30 to 34 Minutes | 43,344 (14.6%) | 35,830 (13.5%) |
| 35 to 39 Minutes | 9,779 (3.3%) | 8,347 (3.2%) |
| 40 to 44 Minutes | 9,753 (3.3%) | 8,007 (3.0%) |
| 45 to 59 Minutes | 17,960 (6.0%) | 13,670 (5.1%) |
| 60 to 89 Minutes | 8,972 (3.0%) | 6,137 (2.3%) |
| 90 or more Minutes | 4,821 (1.6%) | 2,897 (1.1%) |
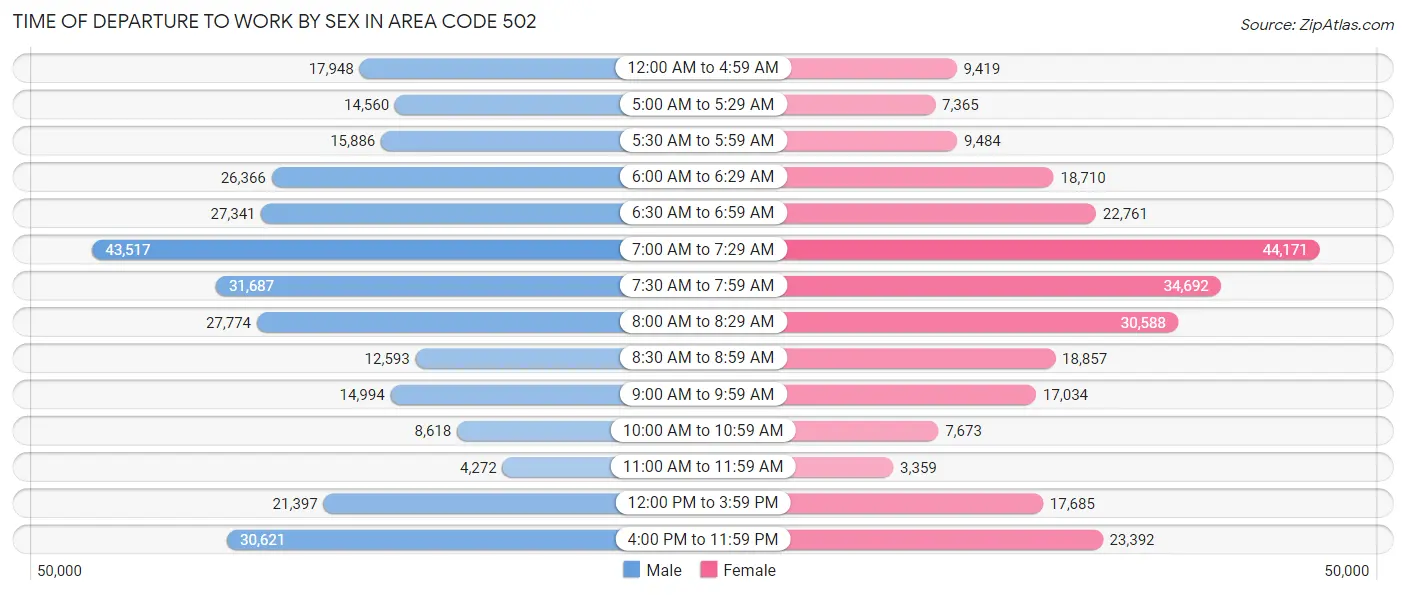
Time of Departure to Work by Sex in Area Code 502
The most frequent times of departure to work in Area Code 502 are 7:00 AM to 7:29 AM (43,517, 14.6%) for males and 7:00 AM to 7:29 AM (44,171, 16.7%) for females.
| Time of Departure | Male | Female |
| 12:00 AM to 4:59 AM | 17,948 (6.0%) | 9,419 (3.5%) |
| 5:00 AM to 5:29 AM | 14,560 (4.9%) | 7,365 (2.8%) |
| 5:30 AM to 5:59 AM | 15,886 (5.3%) | 9,484 (3.6%) |
| 6:00 AM to 6:29 AM | 26,366 (8.9%) | 18,710 (7.1%) |
| 6:30 AM to 6:59 AM | 27,341 (9.2%) | 22,761 (8.6%) |
| 7:00 AM to 7:29 AM | 43,517 (14.6%) | 44,171 (16.7%) |
| 7:30 AM to 7:59 AM | 31,687 (10.6%) | 34,692 (13.1%) |
| 8:00 AM to 8:29 AM | 27,774 (9.3%) | 30,588 (11.5%) |
| 8:30 AM to 8:59 AM | 12,593 (4.2%) | 18,857 (7.1%) |
| 9:00 AM to 9:59 AM | 14,994 (5.0%) | 17,034 (6.4%) |
| 10:00 AM to 10:59 AM | 8,618 (2.9%) | 7,673 (2.9%) |
| 11:00 AM to 11:59 AM | 4,272 (1.4%) | 3,359 (1.3%) |
| 12:00 PM to 3:59 PM | 21,397 (7.2%) | 17,685 (6.7%) |
| 4:00 PM to 11:59 PM | 30,621 (10.3%) | 23,392 (8.8%) |
| Total | 297,574 (100.0%) | 265,190 (100.0%) |
Housing Occupancy in Area Code 502
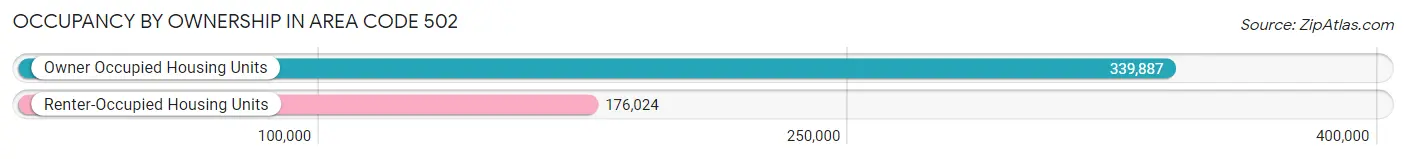
Occupancy by Ownership in Area Code 502
Of the total 515,911 dwellings in Area Code 502, owner-occupied units account for 339,887 (65.9%), while renter-occupied units make up 176,024 (34.1%).
| Occupancy | # Housing Units | % Housing Units |
| Owner Occupied Housing Units | 339,887 | 65.9% |
| Renter-Occupied Housing Units | 176,024 | 34.1% |
| Total Occupied Housing Units | 515,911 | 100.0% |
Occupancy by Household Size in Area Code 502
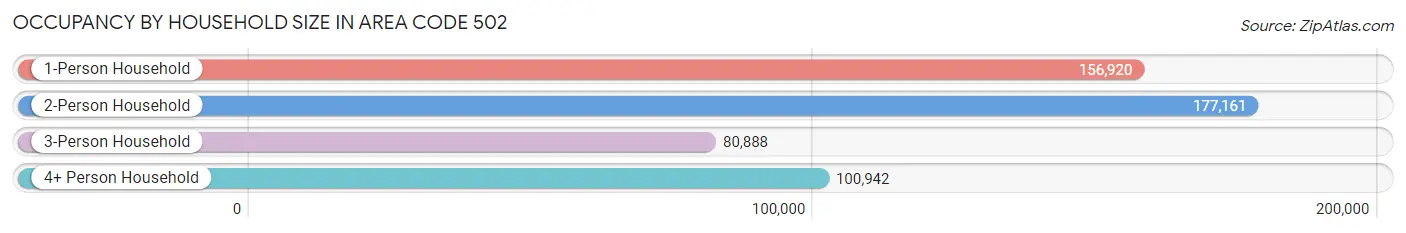
| Household Size | # Housing Units | % Housing Units |
| 1-Person Household | 156,920 | 30.4% |
| 2-Person Household | 177,161 | 34.3% |
| 3-Person Household | 80,888 | 15.7% |
| 4+ Person Household | 100,942 | 19.6% |
| Total Housing Units | 515,911 | 100.0% |
Occupancy by Ownership by Household Size in Area Code 502
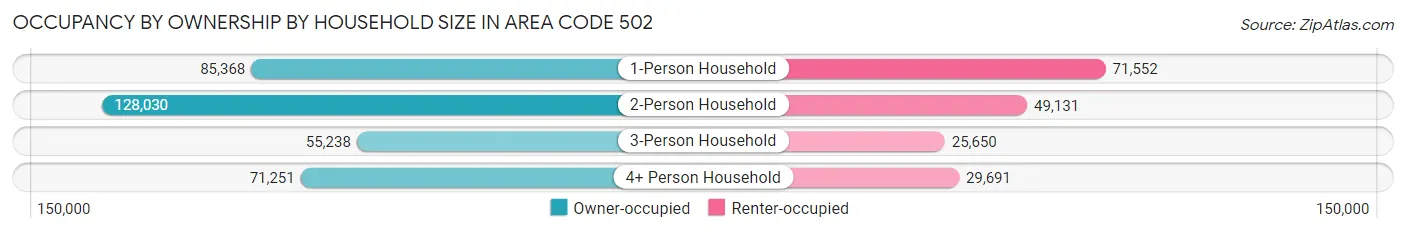
| Household Size | Owner-occupied | Renter-occupied |
| 1-Person Household | 85,368 (54.4%) | 71,552 (45.6%) |
| 2-Person Household | 128,030 (72.3%) | 49,131 (27.7%) |
| 3-Person Household | 55,238 (68.3%) | 25,650 (31.7%) |
| 4+ Person Household | 71,251 (70.6%) | 29,691 (29.4%) |
| Total Housing Units | 339,887 (65.9%) | 176,024 (34.1%) |
Occupancy by Educational Attainment in Area Code 502
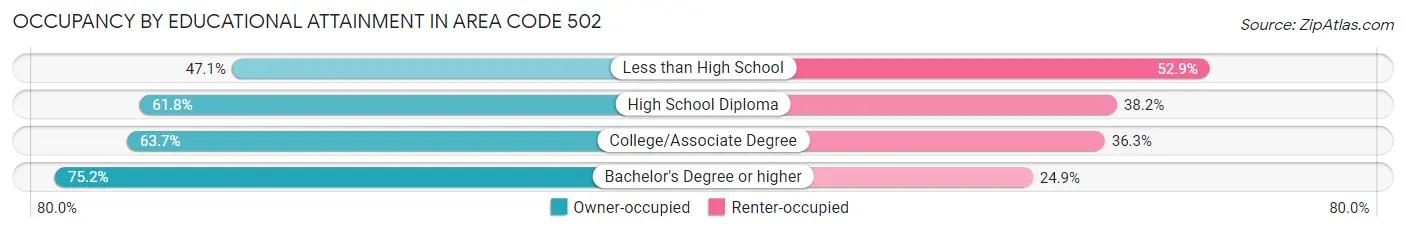
| Household Size | Owner-occupied | Renter-occupied |
| Less than High School | 18,726 (47.1%) | 20,999 (52.9%) |
| High School Diploma | 83,692 (61.8%) | 51,722 (38.2%) |
| College/Associate Degree | 103,966 (63.7%) | 59,156 (36.3%) |
| Bachelor's Degree or higher | 133,503 (75.1%) | 44,147 (24.8%) |
Occupancy by Age of Householder in Area Code 502
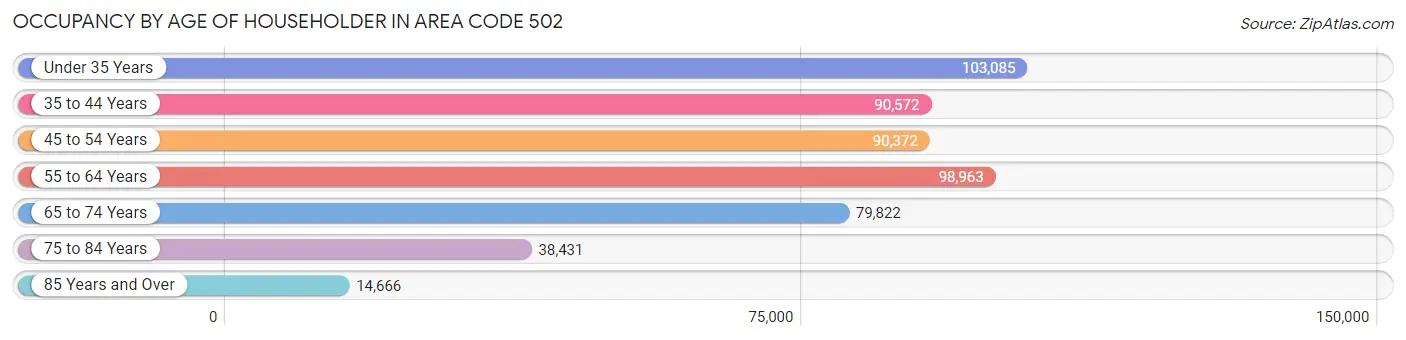
| Age Bracket | # Households | % Households |
| Under 35 Years | 103,085 | 20.0% |
| 35 to 44 Years | 90,572 | 17.6% |
| 45 to 54 Years | 90,372 | 17.5% |
| 55 to 64 Years | 98,963 | 19.2% |
| 65 to 74 Years | 79,822 | 15.5% |
| 75 to 84 Years | 38,431 | 7.4% |
| 85 Years and Over | 14,666 | 2.8% |
| Total | 515,911 | 100.0% |
Housing Finances in Area Code 502
Median Income by Occupancy in Area Code 502
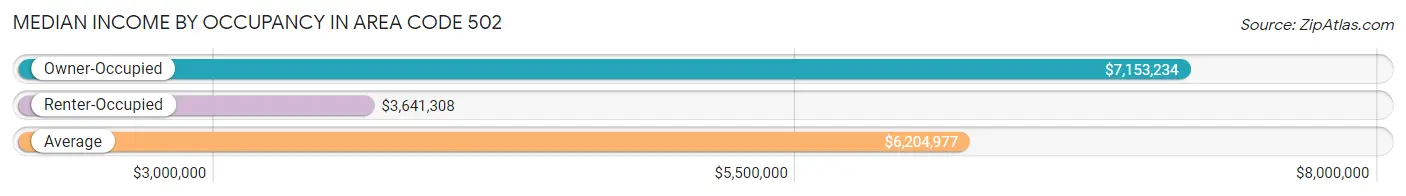
| Occupancy Type | # Households | Median Income |
| Owner-Occupied | 339,887 (65.9%) | $7,153,234 |
| Renter-Occupied | 176,024 (34.1%) | $3,641,308 |
| Average | 515,911 (100.0%) | $6,204,977 |
Occupancy by Householder Income Bracket in Area Code 502
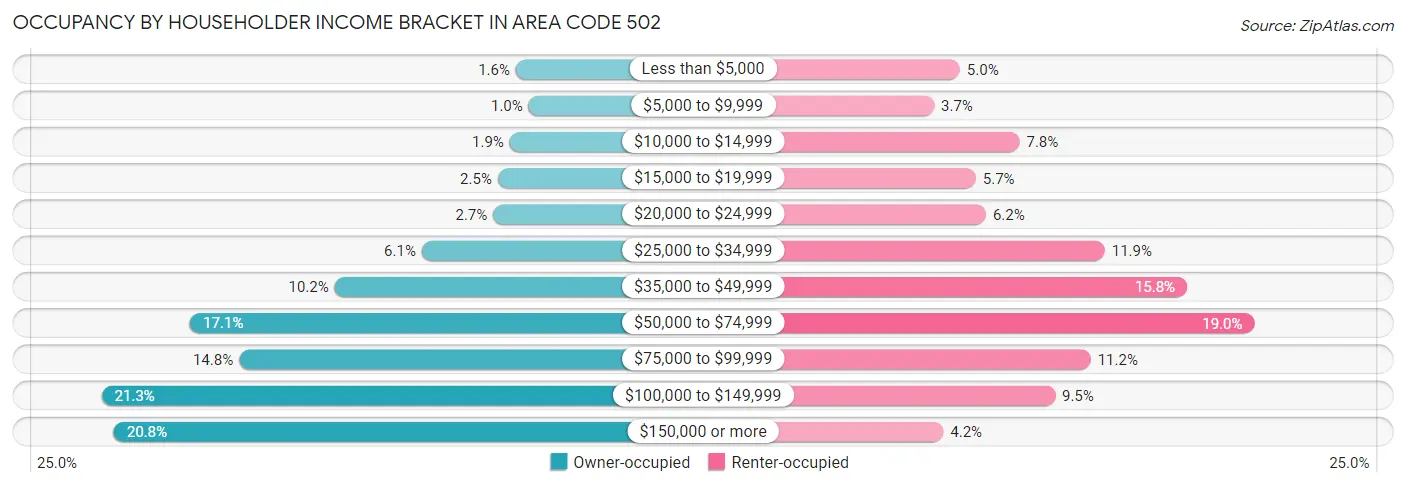
| Income Bracket | Owner-occupied | Renter-occupied |
| Less than $5,000 | 5,480 (1.6%) | 8,755 (5.0%) |
| $5,000 to $9,999 | 3,394 (1.0%) | 6,591 (3.7%) |
| $10,000 to $14,999 | 6,452 (1.9%) | 13,756 (7.8%) |
| $15,000 to $19,999 | 8,398 (2.5%) | 10,088 (5.7%) |
| $20,000 to $24,999 | 9,128 (2.7%) | 10,935 (6.2%) |
| $25,000 to $34,999 | 20,698 (6.1%) | 20,898 (11.9%) |
| $35,000 to $49,999 | 34,807 (10.2%) | 27,778 (15.8%) |
| $50,000 to $74,999 | 58,193 (17.1%) | 33,430 (19.0%) |
| $75,000 to $99,999 | 50,283 (14.8%) | 19,706 (11.2%) |
| $100,000 to $149,999 | 72,516 (21.3%) | 16,726 (9.5%) |
| $150,000 or more | 70,538 (20.7%) | 7,361 (4.2%) |
| Total | 339,887 (100.0%) | 176,024 (100.0%) |
Monthly Housing Cost Tiers in Area Code 502
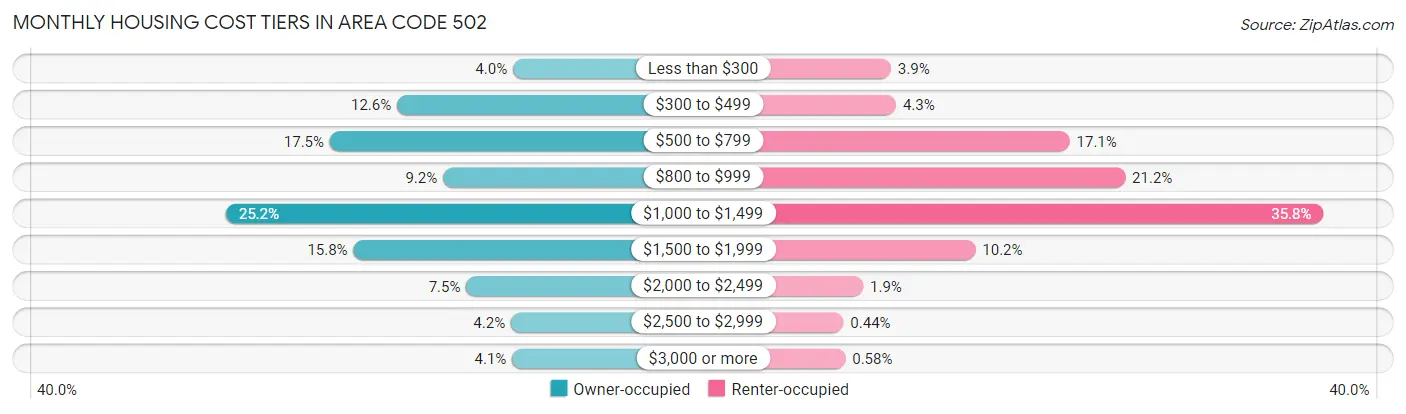
| Monthly Cost | Owner-occupied | Renter-occupied |
| Less than $300 | 13,704 (4.0%) | 6,928 (3.9%) |
| $300 to $499 | 42,708 (12.6%) | 7,582 (4.3%) |
| $500 to $799 | 59,540 (17.5%) | 30,092 (17.1%) |
| $800 to $999 | 31,214 (9.2%) | 37,296 (21.2%) |
| $1,000 to $1,499 | 85,594 (25.2%) | 62,977 (35.8%) |
| $1,500 to $1,999 | 53,621 (15.8%) | 17,879 (10.2%) |
| $2,000 to $2,499 | 25,399 (7.5%) | 3,319 (1.9%) |
| $2,500 to $2,999 | 14,203 (4.2%) | 780 (0.4%) |
| $3,000 or more | 13,904 (4.1%) | 1,026 (0.6%) |
| Total | 339,887 (100.0%) | 176,024 (100.0%) |
Physical Housing Characteristics in Area Code 502
Housing Structures in Area Code 502
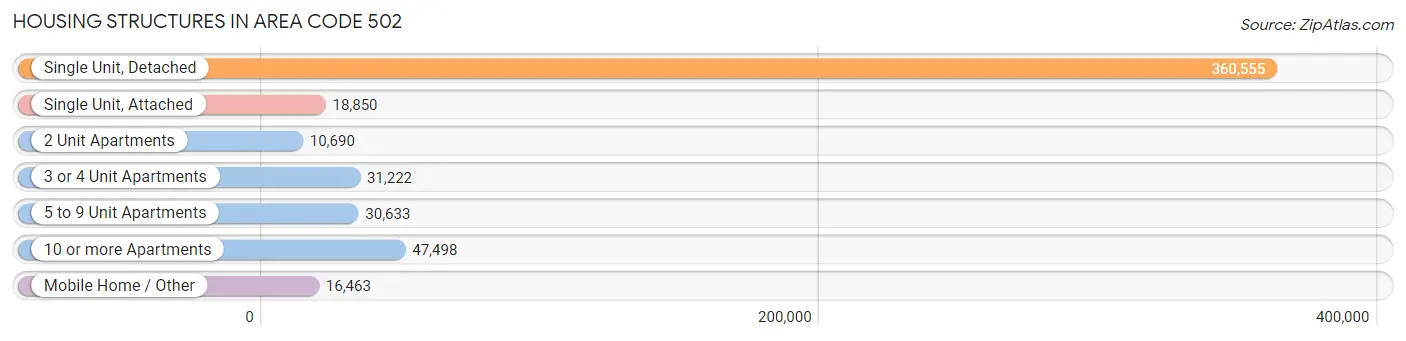
| Structure Type | # Housing Units | % Housing Units |
| Single Unit, Detached | 360,555 | 69.9% |
| Single Unit, Attached | 18,850 | 3.6% |
| 2 Unit Apartments | 10,690 | 2.1% |
| 3 or 4 Unit Apartments | 31,222 | 6.0% |
| 5 to 9 Unit Apartments | 30,633 | 5.9% |
| 10 or more Apartments | 47,498 | 9.2% |
| Mobile Home / Other | 16,463 | 3.2% |
| Total | 515,911 | 100.0% |
Housing Structures by Occupancy in Area Code 502
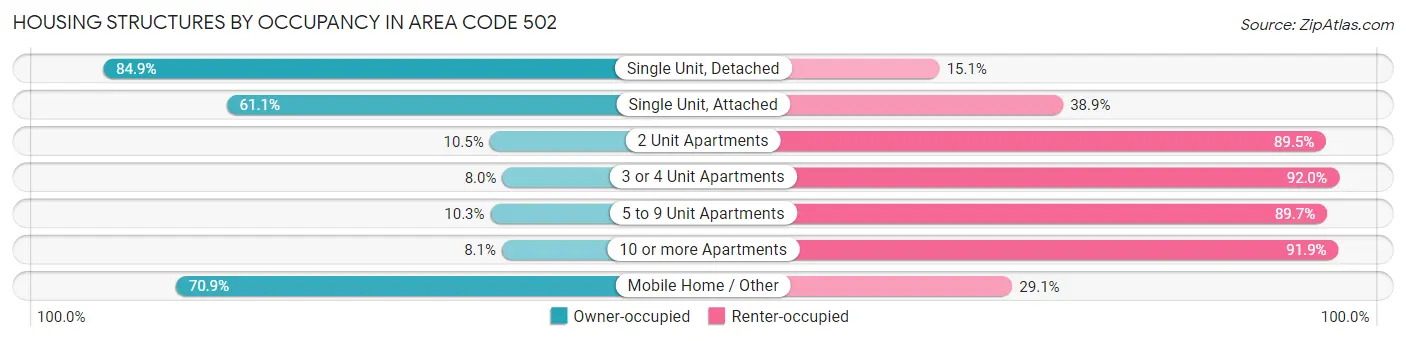
| Structure Type | Owner-occupied | Renter-occupied |
| Single Unit, Detached | 306,056 (84.9%) | 54,499 (15.1%) |
| Single Unit, Attached | 11,515 (61.1%) | 7,335 (38.9%) |
| 2 Unit Apartments | 1,120 (10.5%) | 9,570 (89.5%) |
| 3 or 4 Unit Apartments | 2,508 (8.0%) | 28,714 (92.0%) |
| 5 to 9 Unit Apartments | 3,160 (10.3%) | 27,473 (89.7%) |
| 10 or more Apartments | 3,859 (8.1%) | 43,639 (91.9%) |
| Mobile Home / Other | 11,669 (70.9%) | 4,794 (29.1%) |
| Total | 339,887 (65.9%) | 176,024 (34.1%) |
Housing Structures by Number of Rooms in Area Code 502
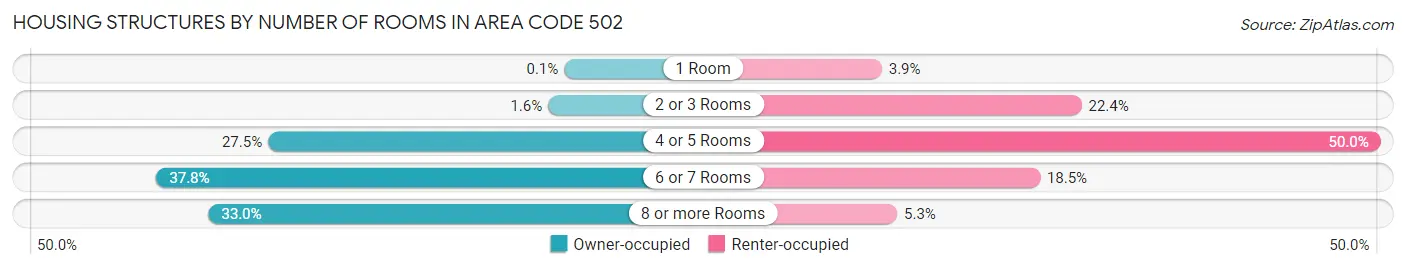
| Number of Rooms | Owner-occupied | Renter-occupied |
| 1 Room | 350 (0.1%) | 6,808 (3.9%) |
| 2 or 3 Rooms | 5,415 (1.6%) | 39,338 (22.4%) |
| 4 or 5 Rooms | 93,451 (27.5%) | 88,016 (50.0%) |
| 6 or 7 Rooms | 128,508 (37.8%) | 32,559 (18.5%) |
| 8 or more Rooms | 112,163 (33.0%) | 9,303 (5.3%) |
| Total | 339,887 (100.0%) | 176,024 (100.0%) |
Housing Structure by Heating Type in Area Code 502
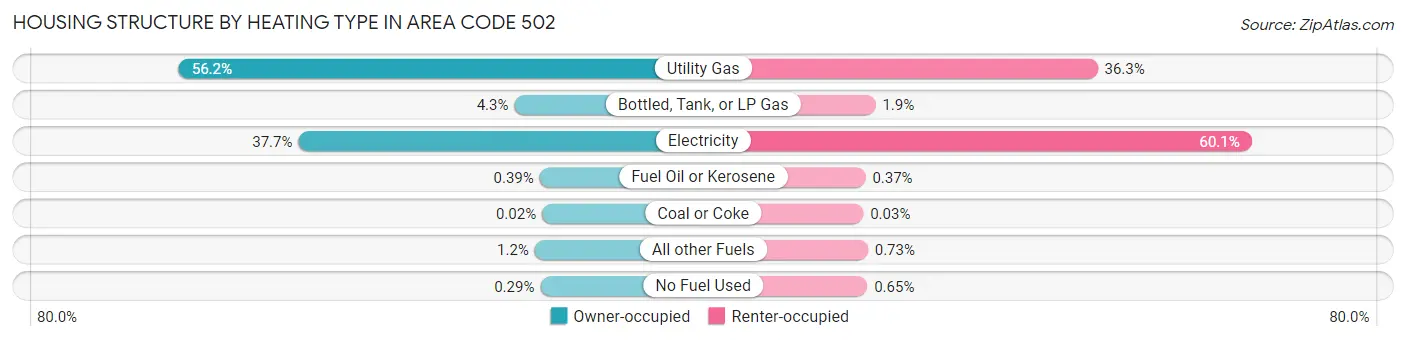
| Heating Type | Owner-occupied | Renter-occupied |
| Utility Gas | 190,882 (56.2%) | 63,816 (36.2%) |
| Bottled, Tank, or LP Gas | 14,618 (4.3%) | 3,381 (1.9%) |
| Electricity | 128,110 (37.7%) | 105,703 (60.1%) |
| Fuel Oil or Kerosene | 1,323 (0.4%) | 645 (0.4%) |
| Coal or Coke | 55 (0.0%) | 49 (0.0%) |
| All other Fuels | 3,921 (1.1%) | 1,283 (0.7%) |
| No Fuel Used | 978 (0.3%) | 1,147 (0.6%) |
| Total | 339,887 (100.0%) | 176,024 (100.0%) |
Household Vehicle Usage in Area Code 502
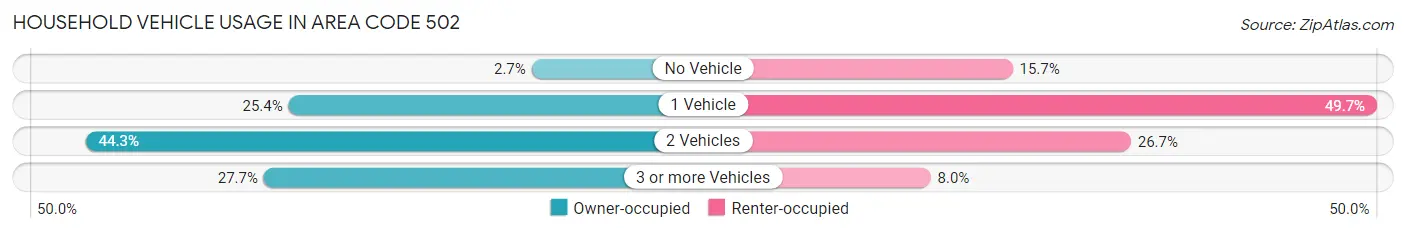
| Vehicles per Household | Owner-occupied | Renter-occupied |
| No Vehicle | 9,085 (2.7%) | 27,549 (15.7%) |
| 1 Vehicle | 86,190 (25.4%) | 87,415 (49.7%) |
| 2 Vehicles | 150,571 (44.3%) | 46,986 (26.7%) |
| 3 or more Vehicles | 94,041 (27.7%) | 14,074 (8.0%) |
| Total | 339,887 (100.0%) | 176,024 (100.0%) |
Real Estate & Mortgages in Area Code 502
Real Estate and Mortgage Overview in Area Code 502
| Characteristic | Without Mortgage | With Mortgage |
| Housing Units | 119,028 | 220,859 |
| Median Property Value | $17,655,900 | $19,854,500 |
| Median Household Income | $5,244,522 | $54,543 |
| Monthly Housing Costs | $43,072 | $13,617 |
| Real Estate Taxes | $136,746 | $5,139 |
Property Value by Mortgage Status in Area Code 502
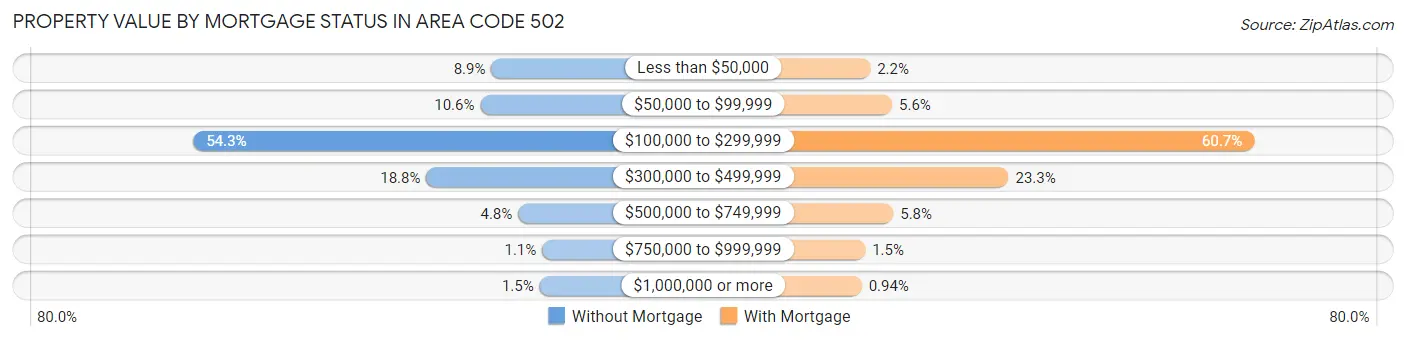
| Property Value | Without Mortgage | With Mortgage |
| Less than $50,000 | 10,575 (8.9%) | 4,916 (2.2%) |
| $50,000 to $99,999 | 12,570 (10.6%) | 12,303 (5.6%) |
| $100,000 to $299,999 | 64,633 (54.3%) | 134,122 (60.7%) |
| $300,000 to $499,999 | 22,366 (18.8%) | 51,496 (23.3%) |
| $500,000 to $749,999 | 5,711 (4.8%) | 12,695 (5.8%) |
| $750,000 to $999,999 | 1,353 (1.1%) | 3,247 (1.5%) |
| $1,000,000 or more | 1,820 (1.5%) | 2,080 (0.9%) |
| Total | 119,028 (100.0%) | 220,859 (100.0%) |
Household Income by Mortgage Status in Area Code 502
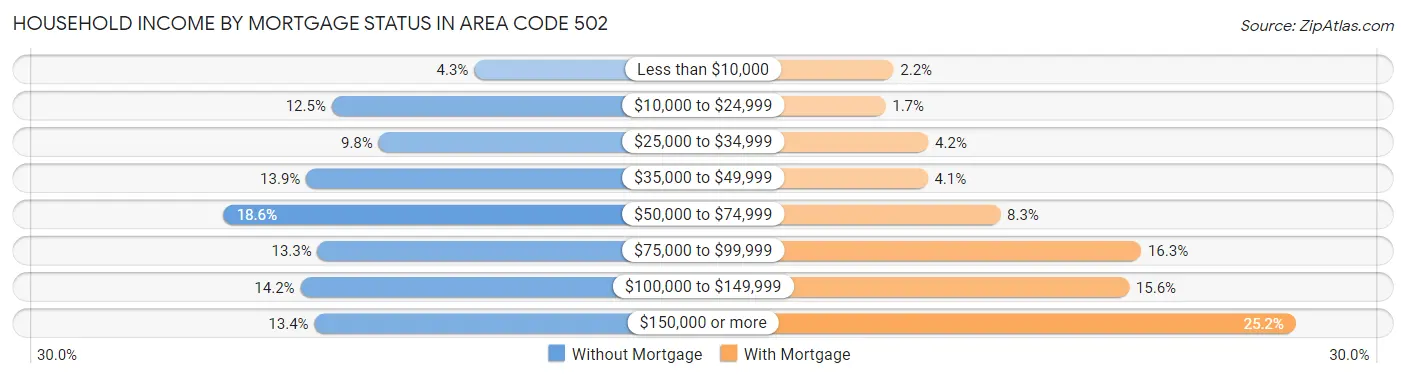
| Household Income | Without Mortgage | With Mortgage |
| Less than $10,000 | 5,127 (4.3%) | 4,768 (2.2%) |
| $10,000 to $24,999 | 14,820 (12.4%) | 3,747 (1.7%) |
| $25,000 to $34,999 | 11,625 (9.8%) | 9,158 (4.2%) |
| $35,000 to $49,999 | 16,561 (13.9%) | 9,073 (4.1%) |
| $50,000 to $74,999 | 22,168 (18.6%) | 18,246 (8.3%) |
| $75,000 to $99,999 | 15,786 (13.3%) | 36,025 (16.3%) |
| $100,000 to $149,999 | 16,946 (14.2%) | 34,497 (15.6%) |
| $150,000 or more | 15,995 (13.4%) | 55,570 (25.2%) |
| Total | 119,028 (100.0%) | 220,859 (100.0%) |
Property Value to Household Income Ratio in Area Code 502
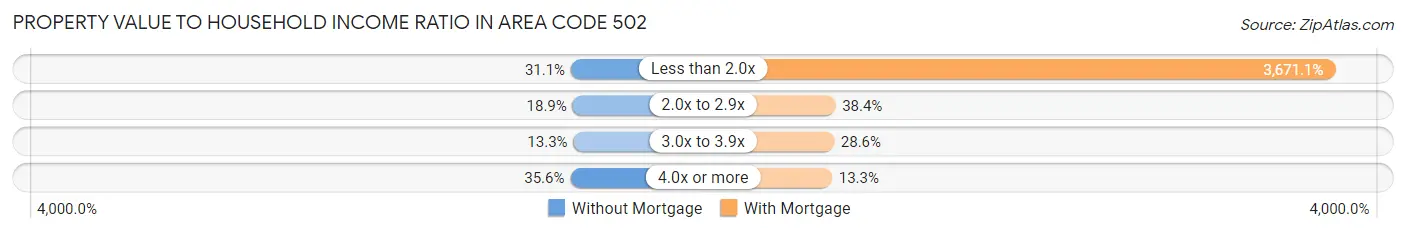
| Value-to-Income Ratio | Without Mortgage | With Mortgage |
| Less than 2.0x | 37,025 (31.1%) | 8,107,930 (3,671.1%) |
| 2.0x to 2.9x | 22,526 (18.9%) | 84,727 (38.4%) |
| 3.0x to 3.9x | 15,826 (13.3%) | 63,107 (28.6%) |
| 4.0x or more | 42,340 (35.6%) | 29,459 (13.3%) |
| Total | 119,028 (100.0%) | 220,859 (100.0%) |
Real Estate Taxes by Mortgage Status in Area Code 502
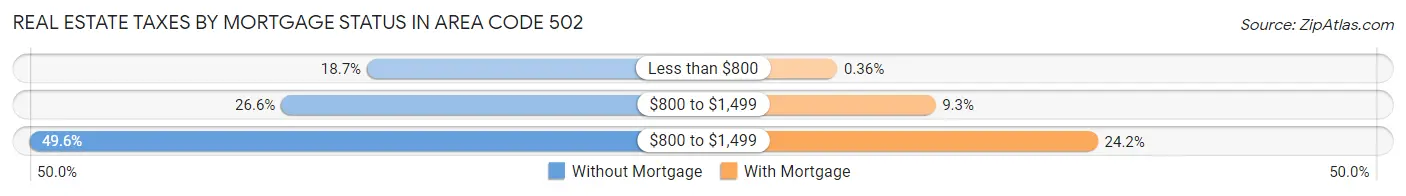
| Property Taxes | Without Mortgage | With Mortgage |
| Less than $800 | 22,305 (18.7%) | 795 (0.4%) |
| $800 to $1,499 | 31,626 (26.6%) | 20,610 (9.3%) |
| $800 to $1,499 | 59,035 (49.6%) | 53,366 (24.2%) |
| Total | 119,028 (100.0%) | 220,859 (100.0%) |
Health & Disability in Area Code 502
Health Insurance Coverage by Age in Area Code 502
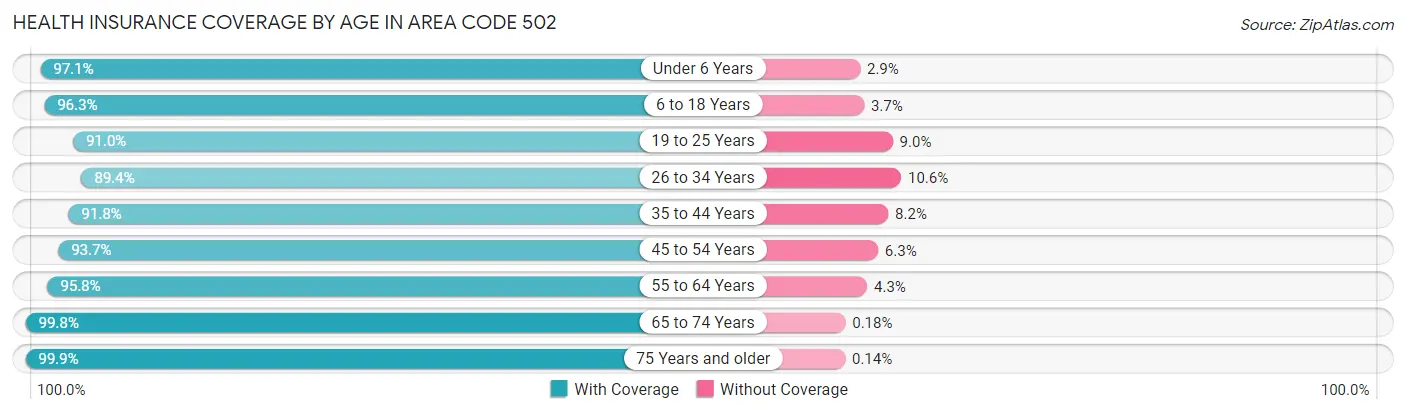
| Age Bracket | With Coverage | Without Coverage |
| Under 6 Years | 89,712 (97.1%) | 2,707 (2.9%) |
| 6 to 18 Years | 203,109 (96.3%) | 7,734 (3.7%) |
| 19 to 25 Years | 103,556 (91.0%) | 10,273 (9.0%) |
| 26 to 34 Years | 138,627 (89.4%) | 16,394 (10.6%) |
| 35 to 44 Years | 150,496 (91.8%) | 13,400 (8.2%) |
| 45 to 54 Years | 148,914 (93.7%) | 9,969 (6.3%) |
| 55 to 64 Years | 159,889 (95.8%) | 7,089 (4.3%) |
| 65 to 74 Years | 123,503 (99.8%) | 228 (0.2%) |
| 75 Years and older | 76,053 (99.9%) | 109 (0.1%) |
| Total | 1,193,859 (94.6%) | 67,903 (5.4%) |
Health Insurance Coverage by Citizenship Status in Area Code 502
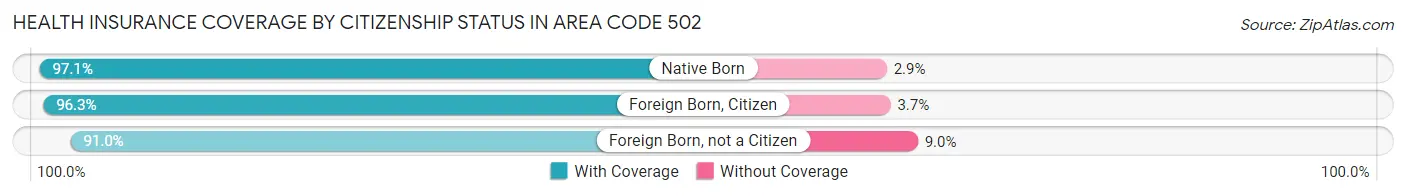
| Citizenship Status | With Coverage | Without Coverage |
| Native Born | 89,712 (97.1%) | 2,707 (2.9%) |
| Foreign Born, Citizen | 203,109 (96.3%) | 7,734 (3.7%) |
| Foreign Born, not a Citizen | 103,556 (91.0%) | 10,273 (9.0%) |
Health Insurance Coverage by Household Income in Area Code 502
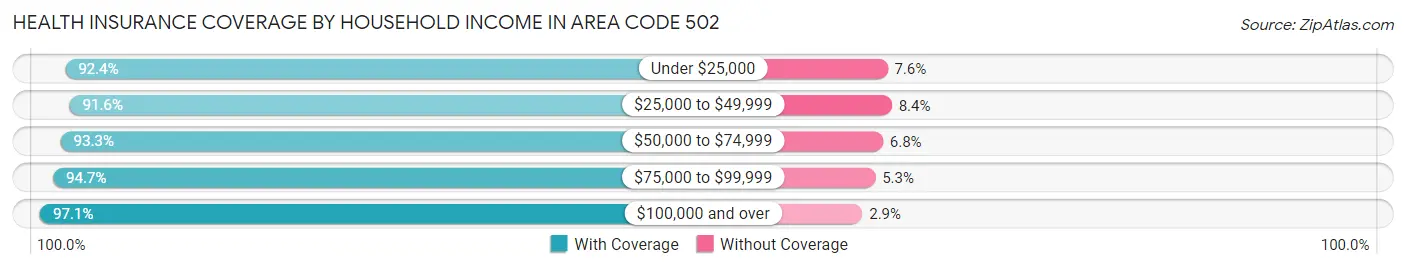
| Household Income | With Coverage | Without Coverage |
| Under $25,000 | 136,268 (92.4%) | 11,241 (7.6%) |
| $25,000 to $49,999 | 190,469 (91.6%) | 17,516 (8.4%) |
| $50,000 to $74,999 | 193,457 (93.2%) | 14,003 (6.8%) |
| $75,000 to $99,999 | 172,261 (94.7%) | 9,704 (5.3%) |
| $100,000 and over | 491,858 (97.1%) | 14,682 (2.9%) |
Public vs Private Health Insurance Coverage by Age in Area Code 502
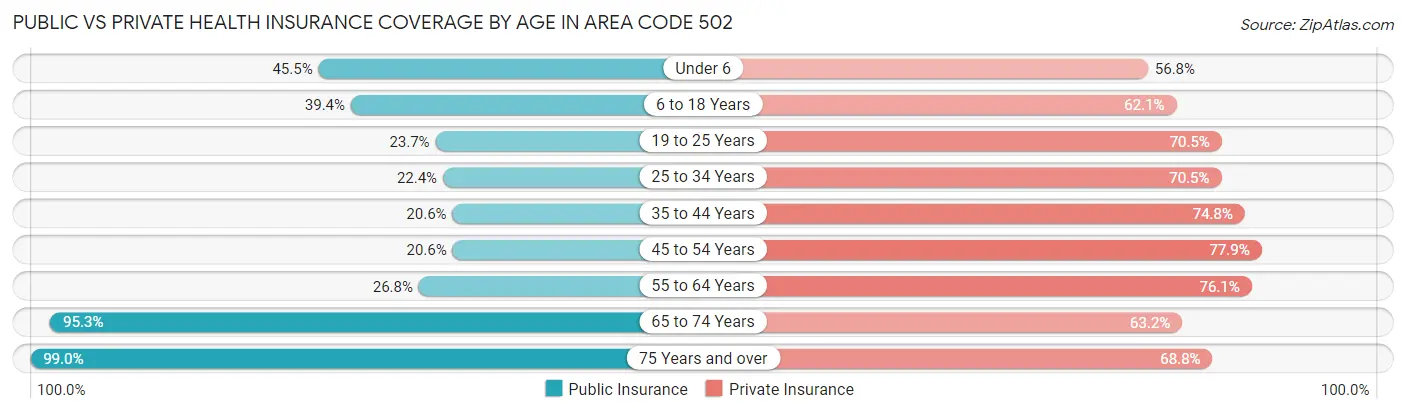
| Age Bracket | Public Insurance | Private Insurance |
| Under 6 | 42,006 (45.5%) | 52,503 (56.8%) |
| 6 to 18 Years | 83,166 (39.4%) | 130,940 (62.1%) |
| 19 to 25 Years | 27,024 (23.7%) | 80,261 (70.5%) |
| 25 to 34 Years | 34,645 (22.4%) | 109,210 (70.5%) |
| 35 to 44 Years | 33,749 (20.6%) | 122,576 (74.8%) |
| 45 to 54 Years | 32,680 (20.6%) | 123,764 (77.9%) |
| 55 to 64 Years | 44,798 (26.8%) | 126,997 (76.1%) |
| 65 to 74 Years | 117,879 (95.3%) | 78,155 (63.2%) |
| 75 Years and over | 75,362 (99.0%) | 52,383 (68.8%) |
| Total | 491,309 (38.9%) | 876,789 (69.5%) |
Disability Status by Sex by Age in Area Code 502
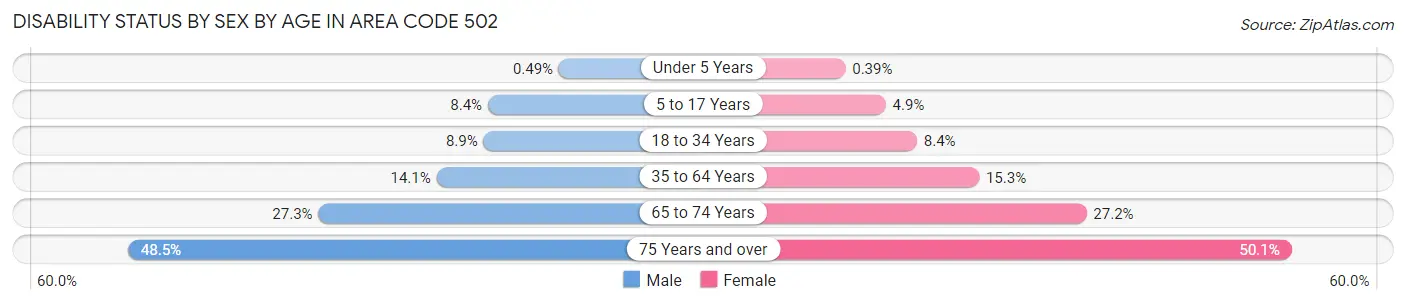
| Age Bracket | Male | Female |
| Under 5 Years | 189 (0.5%) | 143 (0.4%) |
| 5 to 17 Years | 9,131 (8.4%) | 5,071 (4.9%) |
| 18 to 34 Years | 12,592 (8.9%) | 11,875 (8.4%) |
| 35 to 64 Years | 33,871 (14.1%) | 38,187 (15.3%) |
| 65 to 74 Years | 15,761 (27.3%) | 17,970 (27.2%) |
| 75 Years and over | 15,066 (48.5%) | 22,581 (50.1%) |
Disability Class by Sex by Age in Area Code 502
Disability Class: Hearing Difficulty
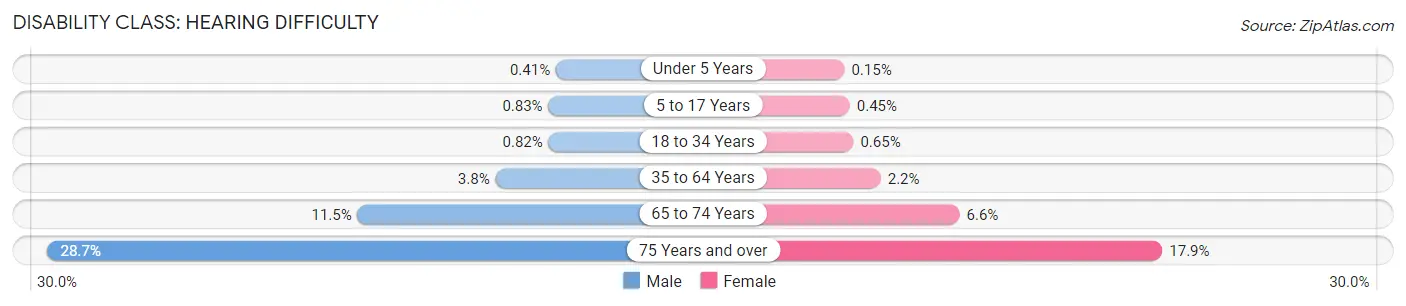
| Age Bracket | Male | Female |
| Under 5 Years | 160 (0.4%) | 57 (0.2%) |
| 5 to 17 Years | 899 (0.8%) | 463 (0.4%) |
| 18 to 34 Years | 1,166 (0.8%) | 922 (0.6%) |
| 35 to 64 Years | 9,075 (3.8%) | 5,415 (2.2%) |
| 65 to 74 Years | 6,619 (11.5%) | 4,324 (6.6%) |
| 75 Years and over | 8,923 (28.7%) | 8,051 (17.8%) |
Disability Class: Vision Difficulty
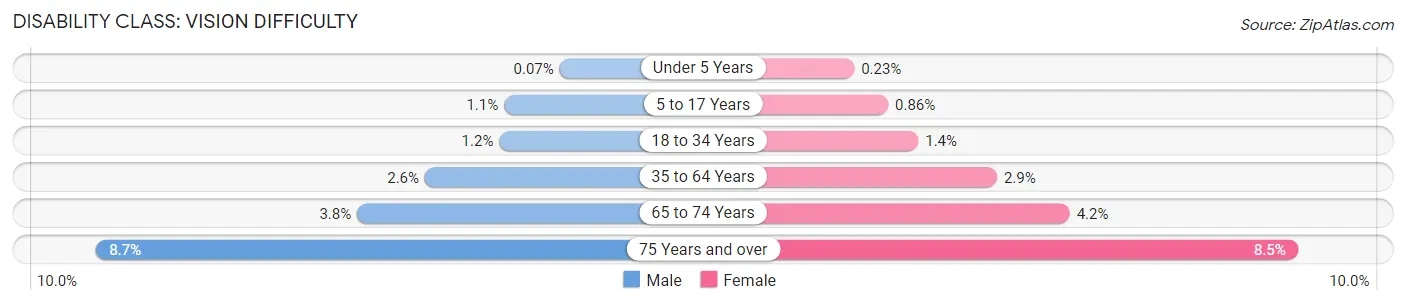
| Age Bracket | Male | Female |
| Under 5 Years | 29 (0.1%) | 86 (0.2%) |
| 5 to 17 Years | 1,194 (1.1%) | 896 (0.9%) |
| 18 to 34 Years | 1,686 (1.2%) | 2,017 (1.4%) |
| 35 to 64 Years | 6,168 (2.6%) | 7,190 (2.9%) |
| 65 to 74 Years | 2,210 (3.8%) | 2,787 (4.2%) |
| 75 Years and over | 2,694 (8.7%) | 3,816 (8.5%) |
Disability Class: Cognitive Difficulty
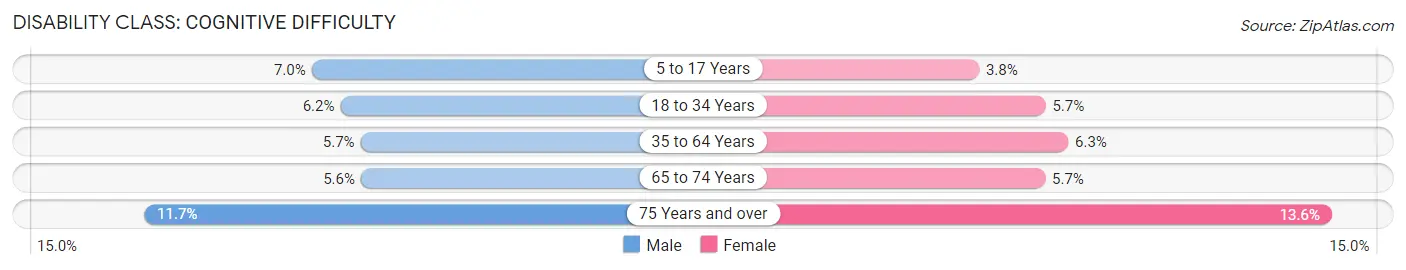
| Age Bracket | Male | Female |
| 5 to 17 Years | 7,620 (7.0%) | 3,967 (3.8%) |
| 18 to 34 Years | 8,787 (6.2%) | 8,062 (5.7%) |
| 35 to 64 Years | 13,544 (5.7%) | 15,728 (6.3%) |
| 65 to 74 Years | 3,258 (5.6%) | 3,731 (5.7%) |
| 75 Years and over | 3,626 (11.7%) | 6,150 (13.6%) |
Disability Class: Ambulatory Difficulty
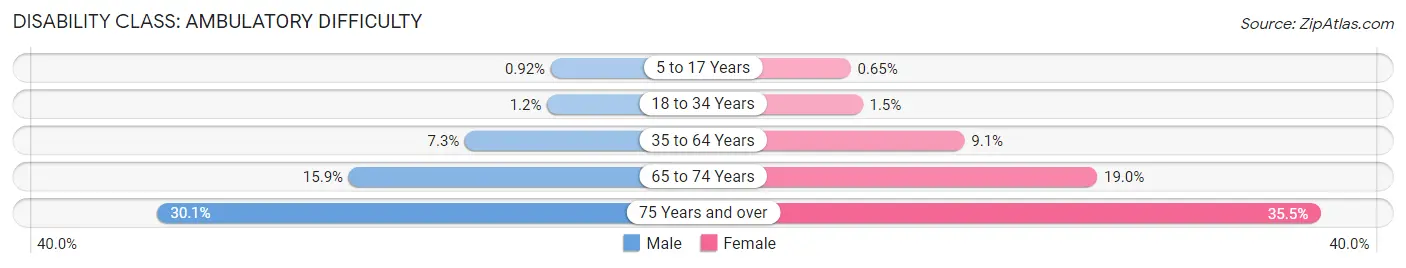
| Age Bracket | Male | Female |
| 5 to 17 Years | 996 (0.9%) | 676 (0.6%) |
| 18 to 34 Years | 1,692 (1.2%) | 2,192 (1.5%) |
| 35 to 64 Years | 17,500 (7.3%) | 22,747 (9.1%) |
| 65 to 74 Years | 9,197 (15.9%) | 12,499 (19.0%) |
| 75 Years and over | 9,365 (30.1%) | 16,006 (35.5%) |
Disability Class: Self-Care Difficulty
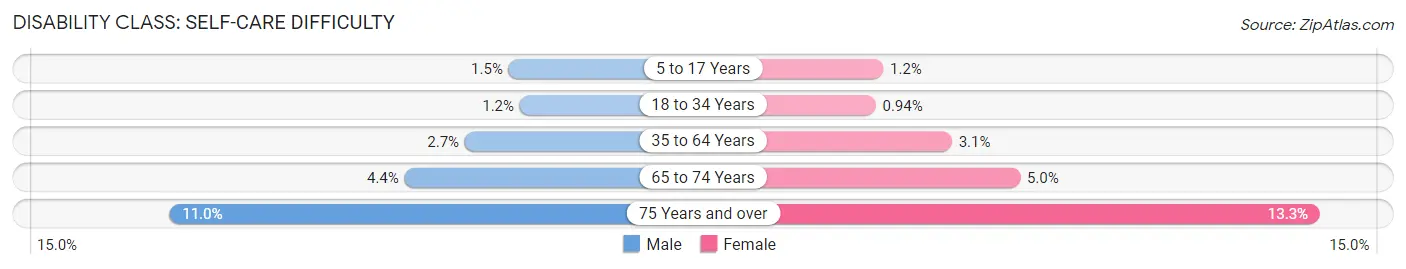
| Age Bracket | Male | Female |
| 5 to 17 Years | 1,649 (1.5%) | 1,195 (1.1%) |
| 18 to 34 Years | 1,717 (1.2%) | 1,340 (0.9%) |
| 35 to 64 Years | 6,583 (2.7%) | 7,649 (3.1%) |
| 65 to 74 Years | 2,552 (4.4%) | 3,272 (5.0%) |
| 75 Years and over | 3,408 (11.0%) | 6,003 (13.3%) |
Technology Access in Area Code 502
Computing Device Access in Area Code 502
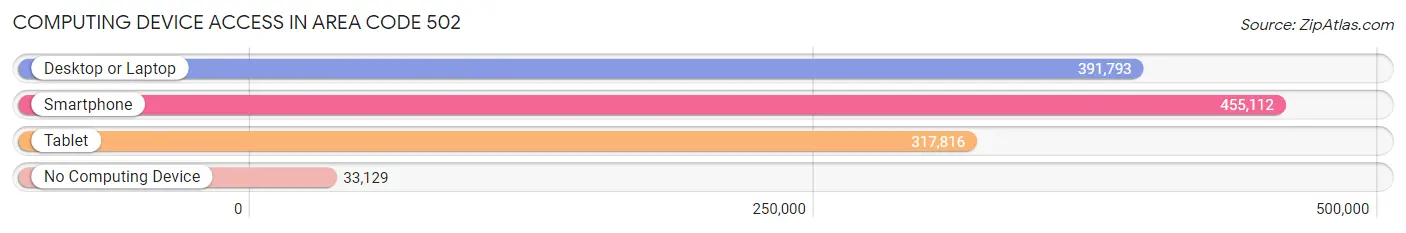
| Device Type | # Households | % Households |
| Desktop or Laptop | 391,793 | 75.9% |
| Smartphone | 455,112 | 88.2% |
| Tablet | 317,816 | 61.6% |
| No Computing Device | 33,129 | 6.4% |
| Total | 515,911 | 100.0% |
Internet Access in Area Code 502
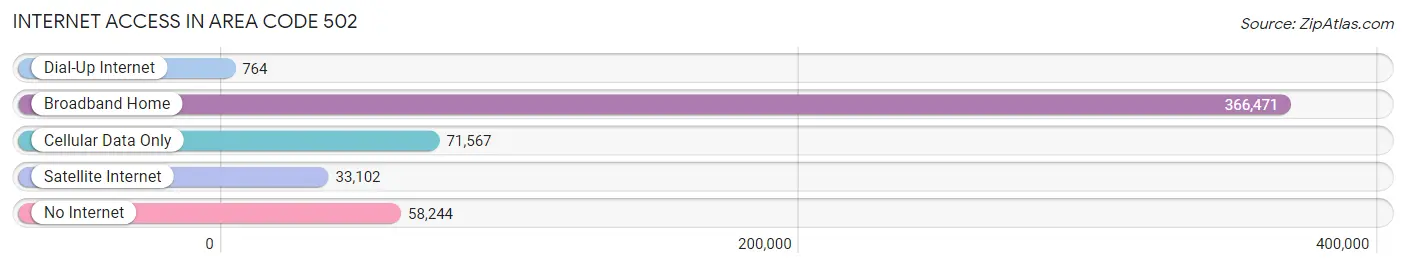
| Internet Type | # Households | % Households |
| Dial-Up Internet | 764 | 0.2% |
| Broadband Home | 366,471 | 71.0% |
| Cellular Data Only | 71,567 | 13.9% |
| Satellite Internet | 33,102 | 6.4% |
| No Internet | 58,244 | 11.3% |
| Total | 515,911 | 100.0% |
Area Code 502 Summary
Geography
Area code 502 is located in the state of Kentucky and covers the Louisville metropolitan area. It is bordered by area codes 270 and 859 to the west, 606 to the east, and 304 and 681 to the north.
Social
Area code 502 is home to a diverse population of people from all walks of life. The city of Louisville is known for its vibrant music and art scene, and the area code is home to many local businesses and organizations that support the arts.
Economics
Area code 502 is home to a thriving economy. Louisville is a major hub for the automotive industry, and the area code is home to many large companies such as Ford, General Electric, and UPS. The city is also home to a number of universities and colleges, making it a great place for students to pursue their education.
Demographics
Area code 502 is home to a population of over 1.3 million people. The majority of the population is white, followed by African American, Hispanic, and Asian. The median household income is around $50,000, and the unemployment rate is around 4%.
Common Questions
What is Per Capita Income in Area Code 502?
Per Capita income in Area Code 502 is $37,554.
What is the Median Family Income in Area Code 502?
Median Family Income in Area Code 502 is $88,414.
What is the Median Household income in Area Code 502?
Median Household Income in Area Code 502 is $72,151.
What is Income or Wage Gap in Area Code 502?
Income or Wage Gap in Area Code 502 is 26.9%.
Women in Area Code 502 earn 73.1 cents for every dollar earned by a man.
What is Family Income Deficit in Area Code 502?
Family Income Deficit in Area Code 502 is $11,547.
Families that are below poverty line in Area Code 502 earn $11,547 less on average than the poverty threshold level.
What is Inequality or Gini Index in Area Code 502?
Inequality or Gini Index in Area Code 502 is 37.58.
What is the Total Population of Area Code 502?
Total Population of Area Code 502 is 1,283,189.
What is the Total Male Population of Area Code 502?
Total Male Population of Area Code 502 is 632,404.
What is the Total Female Population of Area Code 502?
Total Female Population of Area Code 502 is 650,785.
What is the Ratio of Males per 100 Females in Area Code 502?
There are 97.18 Males per 100 Females in Area Code 502.
What is the Ratio of Females per 100 Males in Area Code 502?
There are 102.91 Females per 100 Males in Area Code 502.
What is the Median Population Age in Area Code 502?
Median Population Age in Area Code 502 is 41.1 Years.
What is the Average Family Size in Area Code 502
Average Family Size in Area Code 502 is 3.0 People.
What is the Average Household Size in Area Code 502
Average Household Size in Area Code 502 is 2.5 People.
How Large is the Labor Force in Area Code 502?
There are 636,259 People in the Labor Forcein in Area Code 502.
What is the Percentage of People in the Labor Force in Area Code 502?
61.9% of People are in the Labor Force in Area Code 502.
What is the Unemployment Rate in Area Code 502?
Unemployment Rate in Area Code 502 is 5.0%.