Area Code 606 Map & Demographics
Area Code 606 Map
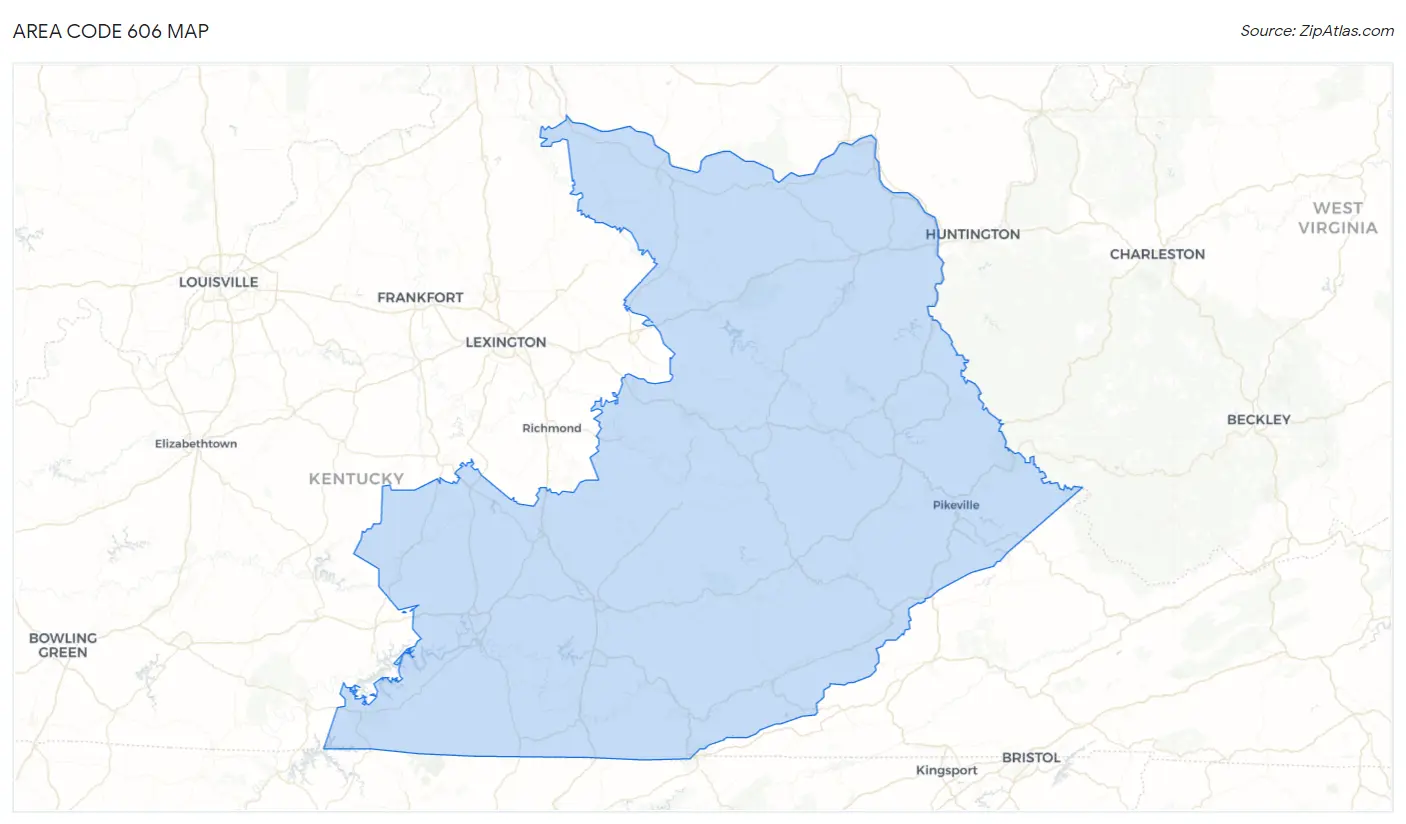
Area Code 606 Overview
$22,713
PER CAPITA INCOME
$56,760
AVG FAMILY INCOME
$44,688
AVG HOUSEHOLD INCOME
31.3%
WAGE / INCOME GAP [ % ]
68.7¢/ $1
WAGE / INCOME GAP [ $ ]
$10,202
FAMILY INCOME DEFICIT
139.15
INEQUALITY / GINI INDEX
947,750
TOTAL POPULATION
475,129
MALE POPULATION
472,621
FEMALE POPULATION
100.53
MALES / 100 FEMALES
99.47
FEMALES / 100 MALES
43.5
MEDIAN AGE
3.1
AVG FAMILY SIZE
2.6
AVG HOUSEHOLD SIZE
338,463
LABOR FORCE [ PEOPLE ]
44.3%
PERCENT IN LABOR FORCE
11.3%
UNEMPLOYMENT RATE
Income in Area Code 606
Income Overview in Area Code 606
Per Capita Income in Area Code 606 is $22,713, while median incomes of families and households are $56,760 and $44,688 respectively.
| Characteristic | Number | Measure |
| Per Capita Income | 947,750 | $22,713 |
| Median Family Income | 244,594 | $56,760 |
| Mean Family Income | 244,594 | $20,666,327 |
| Median Household Income | 361,486 | $44,688 |
| Mean Household Income | 361,486 | $18,516,940 |
| Income Deficit | 244,594 | $10,202 |
| Wage / Income Gap (%) | 947,750 | 31.27% |
| Wage / Income Gap ($) | 947,750 | 68.73¢ per $1 |
| Gini / Inequality Index | 947,750 | 139.15 |
Earnings by Sex in Area Code 606
Average Earnings in Area Code 606 are $32,590, $40,926 for men and $27,606 for women, a difference of 32.6%.
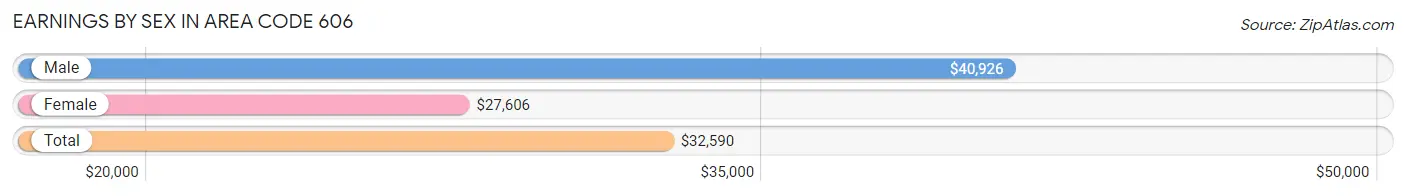
| Sex | Number | Average Earnings |
| Male | 204,398 (52.8%) | $40,926 |
| Female | 182,367 (47.1%) | $27,606 |
| Total | 386,765 (100.0%) | $32,590 |
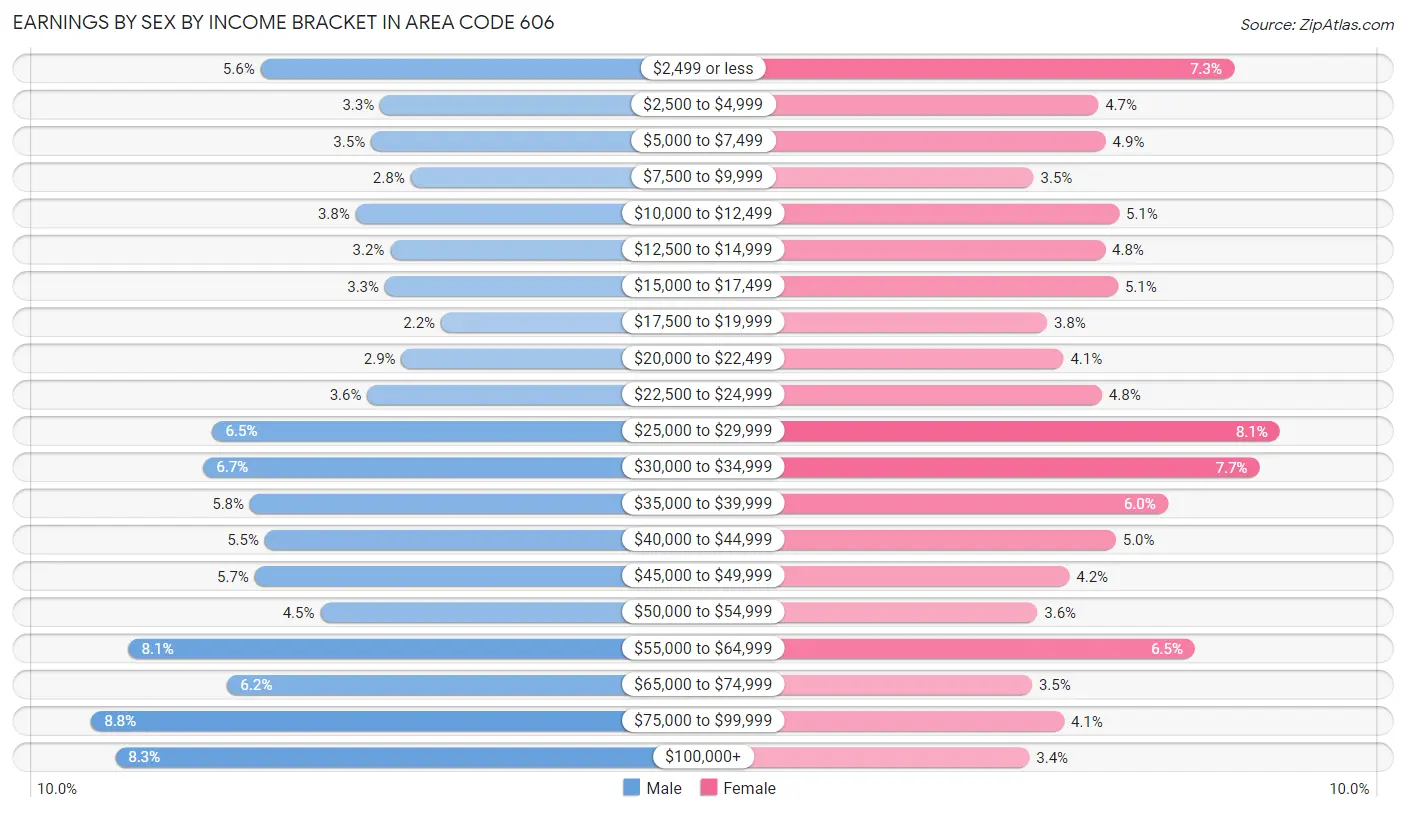
Earnings by Sex by Income Bracket in Area Code 606
The most common earnings brackets in Area Code 606 are $75,000 to $99,999 for men (17,885 | 8.7%) and $25,000 to $29,999 for women (14,785 | 8.1%).
| Income | Male | Female |
| $2,499 or less | 11,408 (5.6%) | 13,217 (7.2%) |
| $2,500 to $4,999 | 6,817 (3.3%) | 8,589 (4.7%) |
| $5,000 to $7,499 | 7,179 (3.5%) | 8,853 (4.9%) |
| $7,500 to $9,999 | 5,666 (2.8%) | 6,374 (3.5%) |
| $10,000 to $12,499 | 7,766 (3.8%) | 9,309 (5.1%) |
| $12,500 to $14,999 | 6,447 (3.2%) | 8,830 (4.8%) |
| $15,000 to $17,499 | 6,649 (3.3%) | 9,273 (5.1%) |
| $17,500 to $19,999 | 4,489 (2.2%) | 6,831 (3.7%) |
| $20,000 to $22,499 | 6,006 (2.9%) | 7,395 (4.1%) |
| $22,500 to $24,999 | 7,326 (3.6%) | 8,711 (4.8%) |
| $25,000 to $29,999 | 13,236 (6.5%) | 14,785 (8.1%) |
| $30,000 to $34,999 | 13,591 (6.7%) | 14,089 (7.7%) |
| $35,000 to $39,999 | 11,819 (5.8%) | 10,967 (6.0%) |
| $40,000 to $44,999 | 11,241 (5.5%) | 9,184 (5.0%) |
| $45,000 to $49,999 | 11,638 (5.7%) | 7,606 (4.2%) |
| $50,000 to $54,999 | 9,121 (4.5%) | 6,504 (3.6%) |
| $55,000 to $64,999 | 16,463 (8.1%) | 11,884 (6.5%) |
| $65,000 to $74,999 | 12,679 (6.2%) | 6,322 (3.5%) |
| $75,000 to $99,999 | 17,885 (8.7%) | 7,415 (4.1%) |
| $100,000+ | 16,972 (8.3%) | 6,229 (3.4%) |
| Total | 204,398 (100.0%) | 182,367 (100.0%) |
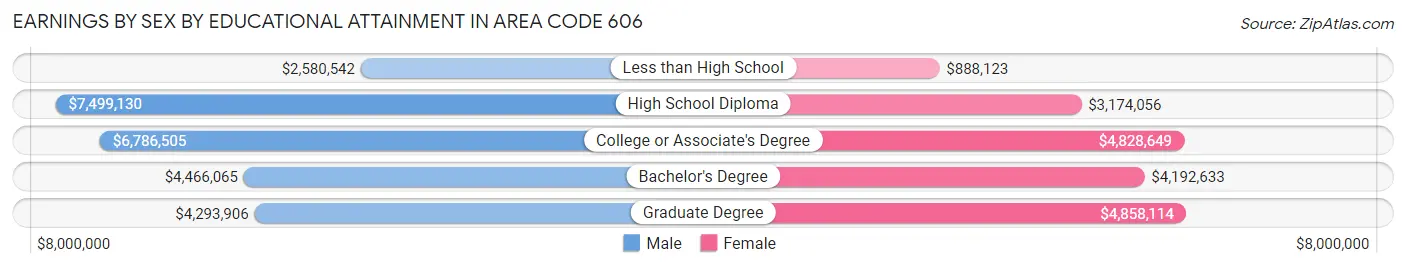
Earnings by Sex by Educational Attainment in Area Code 606
Average earnings in Area Code 606 are $11,087,405 for men and $7,136,992 for women, a difference of 35.6%. Men with an educational attainment of high school diploma enjoy the highest average annual earnings of $7,499,130, while those with less than high school education earn the least with $2,580,542. Women with an educational attainment of graduate degree earn the most with the average annual earnings of $4,858,114, while those with less than high school education have the smallest earnings of $888,123.
| Educational Attainment | Male Income | Female Income |
| Less than High School | $2,580,542 | $888,123 |
| High School Diploma | $7,499,130 | $3,174,056 |
| College or Associate's Degree | $6,786,505 | $4,828,649 |
| Bachelor's Degree | $4,466,065 | $4,192,633 |
| Graduate Degree | $4,293,906 | $4,858,114 |
| Total | $11,087,405 | $7,136,992 |
Family Income in Area Code 606
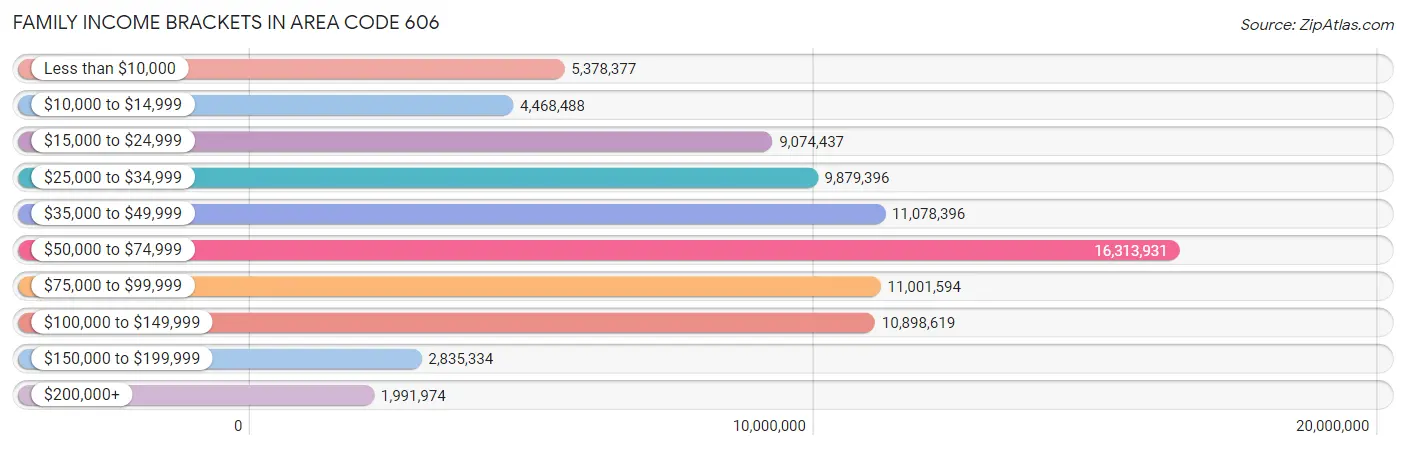
Family Income Brackets in Area Code 606
According to the Area Code 606 family income data, there are 16,313,931 families falling into the $50,000 to $74,999 income range, which is the most common income bracket and makes up 6,669.8% of all families. Conversely, the $200,000+ income bracket is the least frequent group with only 1,991,974 families (814.4%) belonging to this category.
| Income Bracket | # Families | % Families |
| Less than $10,000 | 5,378,377 | 2,198.9% |
| $10,000 to $14,999 | 4,468,488 | 1,826.9% |
| $15,000 to $24,999 | 9,074,437 | 3,710.0% |
| $25,000 to $34,999 | 9,879,396 | 4,039.1% |
| $35,000 to $49,999 | 11,078,396 | 4,529.3% |
| $50,000 to $74,999 | 16,313,931 | 6,669.8% |
| $75,000 to $99,999 | 11,001,594 | 4,497.9% |
| $100,000 to $149,999 | 10,898,619 | 4,455.8% |
| $150,000 to $199,999 | 2,835,334 | 1,159.2% |
| $200,000+ | 1,991,974 | 814.4% |
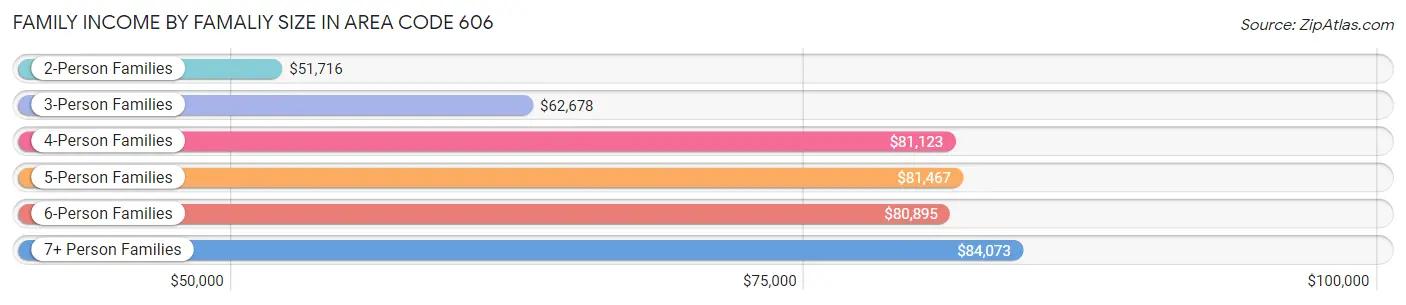
Family Income by Famaliy Size in Area Code 606
7+ person families (3,010 | 1.2%) account for the highest median family income in Area Code 606 with $84,073 per family, while 2-person families (121,318 | 49.6%) have the highest median income of $25,858 per family member.
| Income Bracket | # Families | Median Income |
| 2-Person Families | 121,318 (49.6%) | $51,716 |
| 3-Person Families | 56,937 (23.3%) | $62,678 |
| 4-Person Families | 39,446 (16.1%) | $81,123 |
| 5-Person Families | 18,352 (7.5%) | $81,467 |
| 6-Person Families | 5,531 (2.3%) | $80,895 |
| 7+ Person Families | 3,010 (1.2%) | $84,073 |
| Total | 244,594 (100.0%) | $56,760 |
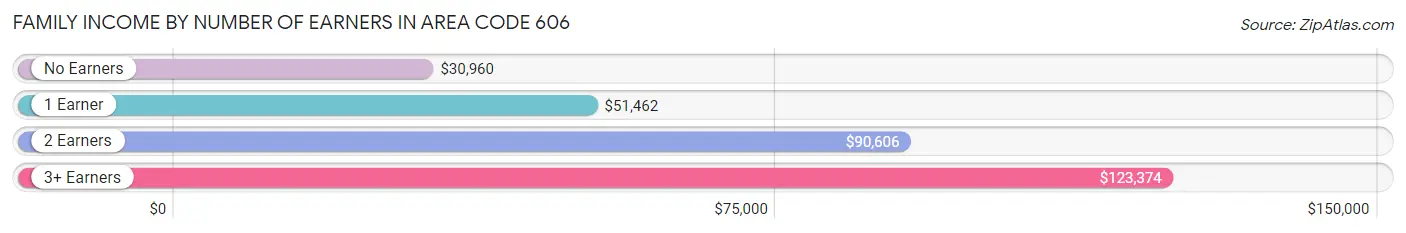
Family Income by Number of Earners in Area Code 606
The median family income in Area Code 606 is $56,760, with families comprising 3+ earners (16,671) having the highest median family income of $123,374, while families with no earners (66,589) have the lowest median family income of $30,960, accounting for 6.8% and 27.2% of families, respectively.
| Number of Earners | # Families | Median Income |
| No Earners | 66,589 (27.2%) | $30,960 |
| 1 Earner | 83,369 (34.1%) | $51,462 |
| 2 Earners | 77,965 (31.9%) | $90,606 |
| 3+ Earners | 16,671 (6.8%) | $123,374 |
| Total | 244,594 (100.0%) | $56,760 |
Household Income in Area Code 606
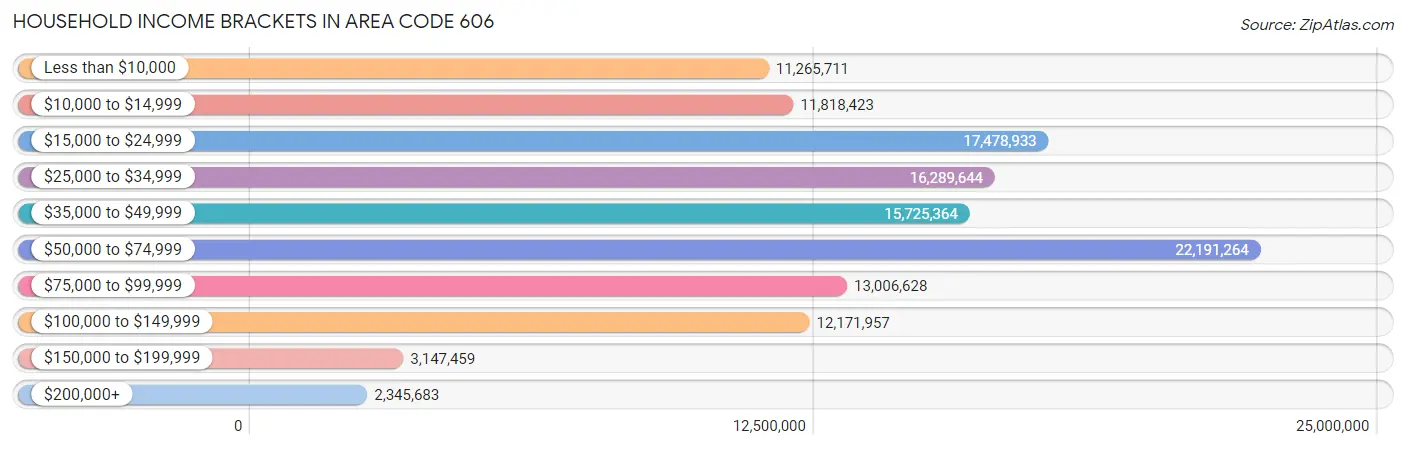
Household Income Brackets in Area Code 606
With 22,191,264 households falling in the category, the $50,000 to $74,999 income range is the most frequent in Area Code 606, accounting for 6,138.9% of all households. In contrast, only 2,345,683 households (648.9%) fall into the $200,000+ income bracket, making it the least populous group.
| Income Bracket | # Households | % Households |
| Less than $10,000 | 11,265,711 | 3,116.5% |
| $10,000 to $14,999 | 11,818,423 | 3,269.4% |
| $15,000 to $24,999 | 17,478,933 | 4,835.3% |
| $25,000 to $34,999 | 16,289,644 | 4,506.3% |
| $35,000 to $49,999 | 15,725,364 | 4,350.2% |
| $50,000 to $74,999 | 22,191,264 | 6,138.9% |
| $75,000 to $99,999 | 13,006,628 | 3,598.1% |
| $100,000 to $149,999 | 12,171,957 | 3,367.2% |
| $150,000 to $199,999 | 3,147,459 | 870.7% |
| $200,000+ | 2,345,683 | 648.9% |
Household Income by Householder Age in Area Code 606
The median household income in Area Code 606 is $44,688, with the highest median household income of $62,682 found in the 25 to 44 years age bracket for the primary householder. A total of 97,878 households (27.1%) fall into this category. Meanwhile, the 65+ years age bracket for the primary householder has the lowest median household income of $38,924, with 109,838 households (30.4%) in this group.
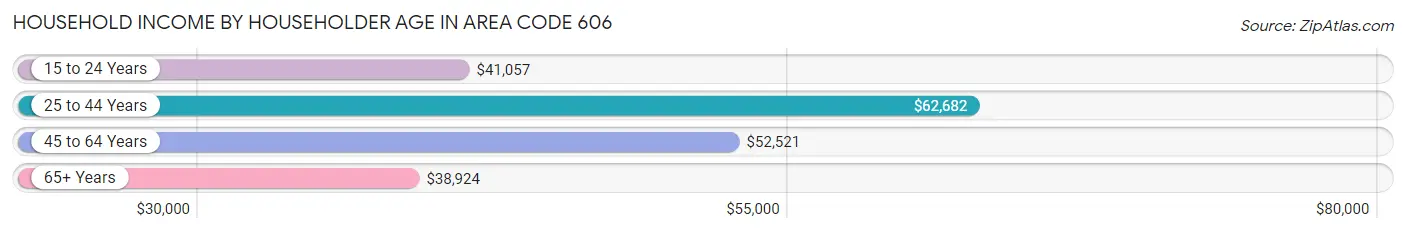
| Income Bracket | # Households | Median Income |
| 15 to 24 Years | 12,205 (3.4%) | $41,057 |
| 25 to 44 Years | 97,878 (27.1%) | $62,682 |
| 45 to 64 Years | 141,565 (39.2%) | $52,521 |
| 65+ Years | 109,838 (30.4%) | $38,924 |
| Total | 361,486 (100.0%) | $44,688 |
Poverty in Area Code 606
Income Below Poverty by Sex and Age in Area Code 606
With 21.3% poverty level for males and 25.6% for females among the residents of Area Code 606, under 5 year old males and 5 year old females are the most vulnerable to poverty, with 8,993 males (33.3%) and 1,797 females (36.6%) in their respective age groups living below the poverty level.
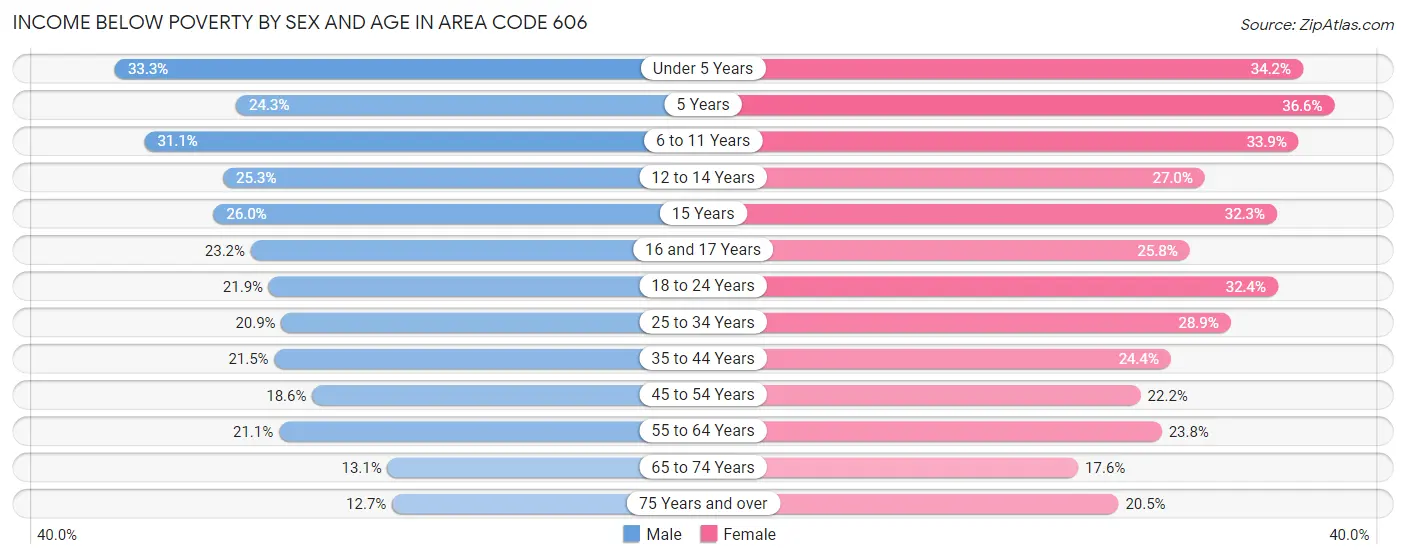
| Age Bracket | Male | Female |
| Under 5 Years | 8,993 (33.3%) | 8,601 (34.2%) |
| 5 Years | 1,442 (24.3%) | 1,797 (36.6%) |
| 6 to 11 Years | 10,933 (31.1%) | 11,049 (33.9%) |
| 12 to 14 Years | 4,646 (25.3%) | 4,784 (27.0%) |
| 15 Years | 1,771 (26.0%) | 1,835 (32.3%) |
| 16 and 17 Years | 2,978 (23.2%) | 2,859 (25.8%) |
| 18 to 24 Years | 8,336 (21.9%) | 11,210 (32.4%) |
| 25 to 34 Years | 11,405 (20.9%) | 15,390 (28.9%) |
| 35 to 44 Years | 11,660 (21.4%) | 13,686 (24.4%) |
| 45 to 54 Years | 11,348 (18.6%) | 13,629 (22.2%) |
| 55 to 64 Years | 13,369 (21.1%) | 15,881 (23.7%) |
| 65 to 74 Years | 6,535 (13.1%) | 9,694 (17.5%) |
| 75 Years and over | 3,367 (12.7%) | 7,491 (20.5%) |
| Total | 96,783 (21.3%) | 117,906 (25.6%) |
Income Above Poverty by Sex and Age in Area Code 606
According to the poverty statistics in Area Code 606, males aged 75 years and over and females aged 65 to 74 years are the age groups that are most secure financially, with 87.3% of males and 82.5% of females in these age groups living above the poverty line.
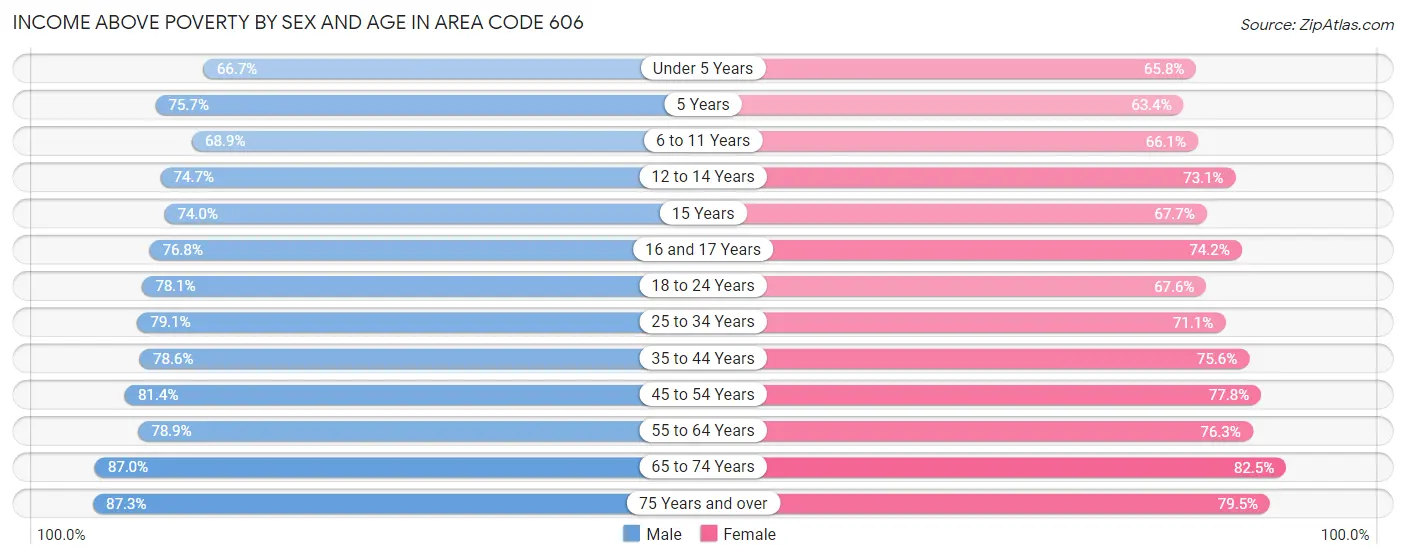
| Age Bracket | Male | Female |
| Under 5 Years | 18,021 (66.7%) | 16,527 (65.8%) |
| 5 Years | 4,493 (75.7%) | 3,117 (63.4%) |
| 6 to 11 Years | 24,226 (68.9%) | 21,523 (66.1%) |
| 12 to 14 Years | 13,747 (74.7%) | 12,967 (73.1%) |
| 15 Years | 5,047 (74.0%) | 3,846 (67.7%) |
| 16 and 17 Years | 9,856 (76.8%) | 8,213 (74.2%) |
| 18 to 24 Years | 29,798 (78.1%) | 23,422 (67.6%) |
| 25 to 34 Years | 43,076 (79.1%) | 37,938 (71.1%) |
| 35 to 44 Years | 42,691 (78.5%) | 42,350 (75.6%) |
| 45 to 54 Years | 49,524 (81.4%) | 47,803 (77.8%) |
| 55 to 64 Years | 49,948 (78.9%) | 50,995 (76.2%) |
| 65 to 74 Years | 43,542 (87.0%) | 45,548 (82.5%) |
| 75 Years and over | 23,132 (87.3%) | 28,976 (79.5%) |
| Total | 357,101 (78.7%) | 343,225 (74.4%) |
Income Below Poverty Among Married-Couple Families in Area Code 606
The poverty statistics for married-couple families in Area Code 606 show that 10.8% or 19,218 of the total 178,435 families live below the poverty line. Families with 5 or more children have the highest poverty rate of 36.0%, comprising of 488 families. On the other hand, families with no children have the lowest poverty rate of 8.8%, which includes 9,462 families.
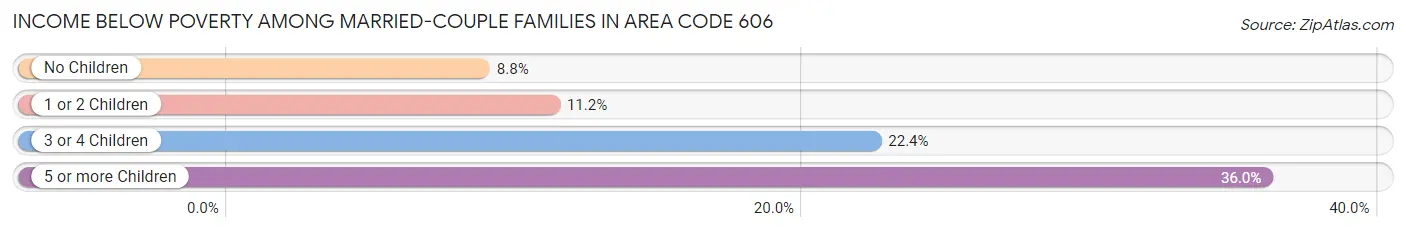
| Children | Above Poverty | Below Poverty |
| No Children | 98,402 (91.2%) | 9,462 (8.8%) |
| 1 or 2 Children | 49,488 (88.8%) | 6,248 (11.2%) |
| 3 or 4 Children | 10,461 (77.6%) | 3,020 (22.4%) |
| 5 or more Children | 866 (64.0%) | 488 (36.0%) |
| Total | 159,217 (89.2%) | 19,218 (10.8%) |
Income Below Poverty Among Single-Parent Households in Area Code 606
According to the poverty data in Area Code 606, 27.9% or 5,446 single-father households and 43.1% or 20,118 single-mother households are living below the poverty line. Among single-father households, those with 3 or 4 children have the highest poverty rate, with 772 households (51.5%) experiencing poverty. Likewise, among single-mother households, those with 5 or more children have the highest poverty rate, with 386 households (95.5%) falling below the poverty line.
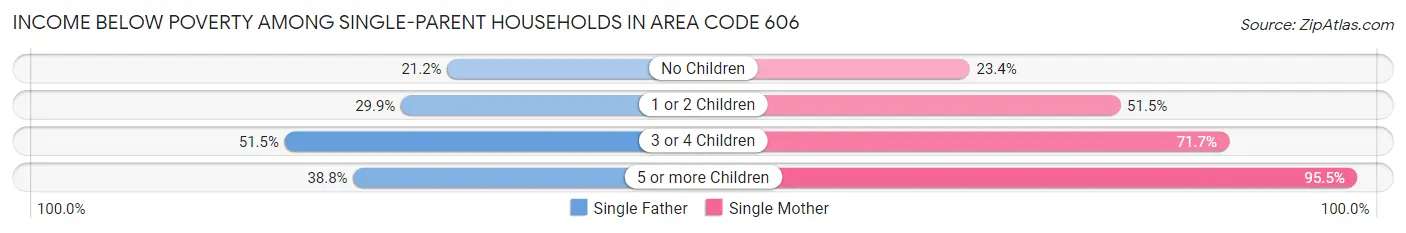
| Children | Single Father | Single Mother |
| No Children | 1,743 (21.2%) | 4,180 (23.4%) |
| 1 or 2 Children | 2,900 (29.8%) | 12,314 (51.5%) |
| 3 or 4 Children | 772 (51.5%) | 3,238 (71.7%) |
| 5 or more Children | 31 (38.8%) | 386 (95.5%) |
| Total | 5,446 (27.9%) | 20,118 (43.1%) |
Income Below Poverty Among Married-Couple vs Single-Parent Households in Area Code 606
The poverty data for Area Code 606 shows that 19,218 of the married-couple family households (10.8%) and 25,564 of the single-parent households (38.6%) are living below the poverty level. Within the married-couple family households, those with 5 or more children have the highest poverty rate, with 488 households (36.0%) falling below the poverty line. Among the single-parent households, those with 5 or more children have the highest poverty rate, with 417 household (86.2%) living below poverty.
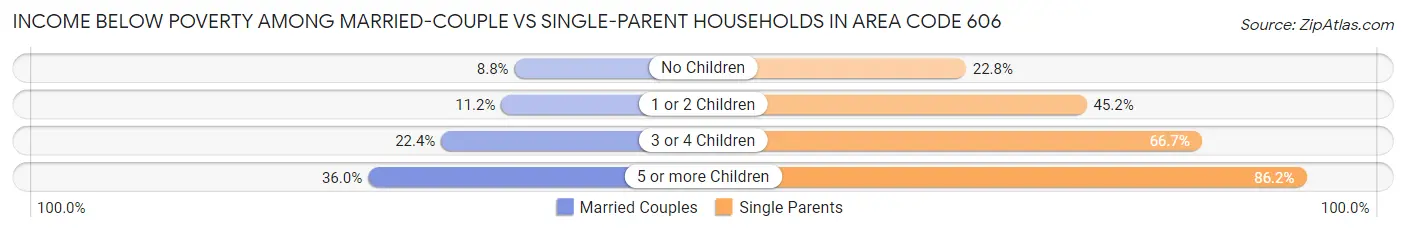
| Children | Married-Couple Families | Single-Parent Households |
| No Children | 9,462 (8.8%) | 5,923 (22.8%) |
| 1 or 2 Children | 6,248 (11.2%) | 15,214 (45.2%) |
| 3 or 4 Children | 3,020 (22.4%) | 4,010 (66.7%) |
| 5 or more Children | 488 (36.0%) | 417 (86.2%) |
| Total | 19,218 (10.8%) | 25,564 (38.6%) |
Race in Area Code 606
The most populous races in Area Code 606 are White / Caucasian (899,105 | 94.9%), Two or more Races (22,941 | 2.4%), and Black / African American (15,440 | 1.6%).
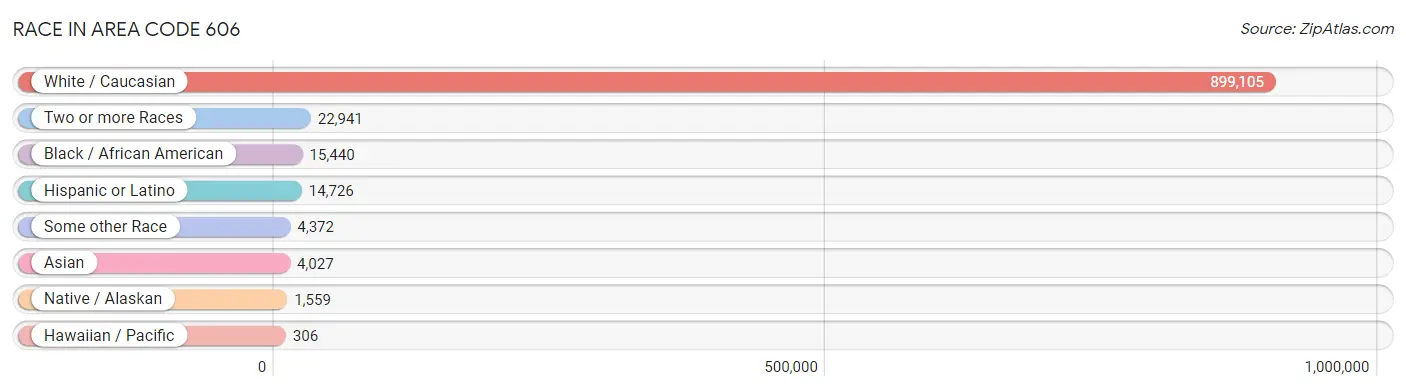
| Race | # Population | % Population |
| Asian | 4,027 | 0.4% |
| Black / African American | 15,440 | 1.6% |
| Hawaiian / Pacific | 306 | 0.0% |
| Hispanic or Latino | 14,726 | 1.5% |
| Native / Alaskan | 1,559 | 0.2% |
| White / Caucasian | 899,105 | 94.9% |
| Two or more Races | 22,941 | 2.4% |
| Some other Race | 4,372 | 0.5% |
| Total | 947,750 | 100.0% |
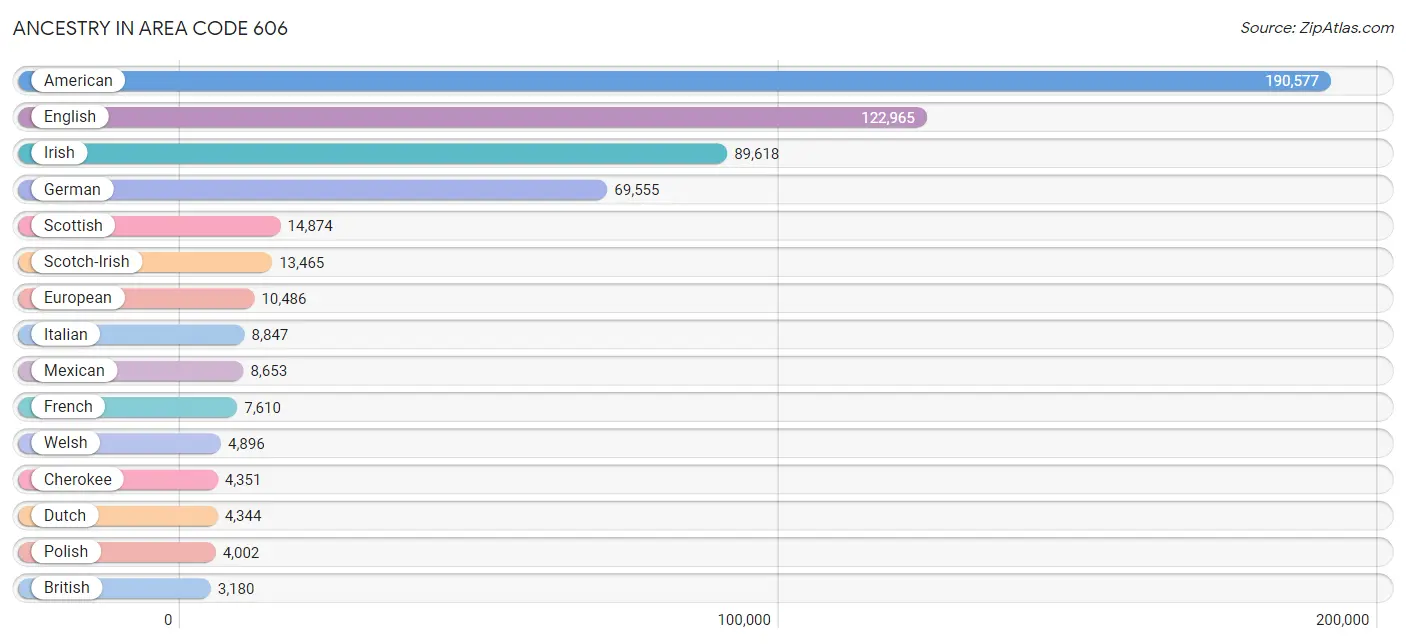
Ancestry in Area Code 606
The most populous ancestries reported in Area Code 606 are American (190,577 | 20.1%), English (122,965 | 13.0%), Irish (89,618 | 9.5%), German (69,555 | 7.3%), and Scottish (14,874 | 1.6%), together accounting for 51.5% of all Area Code 606 residents.
| Ancestry | # Population | % Population |
| African | 714 | 0.1% |
| Alaska Native | 7 | 0.0% |
| Albanian | 51 | 0.0% |
| Alsatian | 11 | 0.0% |
| American | 190,577 | 20.1% |
| Apache | 133 | 0.0% |
| Arab | 581 | 0.1% |
| Argentinean | 45 | 0.0% |
| Armenian | 18 | 0.0% |
| Australian | 107 | 0.0% |
| Austrian | 269 | 0.0% |
| Bahamian | 59 | 0.0% |
| Bangladeshi | 7 | 0.0% |
| Basque | 8 | 0.0% |
| Belgian | 130 | 0.0% |
| Belizean | 26 | 0.0% |
| Bhutanese | 475 | 0.1% |
| Blackfeet | 368 | 0.0% |
| Brazilian | 88 | 0.0% |
| British | 3,180 | 0.3% |
| British West Indian | 16 | 0.0% |
| Bulgarian | 19 | 0.0% |
| Burmese | 329 | 0.0% |
| Cajun | 81 | 0.0% |
| Canadian | 239 | 0.0% |
| Cape Verdean | 48 | 0.0% |
| Celtic | 239 | 0.0% |
| Central American | 937 | 0.1% |
| Central American Indian | 141 | 0.0% |
| Cherokee | 4,351 | 0.5% |
| Cheyenne | 5 | 0.0% |
| Chickasaw | 16 | 0.0% |
| Chilean | 13 | 0.0% |
| Chinese | 11 | 0.0% |
| Chippewa | 54 | 0.0% |
| Choctaw | 103 | 0.0% |
| Colombian | 115 | 0.0% |
| Costa Rican | 34 | 0.0% |
| Cree | 231 | 0.0% |
| Creek | 7 | 0.0% |
| Croatian | 50 | 0.0% |
| Crow | 26 | 0.0% |
| Cuban | 556 | 0.1% |
| Czech | 374 | 0.0% |
| Czechoslovakian | 110 | 0.0% |
| Danish | 358 | 0.0% |
| Dominican | 385 | 0.0% |
| Dutch | 4,344 | 0.5% |
| Dutch West Indian | 14 | 0.0% |
| Eastern European | 828 | 0.1% |
| Ecuadorian | 31 | 0.0% |
| Egyptian | 79 | 0.0% |
| English | 122,965 | 13.0% |
| Ethiopian | 3 | 0.0% |
| European | 10,486 | 1.1% |
| Fijian | 16 | 0.0% |
| Finnish | 197 | 0.0% |
| French | 7,610 | 0.8% |
| French Canadian | 560 | 0.1% |
| German | 69,555 | 7.3% |
| Greek | 800 | 0.1% |
| Guamanian / Chamorro | 72 | 0.0% |
| Guatemalan | 538 | 0.1% |
| Haitian | 45 | 0.0% |
| Honduran | 76 | 0.0% |
| Hungarian | 865 | 0.1% |
| Icelander | 31 | 0.0% |
| Indian (Asian) | 1,275 | 0.1% |
| Indonesian | 100 | 0.0% |
| Iranian | 118 | 0.0% |
| Irish | 89,618 | 9.5% |
| Iroquois | 121 | 0.0% |
| Israeli | 6 | 0.0% |
| Italian | 8,847 | 0.9% |
| Jamaican | 88 | 0.0% |
| Japanese | 202 | 0.0% |
| Jordanian | 89 | 0.0% |
| Kenyan | 5 | 0.0% |
| Korean | 1,133 | 0.1% |
| Laotian | 71 | 0.0% |
| Latvian | 14 | 0.0% |
| Lebanese | 101 | 0.0% |
| Lithuanian | 65 | 0.0% |
| Lumbee | 37 | 0.0% |
| Macedonian | 11 | 0.0% |
| Malaysian | 65 | 0.0% |
| Maltese | 60 | 0.0% |
| Mexican | 8,653 | 0.9% |
| Mexican American Indian | 40 | 0.0% |
| Mongolian | 38 | 0.0% |
| Moroccan | 52 | 0.0% |
| Native Hawaiian | 137 | 0.0% |
| Navajo | 34 | 0.0% |
| New Zealander | 15 | 0.0% |
| Nigerian | 85 | 0.0% |
| Northern European | 438 | 0.1% |
| Norwegian | 1,369 | 0.1% |
| Okinawan | 56 | 0.0% |
| Osage | 5 | 0.0% |
| Pakistani | 290 | 0.0% |
| Palestinian | 1 | 0.0% |
| Panamanian | 86 | 0.0% |
| Pennsylvania German | 992 | 0.1% |
| Peruvian | 177 | 0.0% |
| Polish | 4,002 | 0.4% |
| Portuguese | 296 | 0.0% |
| Puerto Rican | 1,761 | 0.2% |
| Romanian | 136 | 0.0% |
| Russian | 733 | 0.1% |
| Salvadoran | 203 | 0.0% |
| Samoan | 74 | 0.0% |
| Scandinavian | 1,138 | 0.1% |
| Scotch-Irish | 13,465 | 1.4% |
| Scottish | 14,874 | 1.6% |
| Seminole | 23 | 0.0% |
| Serbian | 46 | 0.0% |
| Shoshone | 2 | 0.0% |
| Sioux | 120 | 0.0% |
| Slavic | 35 | 0.0% |
| Slovak | 106 | 0.0% |
| Slovene | 10 | 0.0% |
| Somali | 10 | 0.0% |
| South African | 112 | 0.0% |
| South American | 413 | 0.0% |
| South American Indian | 42 | 0.0% |
| Spaniard | 387 | 0.0% |
| Spanish | 69 | 0.0% |
| Sri Lankan | 391 | 0.0% |
| Subsaharan African | 1,066 | 0.1% |
| Sudanese | 39 | 0.0% |
| Swedish | 1,446 | 0.2% |
| Swiss | 1,213 | 0.1% |
| Syrian | 32 | 0.0% |
| Thai | 1,249 | 0.1% |
| Tohono O'Odham | 3 | 0.0% |
| Turkish | 13 | 0.0% |
| Ugandan | 40 | 0.0% |
| Ukrainian | 747 | 0.1% |
| Ute | 15 | 0.0% |
| Venezuelan | 32 | 0.0% |
| Vietnamese | 22 | 0.0% |
| Welsh | 4,896 | 0.5% |
| West Indian | 77 | 0.0% |
| Yugoslavian | 40 | 0.0% |
| Yup'ik | 31 | 0.0% | View All 145 Rows |
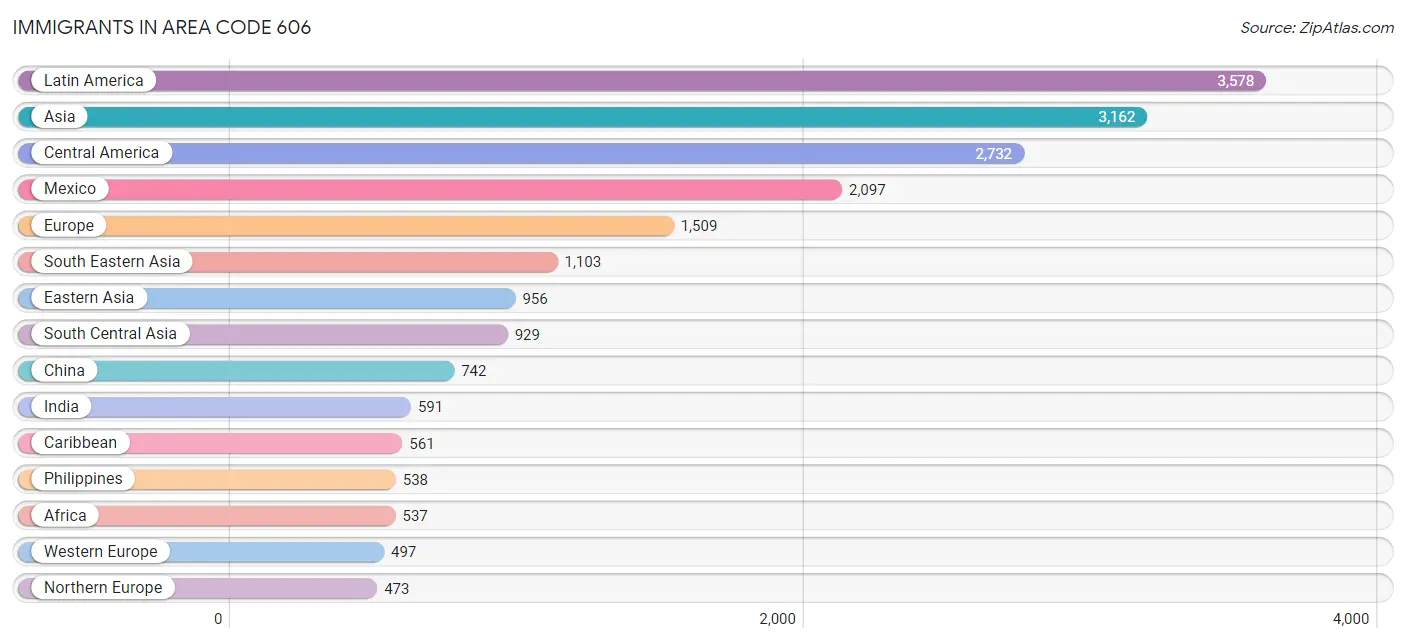
Immigrants in Area Code 606
The most numerous immigrant groups reported in Area Code 606 came from Latin America (3,578 | 0.4%), Asia (3,162 | 0.3%), Central America (2,732 | 0.3%), Mexico (2,097 | 0.2%), and Europe (1,509 | 0.2%), together accounting for 1.4% of all Area Code 606 residents.
| Immigration Origin | # Population | % Population |
| Africa | 537 | 0.1% |
| Argentina | 22 | 0.0% |
| Asia | 3,162 | 0.3% |
| Bahamas | 25 | 0.0% |
| Bangladesh | 101 | 0.0% |
| Belgium | 20 | 0.0% |
| Belize | 26 | 0.0% |
| Bosnia and Herzegovina | 33 | 0.0% |
| Brazil | 22 | 0.0% |
| Cambodia | 160 | 0.0% |
| Cameroon | 10 | 0.0% |
| Canada | 391 | 0.0% |
| Caribbean | 561 | 0.1% |
| Central America | 2,732 | 0.3% |
| China | 742 | 0.1% |
| Colombia | 89 | 0.0% |
| Congo | 46 | 0.0% |
| Costa Rica | 13 | 0.0% |
| Cuba | 305 | 0.0% |
| Czechoslovakia | 35 | 0.0% |
| Denmark | 13 | 0.0% |
| Dominican Republic | 125 | 0.0% |
| Eastern Africa | 82 | 0.0% |
| Eastern Asia | 956 | 0.1% |
| Eastern Europe | 463 | 0.1% |
| Ecuador | 18 | 0.0% |
| Egypt | 68 | 0.0% |
| El Salvador | 91 | 0.0% |
| England | 173 | 0.0% |
| Europe | 1,509 | 0.2% |
| France | 19 | 0.0% |
| Germany | 428 | 0.1% |
| Greece | 5 | 0.0% |
| Grenada | 49 | 0.0% |
| Guatemala | 302 | 0.0% |
| Guyana | 2 | 0.0% |
| Haiti | 27 | 0.0% |
| Honduras | 107 | 0.0% |
| Hong Kong | 4 | 0.0% |
| Hungary | 17 | 0.0% |
| India | 591 | 0.1% |
| Indonesia | 25 | 0.0% |
| Iran | 30 | 0.0% |
| Iraq | 39 | 0.0% |
| Ireland | 22 | 0.0% |
| Israel | 4 | 0.0% |
| Italy | 26 | 0.0% |
| Jamaica | 26 | 0.0% |
| Japan | 117 | 0.0% |
| Jordan | 64 | 0.0% |
| Kenya | 5 | 0.0% |
| Korea | 97 | 0.0% |
| Kuwait | 11 | 0.0% |
| Laos | 32 | 0.0% |
| Latin America | 3,578 | 0.4% |
| Lebanon | 9 | 0.0% |
| Mexico | 2,097 | 0.2% |
| Middle Africa | 77 | 0.0% |
| Moldova | 21 | 0.0% |
| Morocco | 15 | 0.0% |
| Netherlands | 30 | 0.0% |
| Nigeria | 63 | 0.0% |
| Northern Africa | 236 | 0.0% |
| Northern Europe | 473 | 0.1% |
| Oceania | 67 | 0.0% |
| Pakistan | 120 | 0.0% |
| Panama | 96 | 0.0% |
| Peru | 121 | 0.0% |
| Philippines | 538 | 0.1% |
| Poland | 145 | 0.0% |
| Portugal | 10 | 0.0% |
| Romania | 10 | 0.0% |
| Russia | 80 | 0.0% |
| Saudi Arabia | 7 | 0.0% |
| Scotland | 27 | 0.0% |
| Singapore | 56 | 0.0% |
| Somalia | 23 | 0.0% |
| South Africa | 38 | 0.0% |
| South America | 285 | 0.0% |
| South Central Asia | 929 | 0.1% |
| South Eastern Asia | 1,103 | 0.1% |
| Southern Europe | 76 | 0.0% |
| Spain | 35 | 0.0% |
| Sri Lanka | 2 | 0.0% |
| Sudan | 51 | 0.0% |
| Sweden | 32 | 0.0% |
| Syria | 33 | 0.0% |
| Taiwan | 48 | 0.0% |
| Thailand | 54 | 0.0% |
| Trinidad and Tobago | 4 | 0.0% |
| Uganda | 45 | 0.0% |
| Ukraine | 111 | 0.0% |
| Venezuela | 11 | 0.0% |
| Vietnam | 174 | 0.0% |
| Western Africa | 63 | 0.0% |
| Western Asia | 167 | 0.0% |
| Western Europe | 497 | 0.1% |
| Zaire | 19 | 0.0% |
| Zimbabwe | 1 | 0.0% | View All 99 Rows |
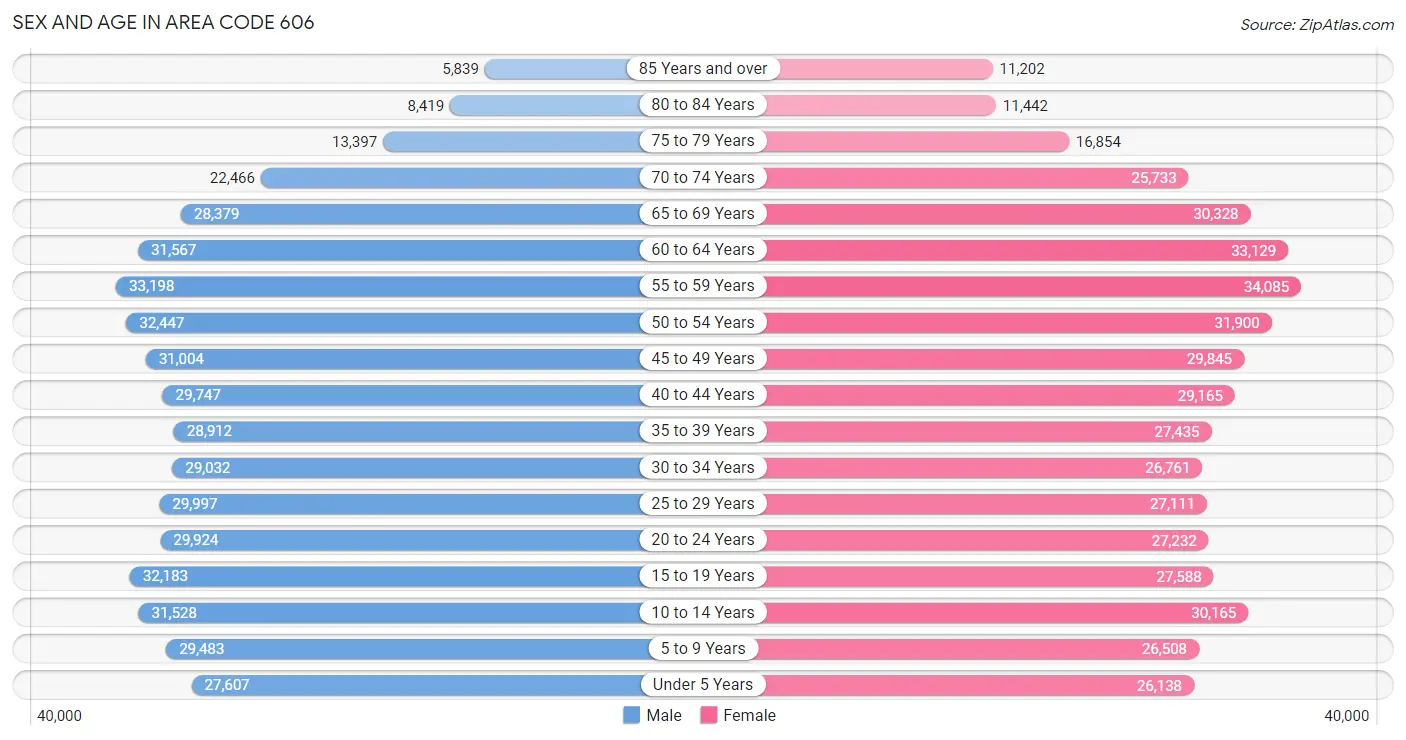
Sex and Age in Area Code 606
Sex and Age in Area Code 606
The most populous age groups in Area Code 606 are 55 to 59 Years (33,198 | 7.0%) for men and 55 to 59 Years (34,085 | 7.2%) for women.
| Age Bracket | Male | Female |
| Under 5 Years | 27,607 (5.8%) | 26,138 (5.5%) |
| 5 to 9 Years | 29,483 (6.2%) | 26,508 (5.6%) |
| 10 to 14 Years | 31,528 (6.6%) | 30,165 (6.4%) |
| 15 to 19 Years | 32,183 (6.8%) | 27,588 (5.8%) |
| 20 to 24 Years | 29,924 (6.3%) | 27,232 (5.8%) |
| 25 to 29 Years | 29,997 (6.3%) | 27,111 (5.7%) |
| 30 to 34 Years | 29,032 (6.1%) | 26,761 (5.7%) |
| 35 to 39 Years | 28,912 (6.1%) | 27,435 (5.8%) |
| 40 to 44 Years | 29,747 (6.3%) | 29,165 (6.2%) |
| 45 to 49 Years | 31,004 (6.5%) | 29,845 (6.3%) |
| 50 to 54 Years | 32,447 (6.8%) | 31,900 (6.8%) |
| 55 to 59 Years | 33,198 (7.0%) | 34,085 (7.2%) |
| 60 to 64 Years | 31,567 (6.6%) | 33,129 (7.0%) |
| 65 to 69 Years | 28,379 (6.0%) | 30,328 (6.4%) |
| 70 to 74 Years | 22,466 (4.7%) | 25,733 (5.4%) |
| 75 to 79 Years | 13,397 (2.8%) | 16,854 (3.6%) |
| 80 to 84 Years | 8,419 (1.8%) | 11,442 (2.4%) |
| 85 Years and over | 5,839 (1.2%) | 11,202 (2.4%) |
| Total | 475,129 (100.0%) | 472,621 (100.0%) |
Families and Households in Area Code 606
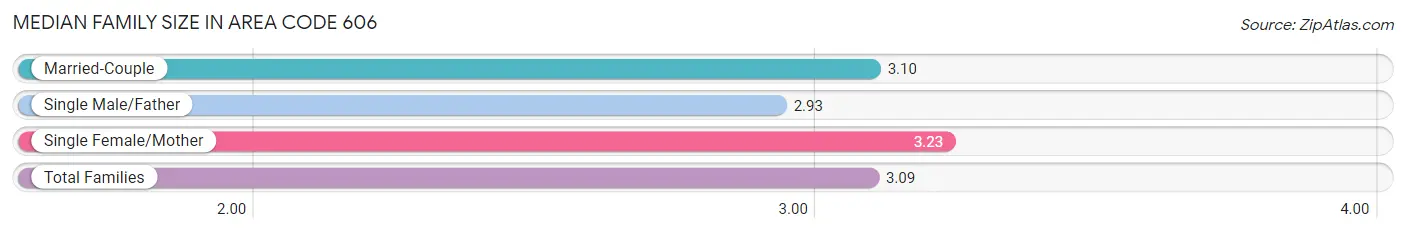
Median Family Size in Area Code 606
The median family size in Area Code 606 is 3.09 persons per family, with single female/mother families (46,659 | 19.1%) accounting for the largest median family size of 3.22974 persons per family. On the other hand, single male/father families (19,500 | 8.0%) represent the smallest median family size with 2.93 persons per family.
| Family Type | # Families | Family Size |
| Married-Couple | 178,435 (73.0%) | 3.10 |
| Single Male/Father | 19,500 (8.0%) | 2.93 |
| Single Female/Mother | 46,659 (19.1%) | 3.23 |
| Total Families | 244,594 (100.0%) | 3.09 |
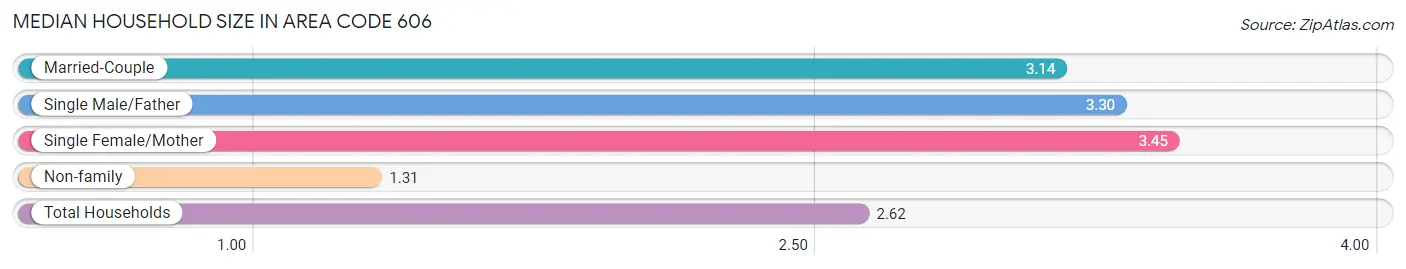
Median Household Size in Area Code 606
The median household size in Area Code 606 is 2.62 persons per household, with single female/mother households (46,659 | 12.9%) accounting for the largest median household size of 3.44612 persons per household. non-family households (116,892 | 32.3%) represent the smallest median household size with 1.31 persons per household.
| Household Type | # Households | Household Size |
| Married-Couple | 178,435 (49.4%) | 3.14 |
| Single Male/Father | 19,500 (5.4%) | 3.30 |
| Single Female/Mother | 46,659 (12.9%) | 3.45 |
| Non-family | 116,892 (32.3%) | 1.31 |
| Total Households | 361,486 (100.0%) | 2.62 |
Household Size by Marriage Status in Area Code 606
Out of a total of 361,486 households in Area Code 606, 244,594 (67.7%) are family households, while 116,892 (32.3%) are nonfamily households. The most numerous type of family households are 2-person households, comprising 113,847, and the most common type of nonfamily households are 1-person households, comprising 99,642.
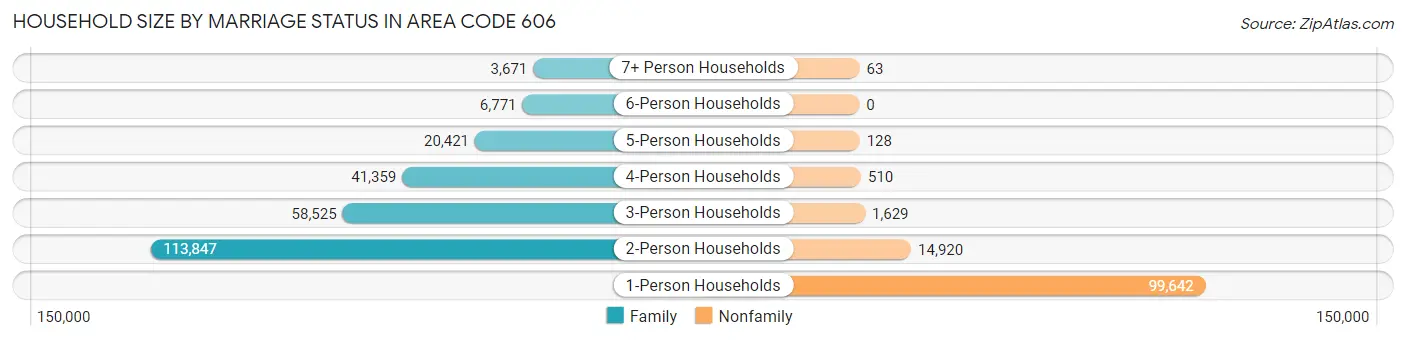
| Household Size | Family Households | Nonfamily Households |
| 1-Person Households | - | 99,642 (27.6%) |
| 2-Person Households | 113,847 (31.5%) | 14,920 (4.1%) |
| 3-Person Households | 58,525 (16.2%) | 1,629 (0.4%) |
| 4-Person Households | 41,359 (11.4%) | 510 (0.1%) |
| 5-Person Households | 20,421 (5.7%) | 128 (0.0%) |
| 6-Person Households | 6,771 (1.9%) | 0 (0.0%) |
| 7+ Person Households | 3,671 (1.0%) | 63 (0.0%) |
| Total | 244,594 (67.7%) | 116,892 (32.3%) |
Female Fertility in Area Code 606
Fertility by Age in Area Code 606
Average fertility rate in Area Code 606 is 102.1 births per 1,000 women. Women in the age bracket of 15 to 19 years have the highest fertility rate with 234.8 births per 1,000 women. Women in the age bracket of 20 to 34 years acount for 82.9% of all women with births.
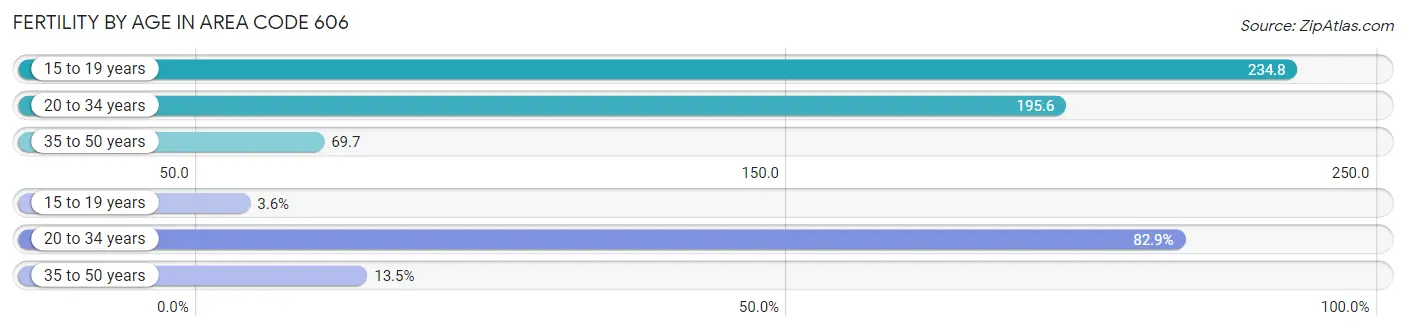
| Age Bracket | Women with Births | Births / 1,000 Women |
| 15 to 19 years | 369 (3.6%) | 234.8 |
| 20 to 34 years | 8,521 (82.9%) | 195.6 |
| 35 to 50 years | 1,389 (13.5%) | 69.7 |
| Total | 10,279 (100.0%) | 102.1 |
Fertility by Age by Marriage Status in Area Code 606
44.5% of women with births (10,279) in Area Code 606 are married. The highest percentage of unmarried women with births falls into 15 to 19 years age bracket with 98.6% of them unmarried at the time of birth, while the lowest percentage of unmarried women with births belong to 20 to 34 years age bracket with 55.4% of them unmarried.
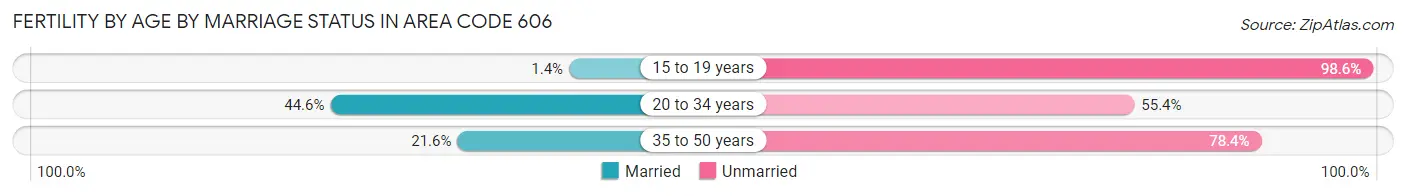
| Age Bracket | Married | Unmarried |
| 15 to 19 years | 5 (1.4%) | 364 (98.6%) |
| 20 to 34 years | 3,801 (44.6%) | 4,720 (55.4%) |
| 35 to 50 years | 300 (21.6%) | 1,089 (78.4%) |
| Total | 4,574 (44.5%) | 5,705 (55.5%) |
Fertility by Education in Area Code 606
Average fertility rate in Area Code 606 is 102.1 births per 1,000 women. Women with the education attainment of bachelor's degree have the highest fertility rate of 235.2 births per 1,000 women, while women with the education attainment of college or associate's degree have the lowest fertility at 139.8 births per 1,000 women. Women with the education attainment of college or associate's degree represent 35.4% of all women with births.
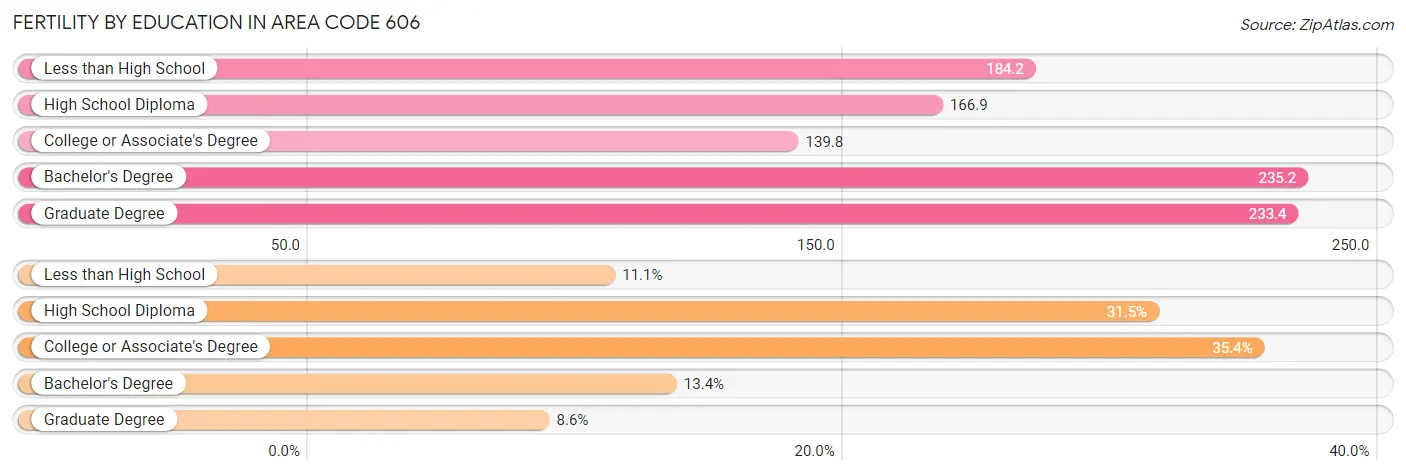
| Educational Attainment | Women with Births | Births / 1,000 Women |
| Less than High School | 1,140 (11.1%) | 184.2 |
| High School Diploma | 3,234 (31.5%) | 166.9 |
| College or Associate's Degree | 3,641 (35.4%) | 139.8 |
| Bachelor's Degree | 1,377 (13.4%) | 235.2 |
| Graduate Degree | 887 (8.6%) | 233.4 |
| Total | 10,279 (100.0%) | 102.1 |
Fertility by Education by Marriage Status in Area Code 606
55.5% of women with births in Area Code 606 are unmarried. Women with the educational attainment of graduate degree are most likely to be married with 41.4% of them married at childbirth, while women with the educational attainment of less than high school are least likely to be married with 87.9% of them unmarried at childbirth.
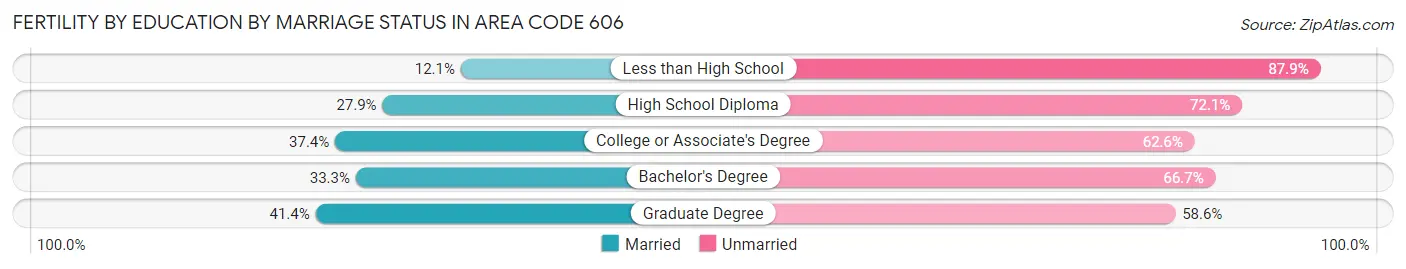
| Educational Attainment | Married | Unmarried |
| Less than High School | 138 (12.1%) | 1,002 (87.9%) |
| High School Diploma | 902 (27.9%) | 2,332 (72.1%) |
| College or Associate's Degree | 1,363 (37.4%) | 2,278 (62.6%) |
| Bachelor's Degree | 458 (33.3%) | 919 (66.7%) |
| Graduate Degree | 367 (41.4%) | 520 (58.6%) |
| Total | 4,574 (44.5%) | 5,705 (55.5%) |
Employment Characteristics in Area Code 606
Employment by Class of Employer in Area Code 606
Among the 330,886 employed individuals in Area Code 606, private company employees (214,715 | 64.9%), not-for-profit organizations (29,437 | 8.9%), and local government employees (25,114 | 7.6%) make up the most common classes of employment.
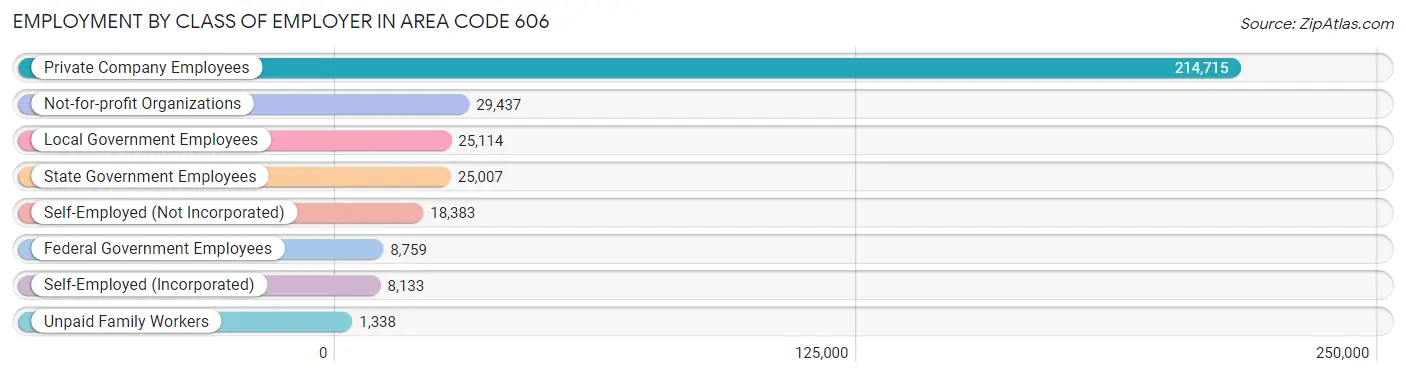
| Employer Class | # Employees | % Employees |
| Private Company Employees | 214,715 | 64.9% |
| Self-Employed (Incorporated) | 8,133 | 2.5% |
| Self-Employed (Not Incorporated) | 18,383 | 5.6% |
| Not-for-profit Organizations | 29,437 | 8.9% |
| Local Government Employees | 25,114 | 7.6% |
| State Government Employees | 25,007 | 7.6% |
| Federal Government Employees | 8,759 | 2.6% |
| Unpaid Family Workers | 1,338 | 0.4% |
| Total | 330,886 | 100.0% |
Employment Status by Age in Area Code 606
According to the labor force statistics for Area Code 606, out of the total population over 16 years of age (763,763), 44.3% or 338,500 individuals are in the labor force, with 11.3% or 38,318 of them unemployed. The age group with the highest labor force participation rate is 25 to 29 years, with 76.7% or 43,802 individuals in the labor force. Within the labor force, the 16 to 19 years age range has the highest percentage of unemployed individuals, with 3,911.5% or 838,586 of them being unemployed.
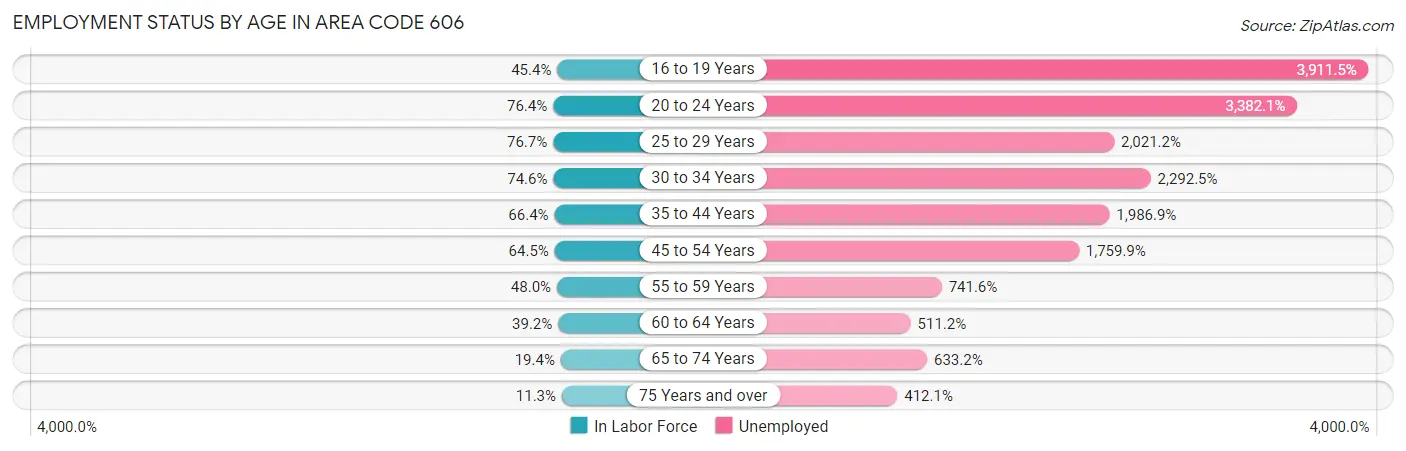
| Age Bracket | In Labor Force | Unemployed |
| 16 to 19 Years | 21,437 (45.4%) | 838,586 (3,911.5%) |
| 20 to 24 Years | 43,642 (76.4%) | 1,476,084 (3,382.1%) |
| 25 to 29 Years | 43,802 (76.7%) | 885,326 (2,021.2%) |
| 30 to 34 Years | 41,607 (74.6%) | 953,795 (2,292.5%) |
| 35 to 44 Years | 76,470 (66.3%) | 1,519,462 (1,986.9%) |
| 45 to 54 Years | 80,689 (64.4%) | 1,420,046 (1,759.9%) |
| 55 to 59 Years | 32,261 (47.9%) | 239,255 (741.6%) |
| 60 to 64 Years | 25,327 (39.2%) | 129,477 (511.2%) |
| 65 to 74 Years | 20,712 (19.4%) | 131,123 (633.2%) |
| 75 Years and over | 7,582 (11.3%) | 31,245 (412.1%) |
| Total | 338,463 (44.3%) | 38,331 (11.3%) |
Employment Status by Educational Attainment in Area Code 606
According to labor force statistics for Area Code 606, 56.0% of individuals (271,788) out of the total population between 25 and 64 years of age (485,335) are in the labor force, with 2,090.8% or 5,682,544 of them being unemployed. The group with the highest labor force participation rate are those with the educational attainment of bachelor's degree or higher, with 84.5% or 67,212 individuals in the labor force. Within the labor force, individuals with less than high school education have the highest percentage of unemployment, with 2,835.1% or 787,194 of them being unemployed.
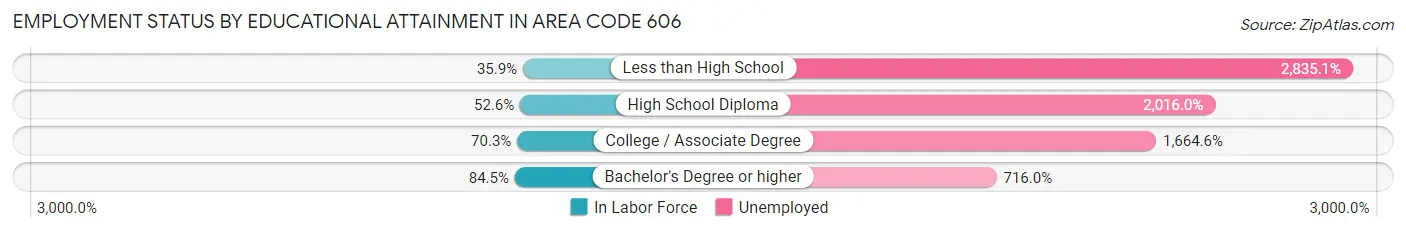
| Educational Attainment | In Labor Force | Unemployed |
| Less than High School | 27,763 (35.9%) | 2,193,942 (2,835.1%) |
| High School Diploma | 98,522 (52.6%) | 3,773,771 (2,016.0%) |
| College / Associate Degree | 99,344 (70.3%) | 2,350,865 (1,664.6%) |
| Bachelor's Degree or higher | 67,214 (84.5%) | 569,449 (716.0%) |
| Total | 271,777 (56.0%) | 10,147,384 (2,090.8%) |
Employment Occupations by Sex in Area Code 606
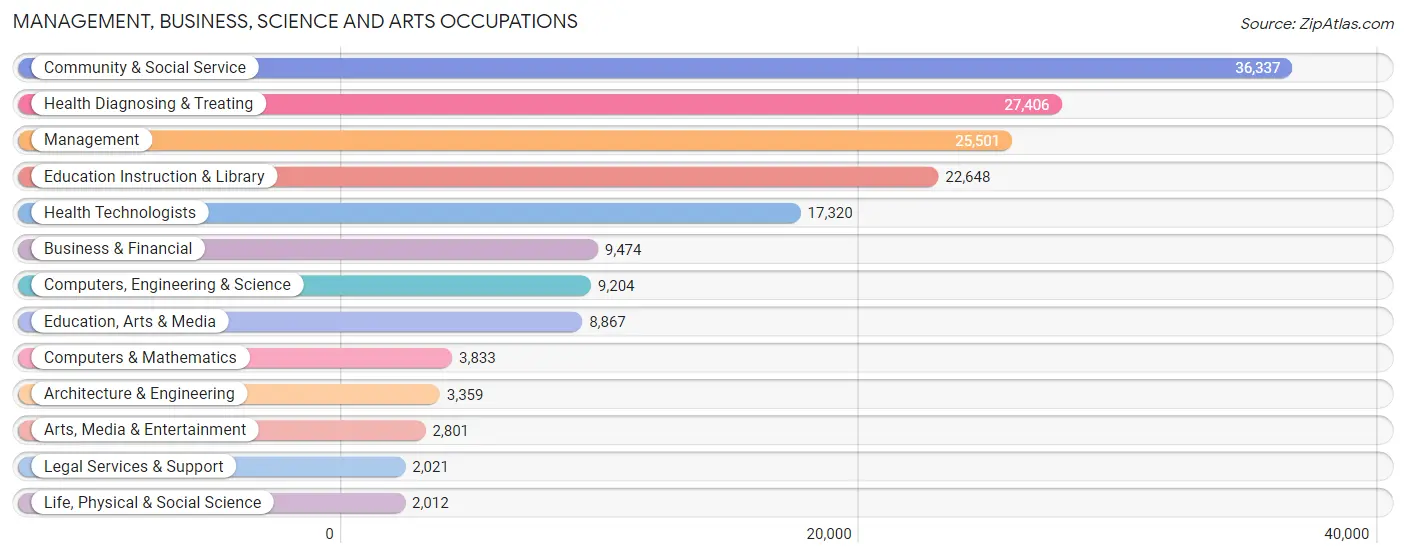
Management, Business, Science and Arts Occupations
The most common Management, Business, Science and Arts occupations in Area Code 606 are Community & Social Service (36,337 | 10.7%), Health Diagnosing & Treating (27,406 | 8.1%), Management (25,501 | 7.5%), Education Instruction & Library (22,648 | 6.7%), and Health Technologists (17,320 | 5.1%).
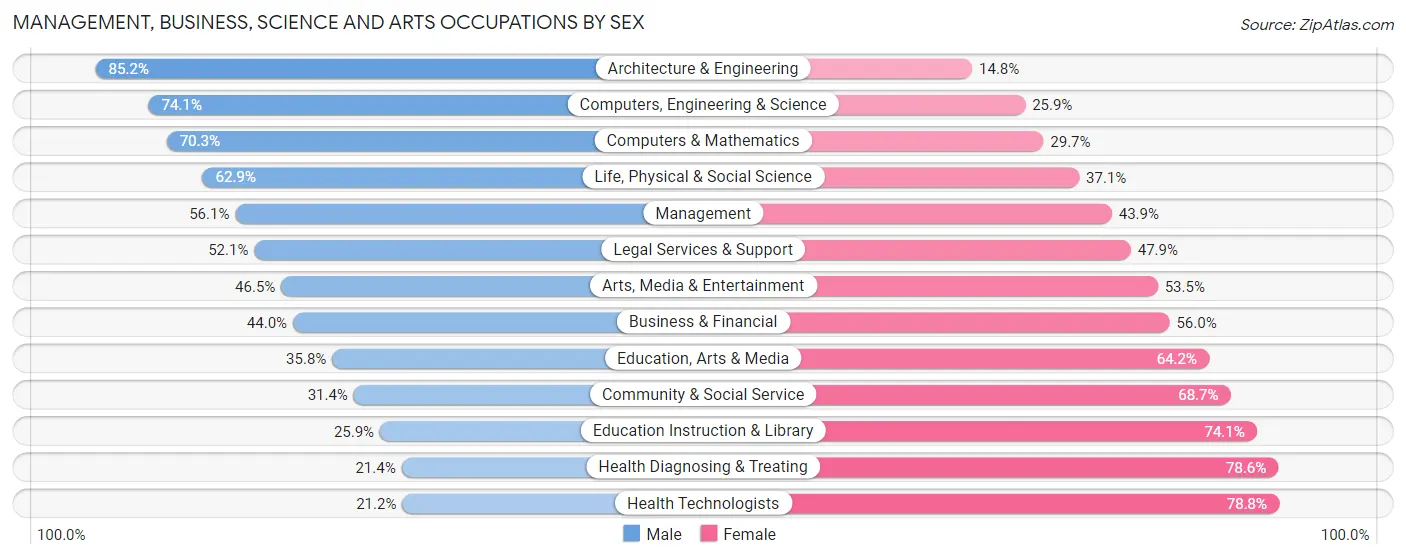
Management, Business, Science and Arts Occupations by Sex
Within the Management, Business, Science and Arts occupations in Area Code 606, the most male-oriented occupations are Architecture & Engineering (85.2%), Computers, Engineering & Science (74.1%), and Computers & Mathematics (70.3%), while the most female-oriented occupations are Health Technologists (78.8%), Health Diagnosing & Treating (78.6%), and Education Instruction & Library (74.1%).
| Occupation | Male | Female |
| Management | 14,295 (56.1%) | 11,206 (43.9%) |
| Business & Financial | 4,171 (44.0%) | 5,303 (56.0%) |
| Computers, Engineering & Science | 6,823 (74.1%) | 2,381 (25.9%) |
| Computers & Mathematics | 2,696 (70.3%) | 1,137 (29.7%) |
| Architecture & Engineering | 2,862 (85.2%) | 497 (14.8%) |
| Life, Physical & Social Science | 1,265 (62.9%) | 747 (37.1%) |
| Community & Social Service | 11,392 (31.4%) | 24,945 (68.6%) |
| Education, Arts & Media | 3,178 (35.8%) | 5,689 (64.2%) |
| Legal Services & Support | 1,053 (52.1%) | 968 (47.9%) |
| Education Instruction & Library | 5,859 (25.9%) | 16,789 (74.1%) |
| Arts, Media & Entertainment | 1,302 (46.5%) | 1,499 (53.5%) |
| Health Diagnosing & Treating | 5,859 (21.4%) | 21,547 (78.6%) |
| Health Technologists | 3,675 (21.2%) | 13,645 (78.8%) |
| Total (Category) | 42,540 (39.4%) | 65,382 (60.6%) |
| Total (Overall) | 179,500 (52.8%) | 160,196 (47.2%) |
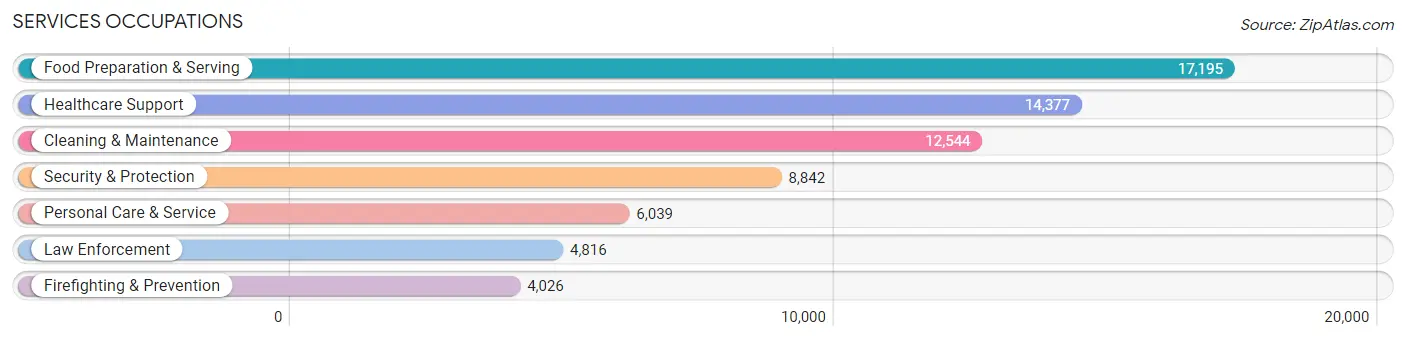
Services Occupations
The most common Services occupations in Area Code 606 are Food Preparation & Serving (17,195 | 5.1%), Healthcare Support (14,377 | 4.2%), Cleaning & Maintenance (12,544 | 3.7%), Security & Protection (8,842 | 2.6%), and Personal Care & Service (6,039 | 1.8%).
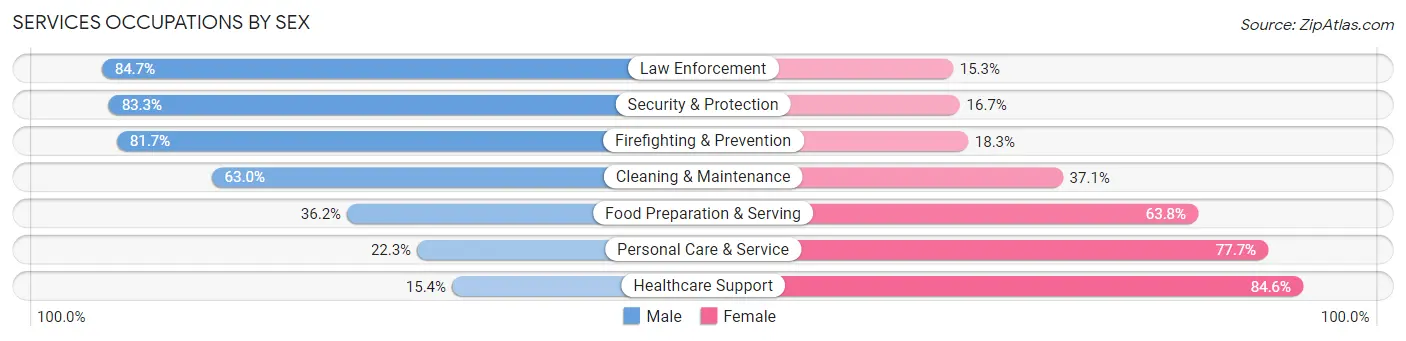
Services Occupations by Sex
Within the Services occupations in Area Code 606, the most male-oriented occupations are Law Enforcement (84.7%), Security & Protection (83.3%), and Firefighting & Prevention (81.7%), while the most female-oriented occupations are Healthcare Support (84.6%), Personal Care & Service (77.7%), and Food Preparation & Serving (63.8%).
| Occupation | Male | Female |
| Healthcare Support | 2,213 (15.4%) | 12,164 (84.6%) |
| Security & Protection | 7,369 (83.3%) | 1,473 (16.7%) |
| Firefighting & Prevention | 3,290 (81.7%) | 736 (18.3%) |
| Law Enforcement | 4,079 (84.7%) | 737 (15.3%) |
| Food Preparation & Serving | 6,222 (36.2%) | 10,973 (63.8%) |
| Cleaning & Maintenance | 7,897 (62.9%) | 4,647 (37.0%) |
| Personal Care & Service | 1,347 (22.3%) | 4,692 (77.7%) |
| Total (Category) | 25,048 (42.5%) | 33,949 (57.5%) |
| Total (Overall) | 179,500 (52.8%) | 160,196 (47.2%) |
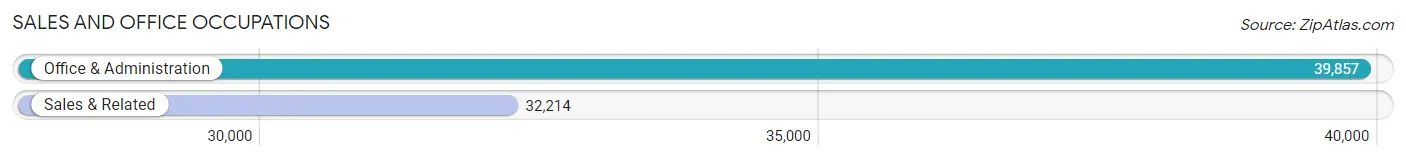
Sales and Office Occupations
The most common Sales and Office occupations in Area Code 606 are Office & Administration (39,857 | 11.7%), and Sales & Related (32,214 | 9.5%).
Sales and Office Occupations by Sex
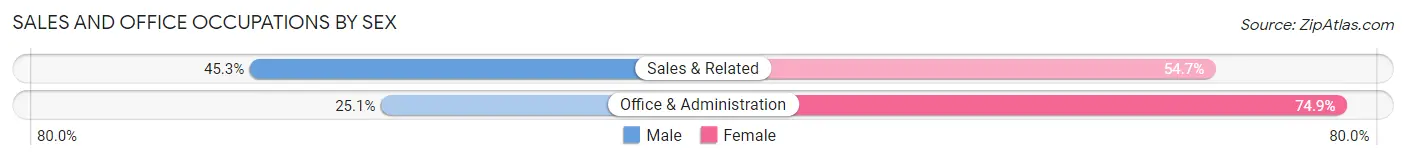
| Occupation | Male | Female |
| Sales & Related | 14,598 (45.3%) | 17,616 (54.7%) |
| Office & Administration | 10,017 (25.1%) | 29,840 (74.9%) |
| Total (Category) | 24,615 (34.2%) | 47,456 (65.8%) |
| Total (Overall) | 179,500 (52.8%) | 160,196 (47.2%) |
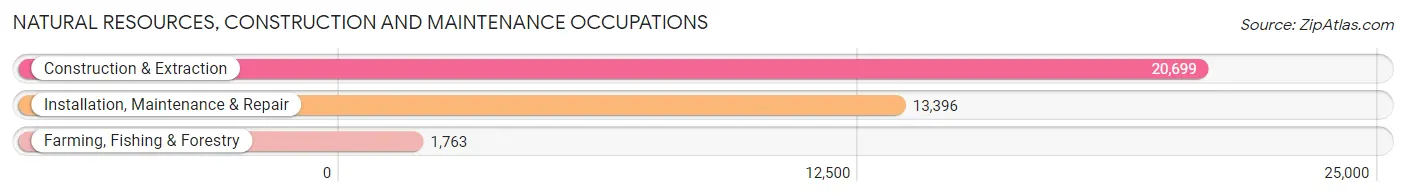
Natural Resources, Construction and Maintenance Occupations
The most common Natural Resources, Construction and Maintenance occupations in Area Code 606 are Construction & Extraction (20,699 | 6.1%), Installation, Maintenance & Repair (13,396 | 3.9%), and Farming, Fishing & Forestry (1,763 | 0.5%).
Natural Resources, Construction and Maintenance Occupations by Sex
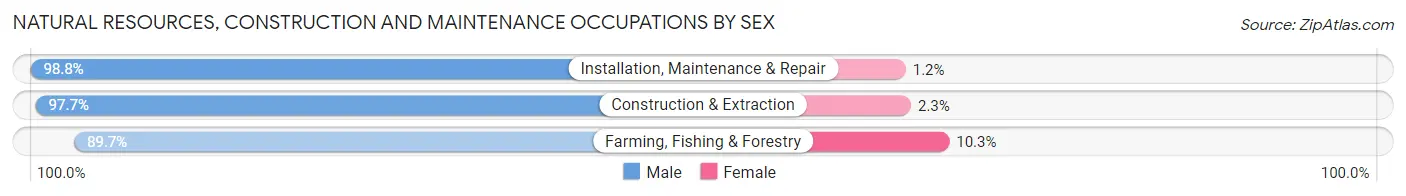
| Occupation | Male | Female |
| Farming, Fishing & Forestry | 1,582 (89.7%) | 181 (10.3%) |
| Construction & Extraction | 20,220 (97.7%) | 479 (2.3%) |
| Installation, Maintenance & Repair | 13,233 (98.8%) | 163 (1.2%) |
| Total (Category) | 35,035 (97.7%) | 823 (2.3%) |
| Total (Overall) | 179,500 (52.8%) | 160,196 (47.2%) |
Production, Transportation and Moving Occupations
The most common Production, Transportation and Moving occupations in Area Code 606 are Production (30,143 | 8.9%), Material Moving (18,717 | 5.5%), and Transportation (15,988 | 4.7%).
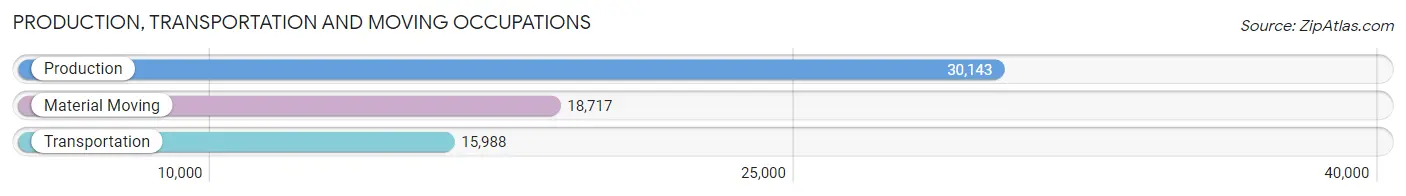
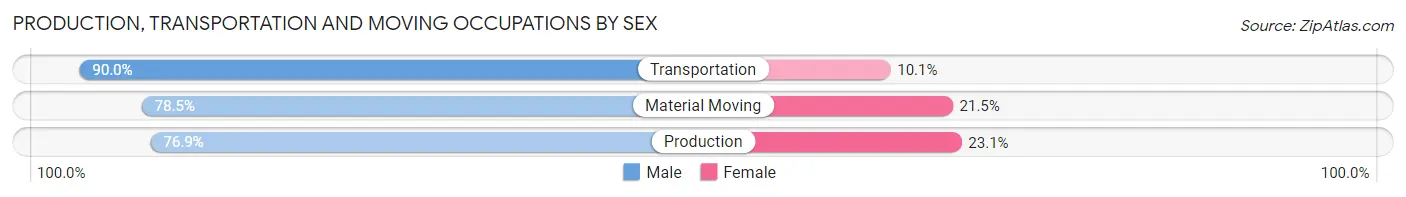
Production, Transportation and Moving Occupations by Sex
| Occupation | Male | Female |
| Production | 23,184 (76.9%) | 6,959 (23.1%) |
| Transportation | 14,382 (89.9%) | 1,606 (10.1%) |
| Material Moving | 14,696 (78.5%) | 4,021 (21.5%) |
| Total (Category) | 52,262 (80.6%) | 12,586 (19.4%) |
| Total (Overall) | 179,500 (52.8%) | 160,196 (47.2%) |
Employment Industries by Sex in Area Code 606
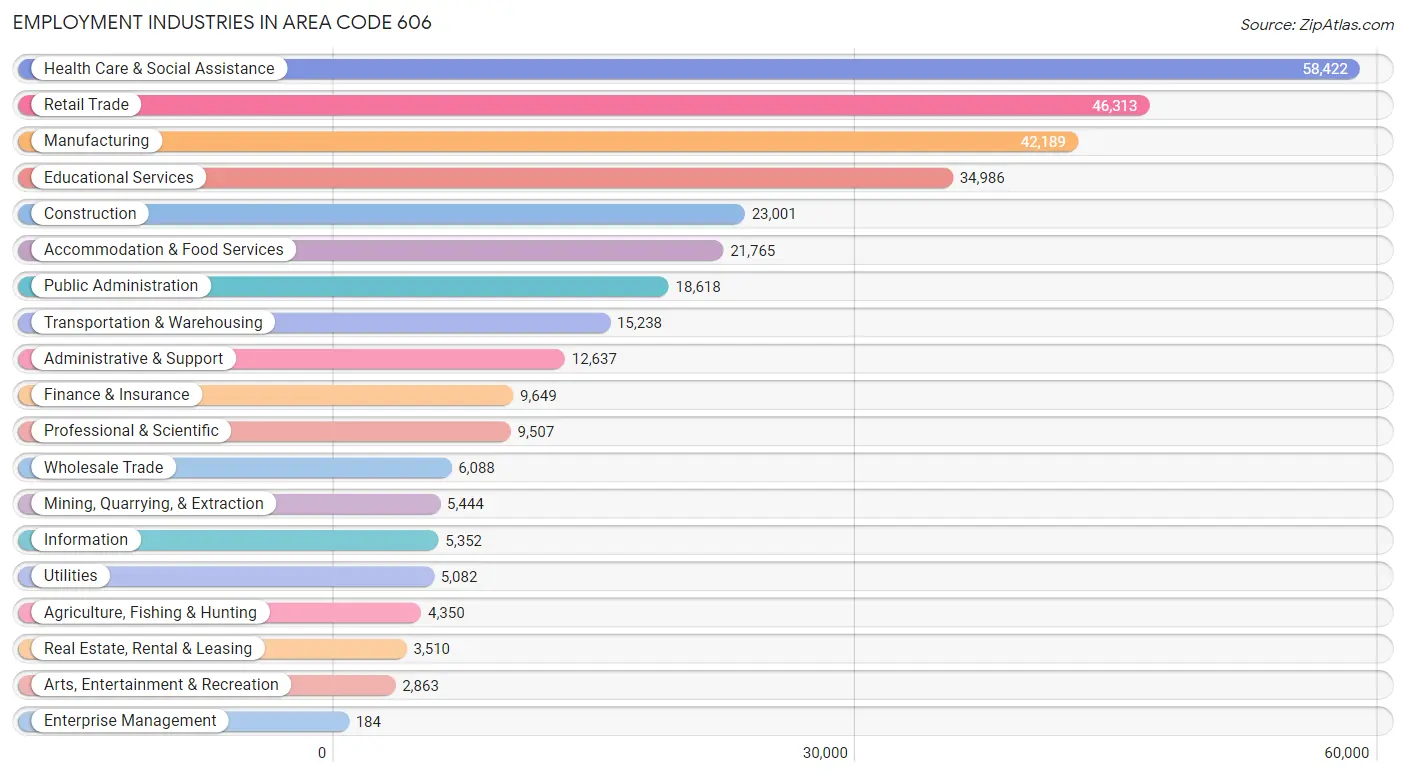
Employment Industries in Area Code 606
The major employment industries in Area Code 606 include Health Care & Social Assistance (58,422 | 17.2%), Retail Trade (46,313 | 13.6%), Manufacturing (42,189 | 12.4%), Educational Services (34,986 | 10.3%), and Construction (23,001 | 6.8%).
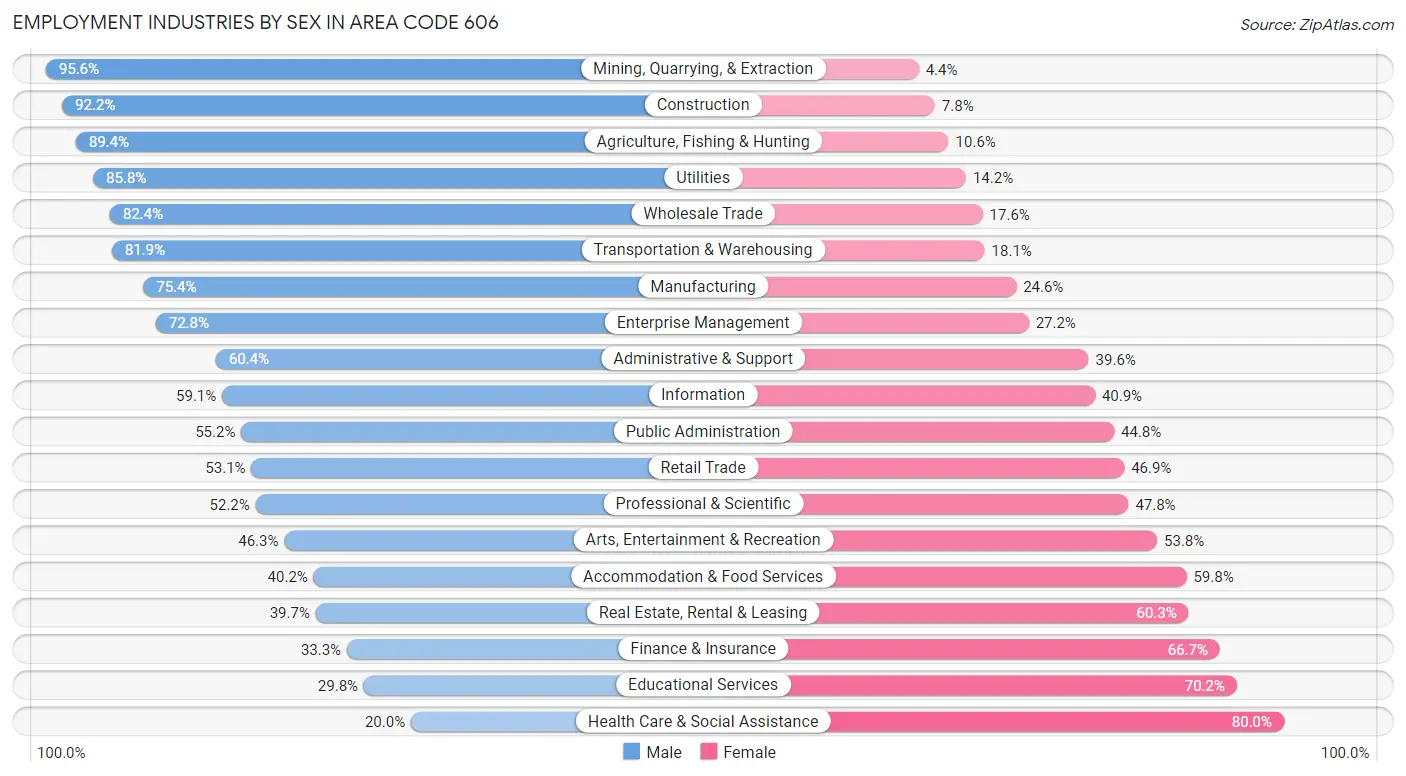
Employment Industries by Sex in Area Code 606
The Area Code 606 industries that see more men than women are Mining, Quarrying, & Extraction (95.6%), Construction (92.2%), and Agriculture, Fishing & Hunting (89.4%), whereas the industries that tend to have a higher number of women are Health Care & Social Assistance (80.0%), Educational Services (70.2%), and Finance & Insurance (66.7%).
| Industry | Male | Female |
| Agriculture, Fishing & Hunting | 3,889 (89.4%) | 461 (10.6%) |
| Mining, Quarrying, & Extraction | 5,204 (95.6%) | 240 (4.4%) |
| Construction | 21,217 (92.2%) | 1,784 (7.8%) |
| Manufacturing | 31,820 (75.4%) | 10,369 (24.6%) |
| Wholesale Trade | 5,014 (82.4%) | 1,074 (17.6%) |
| Retail Trade | 24,574 (53.1%) | 21,739 (46.9%) |
| Transportation & Warehousing | 12,486 (81.9%) | 2,752 (18.1%) |
| Utilities | 4,361 (85.8%) | 721 (14.2%) |
| Information | 3,164 (59.1%) | 2,188 (40.9%) |
| Finance & Insurance | 3,211 (33.3%) | 6,438 (66.7%) |
| Real Estate, Rental & Leasing | 1,395 (39.7%) | 2,115 (60.3%) |
| Professional & Scientific | 4,961 (52.2%) | 4,546 (47.8%) |
| Enterprise Management | 134 (72.8%) | 50 (27.2%) |
| Administrative & Support | 7,635 (60.4%) | 5,002 (39.6%) |
| Educational Services | 10,417 (29.8%) | 24,569 (70.2%) |
| Health Care & Social Assistance | 11,695 (20.0%) | 46,727 (80.0%) |
| Arts, Entertainment & Recreation | 1,324 (46.3%) | 1,539 (53.7%) |
| Accommodation & Food Services | 8,742 (40.2%) | 13,023 (59.8%) |
| Public Administration | 10,270 (55.2%) | 8,348 (44.8%) |
| Total | 179,500 (52.8%) | 160,196 (47.2%) |
Education in Area Code 606
School Enrollment in Area Code 606
The most common levels of schooling among the 202,847 students in Area Code 606 are middle school (47,758 | 23.5%), high school (46,853 | 23.1%), and elementary school (44,392 | 21.9%).
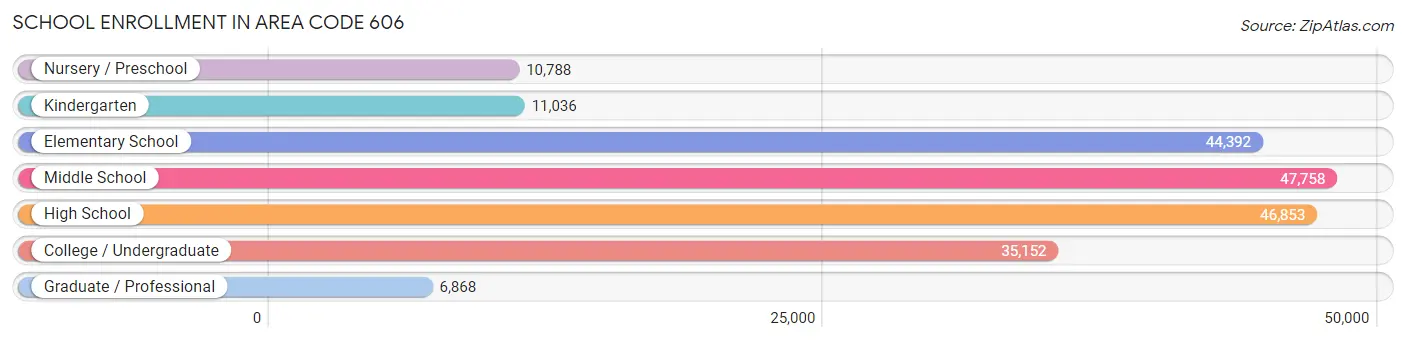
| School Level | # Students | % Students |
| Nursery / Preschool | 10,788 | 5.3% |
| Kindergarten | 11,036 | 5.4% |
| Elementary School | 44,392 | 21.9% |
| Middle School | 47,758 | 23.5% |
| High School | 46,853 | 23.1% |
| College / Undergraduate | 35,152 | 17.3% |
| Graduate / Professional | 6,868 | 3.4% |
| Total | 202,847 | 100.0% |
School Enrollment by Age by Funding Source in Area Code 606
Out of a total of 202,847 students who are enrolled in schools in Area Code 606, 24,586 (12.1%) attend a private institution, while the remaining 178,261 (87.9%) are enrolled in public schools. The age group of 35 years and over has the highest likelihood of being enrolled in private schools, with 2,197 (25.4% in the age bracket) enrolled. Conversely, the age group of 15 to 17 year olds has the lowest likelihood of being enrolled in a private school, with 32,162 (91.9% in the age bracket) attending a public institution.
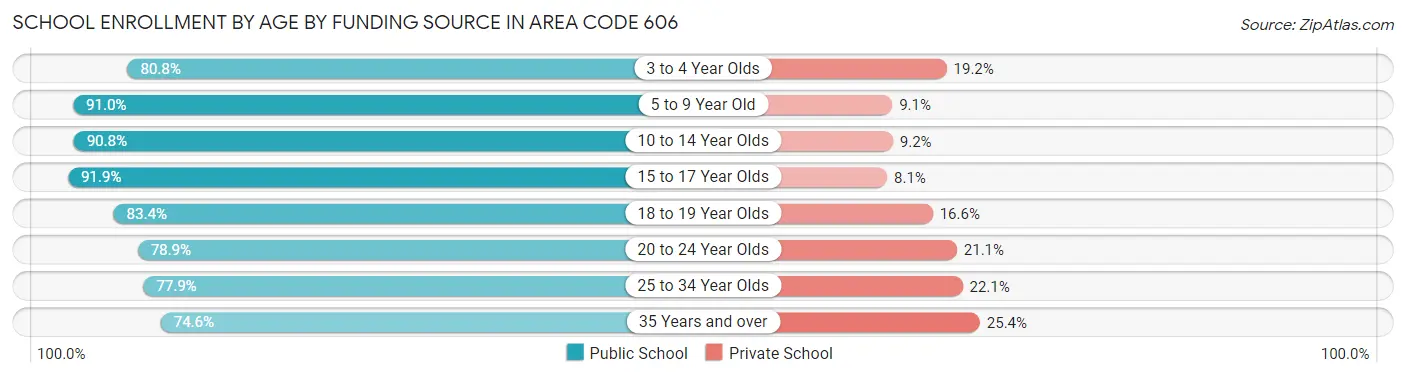
| Age Bracket | Public School | Private School |
| 3 to 4 Year Olds | 5,815 (80.8%) | 1,379 (19.2%) |
| 5 to 9 Year Old | 47,004 (90.9%) | 4,676 (9.0%) |
| 10 to 14 Year Olds | 53,734 (90.8%) | 5,419 (9.2%) |
| 15 to 17 Year Olds | 32,162 (91.9%) | 2,832 (8.1%) |
| 18 to 19 Year Olds | 12,926 (83.4%) | 2,571 (16.6%) |
| 20 to 24 Year Olds | 13,266 (78.9%) | 3,544 (21.1%) |
| 25 to 34 Year Olds | 6,897 (77.9%) | 1,961 (22.1%) |
| 35 Years and over | 6,464 (74.6%) | 2,197 (25.4%) |
| Total | 178,261 (87.9%) | 24,586 (12.1%) |
Educational Attainment by Field of Study in Area Code 606
Education (26,933 | 24.2%), business (16,658 | 15.0%), science & technology (14,997 | 13.5%), arts & humanities (10,443 | 9.4%), and bio, nature & agricultural (6,933 | 6.2%) are the most common fields of study among 111,210 individuals in Area Code 606 who have obtained a bachelor's degree or higher.
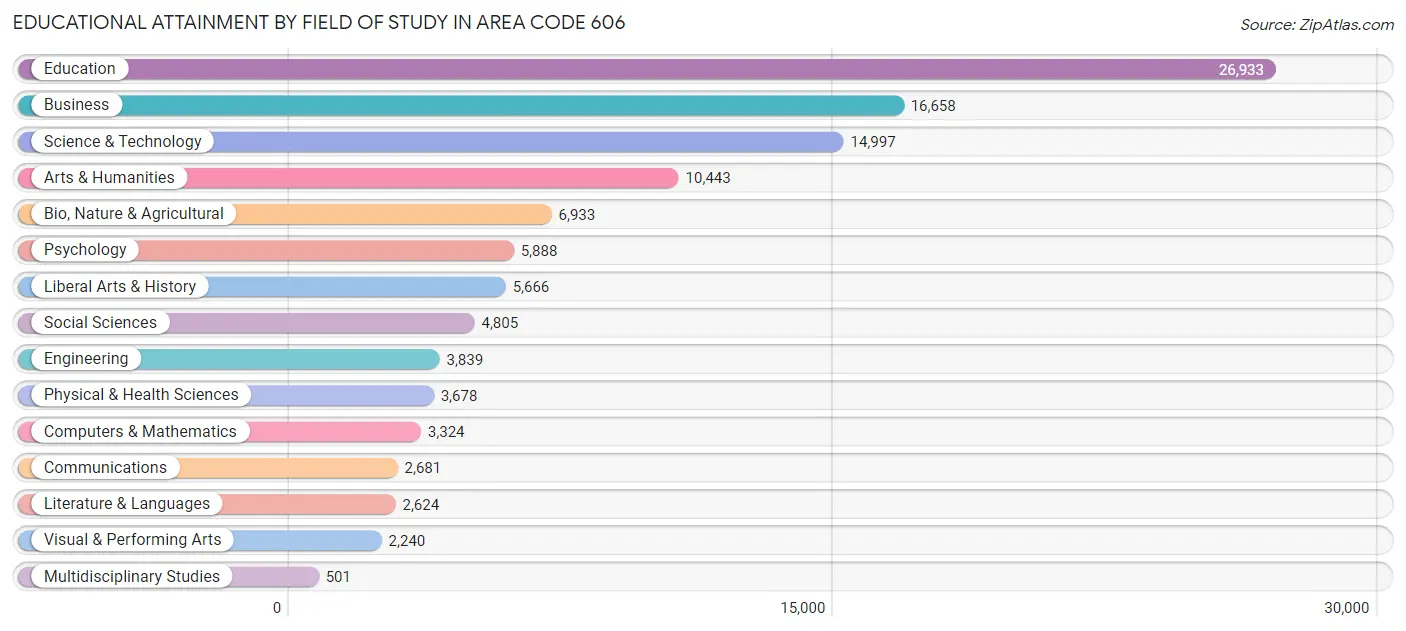
| Field of Study | # Graduates | % Graduates |
| Computers & Mathematics | 3,324 | 3.0% |
| Bio, Nature & Agricultural | 6,933 | 6.2% |
| Physical & Health Sciences | 3,678 | 3.3% |
| Psychology | 5,888 | 5.3% |
| Social Sciences | 4,805 | 4.3% |
| Engineering | 3,839 | 3.5% |
| Multidisciplinary Studies | 501 | 0.4% |
| Science & Technology | 14,997 | 13.5% |
| Business | 16,658 | 15.0% |
| Education | 26,933 | 24.2% |
| Literature & Languages | 2,624 | 2.4% |
| Liberal Arts & History | 5,666 | 5.1% |
| Visual & Performing Arts | 2,240 | 2.0% |
| Communications | 2,681 | 2.4% |
| Arts & Humanities | 10,443 | 9.4% |
| Total | 111,210 | 100.0% |
Transportation & Commute in Area Code 606
Vehicle Availability by Sex in Area Code 606
The most prevalent vehicle ownership categories in Area Code 606 are males with 2 vehicles (69,396, accounting for 39.7%) and females with 2 vehicles (59,525, making up 45.2%).
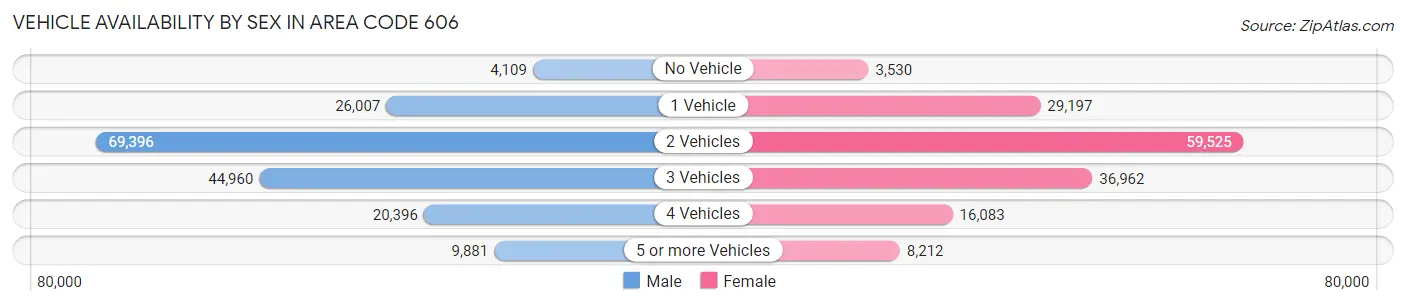
| Vehicles Available | Male | Female |
| No Vehicle | 4,109 (2.4%) | 3,530 (2.3%) |
| 1 Vehicle | 26,007 (14.9%) | 29,197 (19.0%) |
| 2 Vehicles | 69,396 (39.7%) | 59,525 (38.8%) |
| 3 Vehicles | 44,960 (25.7%) | 36,962 (24.1%) |
| 4 Vehicles | 20,396 (11.7%) | 16,083 (10.5%) |
| 5 or more Vehicles | 9,881 (5.7%) | 8,212 (5.3%) |
| Total | 174,749 (100.0%) | 153,509 (100.0%) |
Commute Time in Area Code 606
The most frequently occuring commute durations in Area Code 606 are 15 to 19 minutes (49,280 commuters, 15.8%), 10 to 14 minutes (47,498 commuters, 15.2%), and 5 to 9 minutes (39,575 commuters, 12.7%).
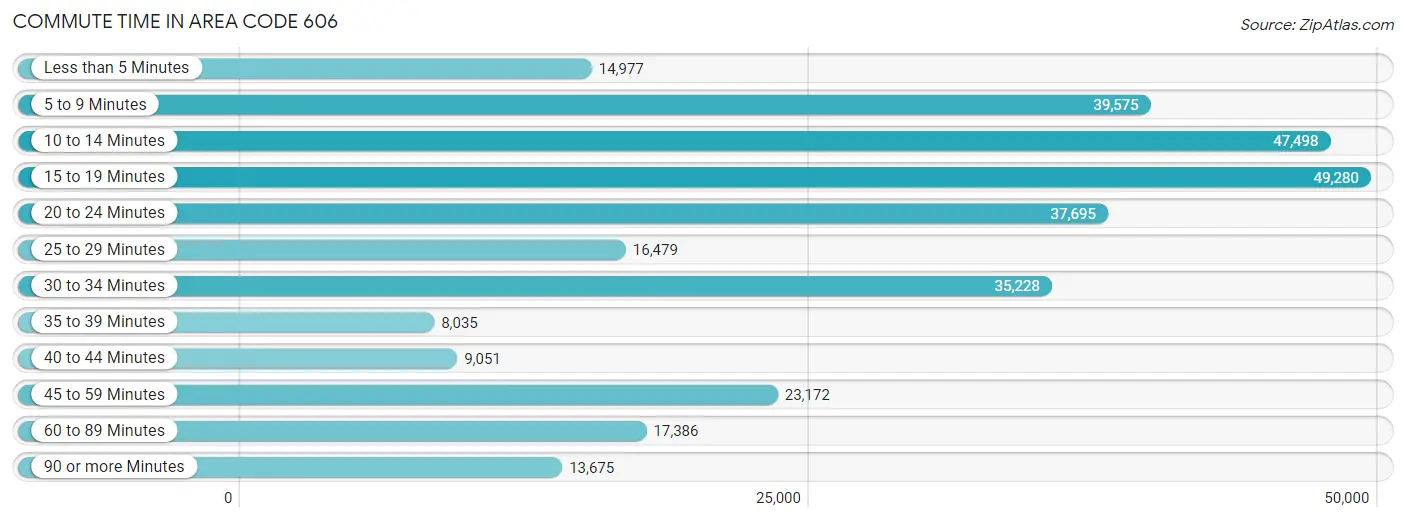
| Commute Time | # Commuters | % Commuters |
| Less than 5 Minutes | 14,977 | 4.8% |
| 5 to 9 Minutes | 39,575 | 12.7% |
| 10 to 14 Minutes | 47,498 | 15.2% |
| 15 to 19 Minutes | 49,280 | 15.8% |
| 20 to 24 Minutes | 37,695 | 12.1% |
| 25 to 29 Minutes | 16,479 | 5.3% |
| 30 to 34 Minutes | 35,228 | 11.3% |
| 35 to 39 Minutes | 8,035 | 2.6% |
| 40 to 44 Minutes | 9,051 | 2.9% |
| 45 to 59 Minutes | 23,172 | 7.4% |
| 60 to 89 Minutes | 17,386 | 5.6% |
| 90 or more Minutes | 13,675 | 4.4% |
Commute Time by Sex in Area Code 606
The most common commute times in Area Code 606 are 10 to 14 minutes (23,827 commuters, 14.2%) for males and 15 to 19 minutes (25,465 commuters, 17.6%) for females.
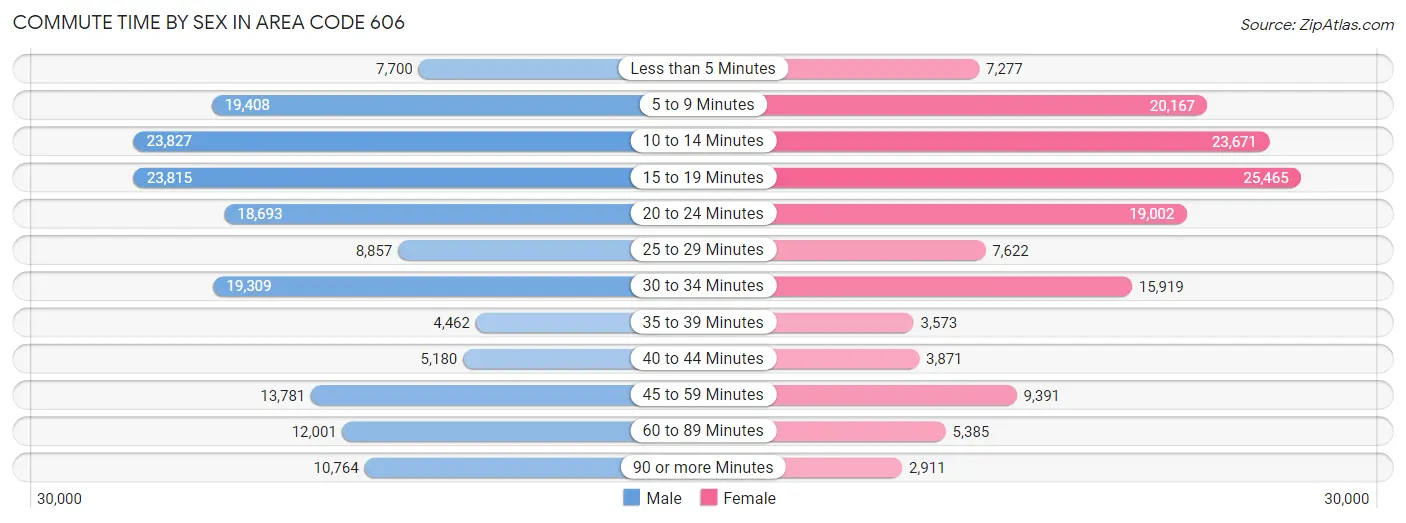
| Commute Time | Male | Female |
| Less than 5 Minutes | 7,700 (4.6%) | 7,277 (5.0%) |
| 5 to 9 Minutes | 19,408 (11.6%) | 20,167 (14.0%) |
| 10 to 14 Minutes | 23,827 (14.2%) | 23,671 (16.4%) |
| 15 to 19 Minutes | 23,815 (14.2%) | 25,465 (17.6%) |
| 20 to 24 Minutes | 18,693 (11.1%) | 19,002 (13.2%) |
| 25 to 29 Minutes | 8,857 (5.3%) | 7,622 (5.3%) |
| 30 to 34 Minutes | 19,309 (11.5%) | 15,919 (11.0%) |
| 35 to 39 Minutes | 4,462 (2.7%) | 3,573 (2.5%) |
| 40 to 44 Minutes | 5,180 (3.1%) | 3,871 (2.7%) |
| 45 to 59 Minutes | 13,781 (8.2%) | 9,391 (6.5%) |
| 60 to 89 Minutes | 12,001 (7.1%) | 5,385 (3.7%) |
| 90 or more Minutes | 10,764 (6.4%) | 2,911 (2.0%) |
Time of Departure to Work by Sex in Area Code 606
The most frequent times of departure to work in Area Code 606 are 7:00 AM to 7:29 AM (21,698, 12.9%) for males and 7:30 AM to 7:59 AM (26,117, 18.1%) for females.
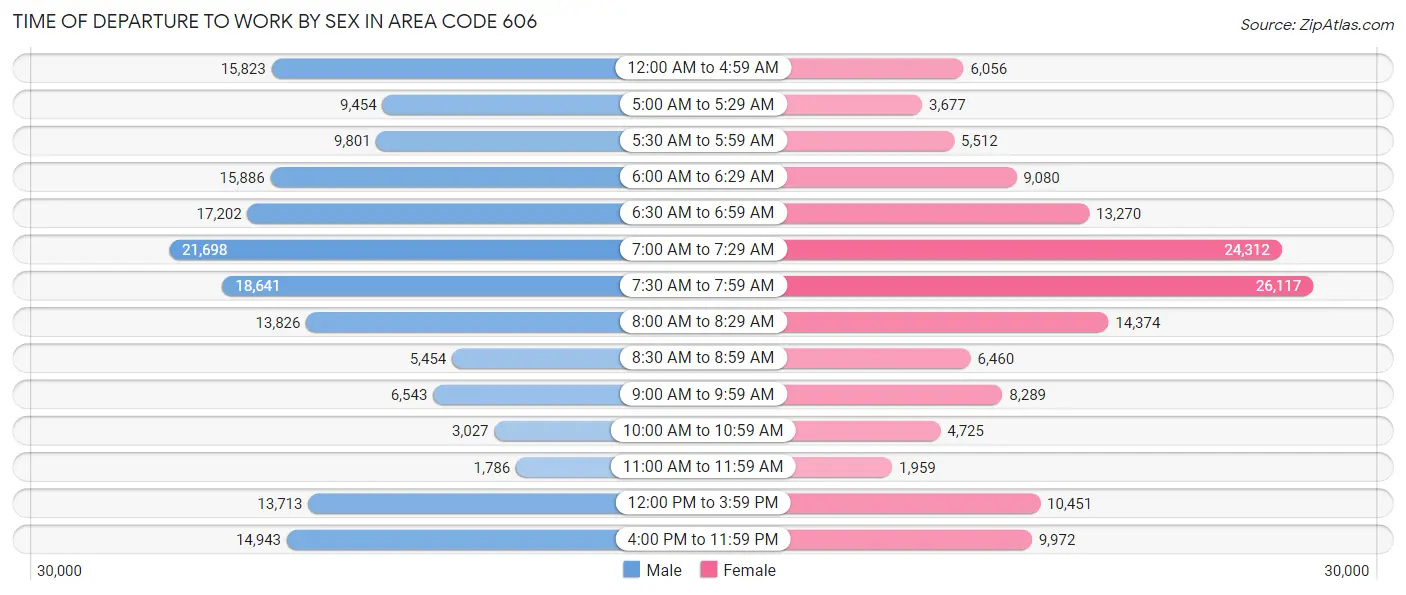
| Time of Departure | Male | Female |
| 12:00 AM to 4:59 AM | 15,823 (9.4%) | 6,056 (4.2%) |
| 5:00 AM to 5:29 AM | 9,454 (5.6%) | 3,677 (2.5%) |
| 5:30 AM to 5:59 AM | 9,801 (5.8%) | 5,512 (3.8%) |
| 6:00 AM to 6:29 AM | 15,886 (9.5%) | 9,080 (6.3%) |
| 6:30 AM to 6:59 AM | 17,202 (10.2%) | 13,270 (9.2%) |
| 7:00 AM to 7:29 AM | 21,698 (12.9%) | 24,312 (16.9%) |
| 7:30 AM to 7:59 AM | 18,641 (11.1%) | 26,117 (18.1%) |
| 8:00 AM to 8:29 AM | 13,826 (8.2%) | 14,374 (10.0%) |
| 8:30 AM to 8:59 AM | 5,454 (3.3%) | 6,460 (4.5%) |
| 9:00 AM to 9:59 AM | 6,543 (3.9%) | 8,289 (5.8%) |
| 10:00 AM to 10:59 AM | 3,027 (1.8%) | 4,725 (3.3%) |
| 11:00 AM to 11:59 AM | 1,786 (1.1%) | 1,959 (1.4%) |
| 12:00 PM to 3:59 PM | 13,713 (8.2%) | 10,451 (7.2%) |
| 4:00 PM to 11:59 PM | 14,943 (8.9%) | 9,972 (6.9%) |
| Total | 167,797 (100.0%) | 144,254 (100.0%) |
Housing Occupancy in Area Code 606
Occupancy by Ownership in Area Code 606
Of the total 361,486 dwellings in Area Code 606, owner-occupied units account for 260,436 (72.1%), while renter-occupied units make up 101,050 (28.0%).
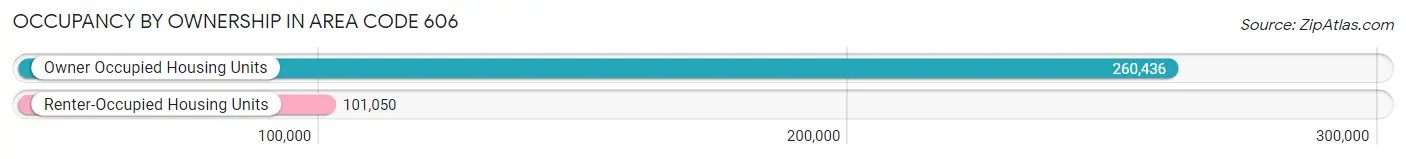
| Occupancy | # Housing Units | % Housing Units |
| Owner Occupied Housing Units | 260,436 | 72.1% |
| Renter-Occupied Housing Units | 101,050 | 28.0% |
| Total Occupied Housing Units | 361,486 | 100.0% |
Occupancy by Household Size in Area Code 606
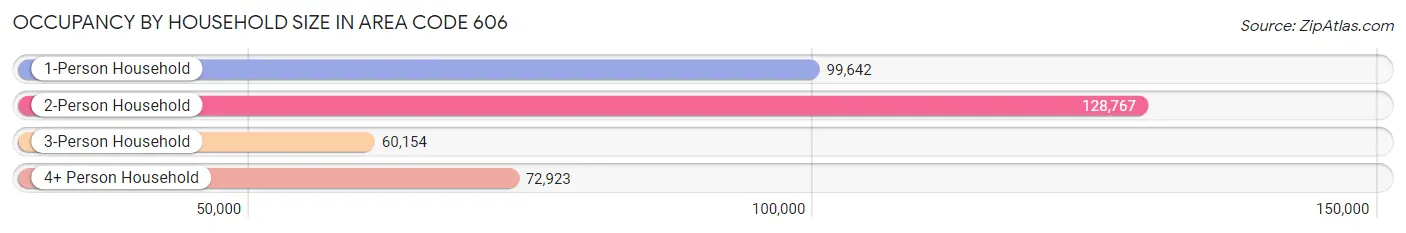
| Household Size | # Housing Units | % Housing Units |
| 1-Person Household | 99,642 | 27.6% |
| 2-Person Household | 128,767 | 35.6% |
| 3-Person Household | 60,154 | 16.6% |
| 4+ Person Household | 72,923 | 20.2% |
| Total Housing Units | 361,486 | 100.0% |
Occupancy by Ownership by Household Size in Area Code 606
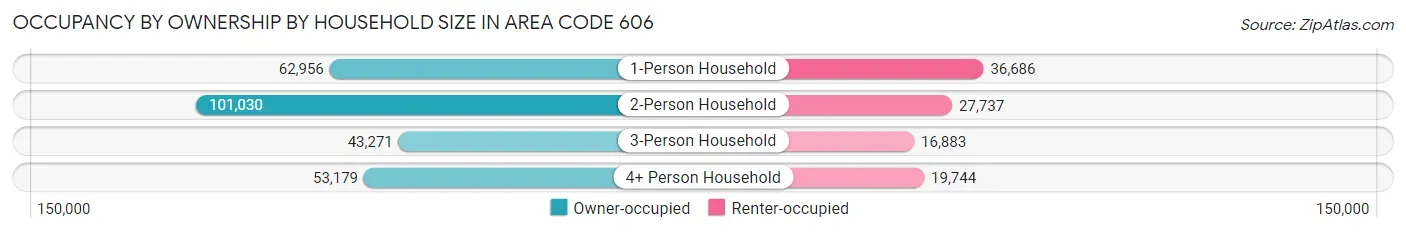
| Household Size | Owner-occupied | Renter-occupied |
| 1-Person Household | 62,956 (63.2%) | 36,686 (36.8%) |
| 2-Person Household | 101,030 (78.5%) | 27,737 (21.5%) |
| 3-Person Household | 43,271 (71.9%) | 16,883 (28.1%) |
| 4+ Person Household | 53,179 (72.9%) | 19,744 (27.1%) |
| Total Housing Units | 260,436 (72.1%) | 101,050 (28.0%) |
Occupancy by Educational Attainment in Area Code 606
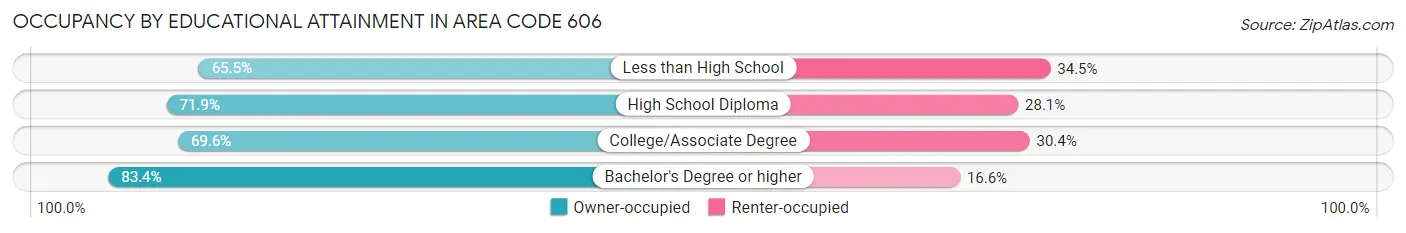
| Household Size | Owner-occupied | Renter-occupied |
| Less than High School | 41,944 (65.5%) | 22,126 (34.5%) |
| High School Diploma | 94,808 (71.9%) | 37,133 (28.1%) |
| College/Associate Degree | 72,116 (69.6%) | 31,521 (30.4%) |
| Bachelor's Degree or higher | 51,568 (83.4%) | 10,270 (16.6%) |
Occupancy by Age of Householder in Area Code 606
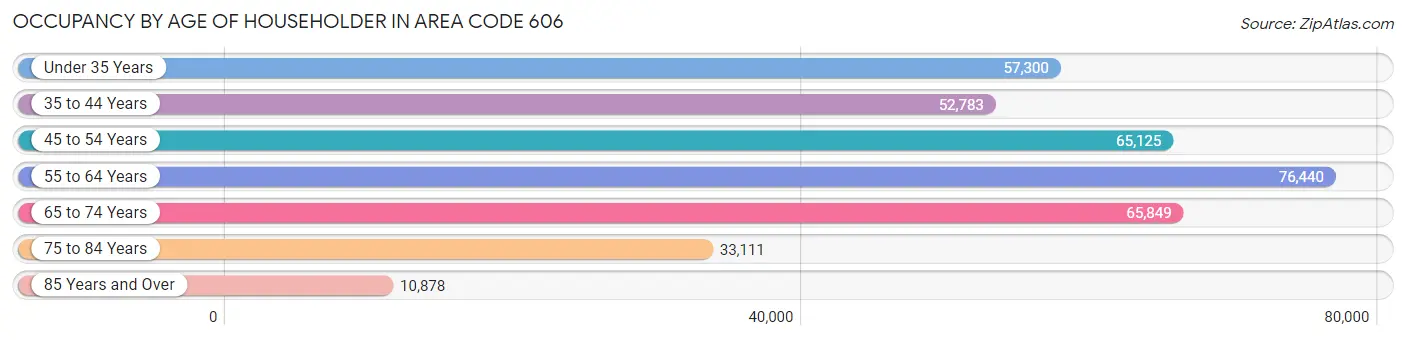
| Age Bracket | # Households | % Households |
| Under 35 Years | 57,300 | 15.9% |
| 35 to 44 Years | 52,783 | 14.6% |
| 45 to 54 Years | 65,125 | 18.0% |
| 55 to 64 Years | 76,440 | 21.1% |
| 65 to 74 Years | 65,849 | 18.2% |
| 75 to 84 Years | 33,111 | 9.2% |
| 85 Years and Over | 10,878 | 3.0% |
| Total | 361,486 | 100.0% |
Housing Finances in Area Code 606
Median Income by Occupancy in Area Code 606
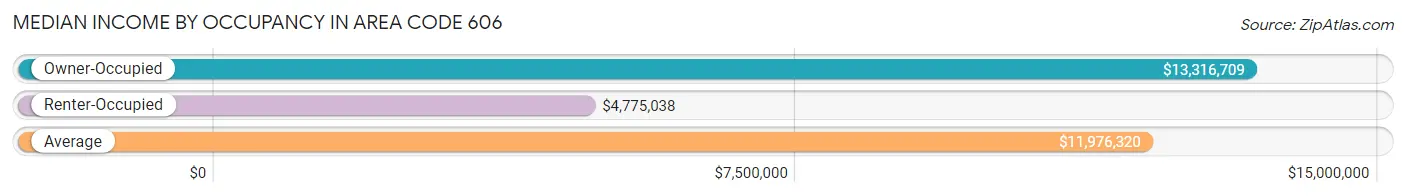
| Occupancy Type | # Households | Median Income |
| Owner-Occupied | 260,436 (72.1%) | $13,316,709 |
| Renter-Occupied | 101,050 (28.0%) | $4,775,038 |
| Average | 361,486 (100.0%) | $11,976,320 |
Occupancy by Householder Income Bracket in Area Code 606
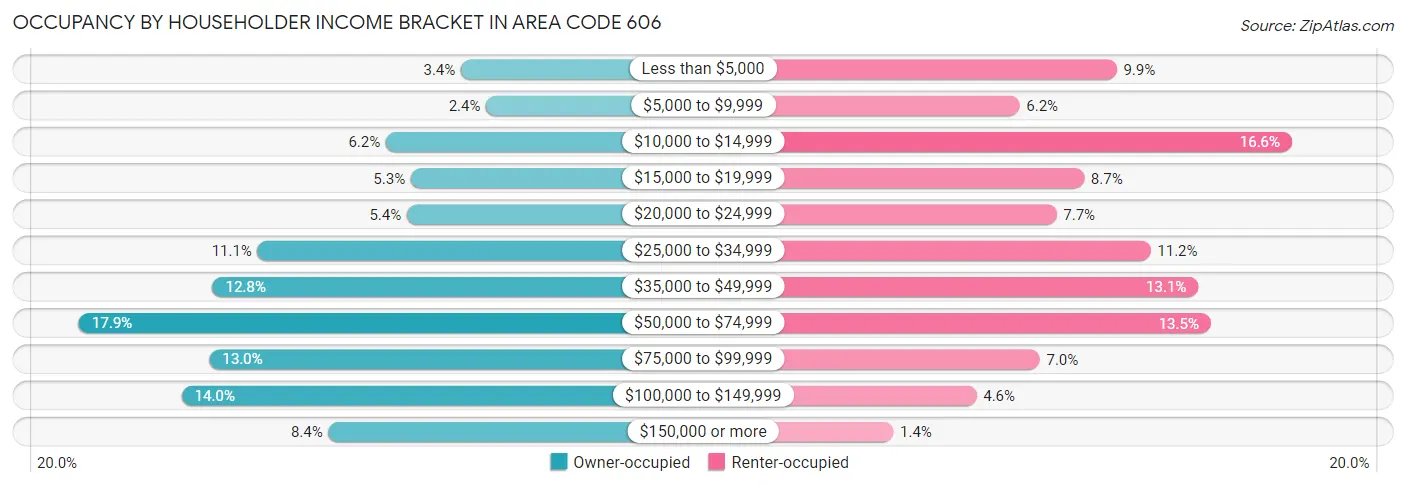
| Income Bracket | Owner-occupied | Renter-occupied |
| Less than $5,000 | 8,773 (3.4%) | 10,044 (9.9%) |
| $5,000 to $9,999 | 6,264 (2.4%) | 6,304 (6.2%) |
| $10,000 to $14,999 | 16,236 (6.2%) | 16,796 (16.6%) |
| $15,000 to $19,999 | 13,747 (5.3%) | 8,791 (8.7%) |
| $20,000 to $24,999 | 14,131 (5.4%) | 7,730 (7.6%) |
| $25,000 to $34,999 | 28,957 (11.1%) | 11,345 (11.2%) |
| $35,000 to $49,999 | 33,444 (12.8%) | 13,186 (13.1%) |
| $50,000 to $74,999 | 46,692 (17.9%) | 13,677 (13.5%) |
| $75,000 to $99,999 | 33,747 (13.0%) | 7,084 (7.0%) |
| $100,000 to $149,999 | 36,516 (14.0%) | 4,652 (4.6%) |
| $150,000 or more | 21,929 (8.4%) | 1,441 (1.4%) |
| Total | 260,436 (100.0%) | 101,050 (100.0%) |
Monthly Housing Cost Tiers in Area Code 606
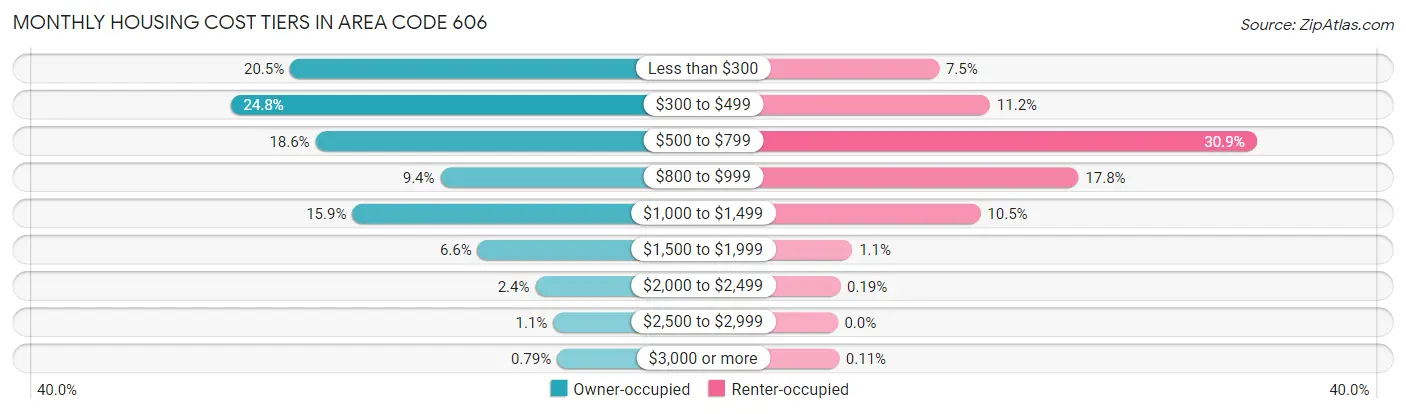
| Monthly Cost | Owner-occupied | Renter-occupied |
| Less than $300 | 53,256 (20.4%) | 7,555 (7.5%) |
| $300 to $499 | 64,694 (24.8%) | 11,346 (11.2%) |
| $500 to $799 | 48,390 (18.6%) | 31,186 (30.9%) |
| $800 to $999 | 24,423 (9.4%) | 17,935 (17.7%) |
| $1,000 to $1,499 | 41,333 (15.9%) | 10,636 (10.5%) |
| $1,500 to $1,999 | 17,289 (6.6%) | 1,106 (1.1%) |
| $2,000 to $2,499 | 6,216 (2.4%) | 195 (0.2%) |
| $2,500 to $2,999 | 2,784 (1.1%) | 0 (0.0%) |
| $3,000 or more | 2,051 (0.8%) | 107 (0.1%) |
| Total | 260,436 (100.0%) | 101,050 (100.0%) |
Physical Housing Characteristics in Area Code 606
Housing Structures in Area Code 606
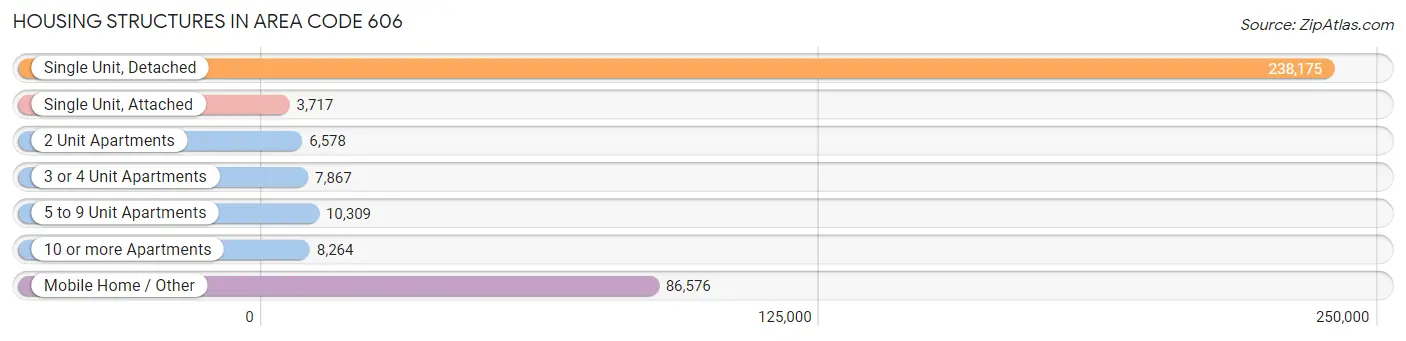
| Structure Type | # Housing Units | % Housing Units |
| Single Unit, Detached | 238,175 | 65.9% |
| Single Unit, Attached | 3,717 | 1.0% |
| 2 Unit Apartments | 6,578 | 1.8% |
| 3 or 4 Unit Apartments | 7,867 | 2.2% |
| 5 to 9 Unit Apartments | 10,309 | 2.9% |
| 10 or more Apartments | 8,264 | 2.3% |
| Mobile Home / Other | 86,576 | 23.9% |
| Total | 361,486 | 100.0% |
Housing Structures by Occupancy in Area Code 606
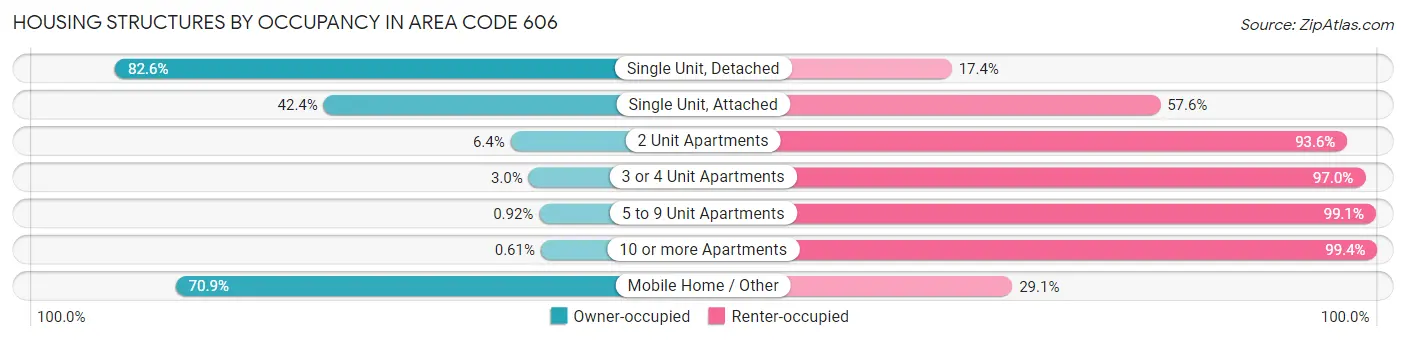
| Structure Type | Owner-occupied | Renter-occupied |
| Single Unit, Detached | 196,663 (82.6%) | 41,512 (17.4%) |
| Single Unit, Attached | 1,577 (42.4%) | 2,140 (57.6%) |
| 2 Unit Apartments | 423 (6.4%) | 6,155 (93.6%) |
| 3 or 4 Unit Apartments | 234 (3.0%) | 7,633 (97.0%) |
| 5 to 9 Unit Apartments | 95 (0.9%) | 10,214 (99.1%) |
| 10 or more Apartments | 50 (0.6%) | 8,214 (99.4%) |
| Mobile Home / Other | 61,394 (70.9%) | 25,182 (29.1%) |
| Total | 260,436 (72.1%) | 101,050 (28.0%) |
Housing Structures by Number of Rooms in Area Code 606
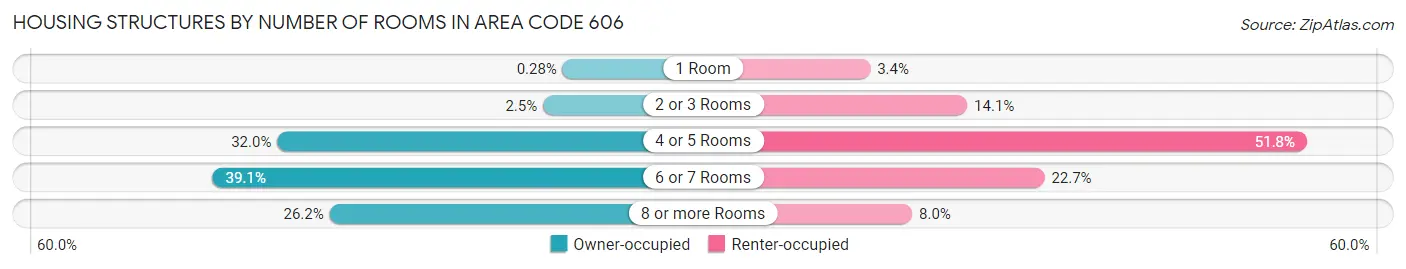
| Number of Rooms | Owner-occupied | Renter-occupied |
| 1 Room | 721 (0.3%) | 3,393 (3.4%) |
| 2 or 3 Rooms | 6,406 (2.5%) | 14,265 (14.1%) |
| 4 or 5 Rooms | 83,228 (32.0%) | 52,360 (51.8%) |
| 6 or 7 Rooms | 101,945 (39.1%) | 22,941 (22.7%) |
| 8 or more Rooms | 68,136 (26.2%) | 8,091 (8.0%) |
| Total | 260,436 (100.0%) | 101,050 (100.0%) |
Housing Structure by Heating Type in Area Code 606
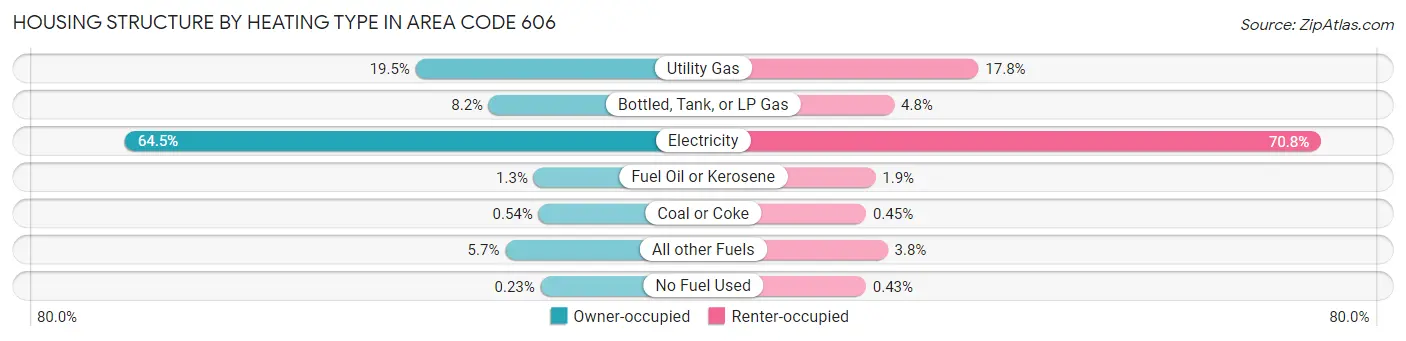
| Heating Type | Owner-occupied | Renter-occupied |
| Utility Gas | 50,884 (19.5%) | 18,016 (17.8%) |
| Bottled, Tank, or LP Gas | 21,405 (8.2%) | 4,848 (4.8%) |
| Electricity | 167,949 (64.5%) | 71,546 (70.8%) |
| Fuel Oil or Kerosene | 3,360 (1.3%) | 1,922 (1.9%) |
| Coal or Coke | 1,405 (0.5%) | 455 (0.4%) |
| All other Fuels | 14,835 (5.7%) | 3,828 (3.8%) |
| No Fuel Used | 598 (0.2%) | 435 (0.4%) |
| Total | 260,436 (100.0%) | 101,050 (100.0%) |
Household Vehicle Usage in Area Code 606
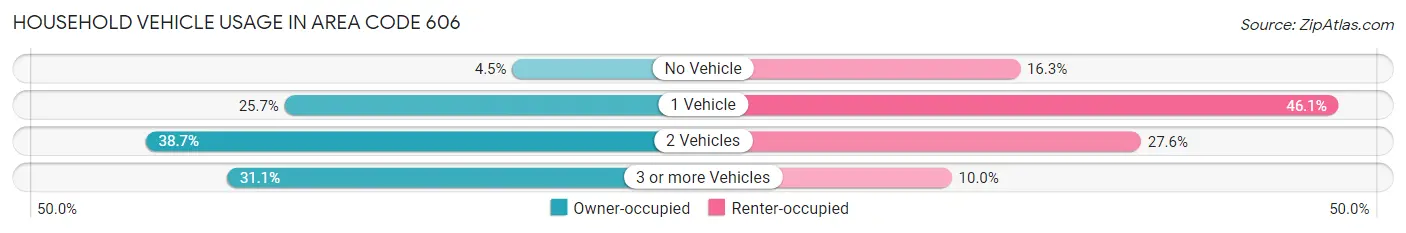
| Vehicles per Household | Owner-occupied | Renter-occupied |
| No Vehicle | 11,645 (4.5%) | 16,507 (16.3%) |
| 1 Vehicle | 66,978 (25.7%) | 46,564 (46.1%) |
| 2 Vehicles | 100,778 (38.7%) | 27,913 (27.6%) |
| 3 or more Vehicles | 81,035 (31.1%) | 10,066 (10.0%) |
| Total | 260,436 (100.0%) | 101,050 (100.0%) |
Real Estate & Mortgages in Area Code 606
Real Estate and Mortgage Overview in Area Code 606
| Characteristic | Without Mortgage | With Mortgage |
| Housing Units | 149,608 | 110,828 |
| Median Property Value | $20,918,796 | $27,560,200 |
| Median Household Income | $10,323,176 | $13,665 |
| Monthly Housing Costs | $107,089 | $1,875 |
| Real Estate Taxes | $140,094 | $7,282 |
Property Value by Mortgage Status in Area Code 606
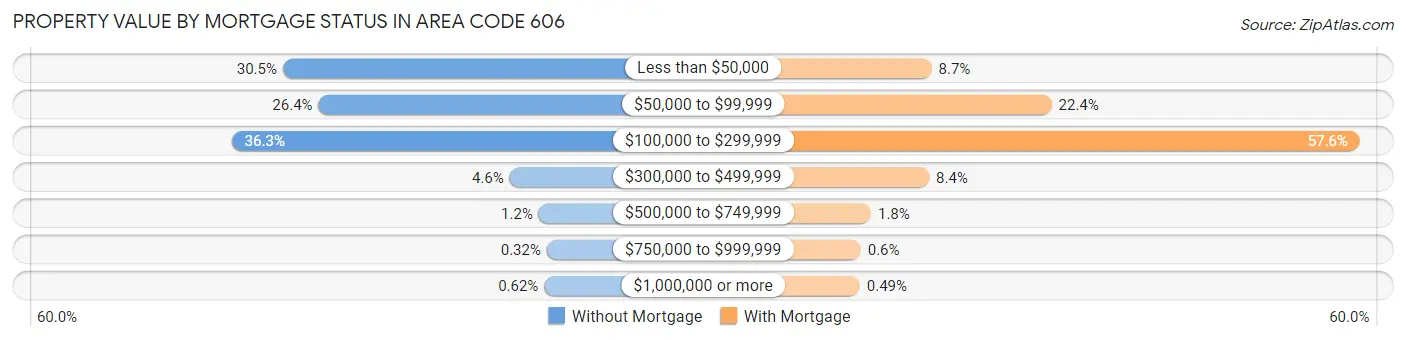
| Property Value | Without Mortgage | With Mortgage |
| Less than $50,000 | 45,613 (30.5%) | 9,630 (8.7%) |
| $50,000 to $99,999 | 39,523 (26.4%) | 24,840 (22.4%) |
| $100,000 to $299,999 | 54,362 (36.3%) | 63,870 (57.6%) |
| $300,000 to $499,999 | 6,853 (4.6%) | 9,321 (8.4%) |
| $500,000 to $749,999 | 1,852 (1.2%) | 1,957 (1.8%) |
| $750,000 to $999,999 | 482 (0.3%) | 670 (0.6%) |
| $1,000,000 or more | 923 (0.6%) | 540 (0.5%) |
| Total | 149,608 (100.0%) | 110,828 (100.0%) |
Household Income by Mortgage Status in Area Code 606
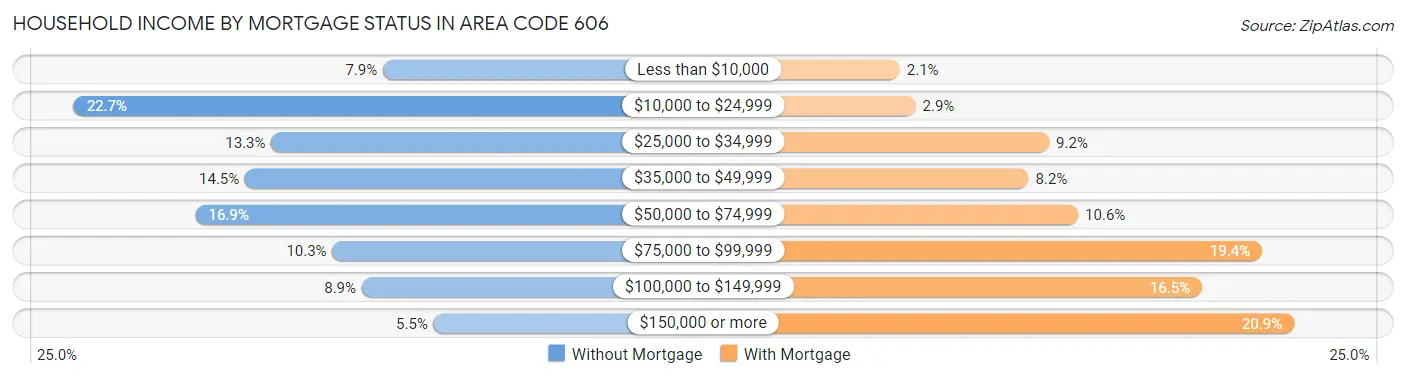
| Household Income | Without Mortgage | With Mortgage |
| Less than $10,000 | 11,864 (7.9%) | 2,335 (2.1%) |
| $10,000 to $24,999 | 33,895 (22.7%) | 3,173 (2.9%) |
| $25,000 to $34,999 | 19,823 (13.3%) | 10,219 (9.2%) |
| $35,000 to $49,999 | 21,694 (14.5%) | 9,134 (8.2%) |
| $50,000 to $74,999 | 25,231 (16.9%) | 11,750 (10.6%) |
| $75,000 to $99,999 | 15,463 (10.3%) | 21,461 (19.4%) |
| $100,000 to $149,999 | 13,374 (8.9%) | 18,284 (16.5%) |
| $150,000 or more | 8,264 (5.5%) | 23,142 (20.9%) |
| Total | 149,608 (100.0%) | 110,828 (100.0%) |
Property Value to Household Income Ratio in Area Code 606
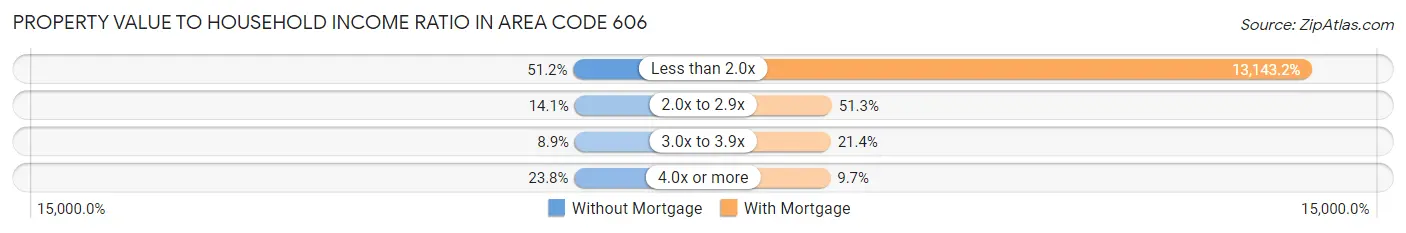
| Value-to-Income Ratio | Without Mortgage | With Mortgage |
| Less than 2.0x | 76,548 (51.2%) | 14,566,337 (13,143.2%) |
| 2.0x to 2.9x | 21,043 (14.1%) | 56,823 (51.3%) |
| 3.0x to 3.9x | 13,372 (8.9%) | 23,693 (21.4%) |
| 4.0x or more | 35,615 (23.8%) | 10,797 (9.7%) |
| Total | 149,608 (100.0%) | 110,828 (100.0%) |
Real Estate Taxes by Mortgage Status in Area Code 606
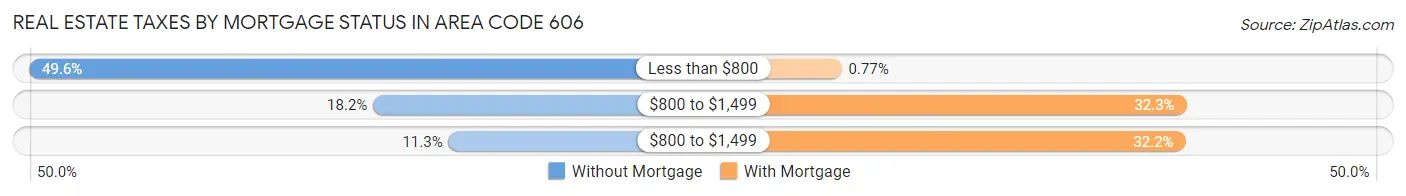
| Property Taxes | Without Mortgage | With Mortgage |
| Less than $800 | 74,212 (49.6%) | 856 (0.8%) |
| $800 to $1,499 | 27,186 (18.2%) | 35,768 (32.3%) |
| $800 to $1,499 | 16,893 (11.3%) | 35,667 (32.2%) |
| Total | 149,608 (100.0%) | 110,828 (100.0%) |
Health & Disability in Area Code 606
Health Insurance Coverage by Age in Area Code 606
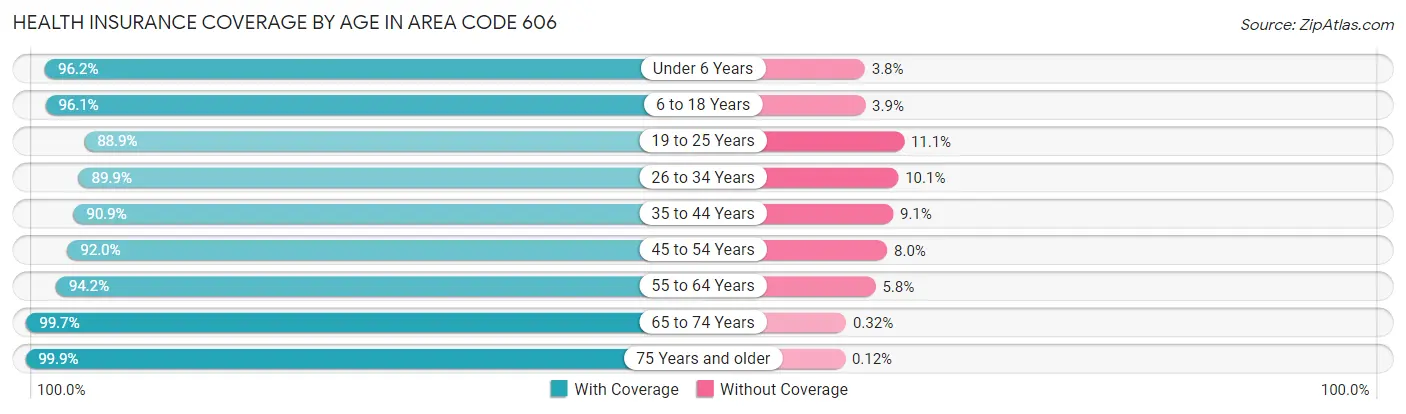
| Age Bracket | With Coverage | Without Coverage |
| Under 6 Years | 62,357 (96.2%) | 2,475 (3.8%) |
| 6 to 18 Years | 148,798 (96.1%) | 6,015 (3.9%) |
| 19 to 25 Years | 68,894 (88.9%) | 8,623 (11.1%) |
| 26 to 34 Years | 87,739 (89.9%) | 9,817 (10.1%) |
| 35 to 44 Years | 100,274 (90.9%) | 10,021 (9.1%) |
| 45 to 54 Years | 112,527 (92.0%) | 9,753 (8.0%) |
| 55 to 64 Years | 122,595 (94.2%) | 7,581 (5.8%) |
| 65 to 74 Years | 104,985 (99.7%) | 334 (0.3%) |
| 75 Years and older | 62,888 (99.9%) | 78 (0.1%) |
| Total | 871,057 (94.1%) | 54,697 (5.9%) |
Health Insurance Coverage by Citizenship Status in Area Code 606
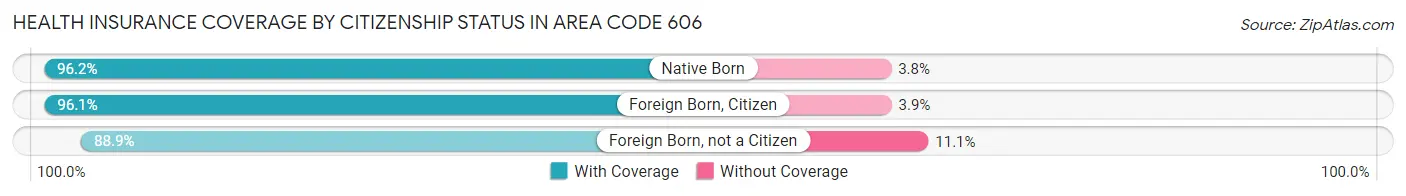
| Citizenship Status | With Coverage | Without Coverage |
| Native Born | 62,357 (96.2%) | 2,475 (3.8%) |
| Foreign Born, Citizen | 148,798 (96.1%) | 6,015 (3.9%) |
| Foreign Born, not a Citizen | 68,894 (88.9%) | 8,623 (11.1%) |
Health Insurance Coverage by Household Income in Area Code 606
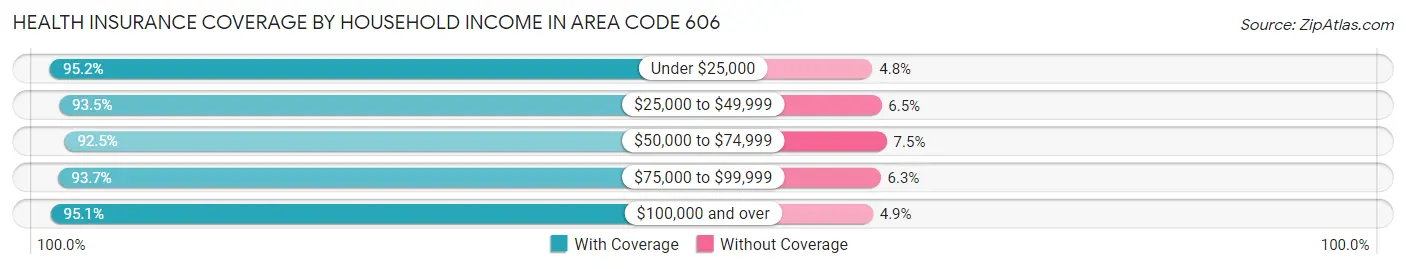
| Household Income | With Coverage | Without Coverage |
| Under $25,000 | 194,937 (95.2%) | 9,810 (4.8%) |
| $25,000 to $49,999 | 200,052 (93.5%) | 13,850 (6.5%) |
| $50,000 to $74,999 | 152,607 (92.5%) | 12,317 (7.5%) |
| $75,000 to $99,999 | 114,625 (93.7%) | 7,753 (6.3%) |
| $100,000 and over | 200,508 (95.1%) | 10,259 (4.9%) |
Public vs Private Health Insurance Coverage by Age in Area Code 606
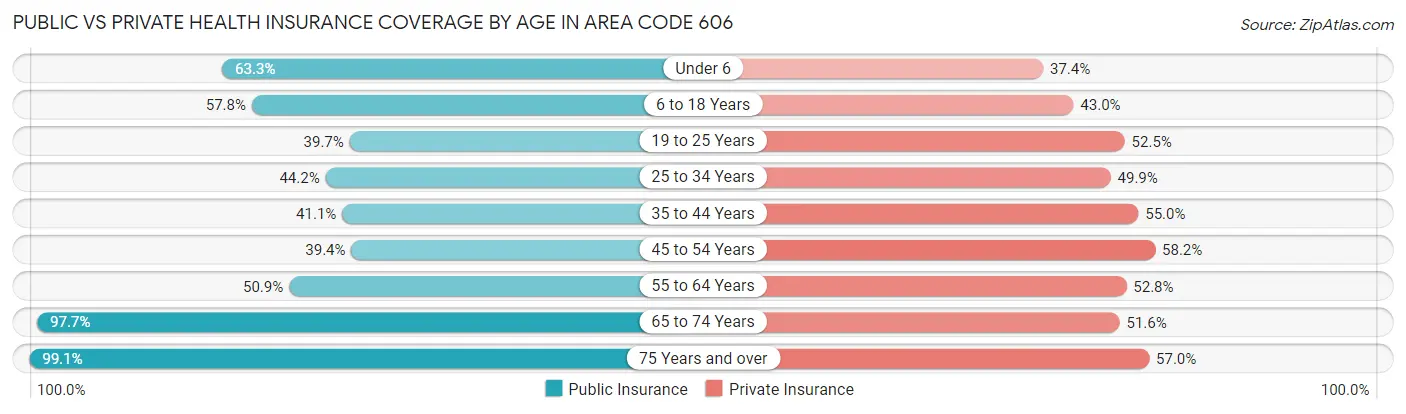
| Age Bracket | Public Insurance | Private Insurance |
| Under 6 | 41,063 (63.3%) | 24,215 (37.3%) |
| 6 to 18 Years | 89,530 (57.8%) | 66,551 (43.0%) |
| 19 to 25 Years | 30,754 (39.7%) | 40,699 (52.5%) |
| 25 to 34 Years | 43,068 (44.2%) | 48,682 (49.9%) |
| 35 to 44 Years | 45,290 (41.1%) | 60,690 (55.0%) |
| 45 to 54 Years | 48,114 (39.4%) | 71,103 (58.2%) |
| 55 to 64 Years | 66,292 (50.9%) | 68,753 (52.8%) |
| 65 to 74 Years | 102,860 (97.7%) | 54,295 (51.5%) |
| 75 Years and over | 62,415 (99.1%) | 35,914 (57.0%) |
| Total | 529,386 (57.2%) | 470,902 (50.9%) |
Disability Status by Sex by Age in Area Code 606
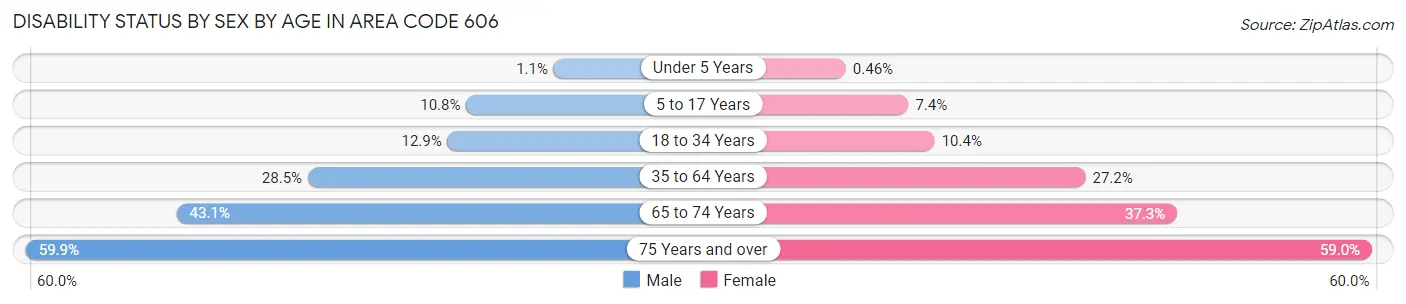
| Age Bracket | Male | Female |
| Under 5 Years | 292 (1.1%) | 120 (0.5%) |
| 5 to 17 Years | 8,715 (10.8%) | 5,460 (7.4%) |
| 18 to 34 Years | 12,344 (12.9%) | 9,436 (10.3%) |
| 35 to 64 Years | 50,763 (28.4%) | 50,052 (27.2%) |
| 65 to 74 Years | 21,564 (43.1%) | 20,628 (37.3%) |
| 75 Years and over | 15,861 (59.9%) | 21,530 (59.0%) |
Disability Class by Sex by Age in Area Code 606
Disability Class: Hearing Difficulty
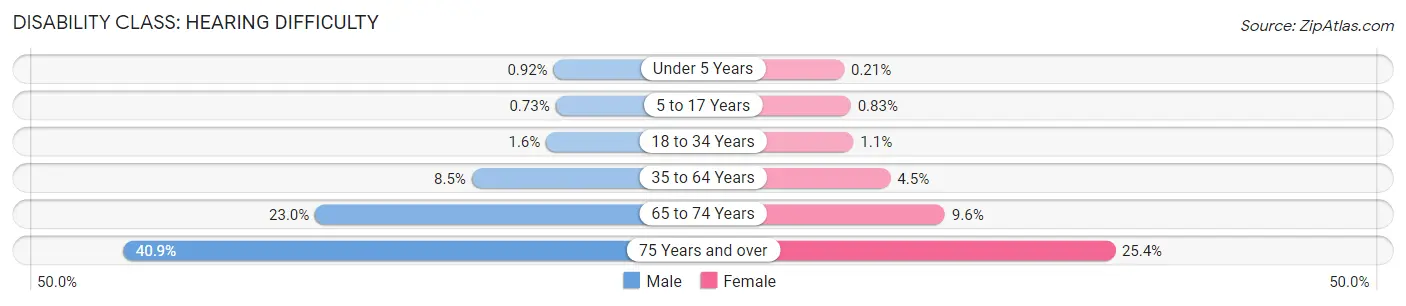
| Age Bracket | Male | Female |
| Under 5 Years | 253 (0.9%) | 56 (0.2%) |
| 5 to 17 Years | 585 (0.7%) | 607 (0.8%) |
| 18 to 34 Years | 1,533 (1.6%) | 988 (1.1%) |
| 35 to 64 Years | 15,182 (8.5%) | 8,316 (4.5%) |
| 65 to 74 Years | 11,540 (23.0%) | 5,285 (9.6%) |
| 75 Years and over | 10,833 (40.9%) | 9,244 (25.4%) |
Disability Class: Vision Difficulty
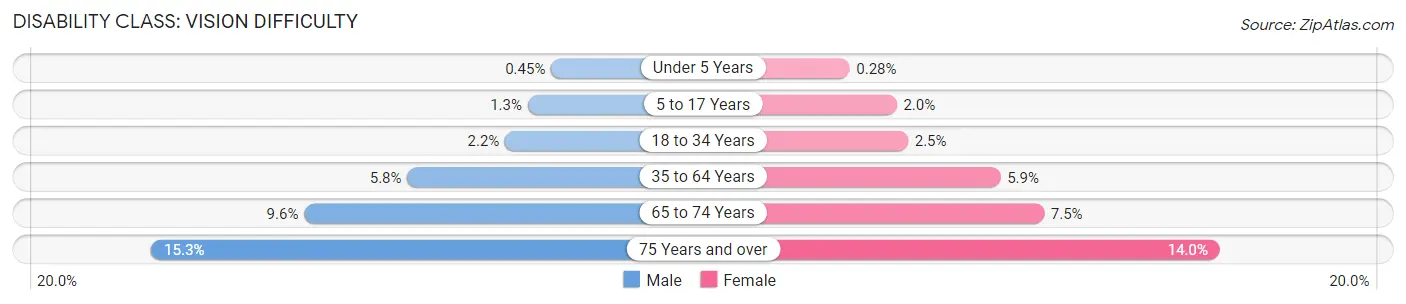
| Age Bracket | Male | Female |
| Under 5 Years | 125 (0.4%) | 72 (0.3%) |
| 5 to 17 Years | 1,063 (1.3%) | 1,494 (2.0%) |
| 18 to 34 Years | 2,066 (2.2%) | 2,229 (2.5%) |
| 35 to 64 Years | 10,329 (5.8%) | 10,842 (5.9%) |
| 65 to 74 Years | 4,815 (9.6%) | 4,143 (7.5%) |
| 75 Years and over | 4,054 (15.3%) | 5,117 (14.0%) |
Disability Class: Cognitive Difficulty
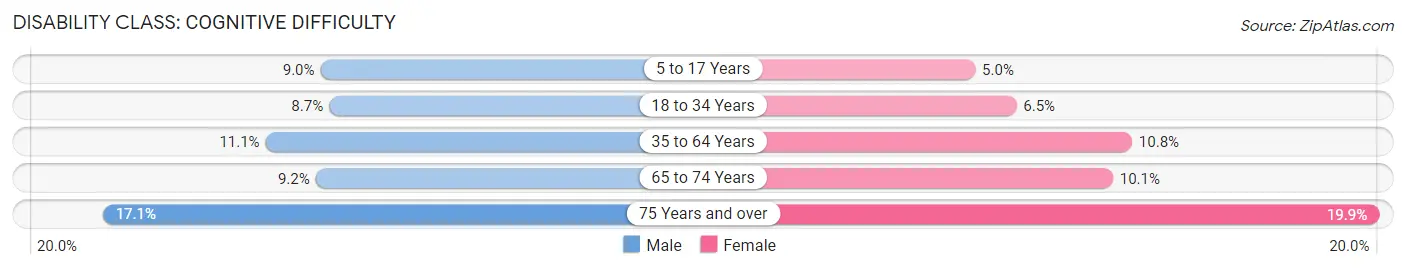
| Age Bracket | Male | Female |
| 5 to 17 Years | 7,272 (9.0%) | 3,638 (5.0%) |
| 18 to 34 Years | 8,327 (8.7%) | 5,909 (6.5%) |
| 35 to 64 Years | 19,733 (11.1%) | 19,849 (10.8%) |
| 65 to 74 Years | 4,609 (9.2%) | 5,560 (10.1%) |
| 75 Years and over | 4,532 (17.1%) | 7,270 (19.9%) |
Disability Class: Ambulatory Difficulty
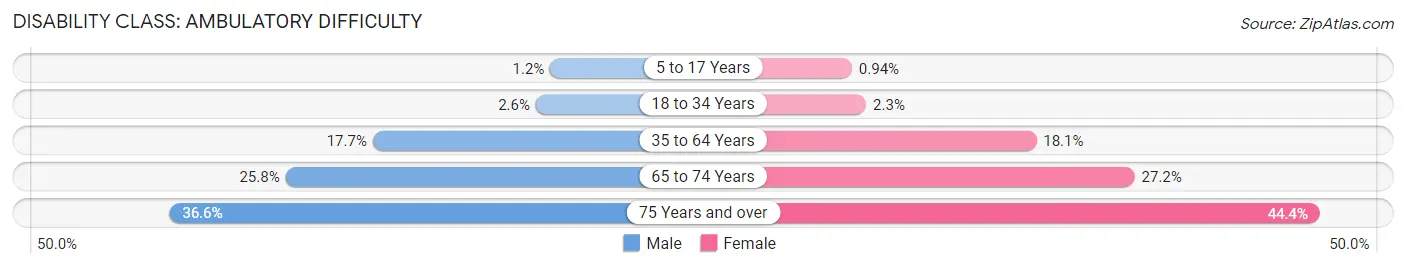
| Age Bracket | Male | Female |
| 5 to 17 Years | 986 (1.2%) | 690 (0.9%) |
| 18 to 34 Years | 2,448 (2.6%) | 2,060 (2.3%) |
| 35 to 64 Years | 31,557 (17.7%) | 33,271 (18.0%) |
| 65 to 74 Years | 12,915 (25.8%) | 15,011 (27.2%) |
| 75 Years and over | 9,692 (36.6%) | 16,176 (44.4%) |
Disability Class: Self-Care Difficulty
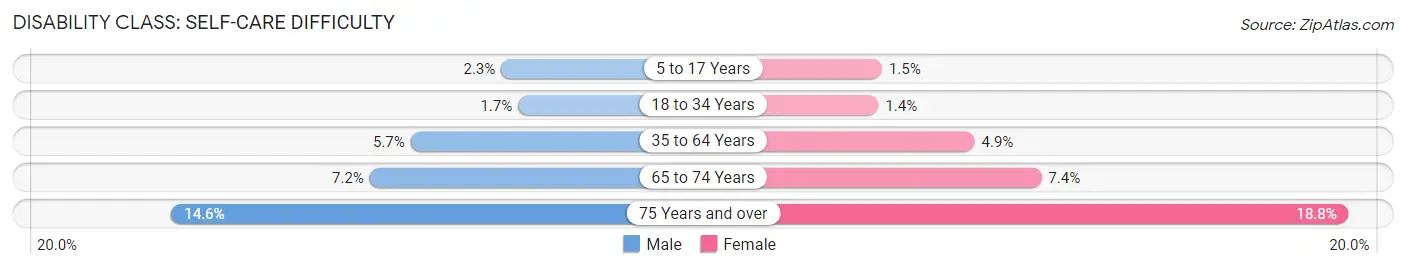
| Age Bracket | Male | Female |
| 5 to 17 Years | 1,862 (2.3%) | 1,099 (1.5%) |
| 18 to 34 Years | 1,608 (1.7%) | 1,237 (1.4%) |
| 35 to 64 Years | 10,117 (5.7%) | 9,081 (4.9%) |
| 65 to 74 Years | 3,599 (7.2%) | 4,096 (7.4%) |
| 75 Years and over | 3,856 (14.5%) | 6,858 (18.8%) |
Technology Access in Area Code 606
Computing Device Access in Area Code 606
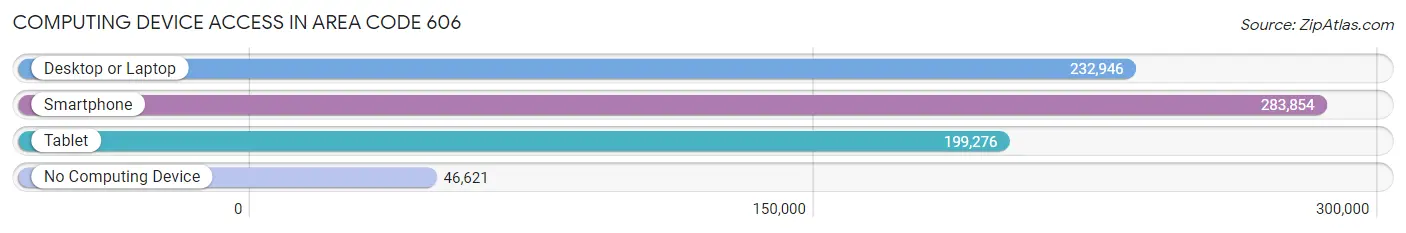
| Device Type | # Households | % Households |
| Desktop or Laptop | 232,946 | 64.4% |
| Smartphone | 283,854 | 78.5% |
| Tablet | 199,276 | 55.1% |
| No Computing Device | 46,621 | 12.9% |
| Total | 361,486 | 100.0% |
Internet Access in Area Code 606
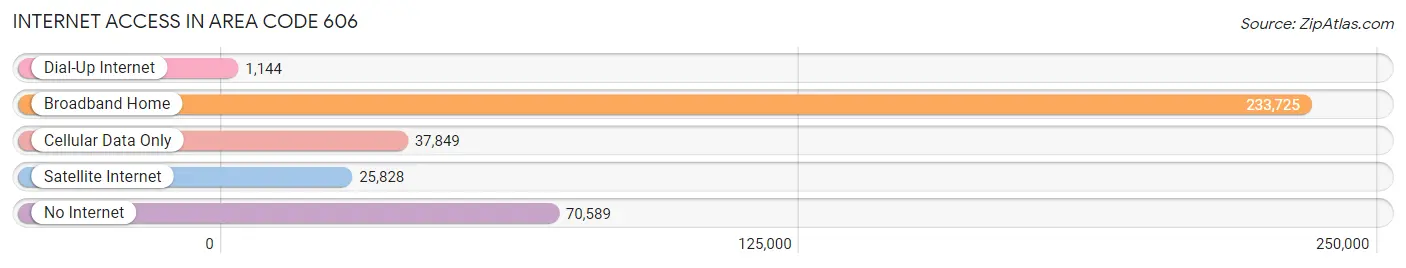
| Internet Type | # Households | % Households |
| Dial-Up Internet | 1,144 | 0.3% |
| Broadband Home | 233,725 | 64.7% |
| Cellular Data Only | 37,849 | 10.5% |
| Satellite Internet | 25,828 | 7.1% |
| No Internet | 70,589 | 19.5% |
| Total | 361,486 | 100.0% |
Area Code 606 Summary
Geography
Area code 606 is a telephone area code in the North American Numbering Plan (NANP) for the easternmost part of the Commonwealth of Kentucky. It serves the cities of Ashland, Corbin, Hazard, London, Morehead, Mount Sterling, and Pikeville, as well as the surrounding areas.
Social
Area code 606 is home to a diverse population of people from all walks of life. The area is known for its strong sense of community and friendly atmosphere. Residents of the area are proud of their heritage and enjoy the many outdoor activities available in the area.
Economics
Area code 606 is a major economic hub in the region. The area is home to a number of large businesses, including manufacturing, healthcare, and retail. The area also has a strong tourism industry, with many attractions and activities for visitors to enjoy.
Demographics
Area code 606 is home to a population of over 500,000 people. The area is predominantly white, with a large African American population. The median household income is slightly below the national average, and the poverty rate is slightly higher than the national average.
Common Questions
What is Per Capita Income in Area Code 606?
Per Capita income in Area Code 606 is $22,713.
What is the Median Family Income in Area Code 606?
Median Family Income in Area Code 606 is $56,760.
What is the Median Household income in Area Code 606?
Median Household Income in Area Code 606 is $44,688.
What is Income or Wage Gap in Area Code 606?
Income or Wage Gap in Area Code 606 is 31.3%.
Women in Area Code 606 earn 68.7 cents for every dollar earned by a man.
What is Family Income Deficit in Area Code 606?
Family Income Deficit in Area Code 606 is $10,202.
Families that are below poverty line in Area Code 606 earn $10,202 less on average than the poverty threshold level.
What is Inequality or Gini Index in Area Code 606?
Inequality or Gini Index in Area Code 606 is 139.15.
What is the Total Population of Area Code 606?
Total Population of Area Code 606 is 947,750.
What is the Total Male Population of Area Code 606?
Total Male Population of Area Code 606 is 475,129.
What is the Total Female Population of Area Code 606?
Total Female Population of Area Code 606 is 472,621.
What is the Ratio of Males per 100 Females in Area Code 606?
There are 100.53 Males per 100 Females in Area Code 606.
What is the Ratio of Females per 100 Males in Area Code 606?
There are 99.47 Females per 100 Males in Area Code 606.
What is the Median Population Age in Area Code 606?
Median Population Age in Area Code 606 is 43.5 Years.
What is the Average Family Size in Area Code 606
Average Family Size in Area Code 606 is 3.1 People.
What is the Average Household Size in Area Code 606
Average Household Size in Area Code 606 is 2.6 People.
How Large is the Labor Force in Area Code 606?
There are 338,463 People in the Labor Forcein in Area Code 606.
What is the Percentage of People in the Labor Force in Area Code 606?
44.3% of People are in the Labor Force in Area Code 606.
What is the Unemployment Rate in Area Code 606?
Unemployment Rate in Area Code 606 is 11.3%.