Frankfort, KY Map & Demographics
Frankfort Map
Frankfort Overview
$33,386
PER CAPITA INCOME
$65,108
AVG FAMILY INCOME
$53,905
AVG HOUSEHOLD INCOME
16.6%
WAGE / INCOME GAP [ % ]
83.4¢/ $1
WAGE / INCOME GAP [ $ ]
$13,458
FAMILY INCOME DEFICIT
0.46
INEQUALITY / GINI INDEX
28,460
TOTAL POPULATION
13,729
MALE POPULATION
14,731
FEMALE POPULATION
93.20
MALES / 100 FEMALES
107.30
FEMALES / 100 MALES
34.2
MEDIAN AGE
2.8
AVG FAMILY SIZE
2.1
AVG HOUSEHOLD SIZE
14,052
LABOR FORCE [ PEOPLE ]
62.8%
PERCENT IN LABOR FORCE
5.4%
UNEMPLOYMENT RATE
Frankfort Zip Codes
Frankfort Area Codes
Income in Frankfort
Income Overview in Frankfort
Per Capita Income in Frankfort is $33,386, while median incomes of families and households are $65,108 and $53,905 respectively.
| Characteristic | Number | Measure |
| Per Capita Income | 28,460 | $33,386 |
| Median Family Income | 6,863 | $65,108 |
| Mean Family Income | 6,863 | $80,864 |
| Median Household Income | 12,670 | $53,905 |
| Mean Household Income | 12,670 | $74,498 |
| Income Deficit | 6,863 | $13,458 |
| Wage / Income Gap (%) | 28,460 | 16.62% |
| Wage / Income Gap ($) | 28,460 | 83.38¢ per $1 |
| Gini / Inequality Index | 28,460 | 0.46 |
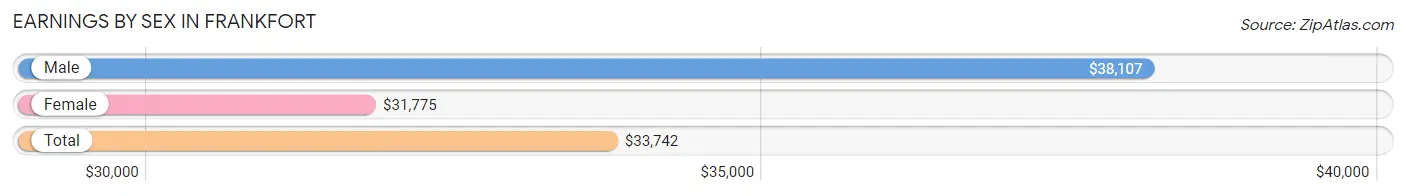
Earnings by Sex in Frankfort
Average Earnings in Frankfort are $33,742, $38,107 for men and $31,775 for women, a difference of 16.6%.
| Sex | Number | Average Earnings |
| Male | 7,645 (49.8%) | $38,107 |
| Female | 7,707 (50.2%) | $31,775 |
| Total | 15,352 (100.0%) | $33,742 |
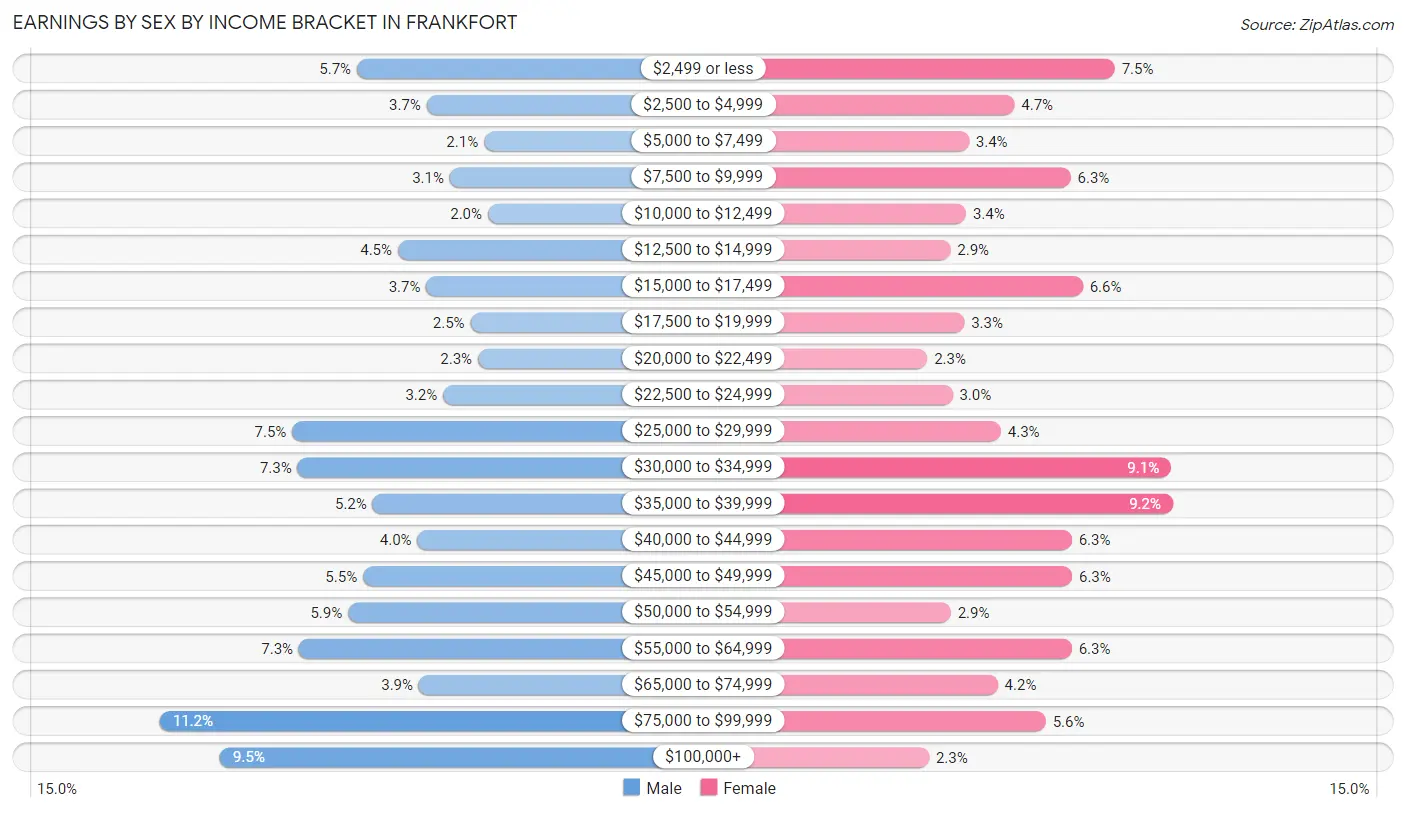
Earnings by Sex by Income Bracket in Frankfort
The most common earnings brackets in Frankfort are $75,000 to $99,999 for men (856 | 11.2%) and $35,000 to $39,999 for women (706 | 9.2%).
| Income | Male | Female |
| $2,499 or less | 433 (5.7%) | 580 (7.5%) |
| $2,500 to $4,999 | 283 (3.7%) | 363 (4.7%) |
| $5,000 to $7,499 | 160 (2.1%) | 264 (3.4%) |
| $7,500 to $9,999 | 233 (3.0%) | 485 (6.3%) |
| $10,000 to $12,499 | 151 (2.0%) | 258 (3.4%) |
| $12,500 to $14,999 | 345 (4.5%) | 224 (2.9%) |
| $15,000 to $17,499 | 284 (3.7%) | 511 (6.6%) |
| $17,500 to $19,999 | 189 (2.5%) | 254 (3.3%) |
| $20,000 to $22,499 | 173 (2.3%) | 174 (2.3%) |
| $22,500 to $24,999 | 248 (3.2%) | 229 (3.0%) |
| $25,000 to $29,999 | 572 (7.5%) | 334 (4.3%) |
| $30,000 to $34,999 | 560 (7.3%) | 702 (9.1%) |
| $35,000 to $39,999 | 399 (5.2%) | 706 (9.2%) |
| $40,000 to $44,999 | 303 (4.0%) | 487 (6.3%) |
| $45,000 to $49,999 | 420 (5.5%) | 488 (6.3%) |
| $50,000 to $54,999 | 452 (5.9%) | 225 (2.9%) |
| $55,000 to $64,999 | 557 (7.3%) | 487 (6.3%) |
| $65,000 to $74,999 | 300 (3.9%) | 327 (4.2%) |
| $75,000 to $99,999 | 856 (11.2%) | 431 (5.6%) |
| $100,000+ | 727 (9.5%) | 178 (2.3%) |
| Total | 7,645 (100.0%) | 7,707 (100.0%) |
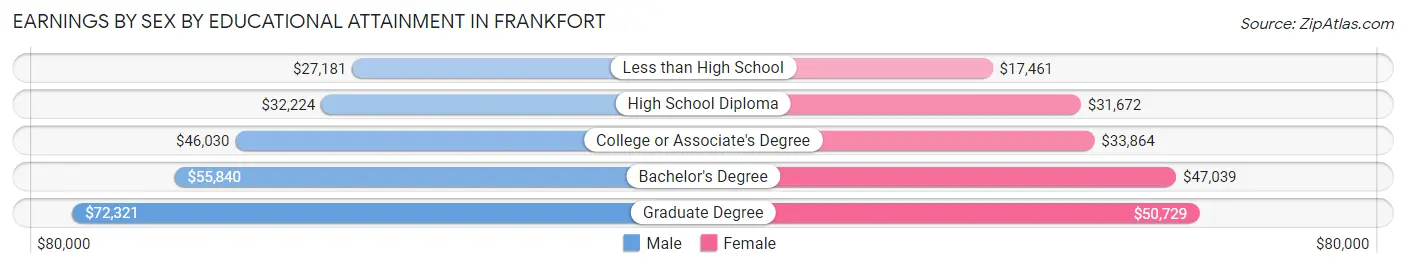
Earnings by Sex by Educational Attainment in Frankfort
Average earnings in Frankfort are $44,719 for men and $35,556 for women, a difference of 20.5%. Men with an educational attainment of graduate degree enjoy the highest average annual earnings of $72,321, while those with less than high school education earn the least with $27,181. Women with an educational attainment of graduate degree earn the most with the average annual earnings of $50,729, while those with less than high school education have the smallest earnings of $17,461.
| Educational Attainment | Male Income | Female Income |
| Less than High School | $27,181 | $17,461 |
| High School Diploma | $32,224 | $31,672 |
| College or Associate's Degree | $46,030 | $33,864 |
| Bachelor's Degree | $55,840 | $47,039 |
| Graduate Degree | $72,321 | $50,729 |
| Total | $44,719 | $35,556 |
Family Income in Frankfort
Family Income Brackets in Frankfort
According to the Frankfort family income data, there are 1,599 families falling into the $100,000 to $149,999 income range, which is the most common income bracket and makes up 23.3% of all families. Conversely, the $10,000 to $14,999 income bracket is the least frequent group with only 165 families (2.4%) belonging to this category.
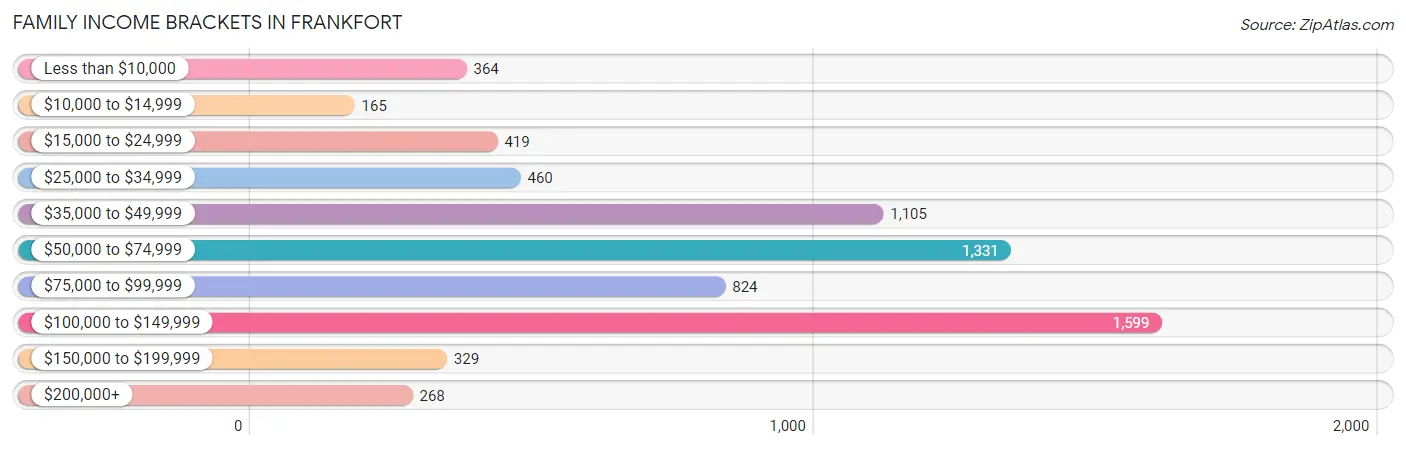
| Income Bracket | # Families | % Families |
| Less than $10,000 | 364 | 5.3% |
| $10,000 to $14,999 | 165 | 2.4% |
| $15,000 to $24,999 | 419 | 6.1% |
| $25,000 to $34,999 | 460 | 6.7% |
| $35,000 to $49,999 | 1,105 | 16.1% |
| $50,000 to $74,999 | 1,331 | 19.4% |
| $75,000 to $99,999 | 824 | 12.0% |
| $100,000 to $149,999 | 1,599 | 23.3% |
| $150,000 to $199,999 | 329 | 4.8% |
| $200,000+ | 268 | 3.9% |
Family Income by Famaliy Size in Frankfort
4-person families (960 | 14.0%) account for the highest median family income in Frankfort with $84,333 per family, while 2-person families (3,319 | 48.4%) have the highest median income of $32,435 per family member.
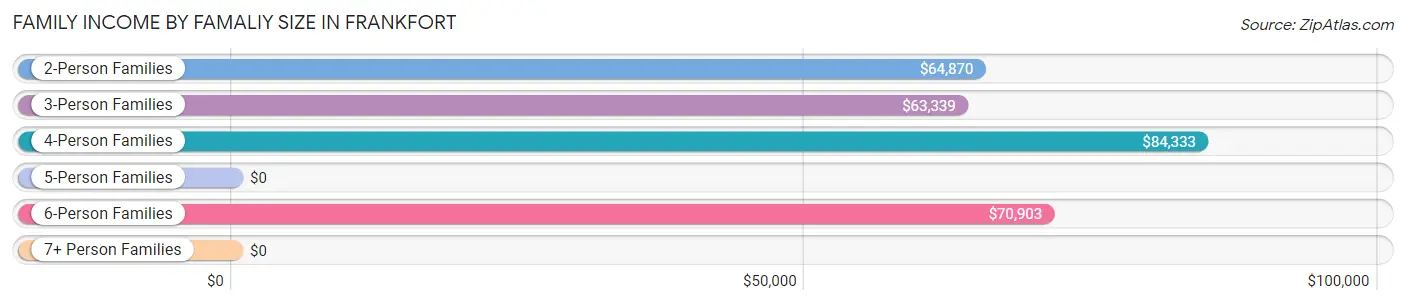
| Income Bracket | # Families | Median Income |
| 2-Person Families | 3,319 (48.4%) | $64,870 |
| 3-Person Families | 1,859 (27.1%) | $63,339 |
| 4-Person Families | 960 (14.0%) | $84,333 |
| 5-Person Families | 426 (6.2%) | $0 |
| 6-Person Families | 260 (3.8%) | $70,903 |
| 7+ Person Families | 39 (0.6%) | $0 |
| Total | 6,863 (100.0%) | $65,108 |
Family Income by Number of Earners in Frankfort
The median family income in Frankfort is $65,108, with families comprising 3+ earners (605) having the highest median family income of $133,185, while families with 1 earner (3,321) have the lowest median family income of $50,223, accounting for 8.8% and 48.4% of families, respectively.
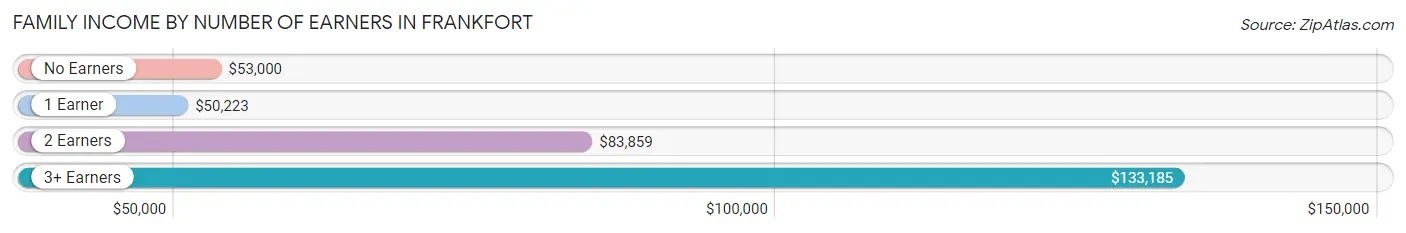
| Number of Earners | # Families | Median Income |
| No Earners | 778 (11.3%) | $53,000 |
| 1 Earner | 3,321 (48.4%) | $50,223 |
| 2 Earners | 2,159 (31.5%) | $83,859 |
| 3+ Earners | 605 (8.8%) | $133,185 |
| Total | 6,863 (100.0%) | $65,108 |
Household Income in Frankfort
Household Income Brackets in Frankfort
With 2,331 households falling in the category, the $50,000 to $74,999 income range is the most frequent in Frankfort, accounting for 18.4% of all households. In contrast, only 405 households (3.2%) fall into the $200,000+ income bracket, making it the least populous group.
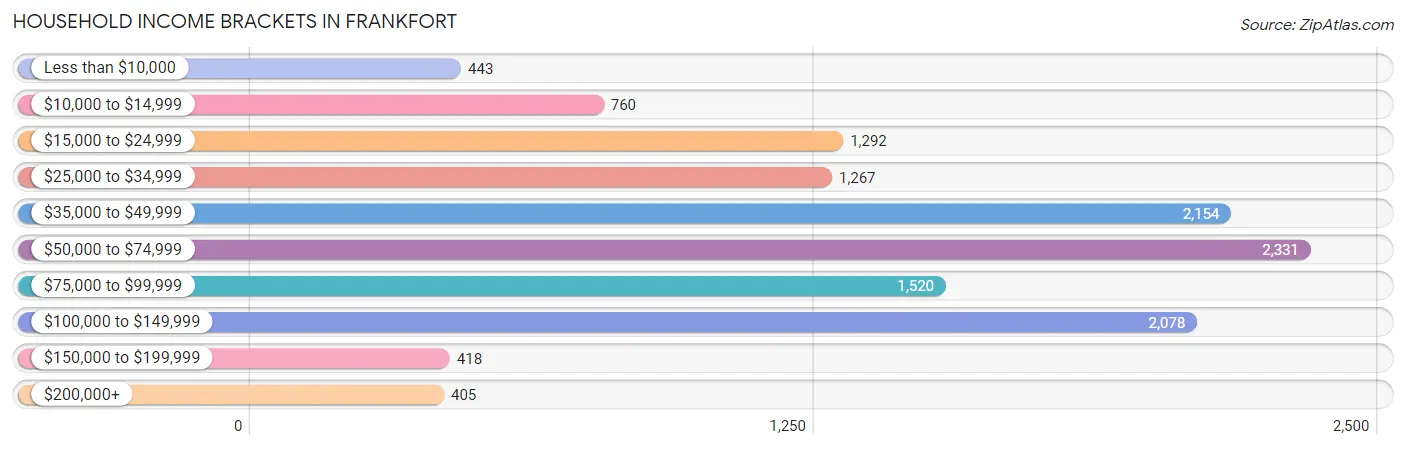
| Income Bracket | # Households | % Households |
| Less than $10,000 | 443 | 3.5% |
| $10,000 to $14,999 | 760 | 6.0% |
| $15,000 to $24,999 | 1,292 | 10.2% |
| $25,000 to $34,999 | 1,267 | 10.0% |
| $35,000 to $49,999 | 2,154 | 17.0% |
| $50,000 to $74,999 | 2,331 | 18.4% |
| $75,000 to $99,999 | 1,520 | 12.0% |
| $100,000 to $149,999 | 2,078 | 16.4% |
| $150,000 to $199,999 | 418 | 3.3% |
| $200,000+ | 405 | 3.2% |
Household Income by Householder Age in Frankfort
The median household income in Frankfort is $53,905, with the highest median household income of $60,789 found in the 45 to 64 years age bracket for the primary householder. A total of 3,693 households (29.1%) fall into this category. Meanwhile, the 15 to 24 years age bracket for the primary householder has the lowest median household income of $23,901, with 835 households (6.6%) in this group.
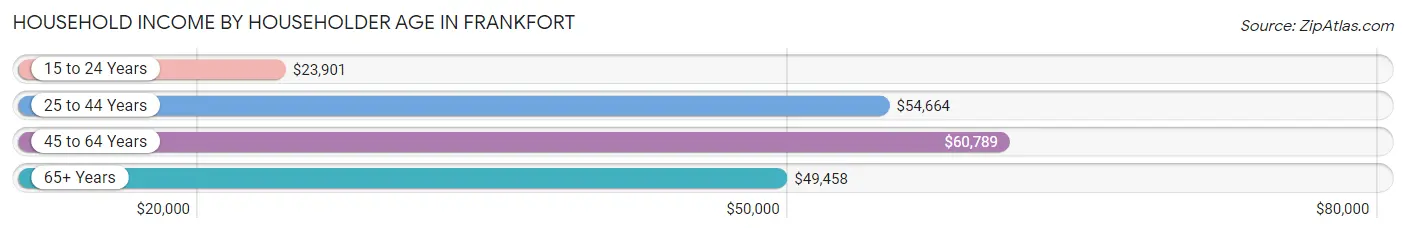
| Income Bracket | # Households | Median Income |
| 15 to 24 Years | 835 (6.6%) | $23,901 |
| 25 to 44 Years | 5,016 (39.6%) | $54,664 |
| 45 to 64 Years | 3,693 (29.1%) | $60,789 |
| 65+ Years | 3,126 (24.7%) | $49,458 |
| Total | 12,670 (100.0%) | $53,905 |
Poverty in Frankfort
Income Below Poverty by Sex and Age in Frankfort
With 17.2% poverty level for males and 17.6% for females among the residents of Frankfort, 6 to 11 year old males and 15 year old females are the most vulnerable to poverty, with 434 males (38.7%) and 117 females (60.3%) in their respective age groups living below the poverty level.
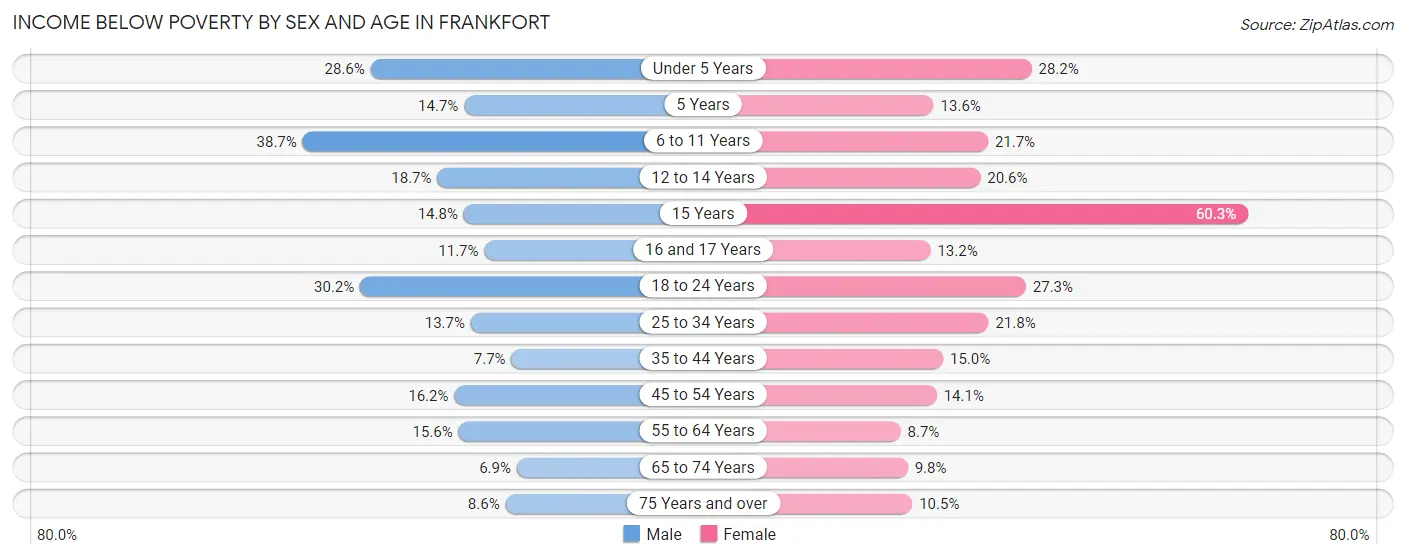
| Age Bracket | Male | Female |
| Under 5 Years | 275 (28.6%) | 264 (28.2%) |
| 5 Years | 38 (14.7%) | 9 (13.6%) |
| 6 to 11 Years | 434 (38.7%) | 179 (21.7%) |
| 12 to 14 Years | 84 (18.7%) | 185 (20.6%) |
| 15 Years | 38 (14.8%) | 117 (60.3%) |
| 16 and 17 Years | 21 (11.7%) | 66 (13.2%) |
| 18 to 24 Years | 297 (30.2%) | 337 (27.3%) |
| 25 to 34 Years | 335 (13.7%) | 511 (21.8%) |
| 35 to 44 Years | 139 (7.7%) | 212 (15.0%) |
| 45 to 54 Years | 217 (16.2%) | 205 (14.1%) |
| 55 to 64 Years | 228 (15.5%) | 151 (8.7%) |
| 65 to 74 Years | 71 (6.9%) | 164 (9.8%) |
| 75 Years and over | 64 (8.6%) | 87 (10.5%) |
| Total | 2,241 (17.2%) | 2,487 (17.6%) |
Income Above Poverty by Sex and Age in Frankfort
According to the poverty statistics in Frankfort, males aged 65 to 74 years and females aged 55 to 64 years are the age groups that are most secure financially, with 93.1% of males and 91.3% of females in these age groups living above the poverty line.
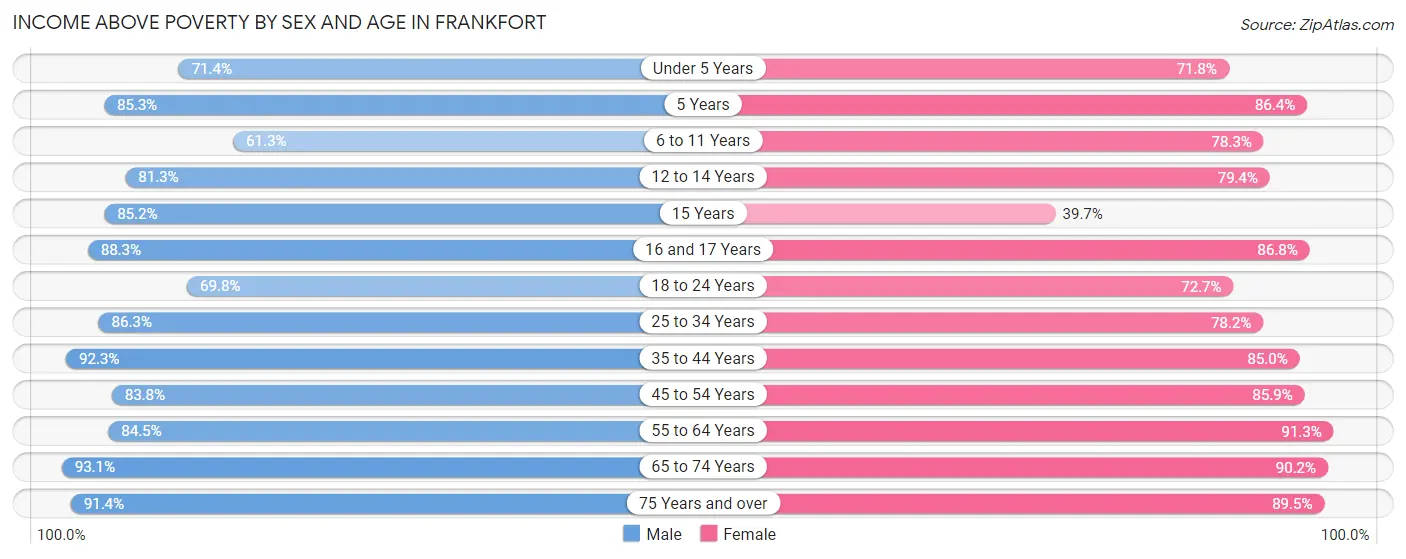
| Age Bracket | Male | Female |
| Under 5 Years | 686 (71.4%) | 673 (71.8%) |
| 5 Years | 220 (85.3%) | 57 (86.4%) |
| 6 to 11 Years | 687 (61.3%) | 646 (78.3%) |
| 12 to 14 Years | 365 (81.3%) | 715 (79.4%) |
| 15 Years | 219 (85.2%) | 77 (39.7%) |
| 16 and 17 Years | 158 (88.3%) | 435 (86.8%) |
| 18 to 24 Years | 687 (69.8%) | 896 (72.7%) |
| 25 to 34 Years | 2,103 (86.3%) | 1,835 (78.2%) |
| 35 to 44 Years | 1,663 (92.3%) | 1,198 (85.0%) |
| 45 to 54 Years | 1,123 (83.8%) | 1,249 (85.9%) |
| 55 to 64 Years | 1,238 (84.5%) | 1,578 (91.3%) |
| 65 to 74 Years | 956 (93.1%) | 1,512 (90.2%) |
| 75 Years and over | 681 (91.4%) | 745 (89.5%) |
| Total | 10,786 (82.8%) | 11,616 (82.4%) |
Income Below Poverty Among Married-Couple Families in Frankfort
The poverty statistics for married-couple families in Frankfort show that 3.5% or 138 of the total 3,989 families live below the poverty line. Families with 3 or 4 children have the highest poverty rate of 15.6%, comprising of 47 families. On the other hand, families with 5 or more children have the lowest poverty rate of 0.0%, which includes 0 families.
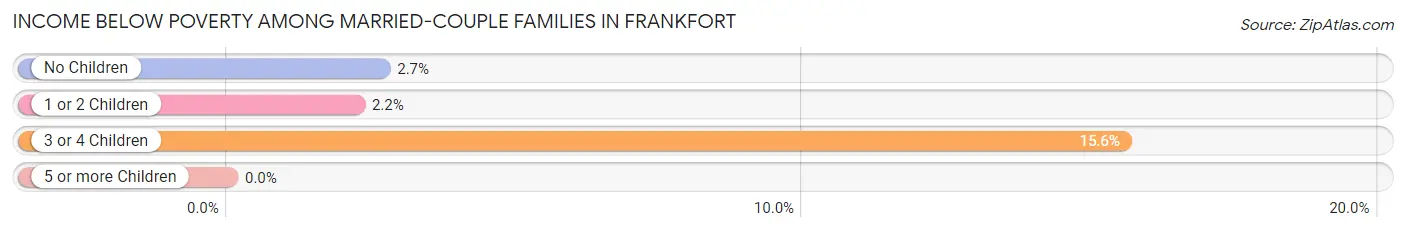
| Children | Above Poverty | Below Poverty |
| No Children | 2,133 (97.4%) | 58 (2.6%) |
| 1 or 2 Children | 1,460 (97.8%) | 33 (2.2%) |
| 3 or 4 Children | 255 (84.4%) | 47 (15.6%) |
| 5 or more Children | 3 (100.0%) | 0 (0.0%) |
| Total | 3,851 (96.5%) | 138 (3.5%) |
Income Below Poverty Among Single-Parent Households in Frankfort
According to the poverty data in Frankfort, 13.0% or 116 single-father households and 32.5% or 645 single-mother households are living below the poverty line. Among single-father households, those with 5 or more children have the highest poverty rate, with 80 households (100.0%) experiencing poverty. Likewise, among single-mother households, those with 5 or more children have the highest poverty rate, with 19 households (100.0%) falling below the poverty line.
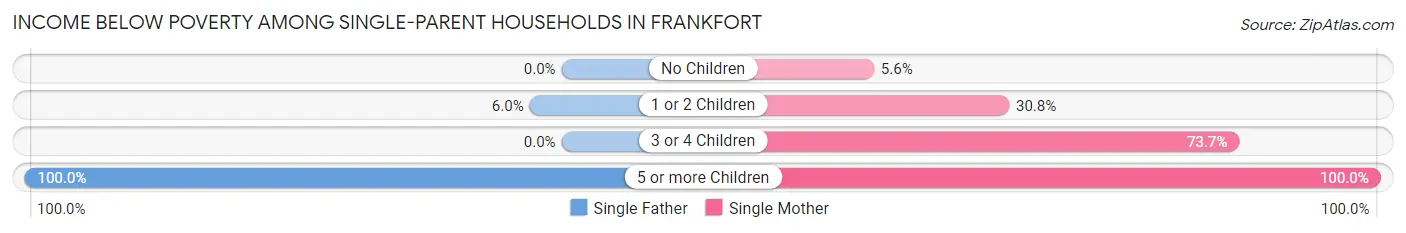
| Children | Single Father | Single Mother |
| No Children | 0 (0.0%) | 24 (5.6%) |
| 1 or 2 Children | 36 (6.0%) | 381 (30.8%) |
| 3 or 4 Children | 0 (0.0%) | 221 (73.7%) |
| 5 or more Children | 80 (100.0%) | 19 (100.0%) |
| Total | 116 (13.0%) | 645 (32.5%) |
Income Below Poverty Among Married-Couple vs Single-Parent Households in Frankfort
The poverty data for Frankfort shows that 138 of the married-couple family households (3.5%) and 761 of the single-parent households (26.5%) are living below the poverty level. Within the married-couple family households, those with 3 or 4 children have the highest poverty rate, with 47 households (15.6%) falling below the poverty line. Among the single-parent households, those with 5 or more children have the highest poverty rate, with 99 household (100.0%) living below poverty.
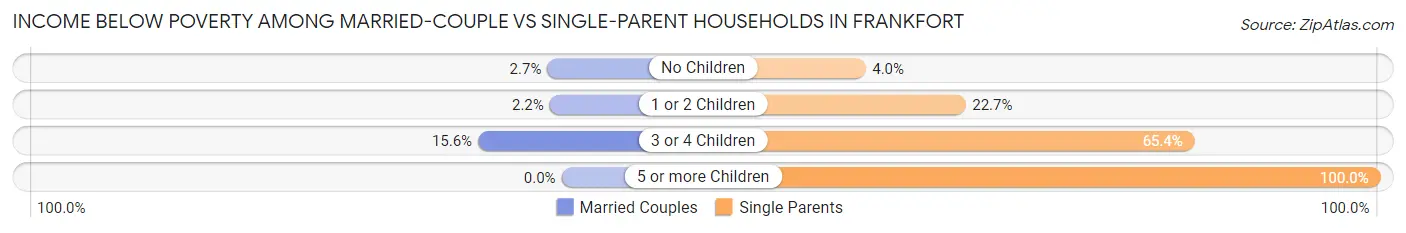
| Children | Married-Couple Families | Single-Parent Households |
| No Children | 58 (2.6%) | 24 (4.0%) |
| 1 or 2 Children | 33 (2.2%) | 417 (22.7%) |
| 3 or 4 Children | 47 (15.6%) | 221 (65.4%) |
| 5 or more Children | 0 (0.0%) | 99 (100.0%) |
| Total | 138 (3.5%) | 761 (26.5%) |
Race in Frankfort
The most populous races in Frankfort are White / Caucasian (21,073 | 74.0%), Black / African American (3,466 | 12.2%), and Two or more Races (2,193 | 7.7%).
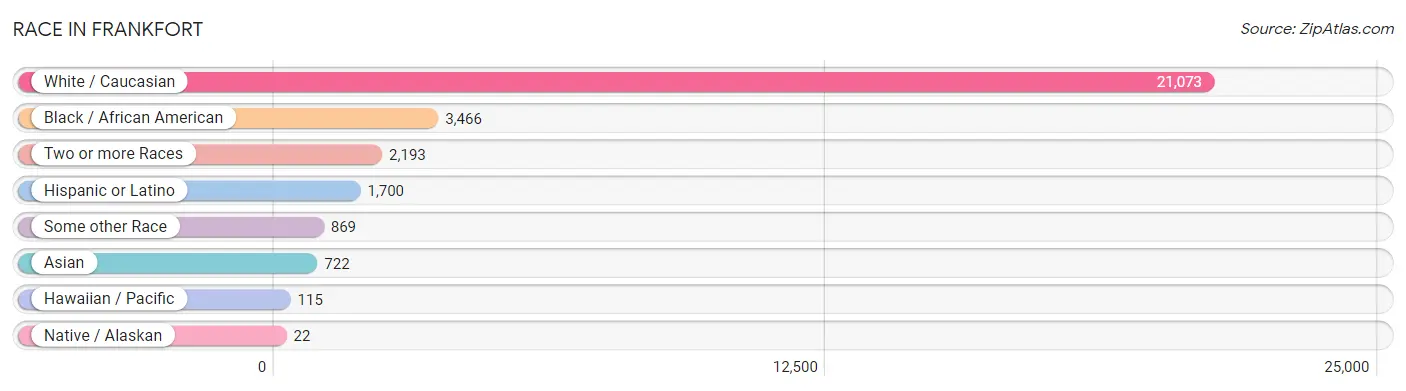
| Race | # Population | % Population |
| Asian | 722 | 2.5% |
| Black / African American | 3,466 | 12.2% |
| Hawaiian / Pacific | 115 | 0.4% |
| Hispanic or Latino | 1,700 | 6.0% |
| Native / Alaskan | 22 | 0.1% |
| White / Caucasian | 21,073 | 74.0% |
| Two or more Races | 2,193 | 7.7% |
| Some other Race | 869 | 3.0% |
| Total | 28,460 | 100.0% |
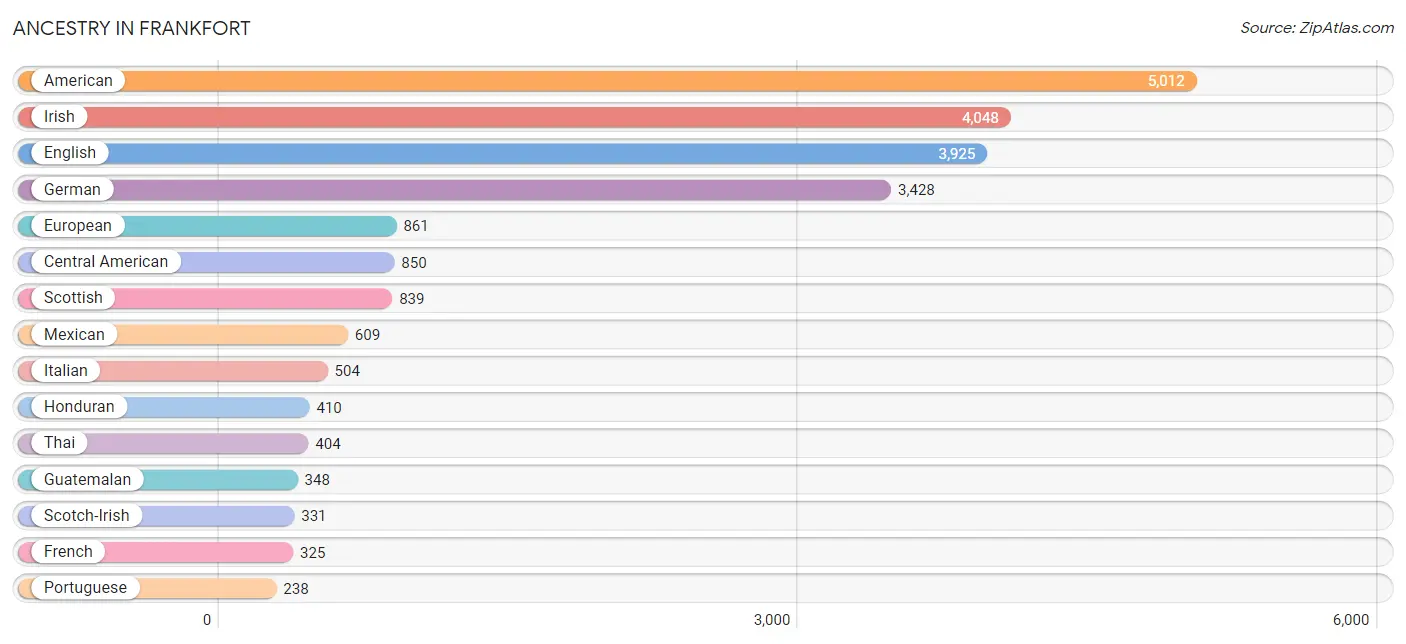
Ancestry in Frankfort
The most populous ancestries reported in Frankfort are American (5,012 | 17.6%), Irish (4,048 | 14.2%), English (3,925 | 13.8%), German (3,428 | 12.0%), and European (861 | 3.0%), together accounting for 60.7% of all Frankfort residents.
| Ancestry | # Population | % Population |
| African | 61 | 0.2% |
| American | 5,012 | 17.6% |
| Arab | 63 | 0.2% |
| Belgian | 5 | 0.0% |
| Belizean | 3 | 0.0% |
| Bhutanese | 34 | 0.1% |
| Blackfeet | 88 | 0.3% |
| Brazilian | 30 | 0.1% |
| British | 186 | 0.6% |
| Central American | 850 | 3.0% |
| Central American Indian | 14 | 0.1% |
| Cherokee | 119 | 0.4% |
| Colombian | 66 | 0.2% |
| Comanche | 27 | 0.1% |
| Cuban | 17 | 0.1% |
| Danish | 39 | 0.1% |
| Dominican | 21 | 0.1% |
| Dutch | 145 | 0.5% |
| English | 3,925 | 13.8% |
| Ethiopian | 112 | 0.4% |
| European | 861 | 3.0% |
| Finnish | 37 | 0.1% |
| French | 325 | 1.1% |
| French Canadian | 49 | 0.2% |
| German | 3,428 | 12.0% |
| Greek | 14 | 0.1% |
| Guatemalan | 348 | 1.2% |
| Haitian | 201 | 0.7% |
| Honduran | 410 | 1.4% |
| Hungarian | 11 | 0.0% |
| Indian (Asian) | 78 | 0.3% |
| Iranian | 25 | 0.1% |
| Irish | 4,048 | 14.2% |
| Iroquois | 5 | 0.0% |
| Italian | 504 | 1.8% |
| Jamaican | 34 | 0.1% |
| Korean | 94 | 0.3% |
| Lebanese | 11 | 0.0% |
| Mexican | 609 | 2.1% |
| Mexican American Indian | 10 | 0.0% |
| Moroccan | 45 | 0.2% |
| Northern European | 9 | 0.0% |
| Norwegian | 57 | 0.2% |
| Pakistani | 26 | 0.1% |
| Panamanian | 92 | 0.3% |
| Polish | 118 | 0.4% |
| Portuguese | 238 | 0.8% |
| Puerto Rican | 122 | 0.4% |
| Russian | 22 | 0.1% |
| Scandinavian | 67 | 0.2% |
| Scotch-Irish | 331 | 1.2% |
| Scottish | 839 | 2.9% |
| Sioux | 3 | 0.0% |
| Slovak | 12 | 0.0% |
| South African | 9 | 0.0% |
| South American | 66 | 0.2% |
| Spaniard | 15 | 0.1% |
| Sri Lankan | 106 | 0.4% |
| Subsaharan African | 182 | 0.6% |
| Swedish | 165 | 0.6% |
| Swiss | 44 | 0.2% |
| Syrian | 7 | 0.0% |
| Thai | 404 | 1.4% |
| Welsh | 99 | 0.4% | View All 64 Rows |
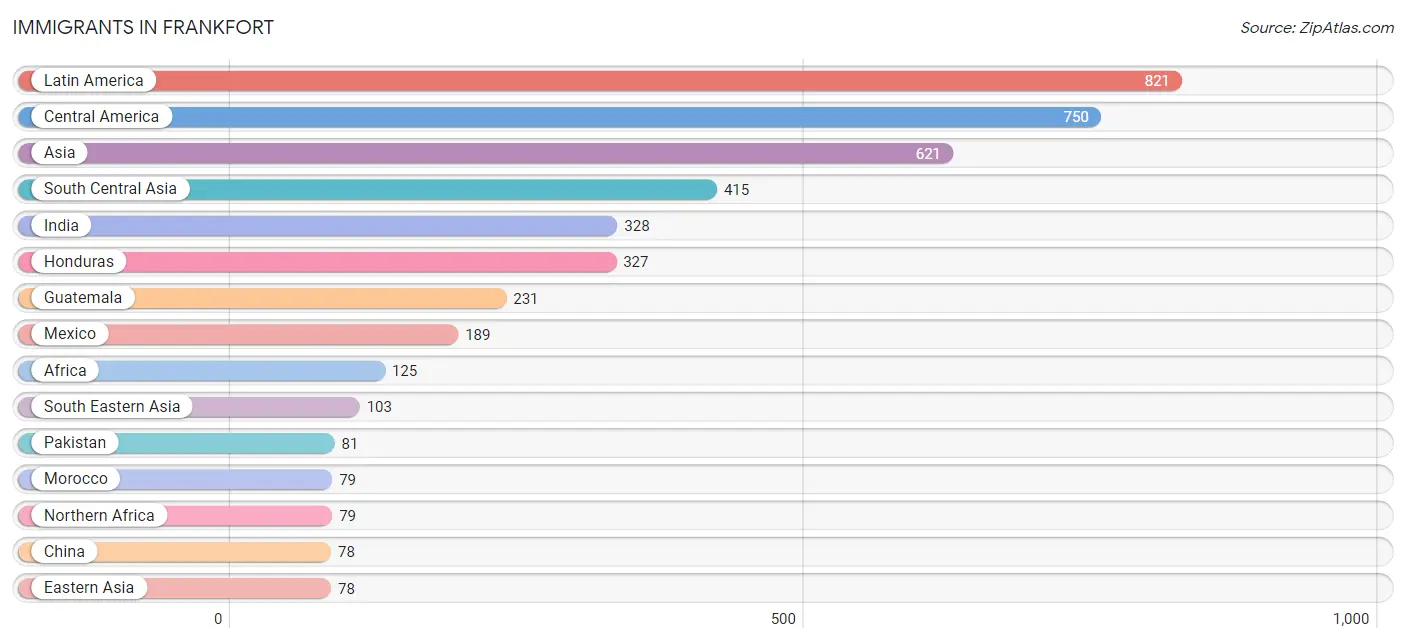
Immigrants in Frankfort
The most numerous immigrant groups reported in Frankfort came from Latin America (821 | 2.9%), Central America (750 | 2.6%), Asia (621 | 2.2%), South Central Asia (415 | 1.5%), and India (328 | 1.1%), together accounting for 10.3% of all Frankfort residents.
| Immigration Origin | # Population | % Population |
| Africa | 125 | 0.4% |
| Asia | 621 | 2.2% |
| Belize | 3 | 0.0% |
| Brazil | 44 | 0.2% |
| Canada | 9 | 0.0% |
| Central America | 750 | 2.6% |
| China | 78 | 0.3% |
| Colombia | 27 | 0.1% |
| Eastern Asia | 78 | 0.3% |
| Europe | 43 | 0.2% |
| France | 8 | 0.0% |
| Germany | 24 | 0.1% |
| Guatemala | 231 | 0.8% |
| Honduras | 327 | 1.1% |
| India | 328 | 1.1% |
| Iran | 6 | 0.0% |
| Latin America | 821 | 2.9% |
| Liberia | 29 | 0.1% |
| Mexico | 189 | 0.7% |
| Morocco | 79 | 0.3% |
| Northern Africa | 79 | 0.3% |
| Northern Europe | 11 | 0.0% |
| Pakistan | 81 | 0.3% |
| Philippines | 29 | 0.1% |
| South Africa | 17 | 0.1% |
| South America | 71 | 0.3% |
| South Central Asia | 415 | 1.5% |
| South Eastern Asia | 103 | 0.4% |
| Thailand | 74 | 0.3% |
| Western Africa | 29 | 0.1% |
| Western Asia | 25 | 0.1% |
| Western Europe | 32 | 0.1% | View All 32 Rows |
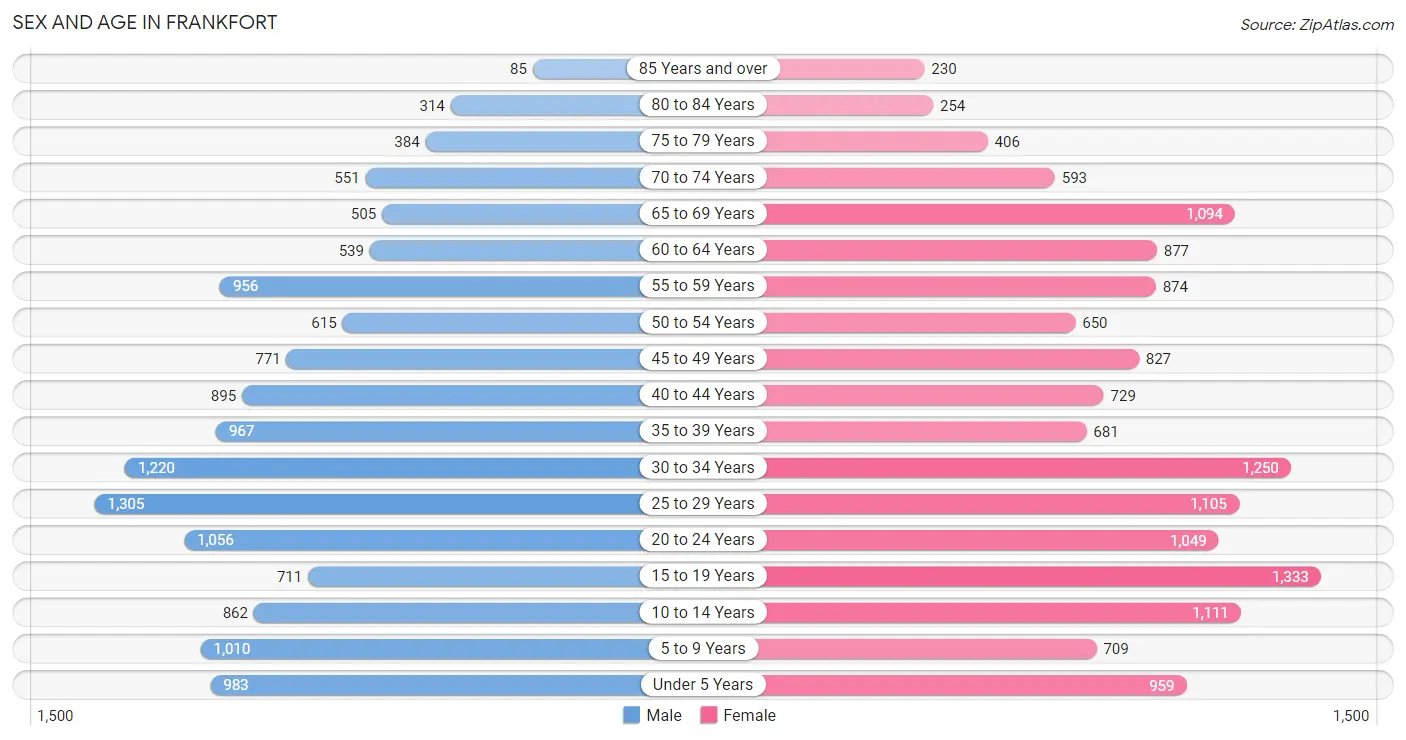
Sex and Age in Frankfort
Sex and Age in Frankfort
The most populous age groups in Frankfort are 25 to 29 Years (1,305 | 9.5%) for men and 15 to 19 Years (1,333 | 9.0%) for women.
| Age Bracket | Male | Female |
| Under 5 Years | 983 (7.2%) | 959 (6.5%) |
| 5 to 9 Years | 1,010 (7.4%) | 709 (4.8%) |
| 10 to 14 Years | 862 (6.3%) | 1,111 (7.5%) |
| 15 to 19 Years | 711 (5.2%) | 1,333 (9.0%) |
| 20 to 24 Years | 1,056 (7.7%) | 1,049 (7.1%) |
| 25 to 29 Years | 1,305 (9.5%) | 1,105 (7.5%) |
| 30 to 34 Years | 1,220 (8.9%) | 1,250 (8.5%) |
| 35 to 39 Years | 967 (7.0%) | 681 (4.6%) |
| 40 to 44 Years | 895 (6.5%) | 729 (5.0%) |
| 45 to 49 Years | 771 (5.6%) | 827 (5.6%) |
| 50 to 54 Years | 615 (4.5%) | 650 (4.4%) |
| 55 to 59 Years | 956 (7.0%) | 874 (5.9%) |
| 60 to 64 Years | 539 (3.9%) | 877 (5.9%) |
| 65 to 69 Years | 505 (3.7%) | 1,094 (7.4%) |
| 70 to 74 Years | 551 (4.0%) | 593 (4.0%) |
| 75 to 79 Years | 384 (2.8%) | 406 (2.8%) |
| 80 to 84 Years | 314 (2.3%) | 254 (1.7%) |
| 85 Years and over | 85 (0.6%) | 230 (1.6%) |
| Total | 13,729 (100.0%) | 14,731 (100.0%) |
Families and Households in Frankfort
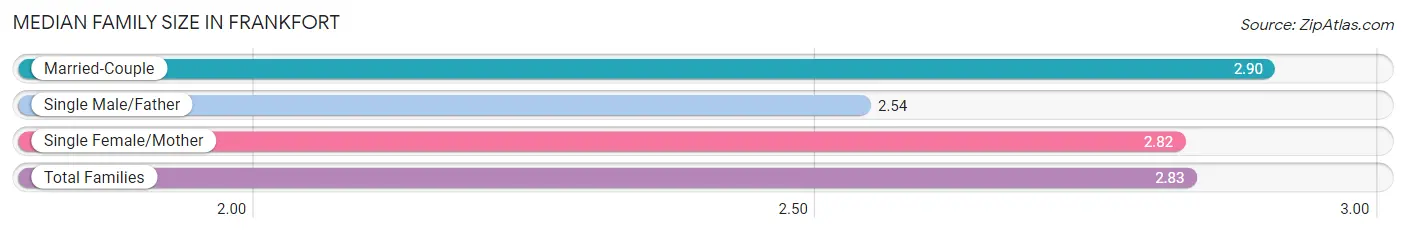
Median Family Size in Frankfort
The median family size in Frankfort is 2.83 persons per family, with married-couple families (3,989 | 58.1%) accounting for the largest median family size of 2.9 persons per family. On the other hand, single male/father families (892 | 13.0%) represent the smallest median family size with 2.54 persons per family.
| Family Type | # Families | Family Size |
| Married-Couple | 3,989 (58.1%) | 2.90 |
| Single Male/Father | 892 (13.0%) | 2.54 |
| Single Female/Mother | 1,982 (28.9%) | 2.82 |
| Total Families | 6,863 (100.0%) | 2.83 |
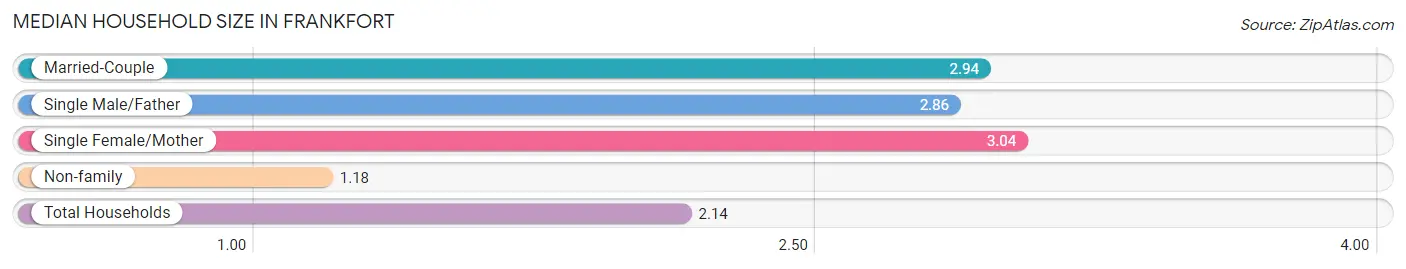
Median Household Size in Frankfort
The median household size in Frankfort is 2.14 persons per household, with single female/mother households (1,982 | 15.6%) accounting for the largest median household size of 3.04 persons per household. non-family households (5,807 | 45.8%) represent the smallest median household size with 1.18 persons per household.
| Household Type | # Households | Household Size |
| Married-Couple | 3,989 (31.5%) | 2.94 |
| Single Male/Father | 892 (7.0%) | 2.86 |
| Single Female/Mother | 1,982 (15.6%) | 3.04 |
| Non-family | 5,807 (45.8%) | 1.18 |
| Total Households | 12,670 (100.0%) | 2.14 |
Household Size by Marriage Status in Frankfort
Out of a total of 12,670 households in Frankfort, 6,863 (54.2%) are family households, while 5,807 (45.8%) are nonfamily households. The most numerous type of family households are 2-person households, comprising 3,080, and the most common type of nonfamily households are 1-person households, comprising 4,851.
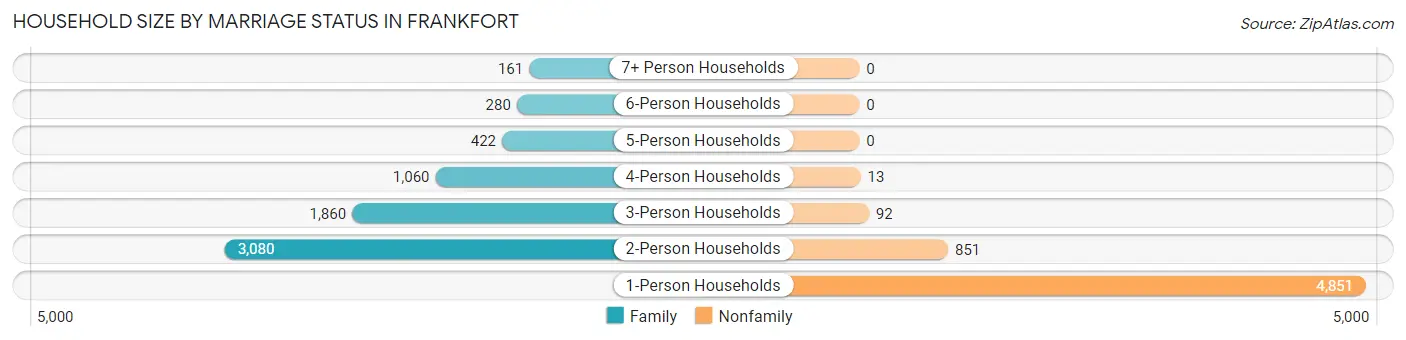
| Household Size | Family Households | Nonfamily Households |
| 1-Person Households | - | 4,851 (38.3%) |
| 2-Person Households | 3,080 (24.3%) | 851 (6.7%) |
| 3-Person Households | 1,860 (14.7%) | 92 (0.7%) |
| 4-Person Households | 1,060 (8.4%) | 13 (0.1%) |
| 5-Person Households | 422 (3.3%) | 0 (0.0%) |
| 6-Person Households | 280 (2.2%) | 0 (0.0%) |
| 7+ Person Households | 161 (1.3%) | 0 (0.0%) |
| Total | 6,863 (54.2%) | 5,807 (45.8%) |
Female Fertility in Frankfort
Fertility by Age in Frankfort
Average fertility rate in Frankfort is 53.0 births per 1,000 women. Women in the age bracket of 20 to 34 years have the highest fertility rate with 81.0 births per 1,000 women. Women in the age bracket of 20 to 34 years acount for 74.2% of all women with births.
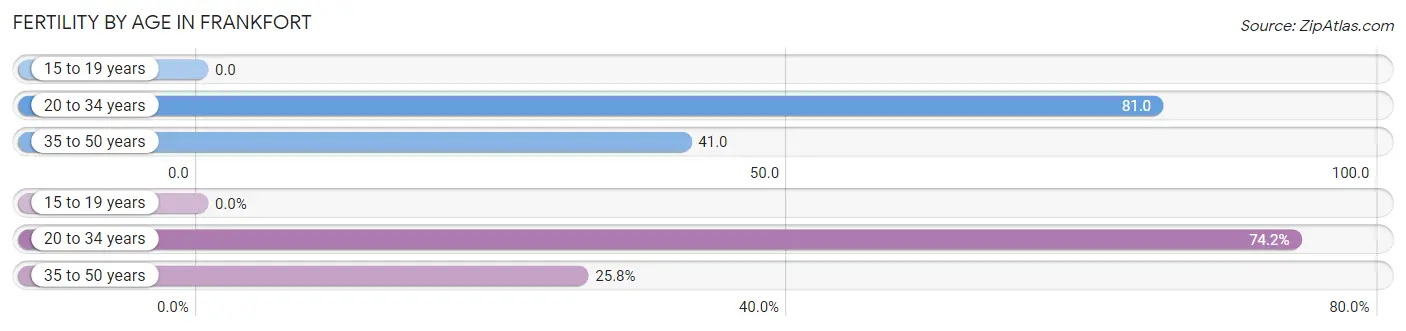
| Age Bracket | Women with Births | Births / 1,000 Women |
| 15 to 19 years | 0 (0.0%) | 0.0 |
| 20 to 34 years | 276 (74.2%) | 81.0 |
| 35 to 50 years | 96 (25.8%) | 41.0 |
| Total | 372 (100.0%) | 53.0 |
Fertility by Age by Marriage Status in Frankfort
75.0% of women with births (372) in Frankfort are married. The highest percentage of unmarried women with births falls into 35 to 50 years age bracket with 45.8% of them unmarried at the time of birth, while the lowest percentage of unmarried women with births belong to 20 to 34 years age bracket with 17.7% of them unmarried.
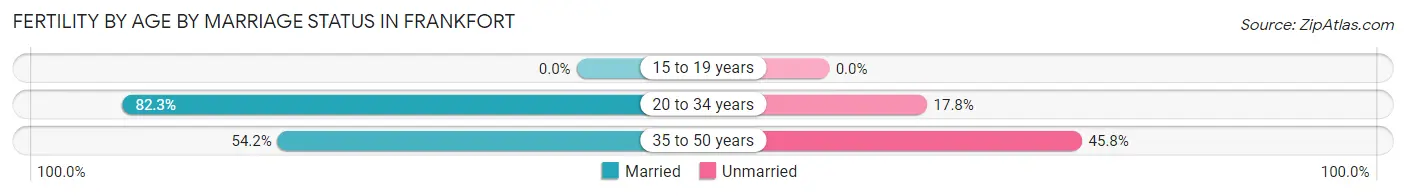
| Age Bracket | Married | Unmarried |
| 15 to 19 years | 0 (0.0%) | 0 (0.0%) |
| 20 to 34 years | 227 (82.3%) | 49 (17.7%) |
| 35 to 50 years | 52 (54.2%) | 44 (45.8%) |
| Total | 279 (75.0%) | 93 (25.0%) |
Fertility by Education in Frankfort
Average fertility rate in Frankfort is 53.0 births per 1,000 women. Women with the education attainment of graduate degree have the highest fertility rate of 212.0 births per 1,000 women, while women with the education attainment of bachelor's degree have the lowest fertility at 20.0 births per 1,000 women. Women with the education attainment of graduate degree represent 36.0% of all women with births.
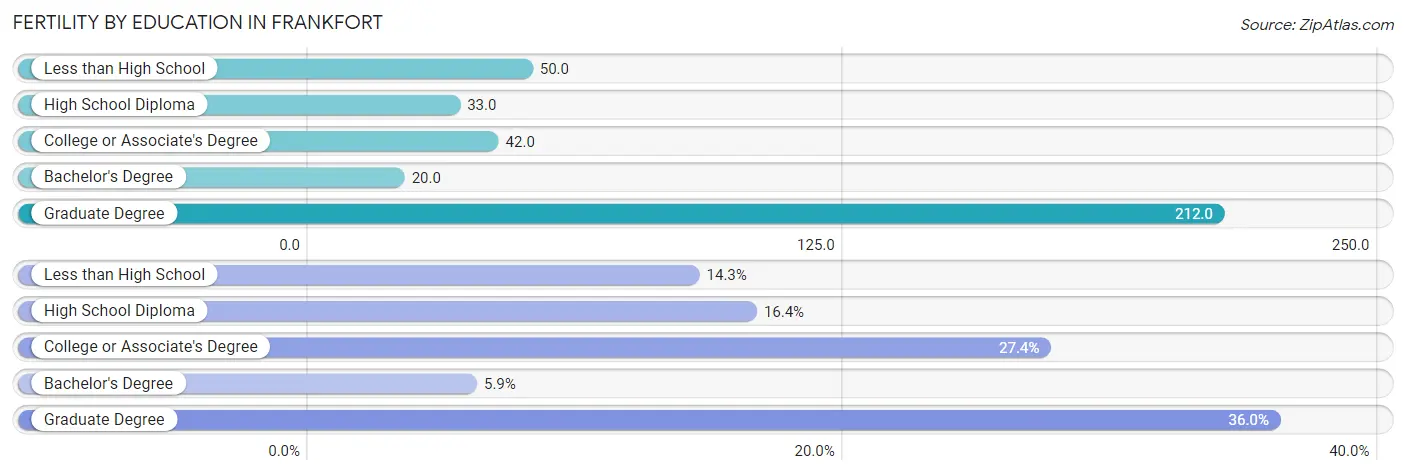
| Educational Attainment | Women with Births | Births / 1,000 Women |
| Less than High School | 53 (14.2%) | 50.0 |
| High School Diploma | 61 (16.4%) | 33.0 |
| College or Associate's Degree | 102 (27.4%) | 42.0 |
| Bachelor's Degree | 22 (5.9%) | 20.0 |
| Graduate Degree | 134 (36.0%) | 212.0 |
| Total | 372 (100.0%) | 53.0 |
Fertility by Education by Marriage Status in Frankfort
25.0% of women with births in Frankfort are unmarried. Women with the educational attainment of graduate degree are most likely to be married with 100.0% of them married at childbirth, while women with the educational attainment of bachelor's degree are least likely to be married with 63.6% of them unmarried at childbirth.
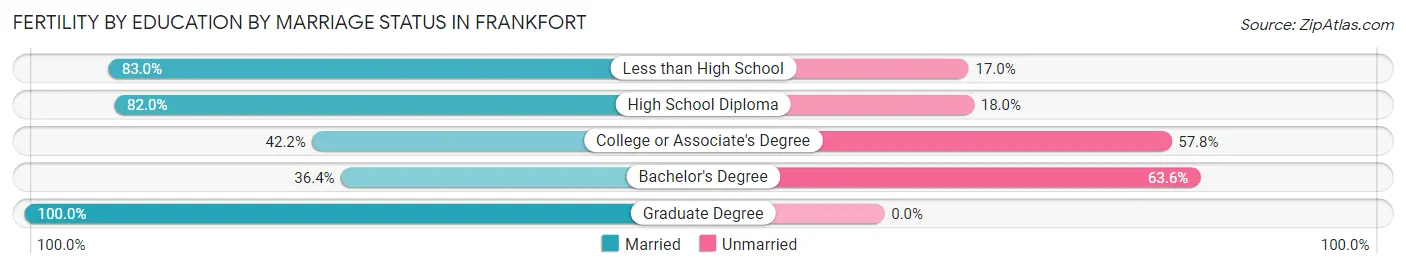
| Educational Attainment | Married | Unmarried |
| Less than High School | 44 (83.0%) | 9 (17.0%) |
| High School Diploma | 50 (82.0%) | 11 (18.0%) |
| College or Associate's Degree | 43 (42.2%) | 59 (57.8%) |
| Bachelor's Degree | 8 (36.4%) | 14 (63.6%) |
| Graduate Degree | 134 (100.0%) | 0 (0.0%) |
| Total | 279 (75.0%) | 93 (25.0%) |
Employment Characteristics in Frankfort
Employment by Class of Employer in Frankfort
Among the 12,972 employed individuals in Frankfort, private company employees (7,744 | 59.7%), state government employees (2,620 | 20.2%), and local government employees (1,210 | 9.3%) make up the most common classes of employment.
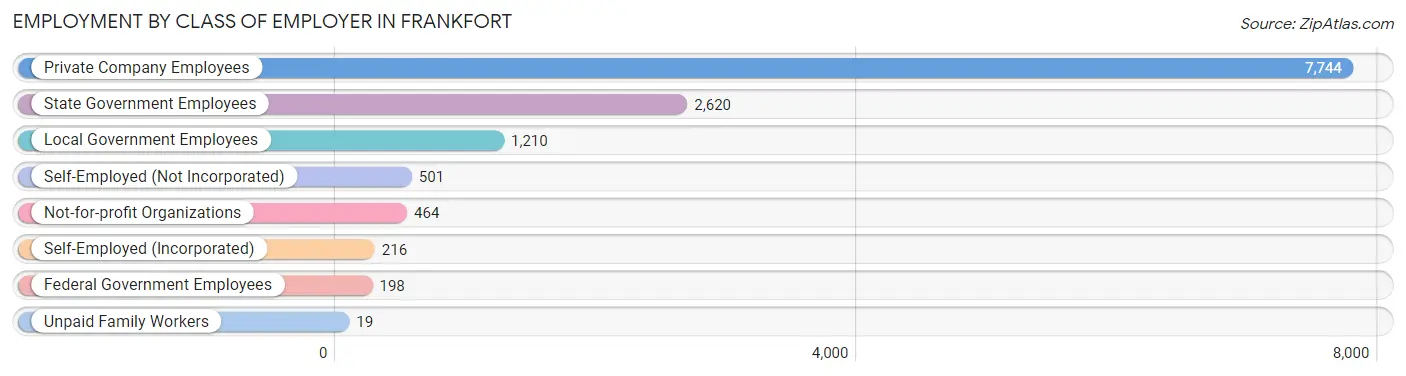
| Employer Class | # Employees | % Employees |
| Private Company Employees | 7,744 | 59.7% |
| Self-Employed (Incorporated) | 216 | 1.7% |
| Self-Employed (Not Incorporated) | 501 | 3.9% |
| Not-for-profit Organizations | 464 | 3.6% |
| Local Government Employees | 1,210 | 9.3% |
| State Government Employees | 2,620 | 20.2% |
| Federal Government Employees | 198 | 1.5% |
| Unpaid Family Workers | 19 | 0.2% |
| Total | 12,972 | 100.0% |
Employment Status by Age in Frankfort
According to the labor force statistics for Frankfort, out of the total population over 16 years of age (22,375), 62.8% or 14,052 individuals are in the labor force, with 5.4% or 759 of them unemployed. The age group with the highest labor force participation rate is 35 to 44 years, with 87.8% or 2,873 individuals in the labor force. Within the labor force, the 16 to 19 years age range has the highest percentage of unemployed individuals, with 37.9% or 238 of them being unemployed.
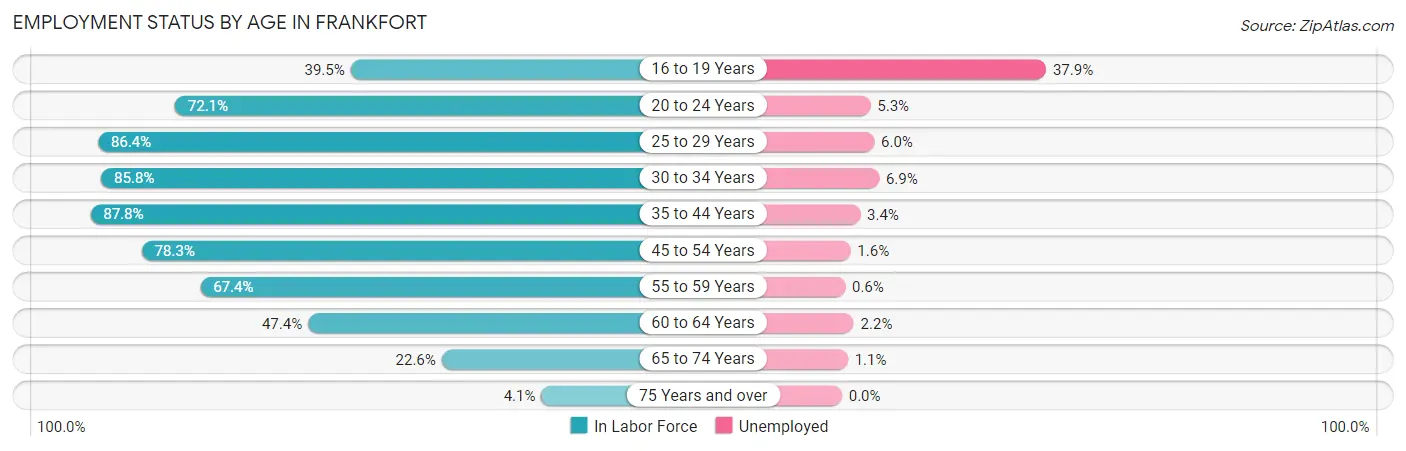
| Age Bracket | In Labor Force | Unemployed |
| 16 to 19 Years | 629 (39.5%) | 238 (37.9%) |
| 20 to 24 Years | 1,518 (72.1%) | 80 (5.3%) |
| 25 to 29 Years | 2,082 (86.4%) | 125 (6.0%) |
| 30 to 34 Years | 2,119 (85.8%) | 146 (6.9%) |
| 35 to 44 Years | 2,873 (87.8%) | 98 (3.4%) |
| 45 to 54 Years | 2,242 (78.3%) | 36 (1.6%) |
| 55 to 59 Years | 1,233 (67.4%) | 7 (0.6%) |
| 60 to 64 Years | 671 (47.4%) | 15 (2.2%) |
| 65 to 74 Years | 620 (22.6%) | 7 (1.1%) |
| 75 Years and over | 69 (4.1%) | 0 (0.0%) |
| Total | 14,052 (62.8%) | 759 (5.4%) |
Employment Status by Educational Attainment in Frankfort
According to labor force statistics for Frankfort, 78.7% of individuals (11,223) out of the total population between 25 and 64 years of age (14,261) are in the labor force, with 3.8% or 426 of them being unemployed. The group with the highest labor force participation rate are those with the educational attainment of bachelor's degree or higher, with 87.9% or 3,475 individuals in the labor force. Within the labor force, individuals with college / associate degree education have the highest percentage of unemployment, with 5.9% or 235 of them being unemployed.
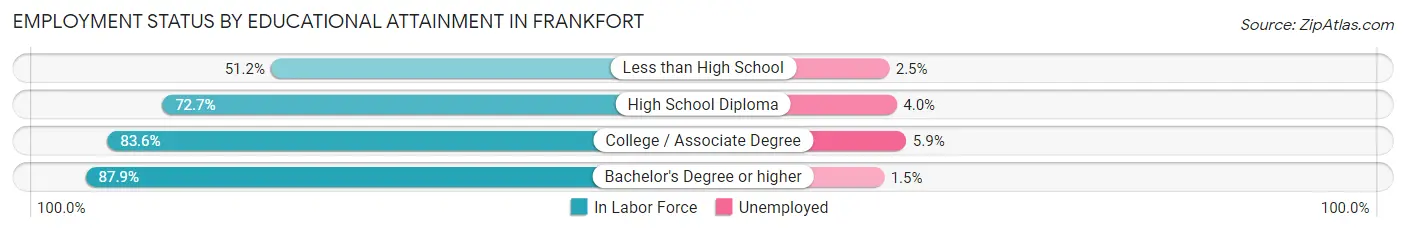
| Educational Attainment | In Labor Force | Unemployed |
| Less than High School | 634 (51.2%) | 31 (2.5%) |
| High School Diploma | 3,133 (72.7%) | 172 (4.0%) |
| College / Associate Degree | 3,979 (83.6%) | 281 (5.9%) |
| Bachelor's Degree or higher | 3,475 (87.9%) | 59 (1.5%) |
| Total | 11,223 (78.7%) | 542 (3.8%) |
Employment Occupations by Sex in Frankfort
Management, Business, Science and Arts Occupations
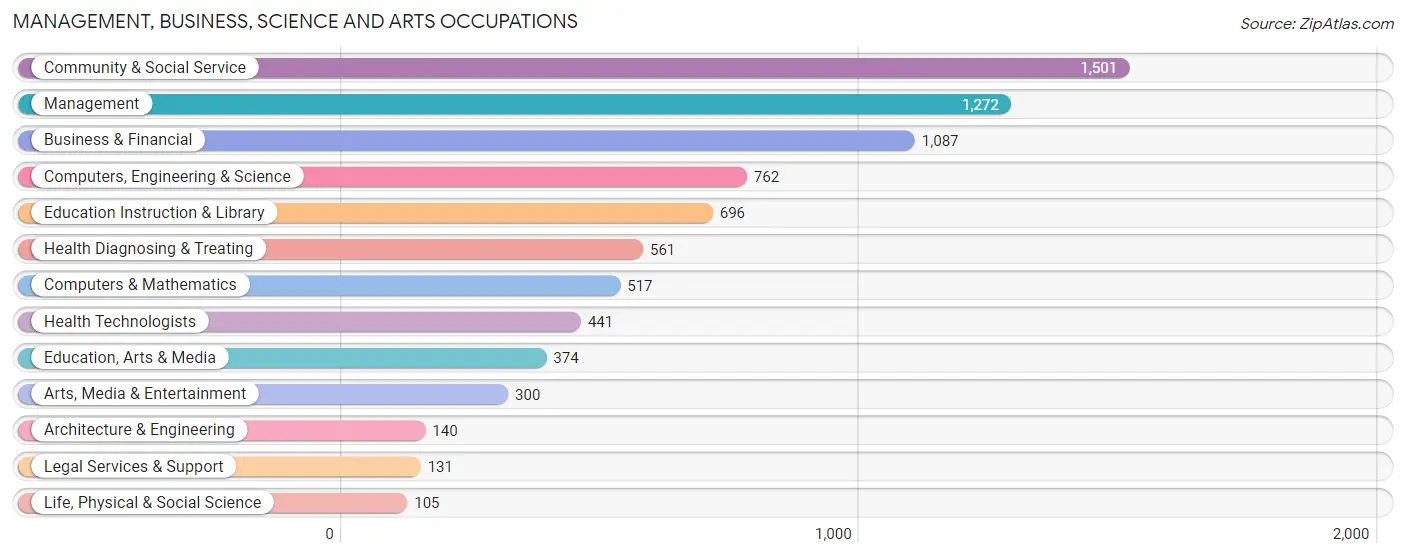
The most common Management, Business, Science and Arts occupations in Frankfort are Community & Social Service (1,501 | 11.3%), Management (1,272 | 9.6%), Business & Financial (1,087 | 8.2%), Computers, Engineering & Science (762 | 5.8%), and Education Instruction & Library (696 | 5.2%).
Management, Business, Science and Arts Occupations by Sex
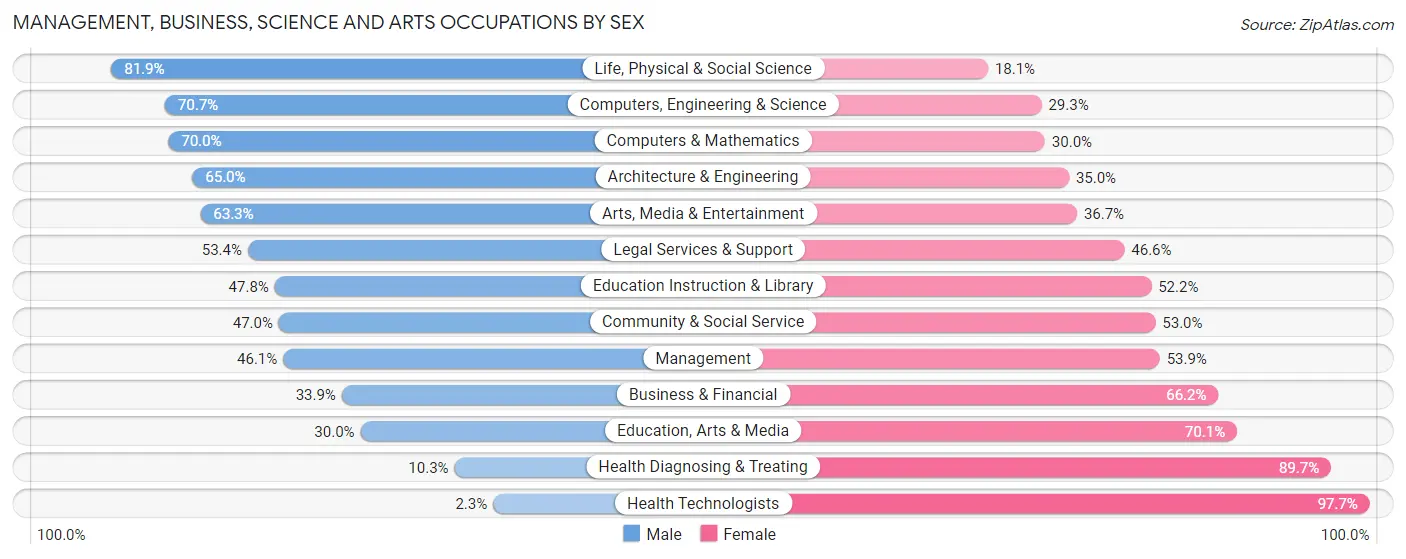
Within the Management, Business, Science and Arts occupations in Frankfort, the most male-oriented occupations are Life, Physical & Social Science (81.9%), Computers, Engineering & Science (70.7%), and Computers & Mathematics (70.0%), while the most female-oriented occupations are Health Technologists (97.7%), Health Diagnosing & Treating (89.7%), and Education, Arts & Media (70.1%).
| Occupation | Male | Female |
| Management | 586 (46.1%) | 686 (53.9%) |
| Business & Financial | 368 (33.9%) | 719 (66.1%) |
| Computers, Engineering & Science | 539 (70.7%) | 223 (29.3%) |
| Computers & Mathematics | 362 (70.0%) | 155 (30.0%) |
| Architecture & Engineering | 91 (65.0%) | 49 (35.0%) |
| Life, Physical & Social Science | 86 (81.9%) | 19 (18.1%) |
| Community & Social Service | 705 (47.0%) | 796 (53.0%) |
| Education, Arts & Media | 112 (29.9%) | 262 (70.1%) |
| Legal Services & Support | 70 (53.4%) | 61 (46.6%) |
| Education Instruction & Library | 333 (47.8%) | 363 (52.2%) |
| Arts, Media & Entertainment | 190 (63.3%) | 110 (36.7%) |
| Health Diagnosing & Treating | 58 (10.3%) | 503 (89.7%) |
| Health Technologists | 10 (2.3%) | 431 (97.7%) |
| Total (Category) | 2,256 (43.5%) | 2,927 (56.5%) |
| Total (Overall) | 6,714 (50.6%) | 6,544 (49.4%) |
Services Occupations
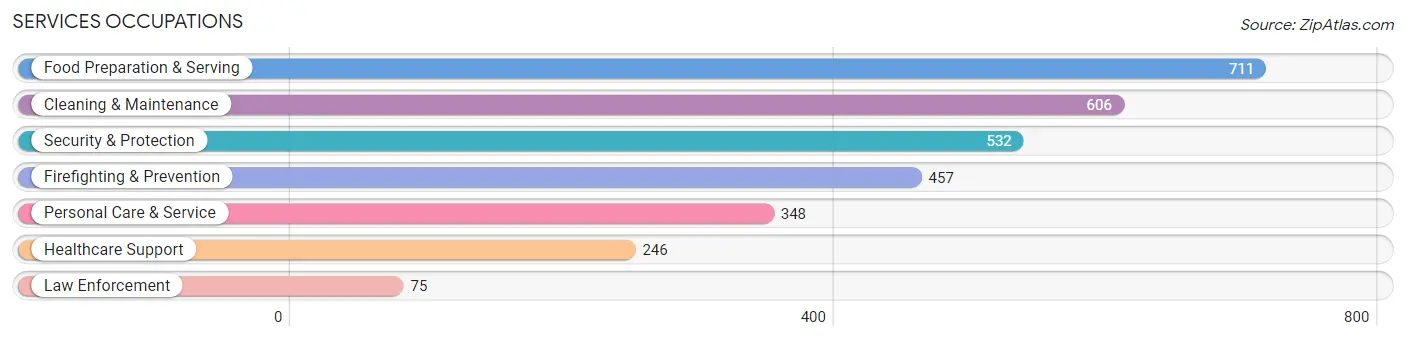
The most common Services occupations in Frankfort are Food Preparation & Serving (711 | 5.4%), Cleaning & Maintenance (606 | 4.6%), Security & Protection (532 | 4.0%), Firefighting & Prevention (457 | 3.5%), and Personal Care & Service (348 | 2.6%).
Services Occupations by Sex
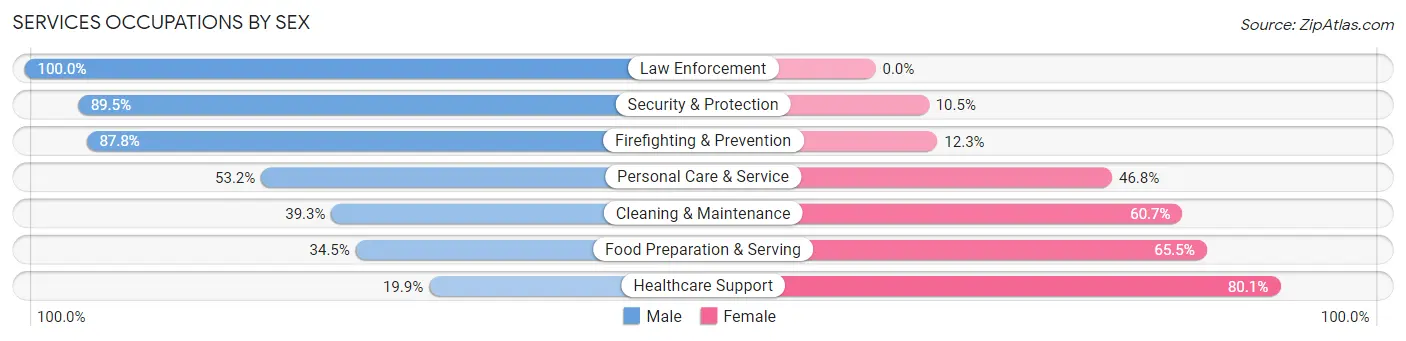
Within the Services occupations in Frankfort, the most male-oriented occupations are Law Enforcement (100.0%), Security & Protection (89.5%), and Firefighting & Prevention (87.7%), while the most female-oriented occupations are Healthcare Support (80.1%), Food Preparation & Serving (65.5%), and Cleaning & Maintenance (60.7%).
| Occupation | Male | Female |
| Healthcare Support | 49 (19.9%) | 197 (80.1%) |
| Security & Protection | 476 (89.5%) | 56 (10.5%) |
| Firefighting & Prevention | 401 (87.7%) | 56 (12.2%) |
| Law Enforcement | 75 (100.0%) | 0 (0.0%) |
| Food Preparation & Serving | 245 (34.5%) | 466 (65.5%) |
| Cleaning & Maintenance | 238 (39.3%) | 368 (60.7%) |
| Personal Care & Service | 185 (53.2%) | 163 (46.8%) |
| Total (Category) | 1,193 (48.8%) | 1,250 (51.2%) |
| Total (Overall) | 6,714 (50.6%) | 6,544 (49.4%) |
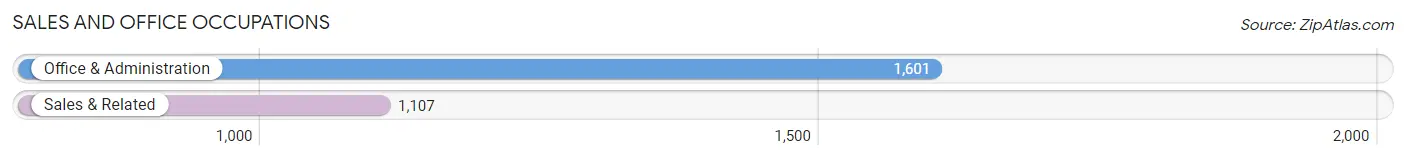
Sales and Office Occupations
The most common Sales and Office occupations in Frankfort are Office & Administration (1,601 | 12.1%), and Sales & Related (1,107 | 8.4%).
Sales and Office Occupations by Sex
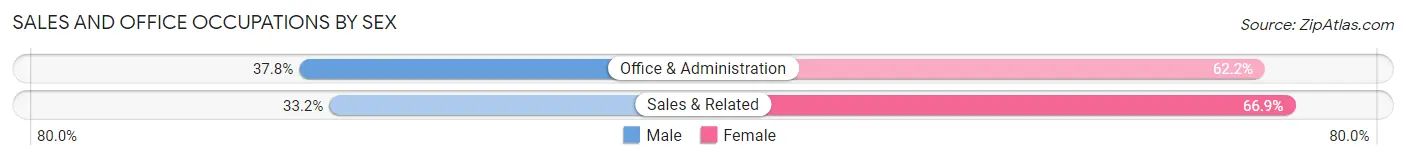
| Occupation | Male | Female |
| Sales & Related | 367 (33.2%) | 740 (66.8%) |
| Office & Administration | 605 (37.8%) | 996 (62.2%) |
| Total (Category) | 972 (35.9%) | 1,736 (64.1%) |
| Total (Overall) | 6,714 (50.6%) | 6,544 (49.4%) |
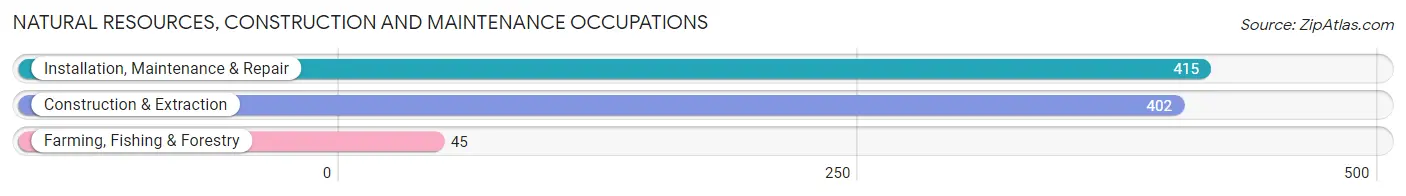
Natural Resources, Construction and Maintenance Occupations
The most common Natural Resources, Construction and Maintenance occupations in Frankfort are Installation, Maintenance & Repair (415 | 3.1%), Construction & Extraction (402 | 3.0%), and Farming, Fishing & Forestry (45 | 0.3%).
Natural Resources, Construction and Maintenance Occupations by Sex
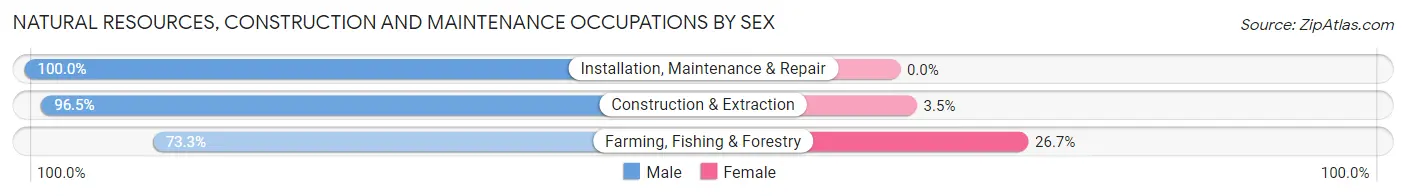
| Occupation | Male | Female |
| Farming, Fishing & Forestry | 33 (73.3%) | 12 (26.7%) |
| Construction & Extraction | 388 (96.5%) | 14 (3.5%) |
| Installation, Maintenance & Repair | 415 (100.0%) | 0 (0.0%) |
| Total (Category) | 836 (97.0%) | 26 (3.0%) |
| Total (Overall) | 6,714 (50.6%) | 6,544 (49.4%) |
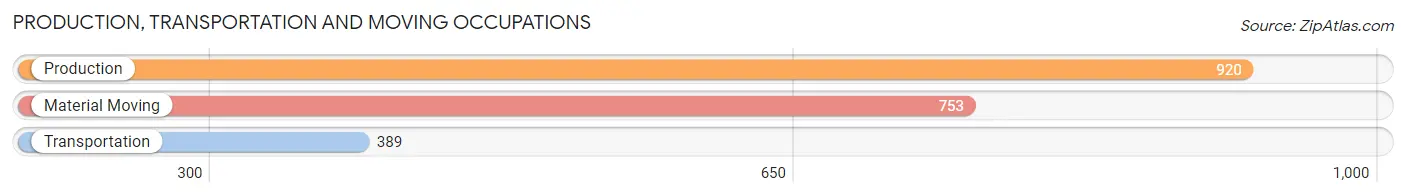
Production, Transportation and Moving Occupations
The most common Production, Transportation and Moving occupations in Frankfort are Production (920 | 6.9%), Material Moving (753 | 5.7%), and Transportation (389 | 2.9%).
Production, Transportation and Moving Occupations by Sex
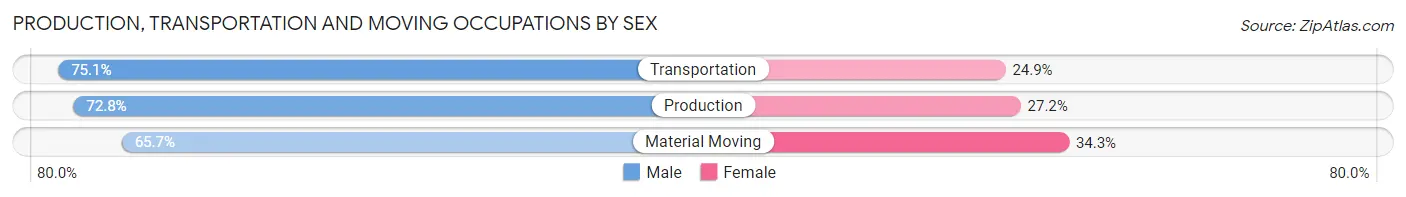
| Occupation | Male | Female |
| Production | 670 (72.8%) | 250 (27.2%) |
| Transportation | 292 (75.1%) | 97 (24.9%) |
| Material Moving | 495 (65.7%) | 258 (34.3%) |
| Total (Category) | 1,457 (70.7%) | 605 (29.3%) |
| Total (Overall) | 6,714 (50.6%) | 6,544 (49.4%) |
Employment Industries by Sex in Frankfort
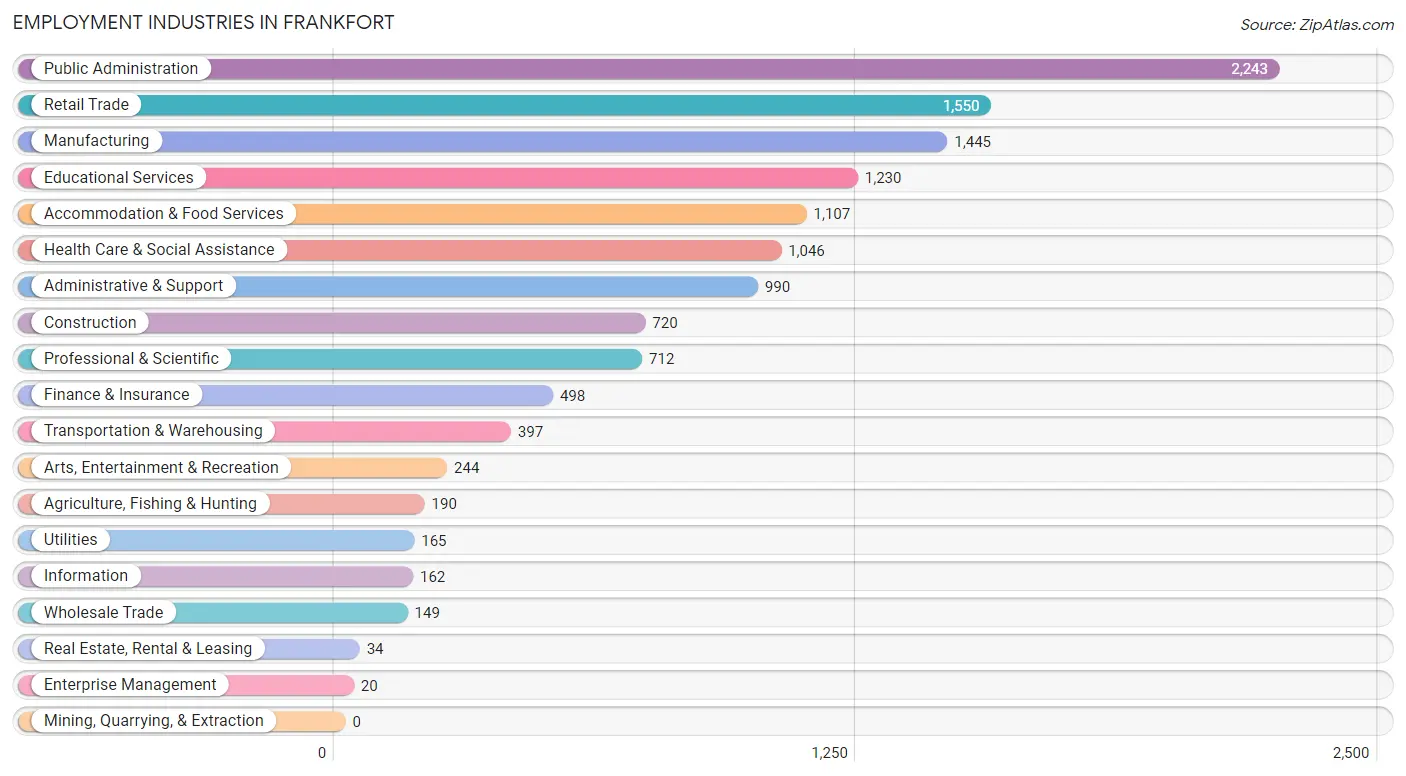
Employment Industries in Frankfort
The major employment industries in Frankfort include Public Administration (2,243 | 16.9%), Retail Trade (1,550 | 11.7%), Manufacturing (1,445 | 10.9%), Educational Services (1,230 | 9.3%), and Accommodation & Food Services (1,107 | 8.4%).
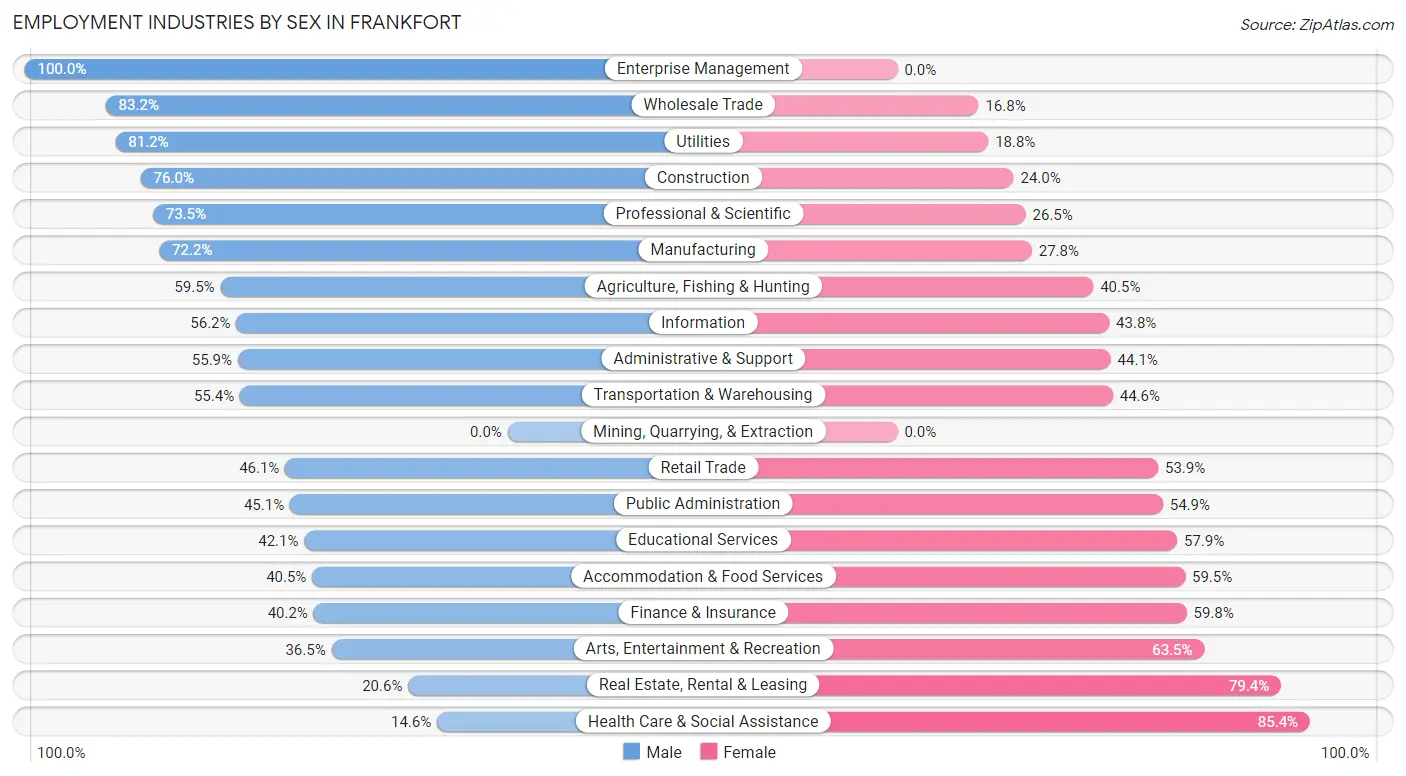
Employment Industries by Sex in Frankfort
The Frankfort industries that see more men than women are Enterprise Management (100.0%), Wholesale Trade (83.2%), and Utilities (81.2%), whereas the industries that tend to have a higher number of women are Health Care & Social Assistance (85.4%), Real Estate, Rental & Leasing (79.4%), and Arts, Entertainment & Recreation (63.5%).
| Industry | Male | Female |
| Agriculture, Fishing & Hunting | 113 (59.5%) | 77 (40.5%) |
| Mining, Quarrying, & Extraction | 0 (0.0%) | 0 (0.0%) |
| Construction | 547 (76.0%) | 173 (24.0%) |
| Manufacturing | 1,043 (72.2%) | 402 (27.8%) |
| Wholesale Trade | 124 (83.2%) | 25 (16.8%) |
| Retail Trade | 714 (46.1%) | 836 (53.9%) |
| Transportation & Warehousing | 220 (55.4%) | 177 (44.6%) |
| Utilities | 134 (81.2%) | 31 (18.8%) |
| Information | 91 (56.2%) | 71 (43.8%) |
| Finance & Insurance | 200 (40.2%) | 298 (59.8%) |
| Real Estate, Rental & Leasing | 7 (20.6%) | 27 (79.4%) |
| Professional & Scientific | 523 (73.5%) | 189 (26.5%) |
| Enterprise Management | 20 (100.0%) | 0 (0.0%) |
| Administrative & Support | 553 (55.9%) | 437 (44.1%) |
| Educational Services | 518 (42.1%) | 712 (57.9%) |
| Health Care & Social Assistance | 153 (14.6%) | 893 (85.4%) |
| Arts, Entertainment & Recreation | 89 (36.5%) | 155 (63.5%) |
| Accommodation & Food Services | 448 (40.5%) | 659 (59.5%) |
| Public Administration | 1,011 (45.1%) | 1,232 (54.9%) |
| Total | 6,714 (50.6%) | 6,544 (49.4%) |
Education in Frankfort
School Enrollment in Frankfort
The most common levels of schooling among the 6,806 students in Frankfort are college / undergraduate (1,601 | 23.5%), middle school (1,585 | 23.3%), and high school (1,351 | 19.9%).
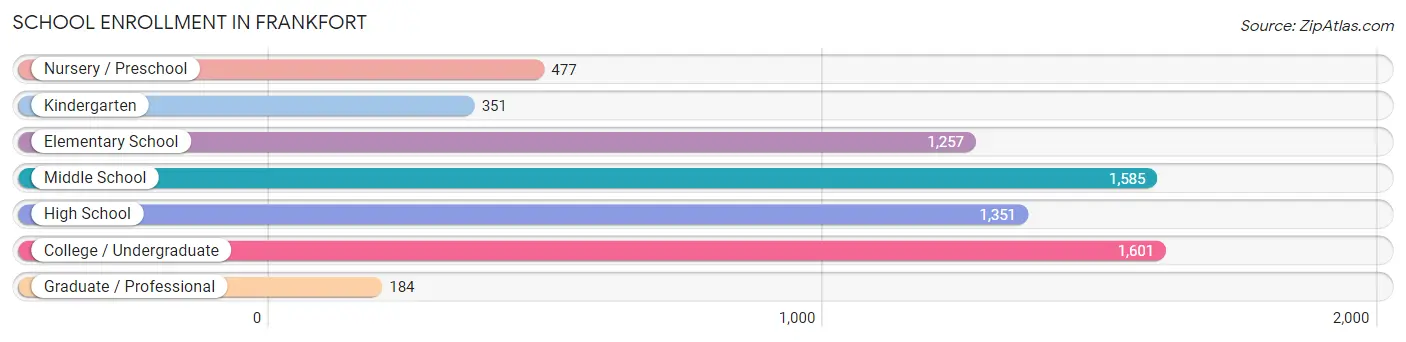
| School Level | # Students | % Students |
| Nursery / Preschool | 477 | 7.0% |
| Kindergarten | 351 | 5.2% |
| Elementary School | 1,257 | 18.5% |
| Middle School | 1,585 | 23.3% |
| High School | 1,351 | 19.9% |
| College / Undergraduate | 1,601 | 23.5% |
| Graduate / Professional | 184 | 2.7% |
| Total | 6,806 | 100.0% |
School Enrollment by Age by Funding Source in Frankfort
Out of a total of 6,806 students who are enrolled in schools in Frankfort, 667 (9.8%) attend a private institution, while the remaining 6,139 (90.2%) are enrolled in public schools. The age group of 18 to 19 year olds has the highest likelihood of being enrolled in private schools, with 162 (26.6% in the age bracket) enrolled. Conversely, the age group of 15 to 17 year olds has the lowest likelihood of being enrolled in a private school, with 1,029 (96.5% in the age bracket) attending a public institution.
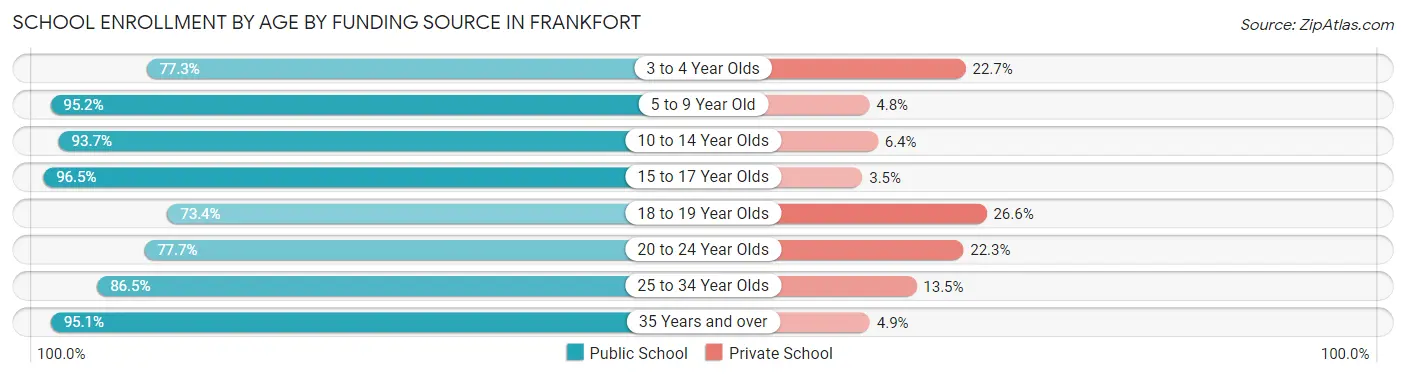
| Age Bracket | Public School | Private School |
| 3 to 4 Year Olds | 235 (77.3%) | 69 (22.7%) |
| 5 to 9 Year Old | 1,530 (95.2%) | 77 (4.8%) |
| 10 to 14 Year Olds | 1,829 (93.6%) | 124 (6.4%) |
| 15 to 17 Year Olds | 1,029 (96.5%) | 37 (3.5%) |
| 18 to 19 Year Olds | 447 (73.4%) | 162 (26.6%) |
| 20 to 24 Year Olds | 436 (77.7%) | 125 (22.3%) |
| 25 to 34 Year Olds | 415 (86.5%) | 65 (13.5%) |
| 35 Years and over | 215 (95.1%) | 11 (4.9%) |
| Total | 6,139 (90.2%) | 667 (9.8%) |
Educational Attainment by Field of Study in Frankfort
Business (887 | 15.5%), science & technology (699 | 12.2%), education (585 | 10.2%), bio, nature & agricultural (568 | 9.9%), and social sciences (428 | 7.5%) are the most common fields of study among 5,738 individuals in Frankfort who have obtained a bachelor's degree or higher.
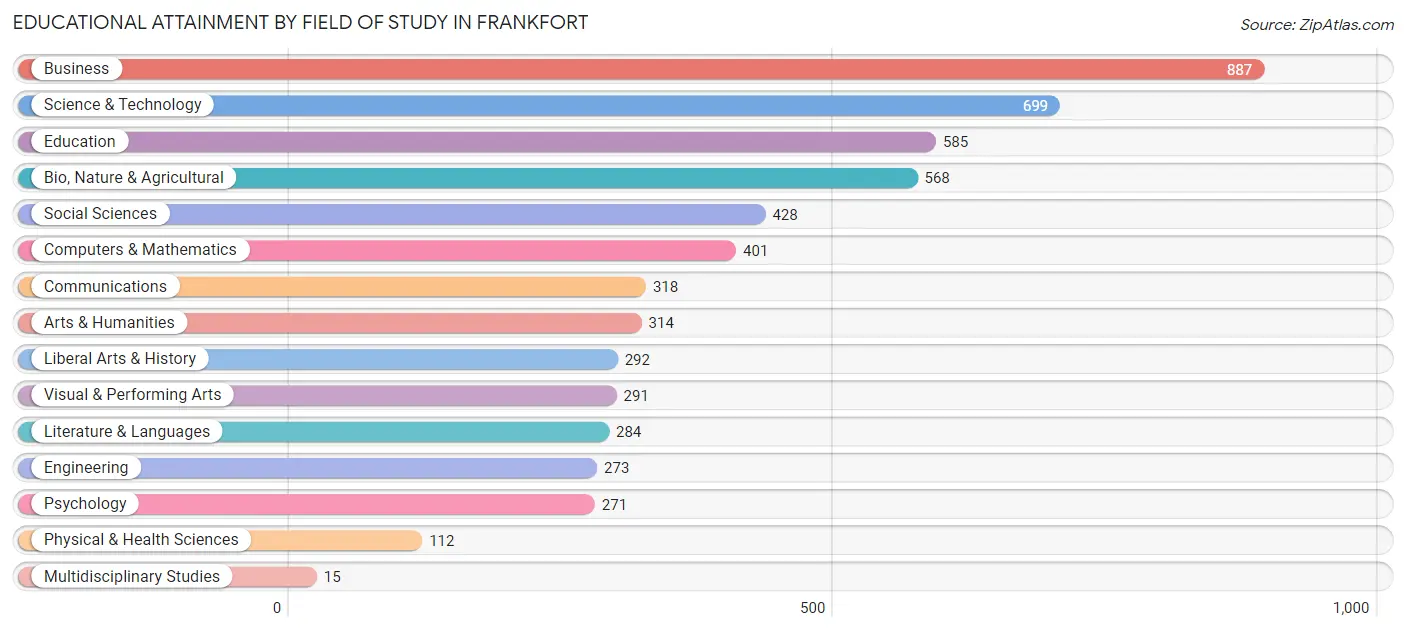
| Field of Study | # Graduates | % Graduates |
| Computers & Mathematics | 401 | 7.0% |
| Bio, Nature & Agricultural | 568 | 9.9% |
| Physical & Health Sciences | 112 | 1.9% |
| Psychology | 271 | 4.7% |
| Social Sciences | 428 | 7.5% |
| Engineering | 273 | 4.8% |
| Multidisciplinary Studies | 15 | 0.3% |
| Science & Technology | 699 | 12.2% |
| Business | 887 | 15.5% |
| Education | 585 | 10.2% |
| Literature & Languages | 284 | 5.0% |
| Liberal Arts & History | 292 | 5.1% |
| Visual & Performing Arts | 291 | 5.1% |
| Communications | 318 | 5.5% |
| Arts & Humanities | 314 | 5.5% |
| Total | 5,738 | 100.0% |
Transportation & Commute in Frankfort
Vehicle Availability by Sex in Frankfort
The most prevalent vehicle ownership categories in Frankfort are males with 2 vehicles (3,097, accounting for 46.9%) and females with 2 vehicles (2,423, making up 50.3%).
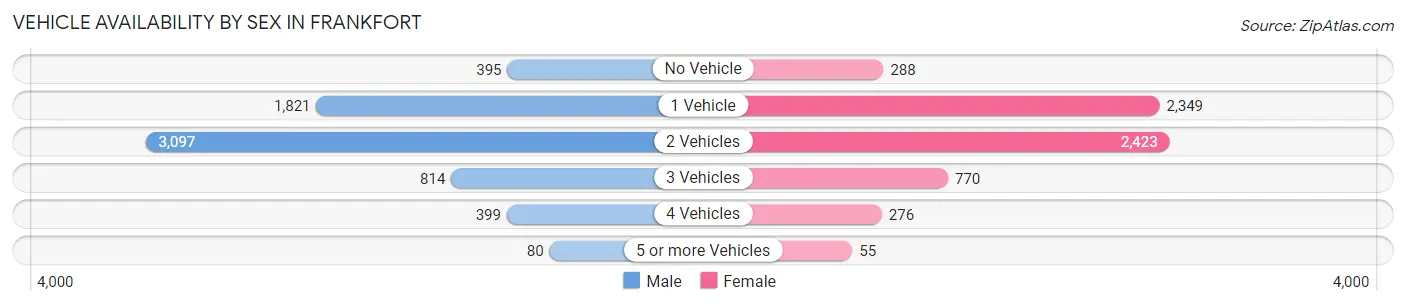
| Vehicles Available | Male | Female |
| No Vehicle | 395 (6.0%) | 288 (4.7%) |
| 1 Vehicle | 1,821 (27.6%) | 2,349 (38.1%) |
| 2 Vehicles | 3,097 (46.9%) | 2,423 (39.3%) |
| 3 Vehicles | 814 (12.3%) | 770 (12.5%) |
| 4 Vehicles | 399 (6.0%) | 276 (4.5%) |
| 5 or more Vehicles | 80 (1.2%) | 55 (0.9%) |
| Total | 6,606 (100.0%) | 6,161 (100.0%) |
Commute Time in Frankfort
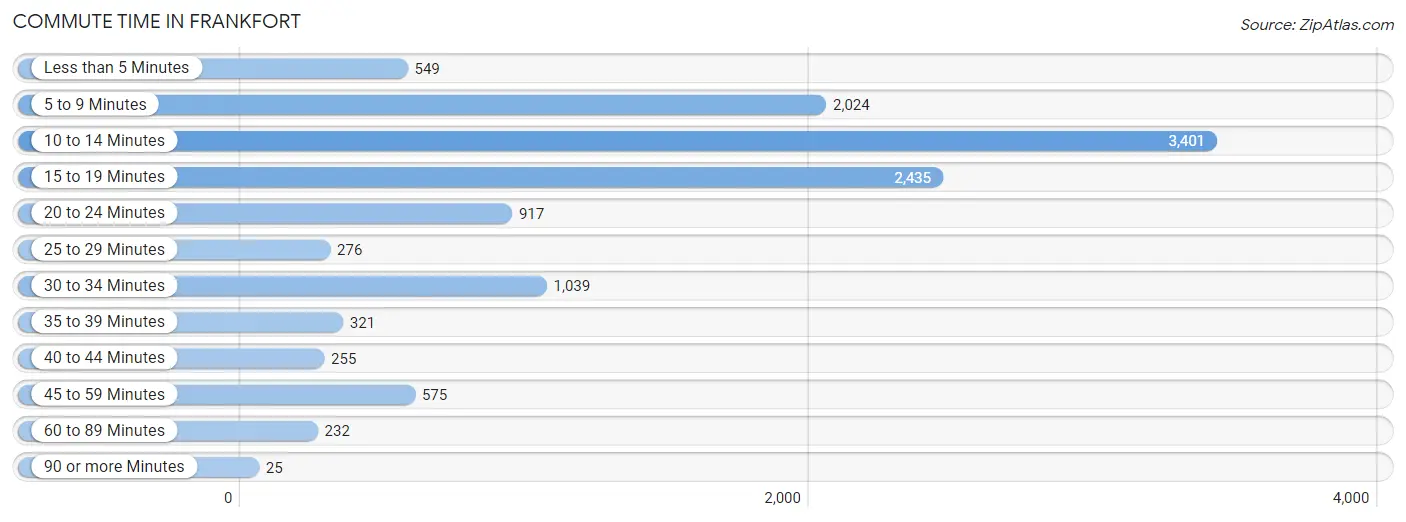
The most frequently occuring commute durations in Frankfort are 10 to 14 minutes (3,401 commuters, 28.2%), 15 to 19 minutes (2,435 commuters, 20.2%), and 5 to 9 minutes (2,024 commuters, 16.8%).
| Commute Time | # Commuters | % Commuters |
| Less than 5 Minutes | 549 | 4.6% |
| 5 to 9 Minutes | 2,024 | 16.8% |
| 10 to 14 Minutes | 3,401 | 28.2% |
| 15 to 19 Minutes | 2,435 | 20.2% |
| 20 to 24 Minutes | 917 | 7.6% |
| 25 to 29 Minutes | 276 | 2.3% |
| 30 to 34 Minutes | 1,039 | 8.6% |
| 35 to 39 Minutes | 321 | 2.7% |
| 40 to 44 Minutes | 255 | 2.1% |
| 45 to 59 Minutes | 575 | 4.8% |
| 60 to 89 Minutes | 232 | 1.9% |
| 90 or more Minutes | 25 | 0.2% |
Commute Time by Sex in Frankfort
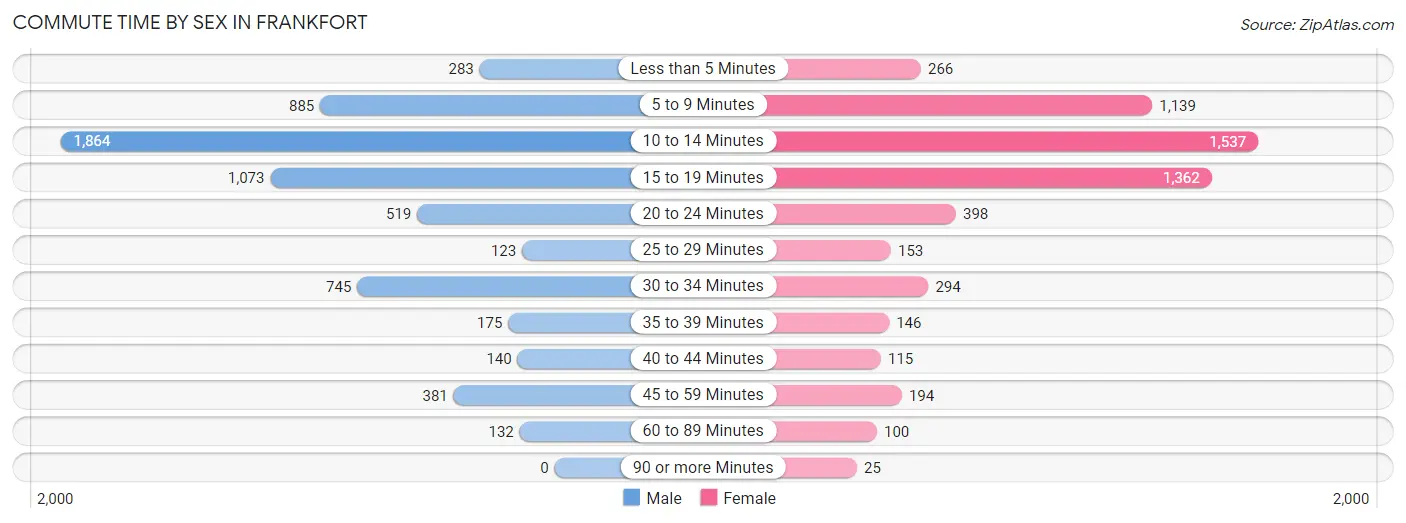
The most common commute times in Frankfort are 10 to 14 minutes (1,864 commuters, 29.5%) for males and 10 to 14 minutes (1,537 commuters, 26.8%) for females.
| Commute Time | Male | Female |
| Less than 5 Minutes | 283 (4.5%) | 266 (4.6%) |
| 5 to 9 Minutes | 885 (14.0%) | 1,139 (19.9%) |
| 10 to 14 Minutes | 1,864 (29.5%) | 1,537 (26.8%) |
| 15 to 19 Minutes | 1,073 (17.0%) | 1,362 (23.8%) |
| 20 to 24 Minutes | 519 (8.2%) | 398 (7.0%) |
| 25 to 29 Minutes | 123 (1.9%) | 153 (2.7%) |
| 30 to 34 Minutes | 745 (11.8%) | 294 (5.1%) |
| 35 to 39 Minutes | 175 (2.8%) | 146 (2.5%) |
| 40 to 44 Minutes | 140 (2.2%) | 115 (2.0%) |
| 45 to 59 Minutes | 381 (6.0%) | 194 (3.4%) |
| 60 to 89 Minutes | 132 (2.1%) | 100 (1.8%) |
| 90 or more Minutes | 0 (0.0%) | 25 (0.4%) |
Time of Departure to Work by Sex in Frankfort
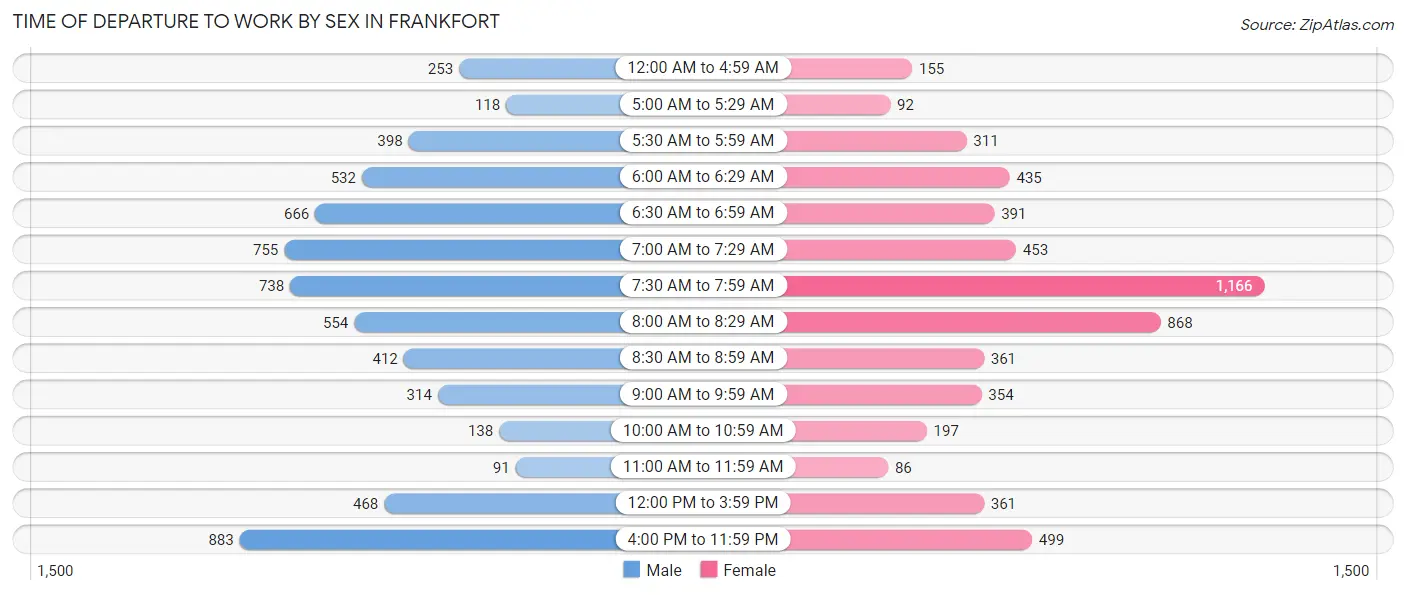
The most frequent times of departure to work in Frankfort are 4:00 PM to 11:59 PM (883, 14.0%) for males and 7:30 AM to 7:59 AM (1,166, 20.3%) for females.
| Time of Departure | Male | Female |
| 12:00 AM to 4:59 AM | 253 (4.0%) | 155 (2.7%) |
| 5:00 AM to 5:29 AM | 118 (1.9%) | 92 (1.6%) |
| 5:30 AM to 5:59 AM | 398 (6.3%) | 311 (5.4%) |
| 6:00 AM to 6:29 AM | 532 (8.4%) | 435 (7.6%) |
| 6:30 AM to 6:59 AM | 666 (10.5%) | 391 (6.8%) |
| 7:00 AM to 7:29 AM | 755 (11.9%) | 453 (7.9%) |
| 7:30 AM to 7:59 AM | 738 (11.7%) | 1,166 (20.3%) |
| 8:00 AM to 8:29 AM | 554 (8.8%) | 868 (15.1%) |
| 8:30 AM to 8:59 AM | 412 (6.5%) | 361 (6.3%) |
| 9:00 AM to 9:59 AM | 314 (5.0%) | 354 (6.2%) |
| 10:00 AM to 10:59 AM | 138 (2.2%) | 197 (3.4%) |
| 11:00 AM to 11:59 AM | 91 (1.4%) | 86 (1.5%) |
| 12:00 PM to 3:59 PM | 468 (7.4%) | 361 (6.3%) |
| 4:00 PM to 11:59 PM | 883 (14.0%) | 499 (8.7%) |
| Total | 6,320 (100.0%) | 5,729 (100.0%) |
Housing Occupancy in Frankfort
Occupancy by Ownership in Frankfort
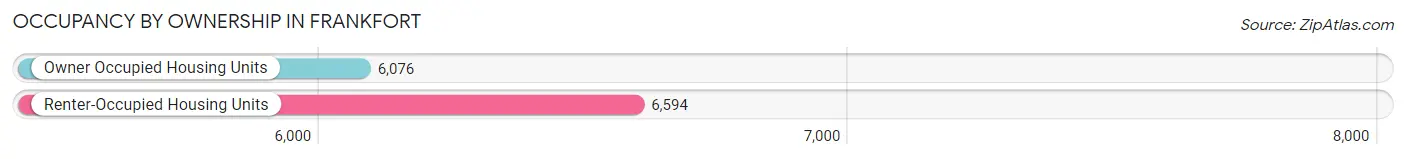
Of the total 12,670 dwellings in Frankfort, owner-occupied units account for 6,076 (48.0%), while renter-occupied units make up 6,594 (52.0%).
| Occupancy | # Housing Units | % Housing Units |
| Owner Occupied Housing Units | 6,076 | 48.0% |
| Renter-Occupied Housing Units | 6,594 | 52.0% |
| Total Occupied Housing Units | 12,670 | 100.0% |
Occupancy by Household Size in Frankfort
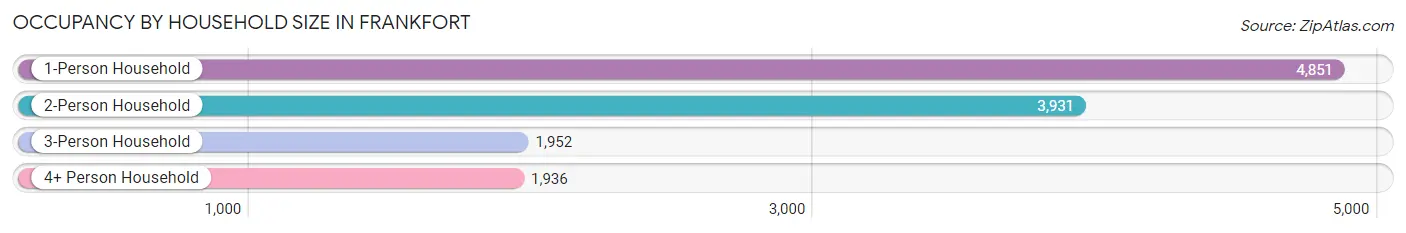
| Household Size | # Housing Units | % Housing Units |
| 1-Person Household | 4,851 | 38.3% |
| 2-Person Household | 3,931 | 31.0% |
| 3-Person Household | 1,952 | 15.4% |
| 4+ Person Household | 1,936 | 15.3% |
| Total Housing Units | 12,670 | 100.0% |
Occupancy by Ownership by Household Size in Frankfort
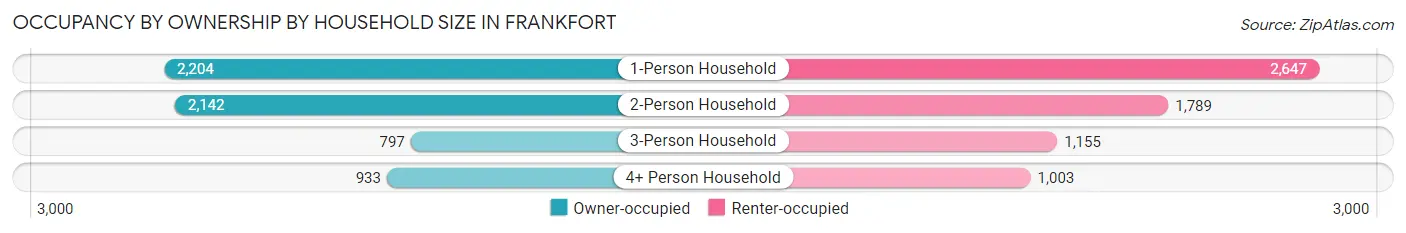
| Household Size | Owner-occupied | Renter-occupied |
| 1-Person Household | 2,204 (45.4%) | 2,647 (54.6%) |
| 2-Person Household | 2,142 (54.5%) | 1,789 (45.5%) |
| 3-Person Household | 797 (40.8%) | 1,155 (59.2%) |
| 4+ Person Household | 933 (48.2%) | 1,003 (51.8%) |
| Total Housing Units | 6,076 (48.0%) | 6,594 (52.0%) |
Occupancy by Educational Attainment in Frankfort
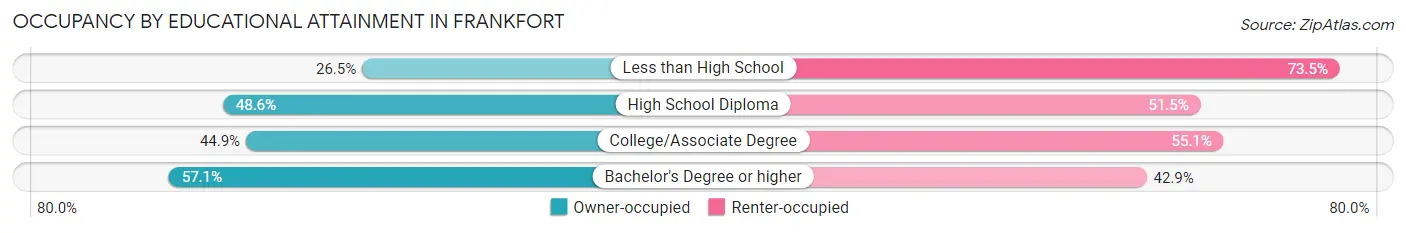
| Household Size | Owner-occupied | Renter-occupied |
| Less than High School | 304 (26.5%) | 844 (73.5%) |
| High School Diploma | 1,793 (48.5%) | 1,900 (51.4%) |
| College/Associate Degree | 1,808 (44.9%) | 2,220 (55.1%) |
| Bachelor's Degree or higher | 2,171 (57.1%) | 1,630 (42.9%) |
Occupancy by Age of Householder in Frankfort
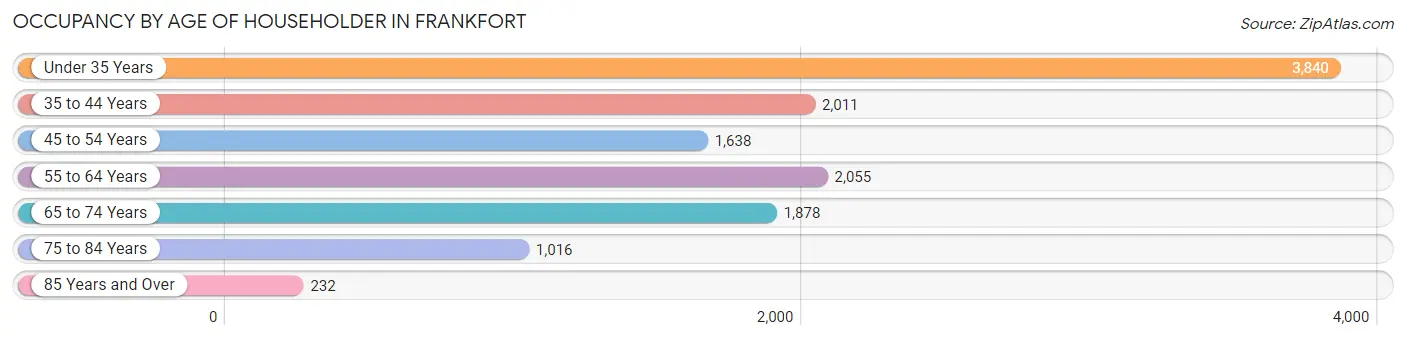
| Age Bracket | # Households | % Households |
| Under 35 Years | 3,840 | 30.3% |
| 35 to 44 Years | 2,011 | 15.9% |
| 45 to 54 Years | 1,638 | 12.9% |
| 55 to 64 Years | 2,055 | 16.2% |
| 65 to 74 Years | 1,878 | 14.8% |
| 75 to 84 Years | 1,016 | 8.0% |
| 85 Years and Over | 232 | 1.8% |
| Total | 12,670 | 100.0% |
Housing Finances in Frankfort
Median Income by Occupancy in Frankfort
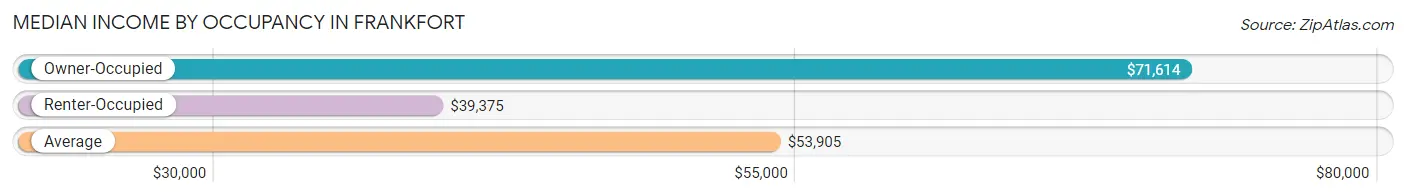
| Occupancy Type | # Households | Median Income |
| Owner-Occupied | 6,076 (48.0%) | $71,614 |
| Renter-Occupied | 6,594 (52.0%) | $39,375 |
| Average | 12,670 (100.0%) | $53,905 |
Occupancy by Householder Income Bracket in Frankfort
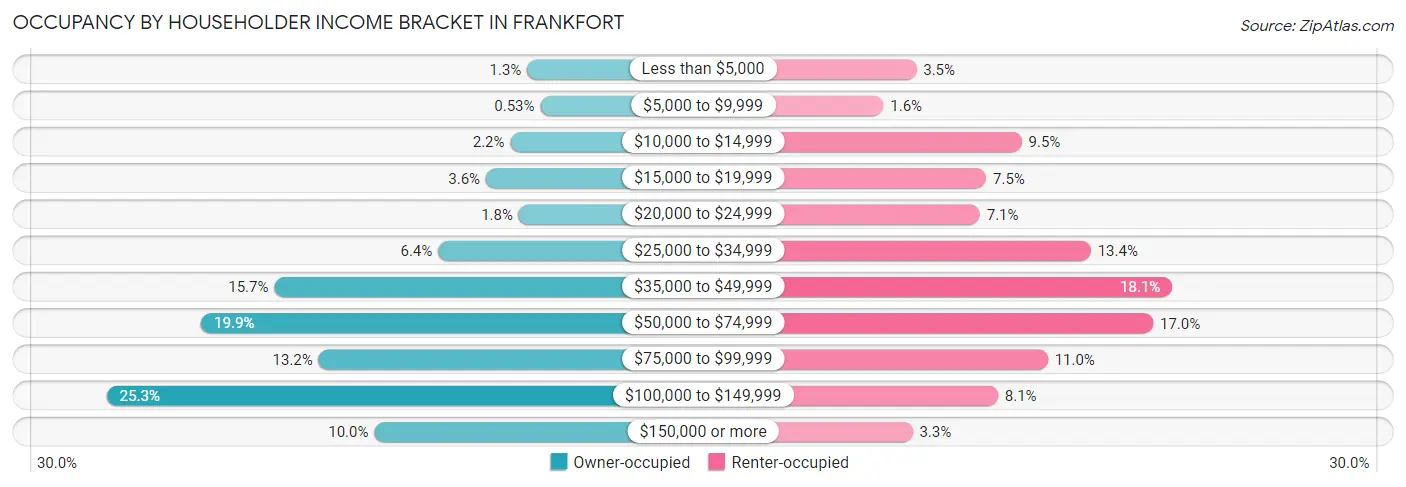
| Income Bracket | Owner-occupied | Renter-occupied |
| Less than $5,000 | 78 (1.3%) | 229 (3.5%) |
| $5,000 to $9,999 | 32 (0.5%) | 105 (1.6%) |
| $10,000 to $14,999 | 136 (2.2%) | 626 (9.5%) |
| $15,000 to $19,999 | 221 (3.6%) | 492 (7.5%) |
| $20,000 to $24,999 | 107 (1.8%) | 468 (7.1%) |
| $25,000 to $34,999 | 387 (6.4%) | 886 (13.4%) |
| $35,000 to $49,999 | 956 (15.7%) | 1,193 (18.1%) |
| $50,000 to $74,999 | 1,210 (19.9%) | 1,121 (17.0%) |
| $75,000 to $99,999 | 802 (13.2%) | 724 (11.0%) |
| $100,000 to $149,999 | 1,538 (25.3%) | 536 (8.1%) |
| $150,000 or more | 609 (10.0%) | 214 (3.3%) |
| Total | 6,076 (100.0%) | 6,594 (100.0%) |
Monthly Housing Cost Tiers in Frankfort
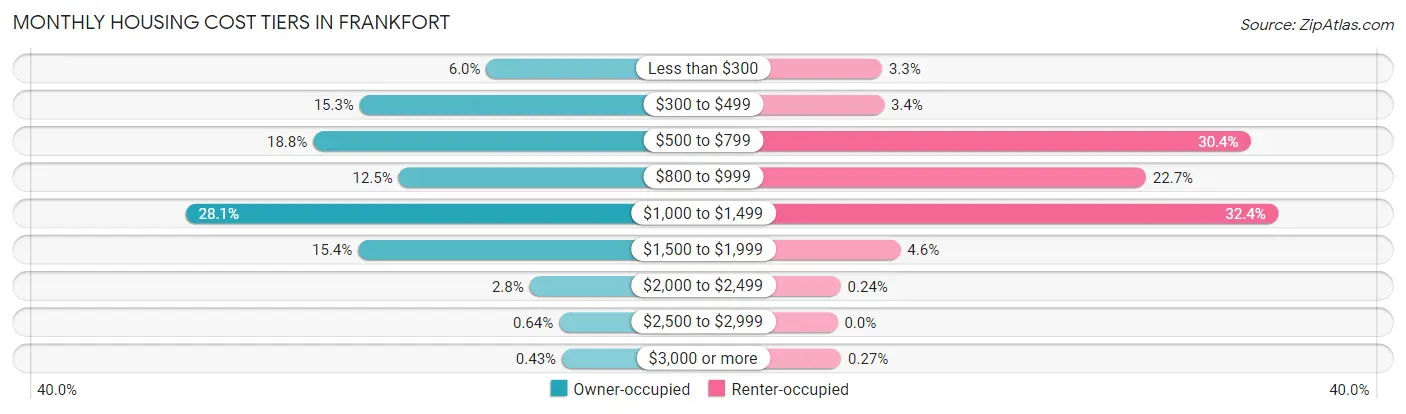
| Monthly Cost | Owner-occupied | Renter-occupied |
| Less than $300 | 364 (6.0%) | 216 (3.3%) |
| $300 to $499 | 931 (15.3%) | 226 (3.4%) |
| $500 to $799 | 1,140 (18.8%) | 2,005 (30.4%) |
| $800 to $999 | 757 (12.5%) | 1,498 (22.7%) |
| $1,000 to $1,499 | 1,710 (28.1%) | 2,138 (32.4%) |
| $1,500 to $1,999 | 938 (15.4%) | 306 (4.6%) |
| $2,000 to $2,499 | 171 (2.8%) | 16 (0.2%) |
| $2,500 to $2,999 | 39 (0.6%) | 0 (0.0%) |
| $3,000 or more | 26 (0.4%) | 18 (0.3%) |
| Total | 6,076 (100.0%) | 6,594 (100.0%) |
Physical Housing Characteristics in Frankfort
Housing Structures in Frankfort
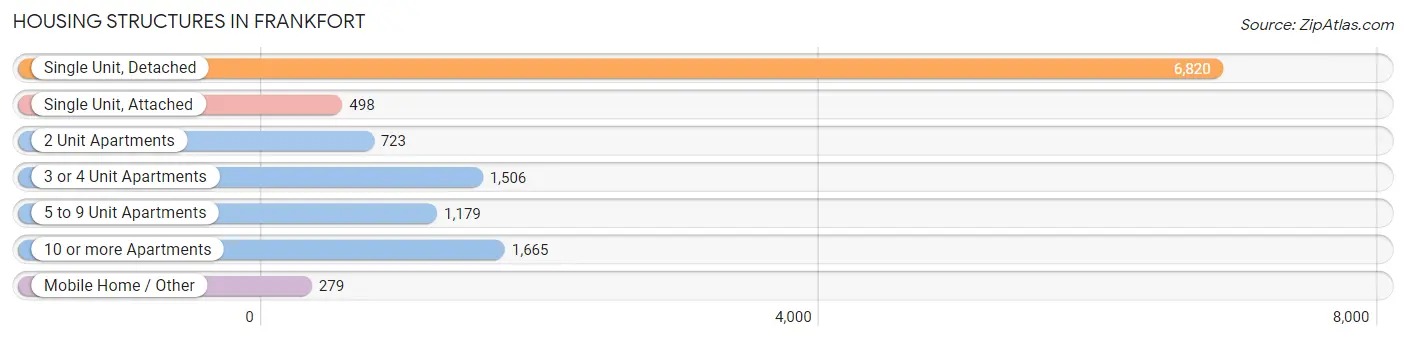
| Structure Type | # Housing Units | % Housing Units |
| Single Unit, Detached | 6,820 | 53.8% |
| Single Unit, Attached | 498 | 3.9% |
| 2 Unit Apartments | 723 | 5.7% |
| 3 or 4 Unit Apartments | 1,506 | 11.9% |
| 5 to 9 Unit Apartments | 1,179 | 9.3% |
| 10 or more Apartments | 1,665 | 13.1% |
| Mobile Home / Other | 279 | 2.2% |
| Total | 12,670 | 100.0% |
Housing Structures by Occupancy in Frankfort
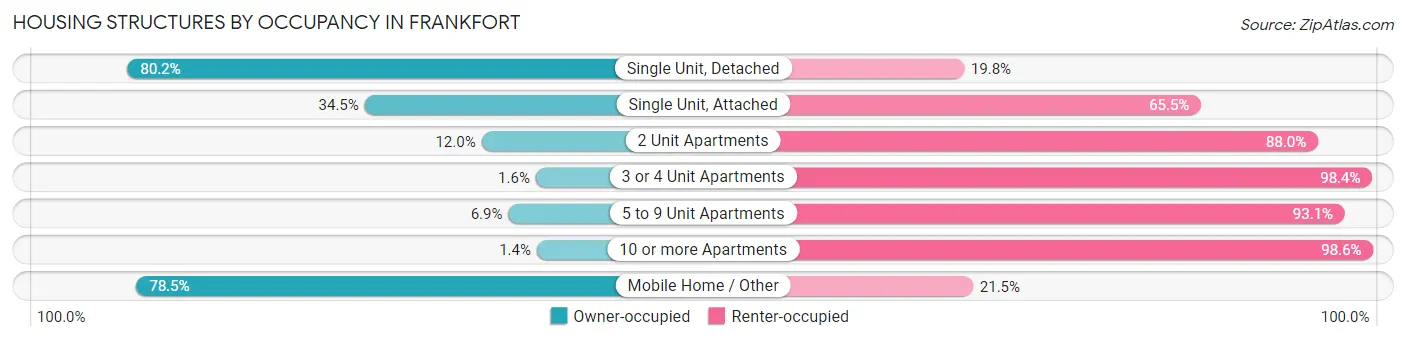
| Structure Type | Owner-occupied | Renter-occupied |
| Single Unit, Detached | 5,470 (80.2%) | 1,350 (19.8%) |
| Single Unit, Attached | 172 (34.5%) | 326 (65.5%) |
| 2 Unit Apartments | 87 (12.0%) | 636 (88.0%) |
| 3 or 4 Unit Apartments | 24 (1.6%) | 1,482 (98.4%) |
| 5 to 9 Unit Apartments | 81 (6.9%) | 1,098 (93.1%) |
| 10 or more Apartments | 23 (1.4%) | 1,642 (98.6%) |
| Mobile Home / Other | 219 (78.5%) | 60 (21.5%) |
| Total | 6,076 (48.0%) | 6,594 (52.0%) |
Housing Structures by Number of Rooms in Frankfort
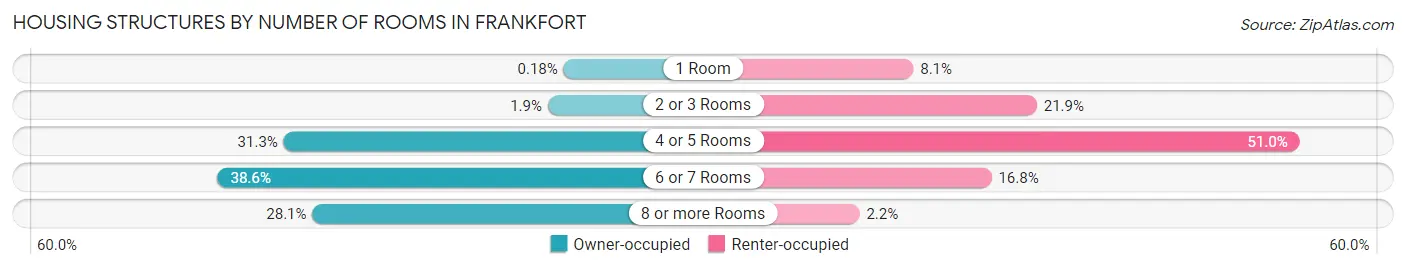
| Number of Rooms | Owner-occupied | Renter-occupied |
| 1 Room | 11 (0.2%) | 537 (8.1%) |
| 2 or 3 Rooms | 117 (1.9%) | 1,441 (21.8%) |
| 4 or 5 Rooms | 1,899 (31.2%) | 3,364 (51.0%) |
| 6 or 7 Rooms | 2,344 (38.6%) | 1,109 (16.8%) |
| 8 or more Rooms | 1,705 (28.1%) | 143 (2.2%) |
| Total | 6,076 (100.0%) | 6,594 (100.0%) |
Housing Structure by Heating Type in Frankfort
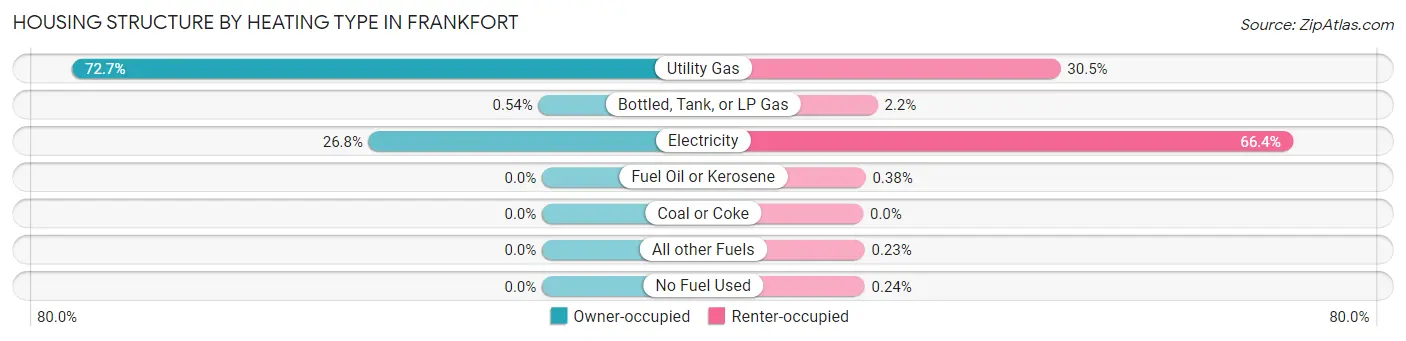
| Heating Type | Owner-occupied | Renter-occupied |
| Utility Gas | 4,415 (72.7%) | 2,012 (30.5%) |
| Bottled, Tank, or LP Gas | 33 (0.5%) | 148 (2.2%) |
| Electricity | 1,628 (26.8%) | 4,378 (66.4%) |
| Fuel Oil or Kerosene | 0 (0.0%) | 25 (0.4%) |
| Coal or Coke | 0 (0.0%) | 0 (0.0%) |
| All other Fuels | 0 (0.0%) | 15 (0.2%) |
| No Fuel Used | 0 (0.0%) | 16 (0.2%) |
| Total | 6,076 (100.0%) | 6,594 (100.0%) |
Household Vehicle Usage in Frankfort
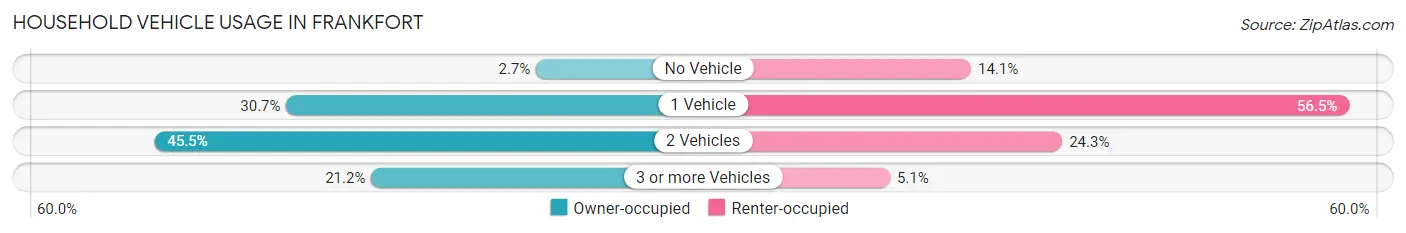
| Vehicles per Household | Owner-occupied | Renter-occupied |
| No Vehicle | 164 (2.7%) | 932 (14.1%) |
| 1 Vehicle | 1,864 (30.7%) | 3,724 (56.5%) |
| 2 Vehicles | 2,762 (45.5%) | 1,605 (24.3%) |
| 3 or more Vehicles | 1,286 (21.2%) | 333 (5.1%) |
| Total | 6,076 (100.0%) | 6,594 (100.0%) |
Real Estate & Mortgages in Frankfort
Real Estate and Mortgage Overview in Frankfort
| Characteristic | Without Mortgage | With Mortgage |
| Housing Units | 2,057 | 4,019 |
| Median Property Value | $151,000 | $160,200 |
| Median Household Income | $66,811 | $409 |
| Monthly Housing Costs | $451 | $26 |
| Real Estate Taxes | $1,226 | $73 |
Property Value by Mortgage Status in Frankfort
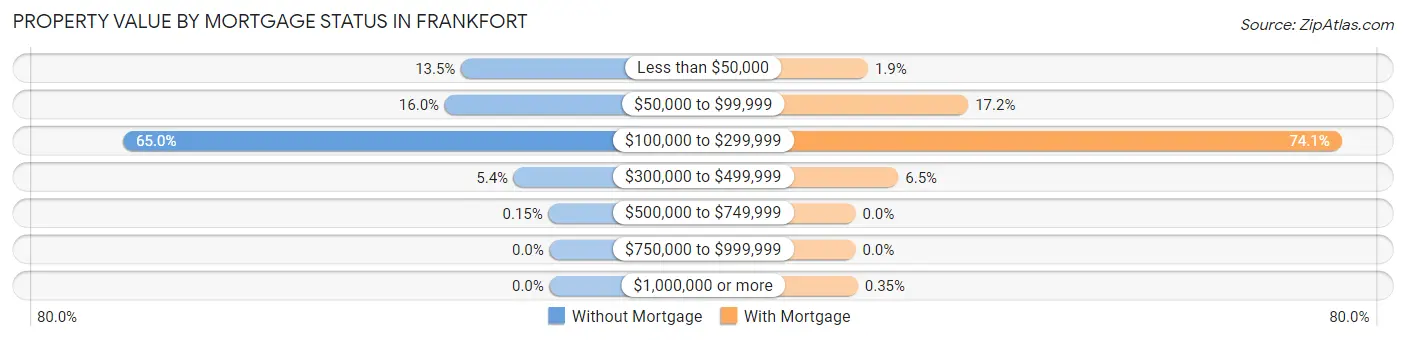
| Property Value | Without Mortgage | With Mortgage |
| Less than $50,000 | 277 (13.5%) | 76 (1.9%) |
| $50,000 to $99,999 | 328 (16.0%) | 690 (17.2%) |
| $100,000 to $299,999 | 1,337 (65.0%) | 2,977 (74.1%) |
| $300,000 to $499,999 | 112 (5.4%) | 262 (6.5%) |
| $500,000 to $749,999 | 3 (0.2%) | 0 (0.0%) |
| $750,000 to $999,999 | 0 (0.0%) | 0 (0.0%) |
| $1,000,000 or more | 0 (0.0%) | 14 (0.4%) |
| Total | 2,057 (100.0%) | 4,019 (100.0%) |
Household Income by Mortgage Status in Frankfort
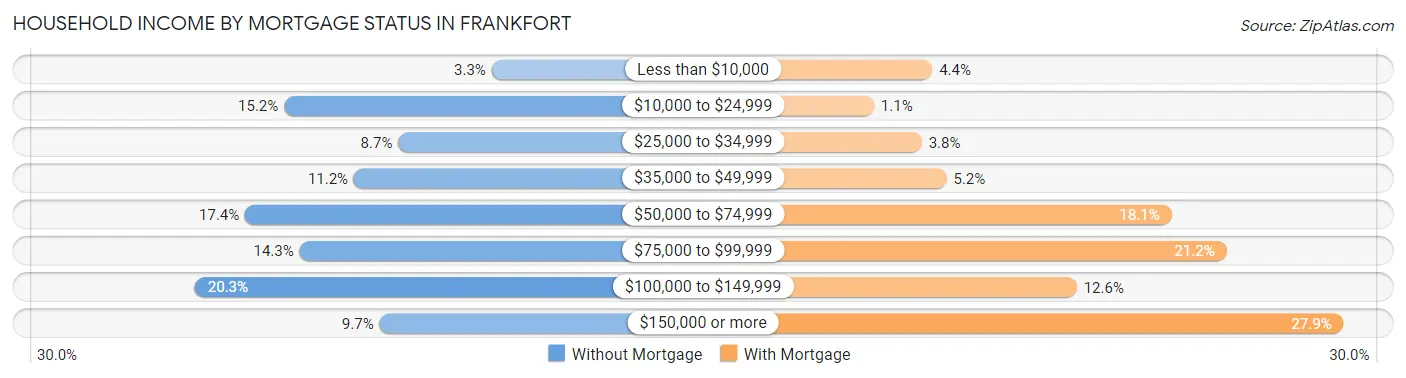
| Household Income | Without Mortgage | With Mortgage |
| Less than $10,000 | 68 (3.3%) | 176 (4.4%) |
| $10,000 to $24,999 | 312 (15.2%) | 42 (1.1%) |
| $25,000 to $34,999 | 178 (8.6%) | 152 (3.8%) |
| $35,000 to $49,999 | 230 (11.2%) | 209 (5.2%) |
| $50,000 to $74,999 | 358 (17.4%) | 726 (18.1%) |
| $75,000 to $99,999 | 294 (14.3%) | 852 (21.2%) |
| $100,000 to $149,999 | 417 (20.3%) | 508 (12.6%) |
| $150,000 or more | 200 (9.7%) | 1,121 (27.9%) |
| Total | 2,057 (100.0%) | 4,019 (100.0%) |
Property Value to Household Income Ratio in Frankfort
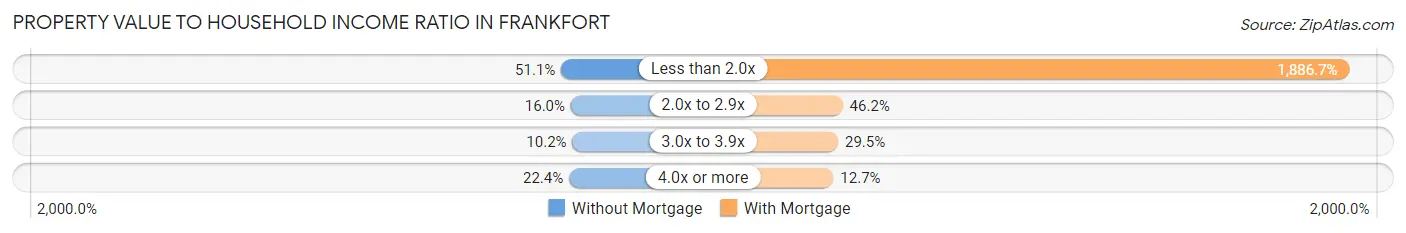
| Value-to-Income Ratio | Without Mortgage | With Mortgage |
| Less than 2.0x | 1,050 (51.0%) | 75,828 (1,886.7%) |
| 2.0x to 2.9x | 328 (16.0%) | 1,858 (46.2%) |
| 3.0x to 3.9x | 209 (10.2%) | 1,184 (29.5%) |
| 4.0x or more | 461 (22.4%) | 509 (12.7%) |
| Total | 2,057 (100.0%) | 4,019 (100.0%) |
Real Estate Taxes by Mortgage Status in Frankfort
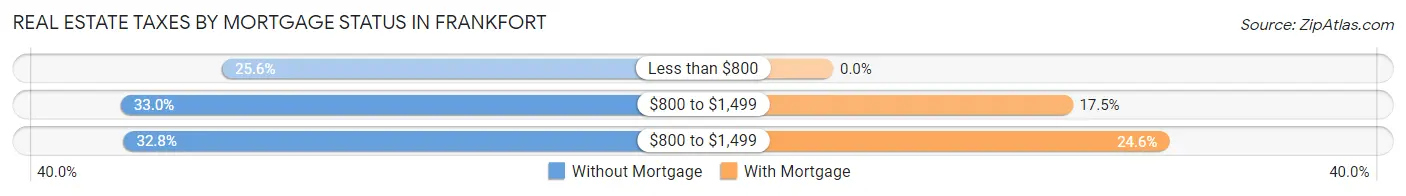
| Property Taxes | Without Mortgage | With Mortgage |
| Less than $800 | 526 (25.6%) | 0 (0.0%) |
| $800 to $1,499 | 678 (33.0%) | 703 (17.5%) |
| $800 to $1,499 | 674 (32.8%) | 987 (24.6%) |
| Total | 2,057 (100.0%) | 4,019 (100.0%) |
Health & Disability in Frankfort
Health Insurance Coverage by Age in Frankfort
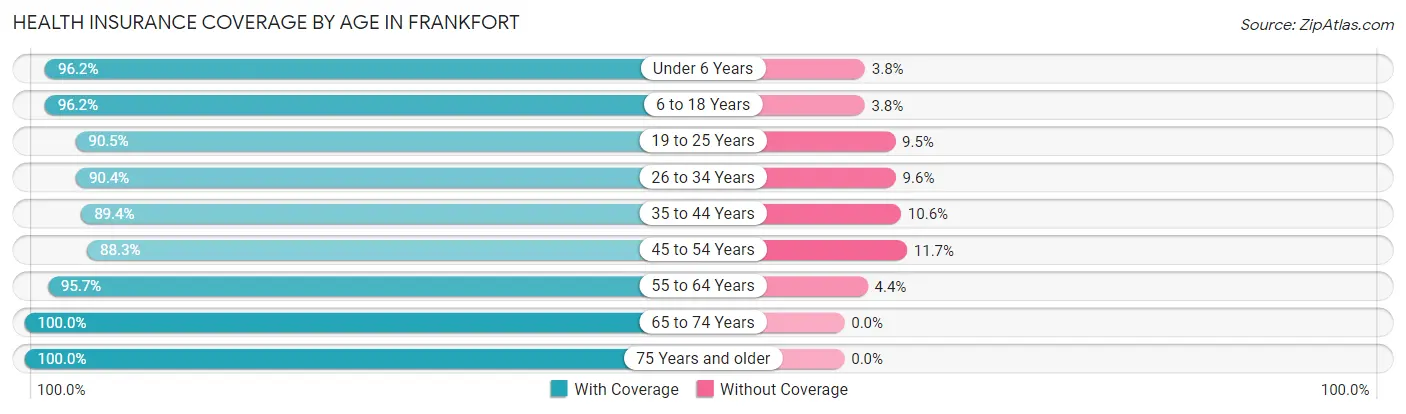
| Age Bracket | With Coverage | Without Coverage |
| Under 6 Years | 2,211 (96.2%) | 88 (3.8%) |
| 6 to 18 Years | 4,600 (96.2%) | 180 (3.8%) |
| 19 to 25 Years | 2,791 (90.5%) | 292 (9.5%) |
| 26 to 34 Years | 3,945 (90.4%) | 418 (9.6%) |
| 35 to 44 Years | 2,847 (89.4%) | 336 (10.6%) |
| 45 to 54 Years | 2,468 (88.3%) | 326 (11.7%) |
| 55 to 64 Years | 3,056 (95.7%) | 139 (4.3%) |
| 65 to 74 Years | 2,703 (100.0%) | 0 (0.0%) |
| 75 Years and older | 1,577 (100.0%) | 0 (0.0%) |
| Total | 26,198 (93.6%) | 1,779 (6.4%) |
Health Insurance Coverage by Citizenship Status in Frankfort
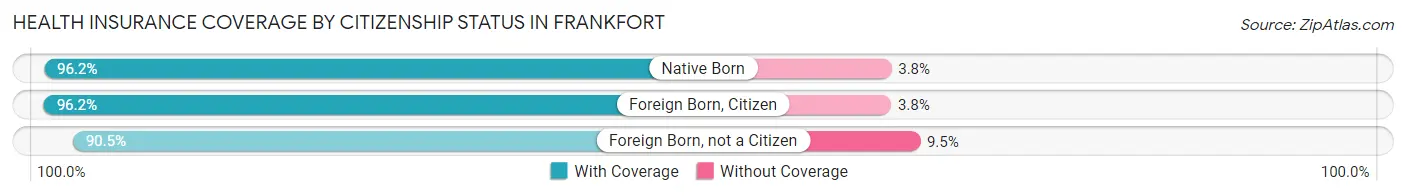
| Citizenship Status | With Coverage | Without Coverage |
| Native Born | 2,211 (96.2%) | 88 (3.8%) |
| Foreign Born, Citizen | 4,600 (96.2%) | 180 (3.8%) |
| Foreign Born, not a Citizen | 2,791 (90.5%) | 292 (9.5%) |
Health Insurance Coverage by Household Income in Frankfort
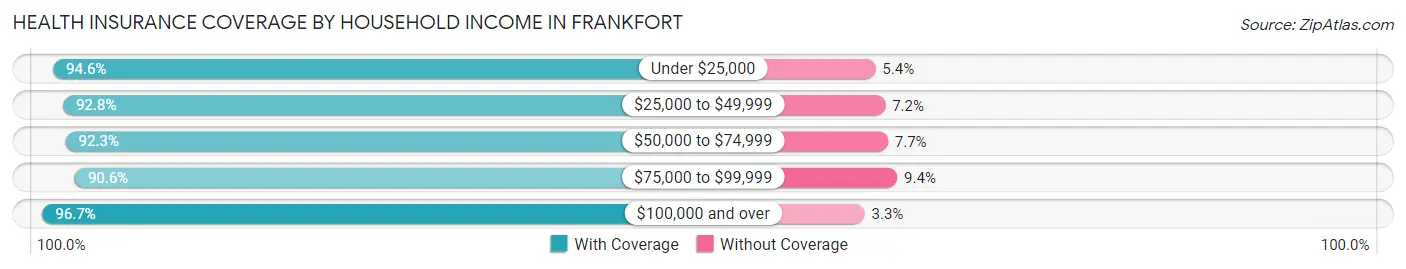
| Household Income | With Coverage | Without Coverage |
| Under $25,000 | 3,831 (94.6%) | 217 (5.4%) |
| $25,000 to $49,999 | 6,159 (92.8%) | 478 (7.2%) |
| $50,000 to $74,999 | 4,716 (92.3%) | 393 (7.7%) |
| $75,000 to $99,999 | 3,589 (90.6%) | 374 (9.4%) |
| $100,000 and over | 7,113 (96.7%) | 246 (3.3%) |
Public vs Private Health Insurance Coverage by Age in Frankfort
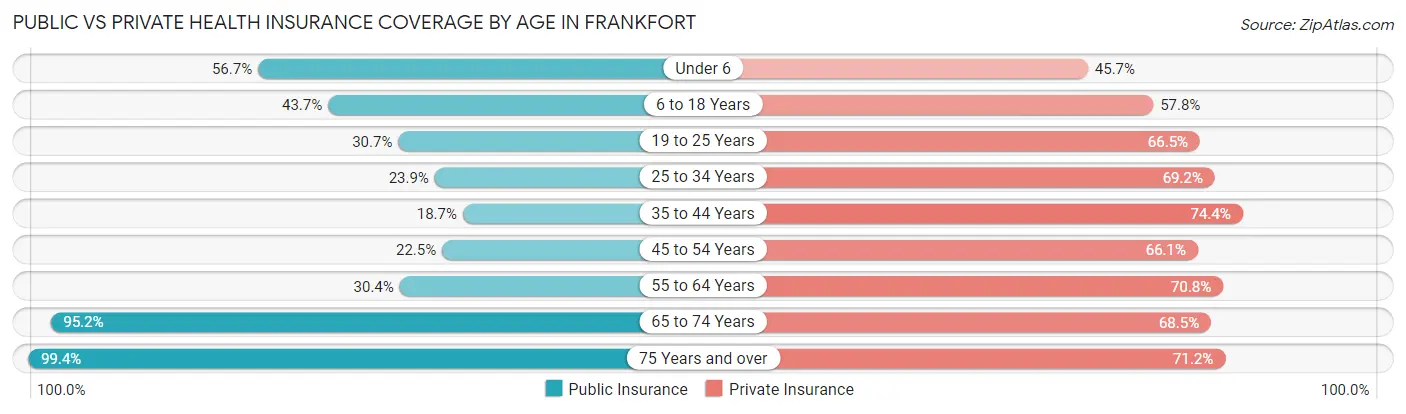
| Age Bracket | Public Insurance | Private Insurance |
| Under 6 | 1,303 (56.7%) | 1,050 (45.7%) |
| 6 to 18 Years | 2,088 (43.7%) | 2,763 (57.8%) |
| 19 to 25 Years | 945 (30.6%) | 2,049 (66.5%) |
| 25 to 34 Years | 1,042 (23.9%) | 3,020 (69.2%) |
| 35 to 44 Years | 594 (18.7%) | 2,368 (74.4%) |
| 45 to 54 Years | 629 (22.5%) | 1,846 (66.1%) |
| 55 to 64 Years | 971 (30.4%) | 2,261 (70.8%) |
| 65 to 74 Years | 2,574 (95.2%) | 1,852 (68.5%) |
| 75 Years and over | 1,567 (99.4%) | 1,122 (71.2%) |
| Total | 11,713 (41.9%) | 18,331 (65.5%) |
Disability Status by Sex by Age in Frankfort
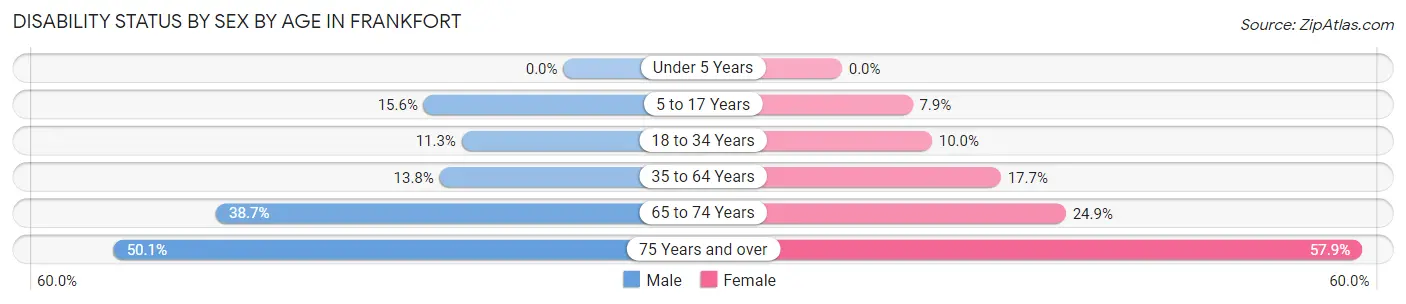
| Age Bracket | Male | Female |
| Under 5 Years | 0 (0.0%) | 0 (0.0%) |
| 5 to 17 Years | 359 (15.5%) | 198 (7.9%) |
| 18 to 34 Years | 422 (11.3%) | 404 (10.0%) |
| 35 to 64 Years | 631 (13.8%) | 813 (17.7%) |
| 65 to 74 Years | 397 (38.7%) | 418 (24.9%) |
| 75 Years and over | 373 (50.1%) | 482 (57.9%) |
Disability Class by Sex by Age in Frankfort
Disability Class: Hearing Difficulty
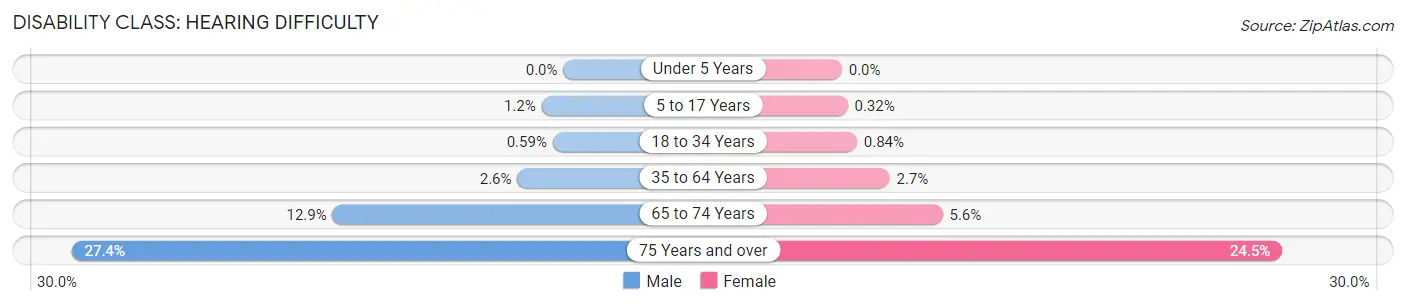
| Age Bracket | Male | Female |
| Under 5 Years | 0 (0.0%) | 0 (0.0%) |
| 5 to 17 Years | 28 (1.2%) | 8 (0.3%) |
| 18 to 34 Years | 22 (0.6%) | 34 (0.8%) |
| 35 to 64 Years | 117 (2.6%) | 122 (2.7%) |
| 65 to 74 Years | 132 (12.9%) | 94 (5.6%) |
| 75 Years and over | 204 (27.4%) | 204 (24.5%) |
Disability Class: Vision Difficulty
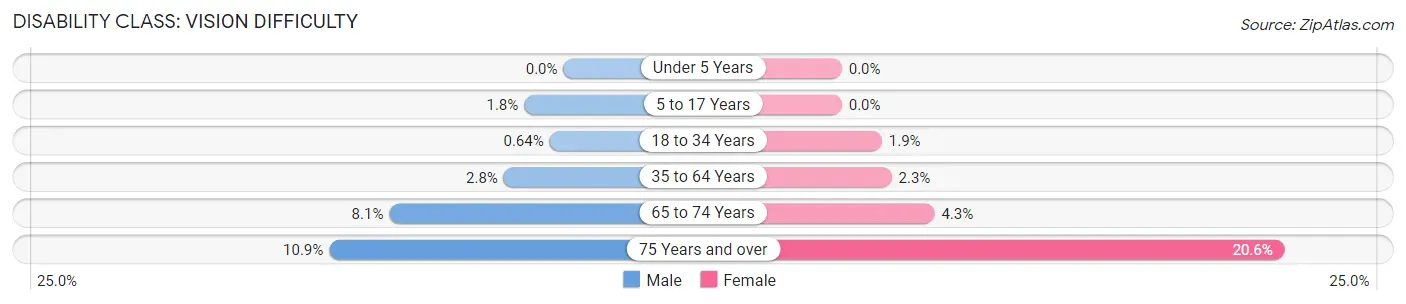
| Age Bracket | Male | Female |
| Under 5 Years | 0 (0.0%) | 0 (0.0%) |
| 5 to 17 Years | 42 (1.8%) | 0 (0.0%) |
| 18 to 34 Years | 24 (0.6%) | 75 (1.9%) |
| 35 to 64 Years | 127 (2.8%) | 106 (2.3%) |
| 65 to 74 Years | 83 (8.1%) | 72 (4.3%) |
| 75 Years and over | 81 (10.9%) | 171 (20.5%) |
Disability Class: Cognitive Difficulty
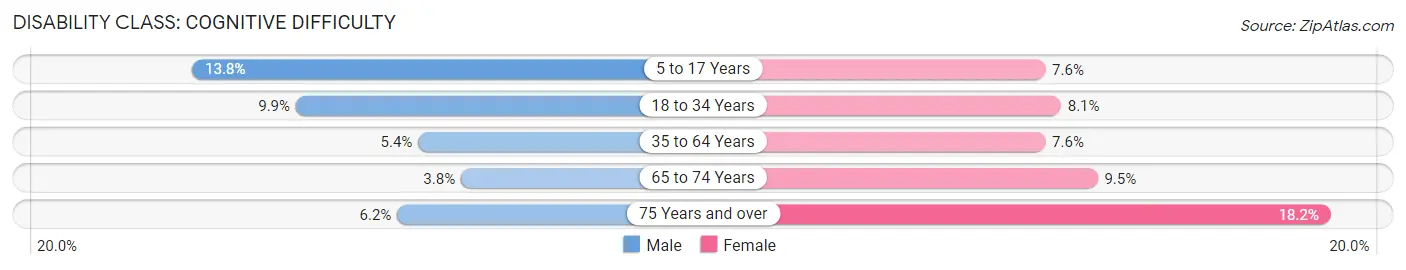
| Age Bracket | Male | Female |
| 5 to 17 Years | 318 (13.8%) | 190 (7.5%) |
| 18 to 34 Years | 370 (9.9%) | 328 (8.1%) |
| 35 to 64 Years | 247 (5.4%) | 347 (7.5%) |
| 65 to 74 Years | 39 (3.8%) | 159 (9.5%) |
| 75 Years and over | 46 (6.2%) | 151 (18.1%) |
Disability Class: Ambulatory Difficulty
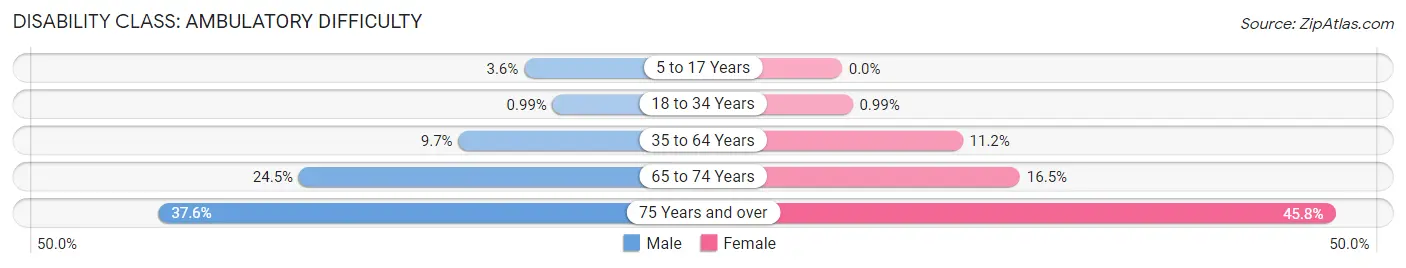
| Age Bracket | Male | Female |
| 5 to 17 Years | 84 (3.6%) | 0 (0.0%) |
| 18 to 34 Years | 37 (1.0%) | 40 (1.0%) |
| 35 to 64 Years | 446 (9.7%) | 515 (11.2%) |
| 65 to 74 Years | 252 (24.5%) | 277 (16.5%) |
| 75 Years and over | 280 (37.6%) | 381 (45.8%) |
Disability Class: Self-Care Difficulty
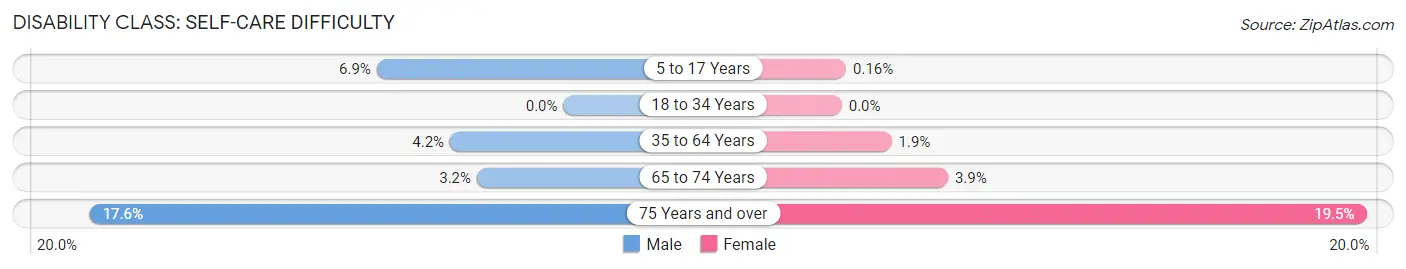
| Age Bracket | Male | Female |
| 5 to 17 Years | 160 (6.9%) | 4 (0.2%) |
| 18 to 34 Years | 0 (0.0%) | 0 (0.0%) |
| 35 to 64 Years | 193 (4.2%) | 85 (1.8%) |
| 65 to 74 Years | 33 (3.2%) | 66 (3.9%) |
| 75 Years and over | 131 (17.6%) | 162 (19.5%) |
Technology Access in Frankfort
Computing Device Access in Frankfort
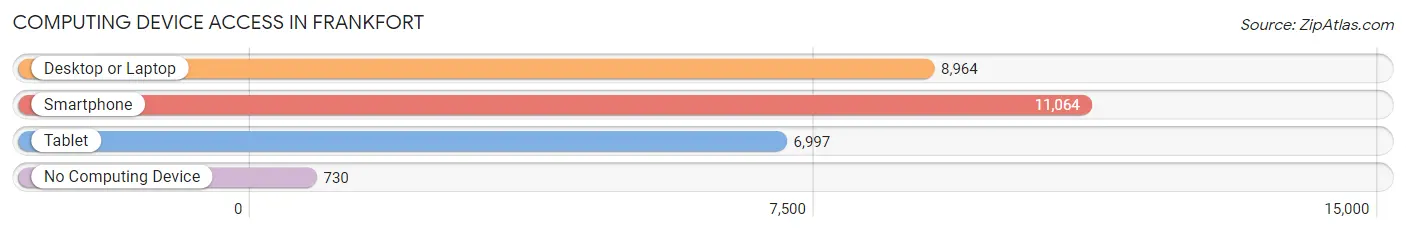
| Device Type | # Households | % Households |
| Desktop or Laptop | 8,964 | 70.8% |
| Smartphone | 11,064 | 87.3% |
| Tablet | 6,997 | 55.2% |
| No Computing Device | 730 | 5.8% |
| Total | 12,670 | 100.0% |
Internet Access in Frankfort
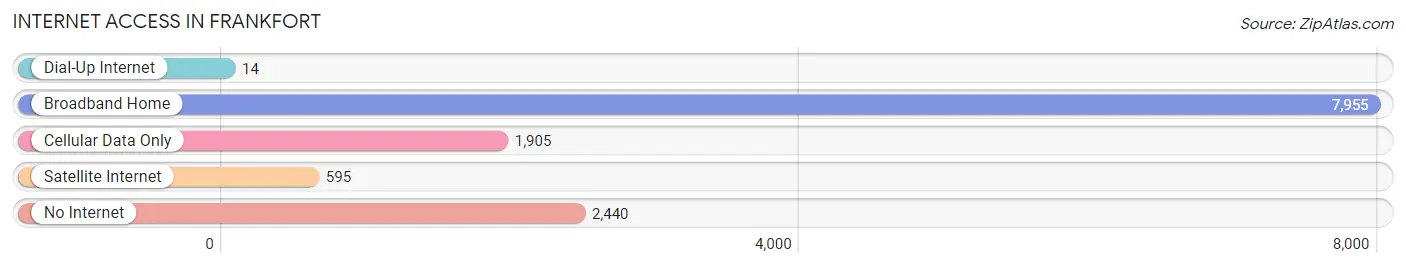
| Internet Type | # Households | % Households |
| Dial-Up Internet | 14 | 0.1% |
| Broadband Home | 7,955 | 62.8% |
| Cellular Data Only | 1,905 | 15.0% |
| Satellite Internet | 595 | 4.7% |
| No Internet | 2,440 | 19.3% |
| Total | 12,670 | 100.0% |
Frankfort Summary
Frankfort, Kentucky is the capital of the Commonwealth of Kentucky and is located in the heart of the state. It is situated on the banks of the Kentucky River and is the seat of Franklin County. The city has a population of 25,527 according to the 2010 census and is the fifth-largest city in the state.
History
Frankfort was founded in 1786 by a group of settlers led by General James Wilkinson. The city was named after Benjamin Franklin, who was a major influence in the founding of the city. The city was originally a trading post and was the site of the first state capital of Kentucky. The city was also the site of the first state constitution in 1792.
In the 19th century, Frankfort became an important center for the tobacco industry. The city was also the site of the first railroad in the state, which connected the city to Louisville. The city was also the site of the first state university, Transylvania University, which was founded in 1780.
Geography
Frankfort is located in the central part of the state, in the Bluegrass region. The city is situated on the banks of the Kentucky River and is surrounded by rolling hills and forests. The city has a total area of 8.3 square miles, of which 8.2 square miles is land and 0.1 square miles is water.
The climate in Frankfort is humid subtropical, with hot, humid summers and mild winters. The average temperature in the summer is around 80 degrees Fahrenheit, while the average temperature in the winter is around 40 degrees Fahrenheit.
Economy
Frankfort is the seat of government for the state of Kentucky and is home to many state government offices and agencies. The city is also home to several large companies, including Brown-Forman, a producer of alcoholic beverages, and the Kentucky State University.
The city is also home to several large manufacturing companies, including Toyota Motor Manufacturing Kentucky, which produces the Toyota Camry and the Toyota Avalon. The city is also home to several large healthcare companies, including Humana and Baptist Health.
Demographics
According to the 2010 census, the population of Frankfort was 25,527. The racial makeup of the city was 79.2% White, 15.3% African American, 0.3% Native American, 1.2% Asian, 0.1% Pacific Islander, 1.7% from other races, and 2.4% from two or more races. Hispanic or Latino of any race were 4.2% of the population.
The median income for a household in the city was $41,945, and the median income for a family was $50,945. The per capita income for the city was $22,945. About 11.2% of families and 14.3% of the population were below the poverty line, including 19.2% of those under age 18 and 8.7% of those age 65 or over.
Frankfort is a diverse city with a rich history and a vibrant economy. The city is home to many state government offices and agencies, as well as several large companies. The city is also home to a diverse population, with a variety of racial and ethnic backgrounds. The city is a great place to live, work, and visit.
Common Questions
What is Per Capita Income in Frankfort?
Per Capita income in Frankfort is $33,386.
What is the Median Family Income in Frankfort?
Median Family Income in Frankfort is $65,108.
What is the Median Household income in Frankfort?
Median Household Income in Frankfort is $53,905.
What is Income or Wage Gap in Frankfort?
Income or Wage Gap in Frankfort is 16.6%.
Women in Frankfort earn 83.4 cents for every dollar earned by a man.
What is Family Income Deficit in Frankfort?
Family Income Deficit in Frankfort is $13,458.
Families that are below poverty line in Frankfort earn $13,458 less on average than the poverty threshold level.
What is Inequality or Gini Index in Frankfort?
Inequality or Gini Index in Frankfort is 0.46.
What is the Total Population of Frankfort?
Total Population of Frankfort is 28,460.
What is the Total Male Population of Frankfort?
Total Male Population of Frankfort is 13,729.
What is the Total Female Population of Frankfort?
Total Female Population of Frankfort is 14,731.
What is the Ratio of Males per 100 Females in Frankfort?
There are 93.20 Males per 100 Females in Frankfort.
What is the Ratio of Females per 100 Males in Frankfort?
There are 107.30 Females per 100 Males in Frankfort.
What is the Median Population Age in Frankfort?
Median Population Age in Frankfort is 34.2 Years.
What is the Average Family Size in Frankfort
Average Family Size in Frankfort is 2.8 People.
What is the Average Household Size in Frankfort
Average Household Size in Frankfort is 2.1 People.
How Large is the Labor Force in Frankfort?
There are 14,052 People in the Labor Forcein in Frankfort.
What is the Percentage of People in the Labor Force in Frankfort?
62.8% of People are in the Labor Force in Frankfort.
What is the Unemployment Rate in Frankfort?
Unemployment Rate in Frankfort is 5.4%.