El Portal, CA Map & Demographics
El Portal Map
El Portal Overview
$42,990
PER CAPITA INCOME
$143,669
AVG FAMILY INCOME
$51,786
AVG HOUSEHOLD INCOME
37.3%
WAGE / INCOME GAP [ % ]
62.7¢/ $1
WAGE / INCOME GAP [ $ ]
0.33
INEQUALITY / GINI INDEX
479
TOTAL POPULATION
133
MALE POPULATION
346
FEMALE POPULATION
38.44
MALES / 100 FEMALES
260.15
FEMALES / 100 MALES
36.6
MEDIAN AGE
4.4
AVG FAMILY SIZE
2.0
AVG HOUSEHOLD SIZE
299
LABOR FORCE [ PEOPLE ]
83.5%
PERCENT IN LABOR FORCE
El Portal Zip Codes
Income in El Portal
Income Overview in El Portal
Per Capita Income in El Portal is $42,990, while median incomes of families and households are $143,669 and $51,786 respectively.
| Characteristic | Number | Measure |
| Per Capita Income | 479 | $42,990 |
| Median Family Income | 57 | $143,669 |
| Mean Family Income | 57 | $136,470 |
| Median Household Income | 240 | $51,786 |
| Mean Household Income | 240 | $75,321 |
| Income Deficit | 57 | $0 |
| Wage / Income Gap (%) | 479 | 37.35% |
| Wage / Income Gap ($) | 479 | 62.65¢ per $1 |
| Gini / Inequality Index | 479 | 0.33 |
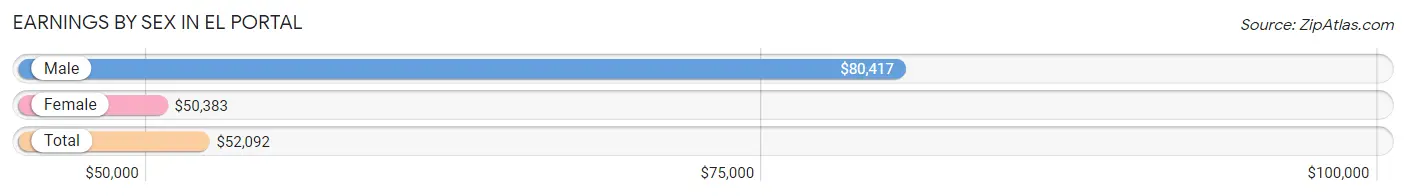
Earnings by Sex in El Portal
Average Earnings in El Portal are $52,092, $80,417 for men and $50,383 for women, a difference of 37.3%.
| Sex | Number | Average Earnings |
| Male | 89 (26.0%) | $80,417 |
| Female | 253 (74.0%) | $50,383 |
| Total | 342 (100.0%) | $52,092 |
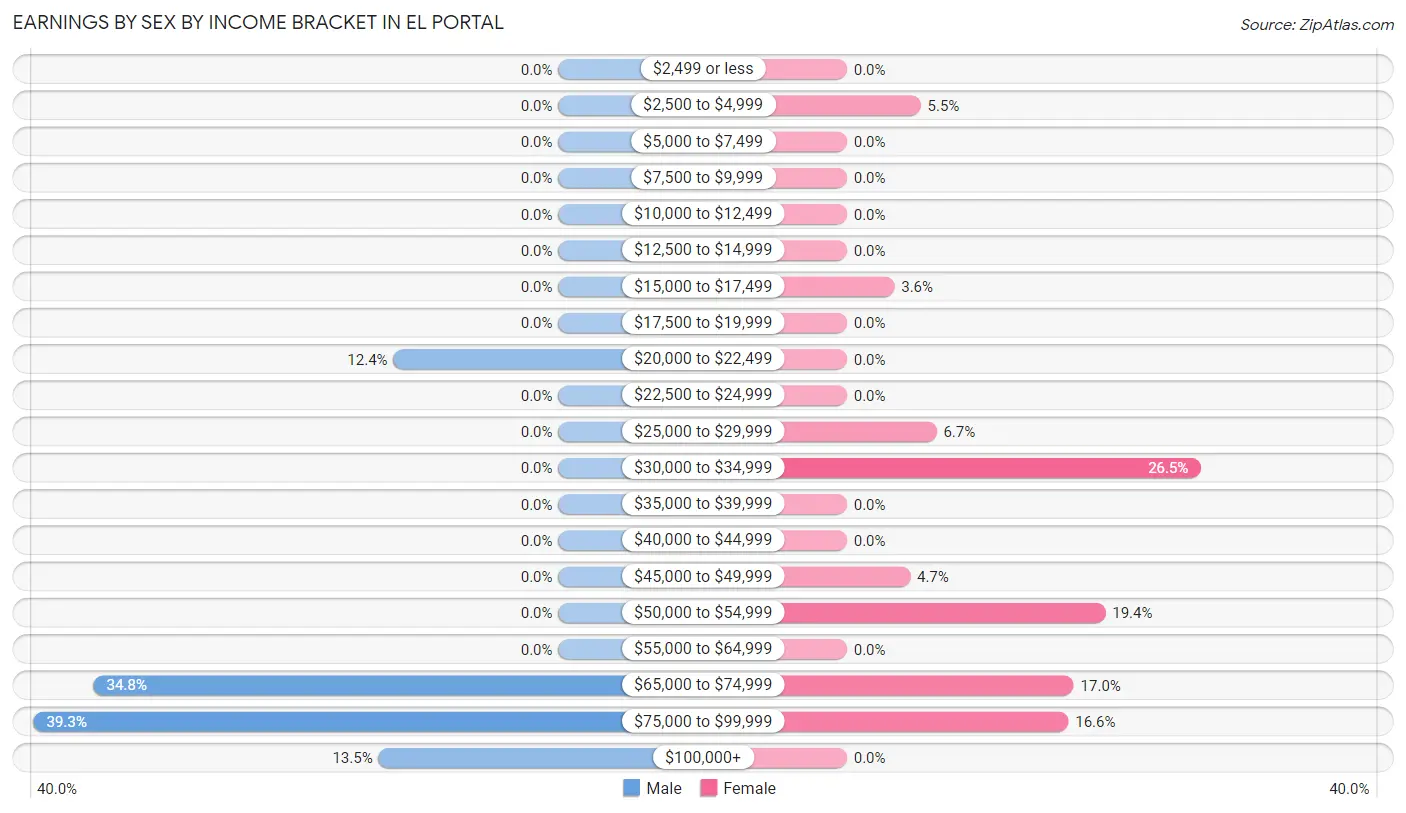
Earnings by Sex by Income Bracket in El Portal
The most common earnings brackets in El Portal are $75,000 to $99,999 for men (35 | 39.3%) and $30,000 to $34,999 for women (67 | 26.5%).
| Income | Male | Female |
| $2,499 or less | 0 (0.0%) | 0 (0.0%) |
| $2,500 to $4,999 | 0 (0.0%) | 14 (5.5%) |
| $5,000 to $7,499 | 0 (0.0%) | 0 (0.0%) |
| $7,500 to $9,999 | 0 (0.0%) | 0 (0.0%) |
| $10,000 to $12,499 | 0 (0.0%) | 0 (0.0%) |
| $12,500 to $14,999 | 0 (0.0%) | 0 (0.0%) |
| $15,000 to $17,499 | 0 (0.0%) | 9 (3.6%) |
| $17,500 to $19,999 | 0 (0.0%) | 0 (0.0%) |
| $20,000 to $22,499 | 11 (12.4%) | 0 (0.0%) |
| $22,500 to $24,999 | 0 (0.0%) | 0 (0.0%) |
| $25,000 to $29,999 | 0 (0.0%) | 17 (6.7%) |
| $30,000 to $34,999 | 0 (0.0%) | 67 (26.5%) |
| $35,000 to $39,999 | 0 (0.0%) | 0 (0.0%) |
| $40,000 to $44,999 | 0 (0.0%) | 0 (0.0%) |
| $45,000 to $49,999 | 0 (0.0%) | 12 (4.7%) |
| $50,000 to $54,999 | 0 (0.0%) | 49 (19.4%) |
| $55,000 to $64,999 | 0 (0.0%) | 0 (0.0%) |
| $65,000 to $74,999 | 31 (34.8%) | 43 (17.0%) |
| $75,000 to $99,999 | 35 (39.3%) | 42 (16.6%) |
| $100,000+ | 12 (13.5%) | 0 (0.0%) |
| Total | 89 (100.0%) | 253 (100.0%) |
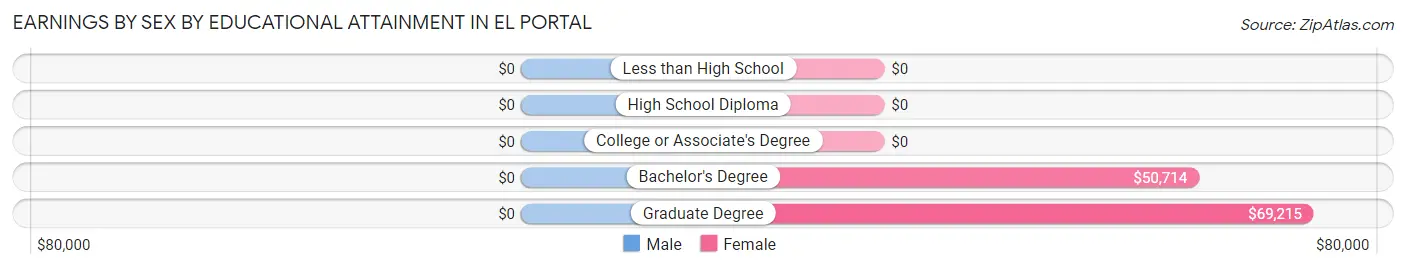
Earnings by Sex by Educational Attainment in El Portal
| Educational Attainment | Male Income | Female Income |
| Less than High School | - | - |
| High School Diploma | - | - |
| College or Associate's Degree | - | - |
| Bachelor's Degree | - | - |
| Graduate Degree | - | - |
| Total | $80,417 | $51,250 |
Family Income in El Portal
Family Income Brackets in El Portal
According to the El Portal family income data, there are 57 families falling into the $100,000 to $149,999 income range, which is the most common income bracket and makes up 100.0% of all families.
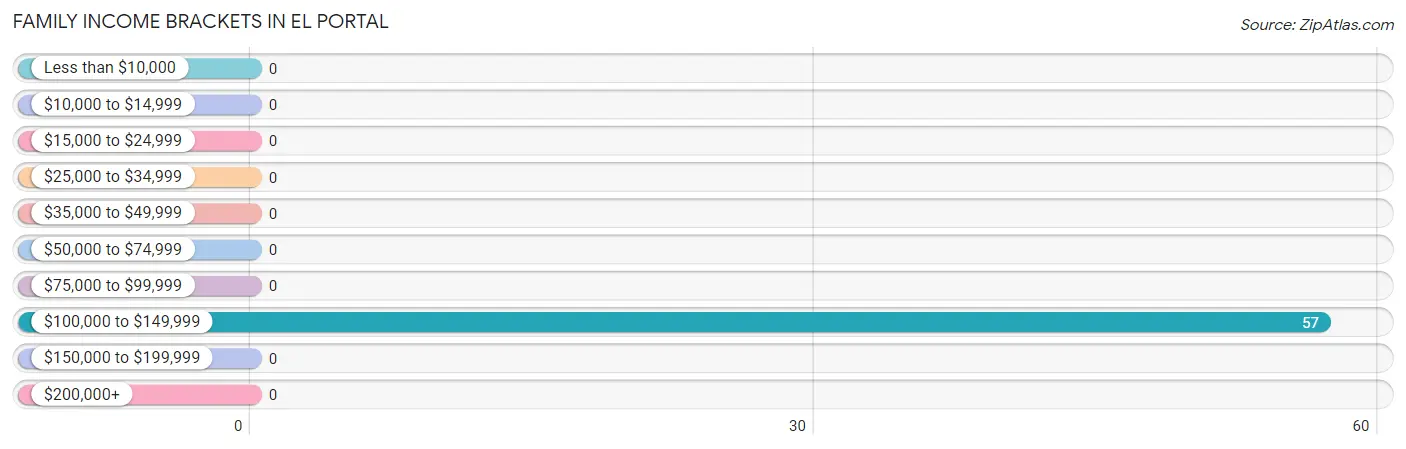
| Income Bracket | # Families | % Families |
| Less than $10,000 | 0 | 0.0% |
| $10,000 to $14,999 | 0 | 0.0% |
| $15,000 to $24,999 | 0 | 0.0% |
| $25,000 to $34,999 | 0 | 0.0% |
| $35,000 to $49,999 | 0 | 0.0% |
| $50,000 to $74,999 | 0 | 0.0% |
| $75,000 to $99,999 | 0 | 0.0% |
| $100,000 to $149,999 | 57 | 100.0% |
| $150,000 to $199,999 | 0 | 0.0% |
| $200,000+ | 0 | 0.0% |
Family Income by Famaliy Size in El Portal
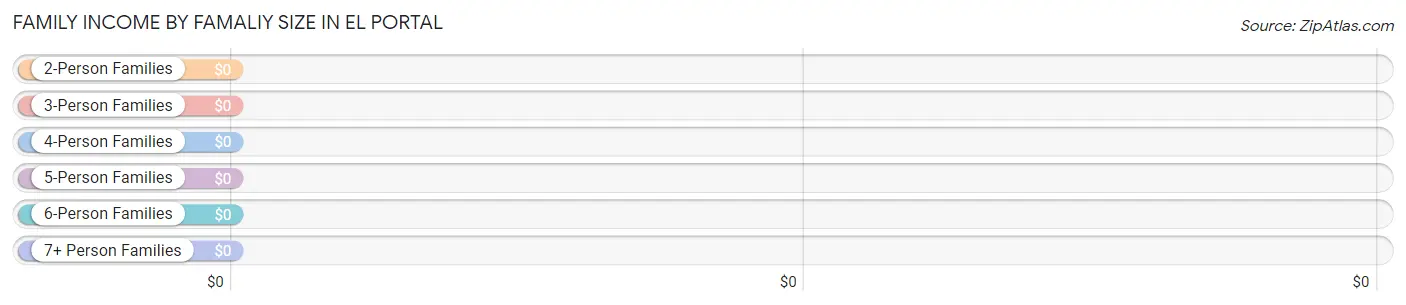
| Income Bracket | # Families | Median Income |
| 2-Person Families | 14 (24.6%) | $0 |
| 3-Person Families | 12 (21.0%) | $0 |
| 4-Person Families | 0 (0.0%) | $0 |
| 5-Person Families | 31 (54.4%) | $0 |
| 6-Person Families | 0 (0.0%) | $0 |
| 7+ Person Families | 0 (0.0%) | $0 |
| Total | 57 (100.0%) | $143,669 |
Family Income by Number of Earners in El Portal
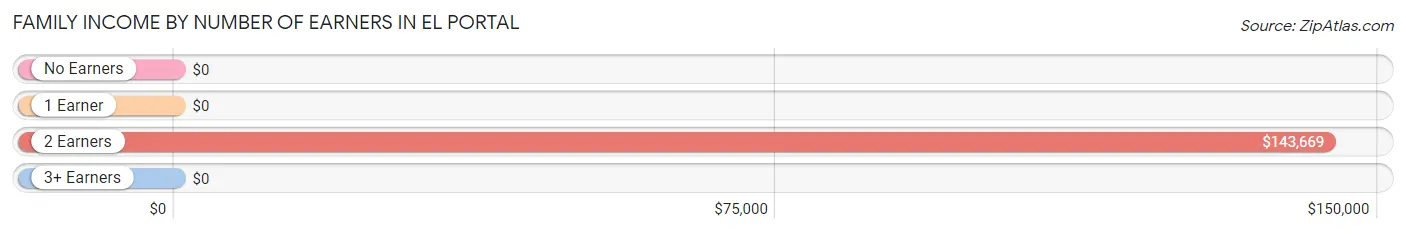
| Number of Earners | # Families | Median Income |
| No Earners | 0 (0.0%) | $0 |
| 1 Earner | 0 (0.0%) | $0 |
| 2 Earners | 57 (100.0%) | $143,669 |
| 3+ Earners | 0 (0.0%) | $0 |
| Total | 57 (100.0%) | $143,669 |
Household Income in El Portal
Household Income Brackets in El Portal
With 83 households falling in the category, the $50,000 to $74,999 income range is the most frequent in El Portal, accounting for 34.6% of all households.
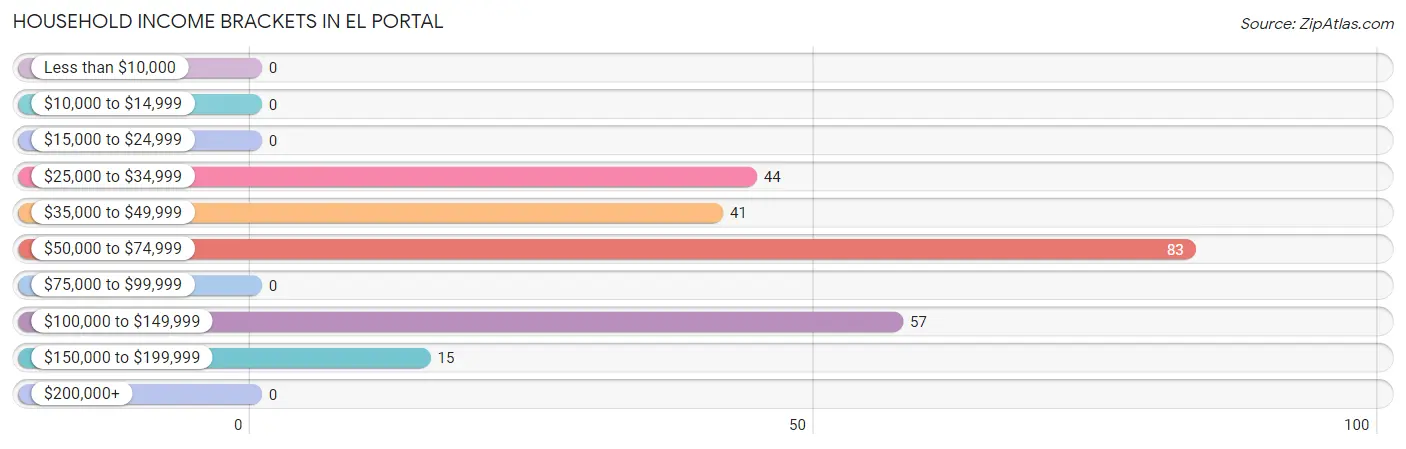
| Income Bracket | # Households | % Households |
| Less than $10,000 | 0 | 0.0% |
| $10,000 to $14,999 | 0 | 0.0% |
| $15,000 to $24,999 | 0 | 0.0% |
| $25,000 to $34,999 | 44 | 18.3% |
| $35,000 to $49,999 | 41 | 17.1% |
| $50,000 to $74,999 | 83 | 34.6% |
| $75,000 to $99,999 | 0 | 0.0% |
| $100,000 to $149,999 | 57 | 23.8% |
| $150,000 to $199,999 | 15 | 6.3% |
| $200,000+ | 0 | 0.0% |
Household Income by Householder Age in El Portal
| Income Bracket | # Households | Median Income |
| 15 to 24 Years | 34 (14.2%) | $0 |
| 25 to 44 Years | 52 (21.7%) | $0 |
| 45 to 64 Years | 124 (51.7%) | $0 |
| 65+ Years | 30 (12.5%) | $0 |
| Total | 240 (100.0%) | $51,786 |
Poverty in El Portal
Income Below Poverty by Sex and Age in El Portal
| Age Bracket | Male | Female |
| Under 5 Years | 0 (0.0%) | 0 (0.0%) |
| 5 Years | 0 (0.0%) | 0 (0.0%) |
| 6 to 11 Years | 0 (0.0%) | 0 (0.0%) |
| 12 to 14 Years | 0 (0.0%) | 0 (0.0%) |
| 15 Years | 0 (0.0%) | 0 (0.0%) |
| 16 and 17 Years | 0 (0.0%) | 0 (0.0%) |
| 18 to 24 Years | 0 (0.0%) | 0 (0.0%) |
| 25 to 34 Years | 0 (0.0%) | 0 (0.0%) |
| 35 to 44 Years | 0 (0.0%) | 0 (0.0%) |
| 45 to 54 Years | 0 (0.0%) | 0 (0.0%) |
| 55 to 64 Years | 0 (0.0%) | 0 (0.0%) |
| 65 to 74 Years | 0 (0.0%) | 0 (0.0%) |
| 75 Years and over | 0 (0.0%) | 0 (0.0%) |
| Total | 0 (0.0%) | 0 (0.0%) |
Income Above Poverty by Sex and Age in El Portal
According to the poverty statistics in El Portal, males aged under 5 years and females aged 6 to 11 years are the age groups that are most secure financially, with 100.0% of males and 100.0% of females in these age groups living above the poverty line.
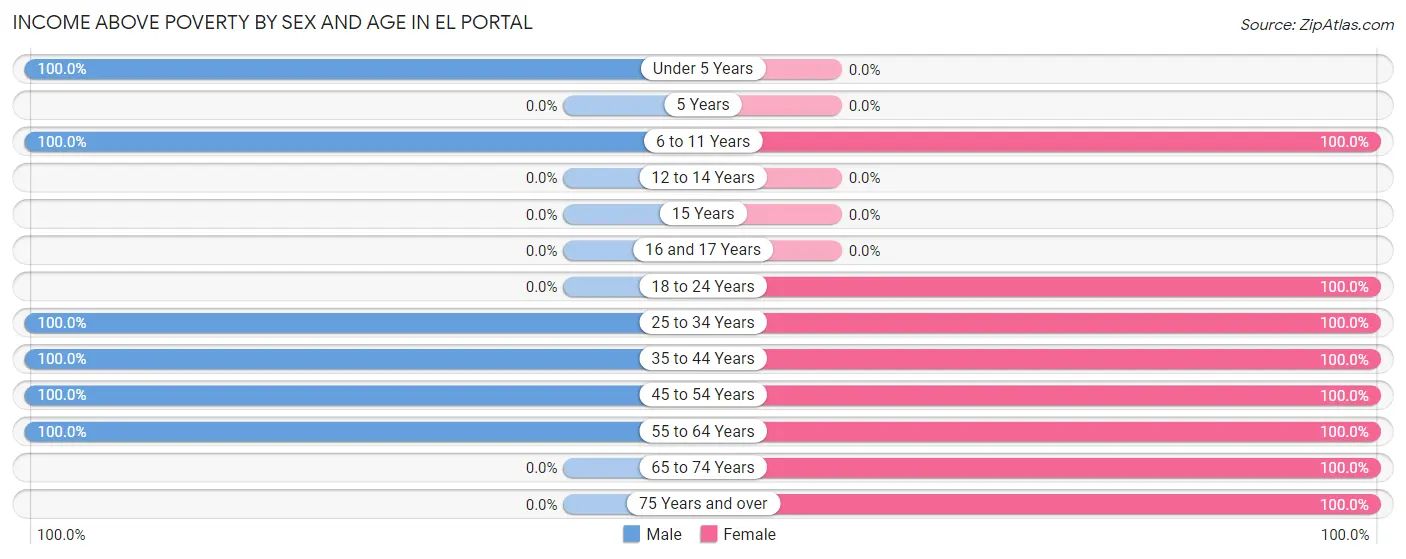
| Age Bracket | Male | Female |
| Under 5 Years | 11 (100.0%) | 0 (0.0%) |
| 5 Years | 0 (0.0%) | 0 (0.0%) |
| 6 to 11 Years | 33 (100.0%) | 77 (100.0%) |
| 12 to 14 Years | 0 (0.0%) | 0 (0.0%) |
| 15 Years | 0 (0.0%) | 0 (0.0%) |
| 16 and 17 Years | 0 (0.0%) | 0 (0.0%) |
| 18 to 24 Years | 0 (0.0%) | 34 (100.0%) |
| 25 to 34 Years | 11 (100.0%) | 58 (100.0%) |
| 35 to 44 Years | 12 (100.0%) | 26 (100.0%) |
| 45 to 54 Years | 46 (100.0%) | 92 (100.0%) |
| 55 to 64 Years | 20 (100.0%) | 29 (100.0%) |
| 65 to 74 Years | 0 (0.0%) | 14 (100.0%) |
| 75 Years and over | 0 (0.0%) | 16 (100.0%) |
| Total | 133 (100.0%) | 346 (100.0%) |
Income Below Poverty Among Married-Couple Families in El Portal
| Children | Above Poverty | Below Poverty |
| No Children | 14 (100.0%) | 0 (0.0%) |
| 1 or 2 Children | 12 (100.0%) | 0 (0.0%) |
| 3 or 4 Children | 31 (100.0%) | 0 (0.0%) |
| 5 or more Children | 0 (0.0%) | 0 (0.0%) |
| Total | 57 (100.0%) | 0 (0.0%) |
Income Below Poverty Among Single-Parent Households in El Portal
| Children | Single Father | Single Mother |
| No Children | 0 (0.0%) | 0 (0.0%) |
| 1 or 2 Children | 0 (0.0%) | 0 (0.0%) |
| 3 or 4 Children | 0 (0.0%) | 0 (0.0%) |
| 5 or more Children | 0 (0.0%) | 0 (0.0%) |
| Total | 0 (0.0%) | 0 (0.0%) |
Income Below Poverty Among Married-Couple vs Single-Parent Households in El Portal
| Children | Married-Couple Families | Single-Parent Households |
| No Children | 0 (0.0%) | 0 (0.0%) |
| 1 or 2 Children | 0 (0.0%) | 0 (0.0%) |
| 3 or 4 Children | 0 (0.0%) | 0 (0.0%) |
| 5 or more Children | 0 (0.0%) | 0 (0.0%) |
| Total | 0 (0.0%) | 0 (0.0%) |
Race in El Portal
The most populous races in El Portal are , and White / Caucasian (479 | 100.0%).
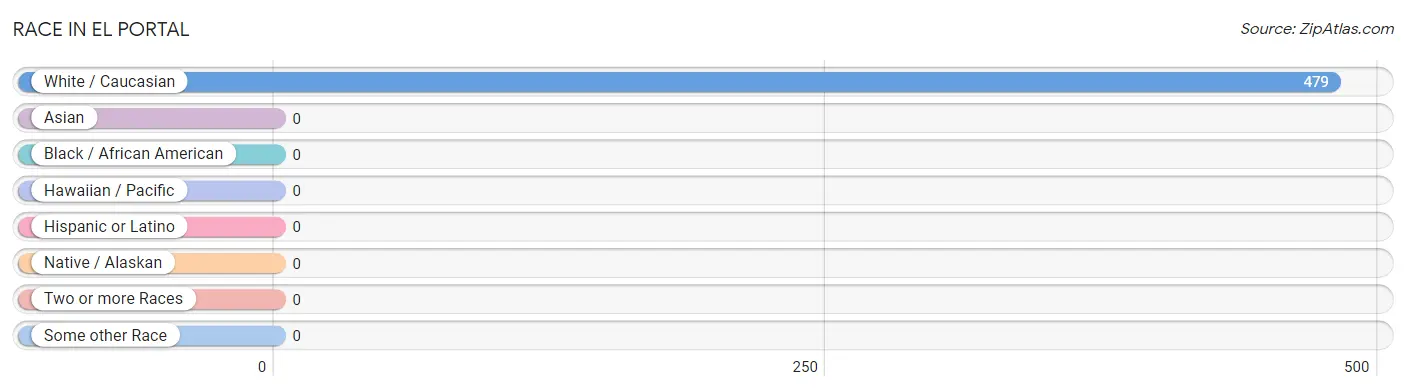
| Race | # Population | % Population |
| Asian | 0 | 0.0% |
| Black / African American | 0 | 0.0% |
| Hawaiian / Pacific | 0 | 0.0% |
| Hispanic or Latino | 0 | 0.0% |
| Native / Alaskan | 0 | 0.0% |
| White / Caucasian | 479 | 100.0% |
| Two or more Races | 0 | 0.0% |
| Some other Race | 0 | 0.0% |
| Total | 479 | 100.0% |
Ancestry in El Portal
The most populous ancestries reported in El Portal are Irish (246 | 51.4%), German (204 | 42.6%), Dutch (85 | 17.7%), Polish (31 | 6.5%), and European (20 | 4.2%), together accounting for 122.4% of all El Portal residents.
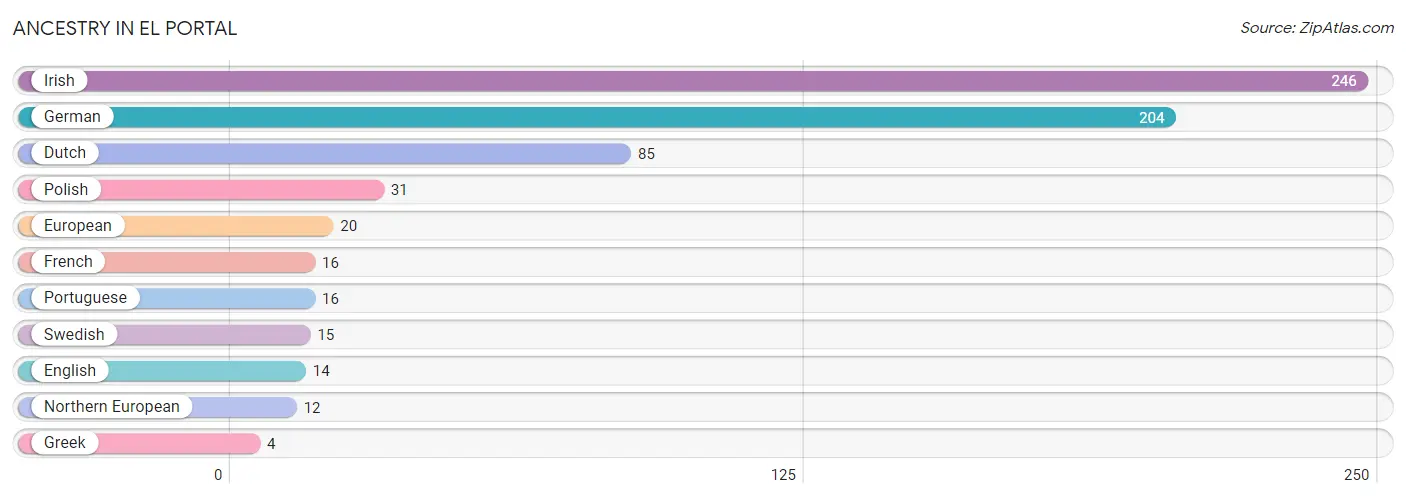
| Ancestry | # Population | % Population |
| Dutch | 85 | 17.7% |
| English | 14 | 2.9% |
| European | 20 | 4.2% |
| French | 16 | 3.3% |
| German | 204 | 42.6% |
| Greek | 4 | 0.8% |
| Irish | 246 | 51.4% |
| Northern European | 12 | 2.5% |
| Polish | 31 | 6.5% |
| Portuguese | 16 | 3.3% |
| Swedish | 15 | 3.1% | View All 11 Rows |
Immigrants in El Portal

| Immigration Origin | # Population | % Population | View All 0 Rows |
Sex and Age in El Portal
Sex and Age in El Portal
The most populous age groups in El Portal are 45 to 49 Years (46 | 34.6%) for men and 5 to 9 Years (77 | 22.3%) for women.
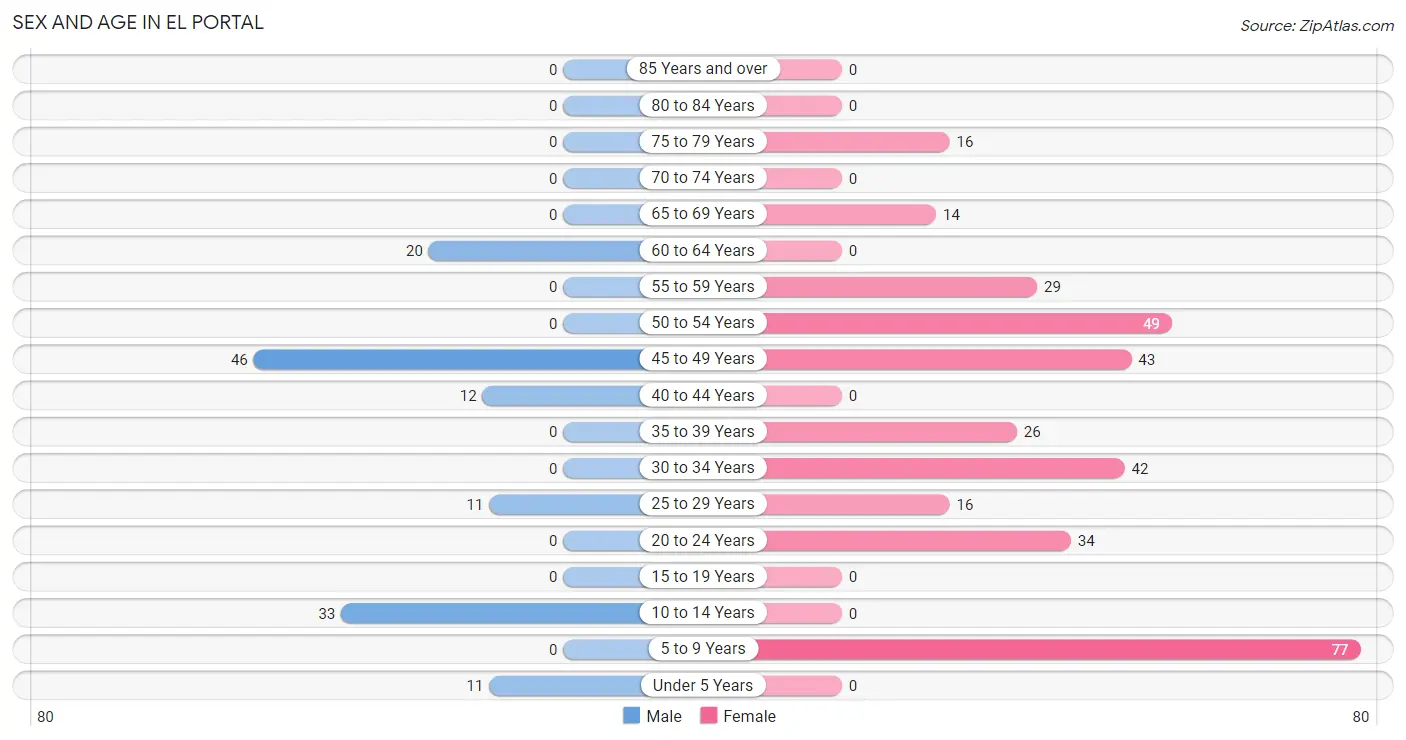
| Age Bracket | Male | Female |
| Under 5 Years | 11 (8.3%) | 0 (0.0%) |
| 5 to 9 Years | 0 (0.0%) | 77 (22.3%) |
| 10 to 14 Years | 33 (24.8%) | 0 (0.0%) |
| 15 to 19 Years | 0 (0.0%) | 0 (0.0%) |
| 20 to 24 Years | 0 (0.0%) | 34 (9.8%) |
| 25 to 29 Years | 11 (8.3%) | 16 (4.6%) |
| 30 to 34 Years | 0 (0.0%) | 42 (12.1%) |
| 35 to 39 Years | 0 (0.0%) | 26 (7.5%) |
| 40 to 44 Years | 12 (9.0%) | 0 (0.0%) |
| 45 to 49 Years | 46 (34.6%) | 43 (12.4%) |
| 50 to 54 Years | 0 (0.0%) | 49 (14.2%) |
| 55 to 59 Years | 0 (0.0%) | 29 (8.4%) |
| 60 to 64 Years | 20 (15.0%) | 0 (0.0%) |
| 65 to 69 Years | 0 (0.0%) | 14 (4.1%) |
| 70 to 74 Years | 0 (0.0%) | 0 (0.0%) |
| 75 to 79 Years | 0 (0.0%) | 16 (4.6%) |
| 80 to 84 Years | 0 (0.0%) | 0 (0.0%) |
| 85 Years and over | 0 (0.0%) | 0 (0.0%) |
| Total | 133 (100.0%) | 346 (100.0%) |
Families and Households in El Portal
Median Family Size in El Portal
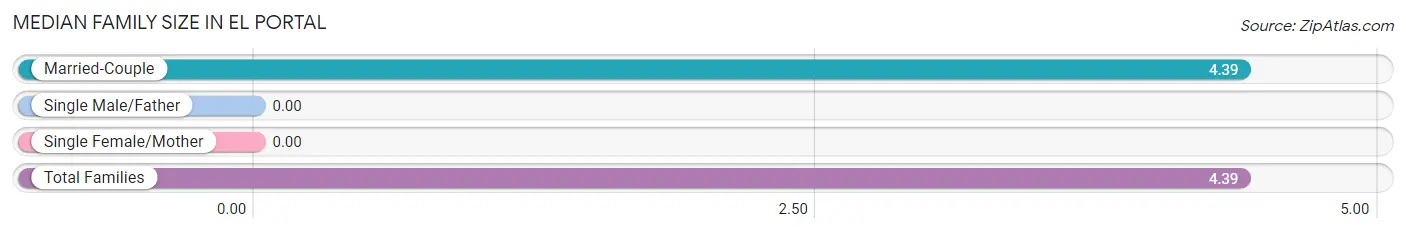
| Family Type | # Families | Family Size |
| Married-Couple | 57 (100.0%) | 4.39 |
| Single Male/Father | 0 (0.0%) | - |
| Single Female/Mother | 0 (0.0%) | - |
| Total Families | 57 (100.0%) | 4.39 |
Median Household Size in El Portal
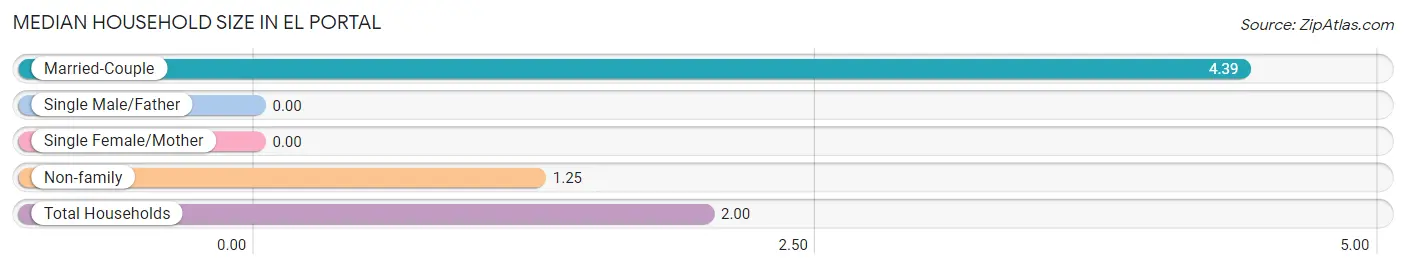
| Household Type | # Households | Household Size |
| Married-Couple | 57 (23.7%) | 4.39 |
| Single Male/Father | 0 (0.0%) | - |
| Single Female/Mother | 0 (0.0%) | - |
| Non-family | 183 (76.2%) | 1.25 |
| Total Households | 240 (100.0%) | 2.00 |
Household Size by Marriage Status in El Portal
Out of a total of 240 households in El Portal, 57 (23.7%) are family households, while 183 (76.2%) are nonfamily households. The most numerous type of family households are 5-person households, comprising 31, and the most common type of nonfamily households are 1-person households, comprising 134.
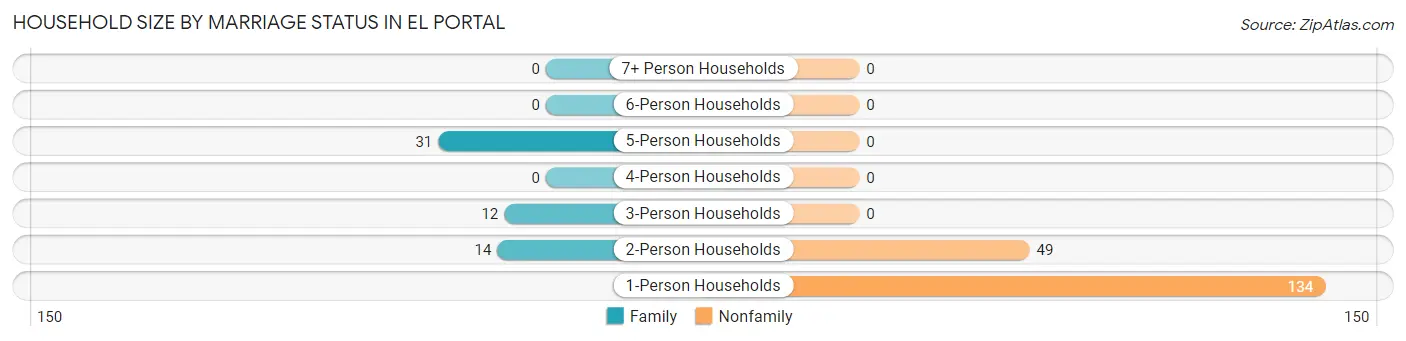
| Household Size | Family Households | Nonfamily Households |
| 1-Person Households | - | 134 (55.8%) |
| 2-Person Households | 14 (5.8%) | 49 (20.4%) |
| 3-Person Households | 12 (5.0%) | 0 (0.0%) |
| 4-Person Households | 0 (0.0%) | 0 (0.0%) |
| 5-Person Households | 31 (12.9%) | 0 (0.0%) |
| 6-Person Households | 0 (0.0%) | 0 (0.0%) |
| 7+ Person Households | 0 (0.0%) | 0 (0.0%) |
| Total | 57 (23.7%) | 183 (76.2%) |
Female Fertility in El Portal
Fertility by Age in El Portal
Average fertility rate in El Portal is 56.0 births per 1,000 women. Women in the age bracket of 35 to 50 years have the highest fertility rate with 130.0 births per 1,000 women. Women in the age bracket of 35 to 50 years acount for 100.0% of all women with births.
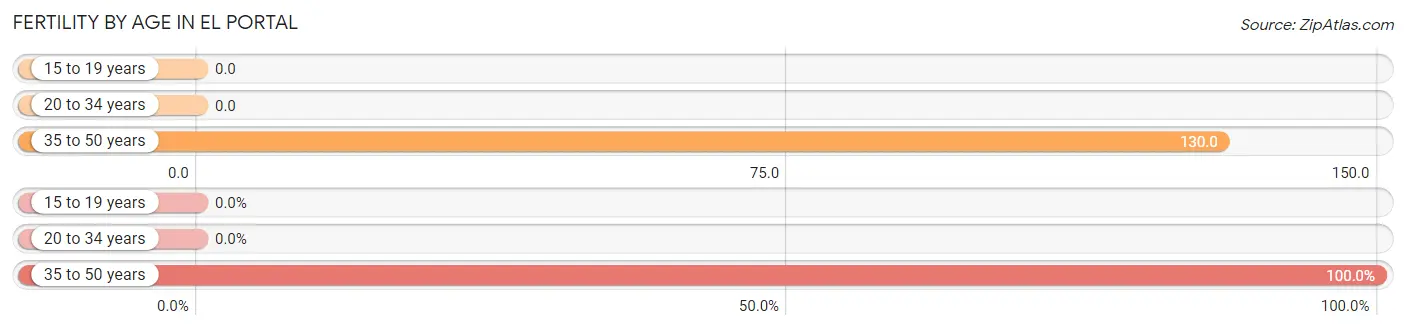
| Age Bracket | Women with Births | Births / 1,000 Women |
| 15 to 19 years | 0 (0.0%) | 0.0 |
| 20 to 34 years | 0 (0.0%) | 0.0 |
| 35 to 50 years | 9 (100.0%) | 130.0 |
| Total | 9 (100.0%) | 56.0 |
Fertility by Age by Marriage Status in El Portal
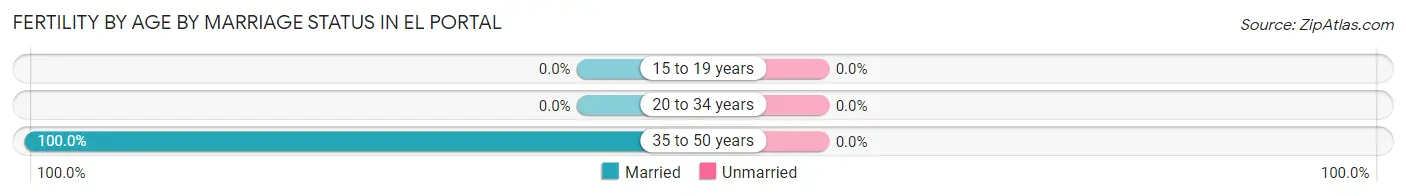
| Age Bracket | Married | Unmarried |
| 15 to 19 years | 0 (0.0%) | 0 (0.0%) |
| 20 to 34 years | 0 (0.0%) | 0 (0.0%) |
| 35 to 50 years | 9 (100.0%) | 0 (0.0%) |
| Total | 9 (100.0%) | 0 (0.0%) |
Fertility by Education in El Portal
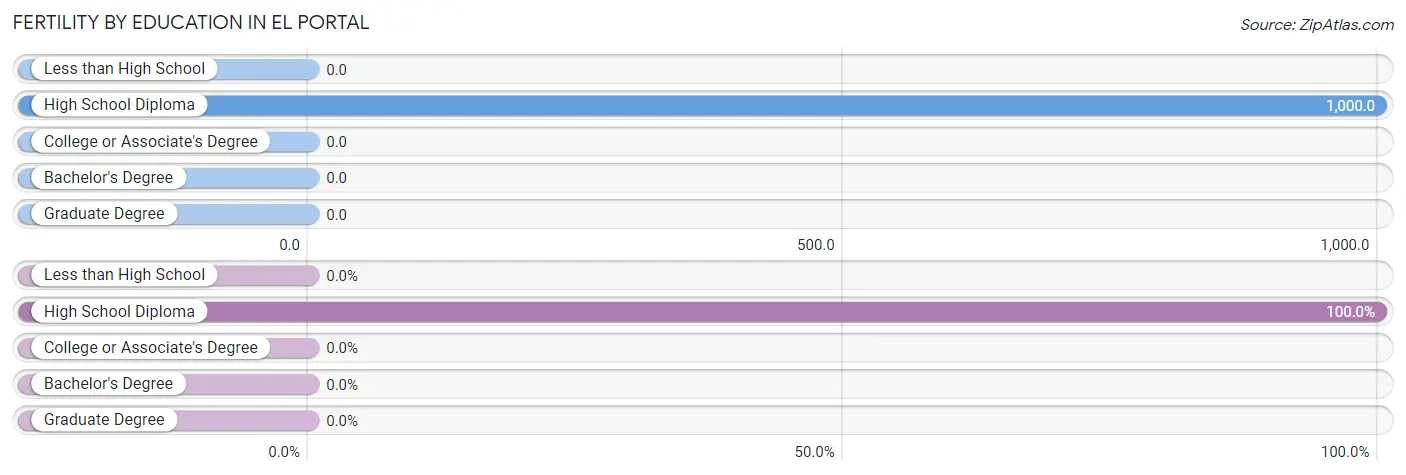
| Educational Attainment | Women with Births | Births / 1,000 Women |
| Less than High School | 0 (0.0%) | 0.0 |
| High School Diploma | 9 (100.0%) | 1,000.0 |
| College or Associate's Degree | 0 (0.0%) | 0.0 |
| Bachelor's Degree | 0 (0.0%) | 0.0 |
| Graduate Degree | 0 (0.0%) | 0.0 |
| Total | 9 (100.0%) | 56.0 |
Fertility by Education by Marriage Status in El Portal
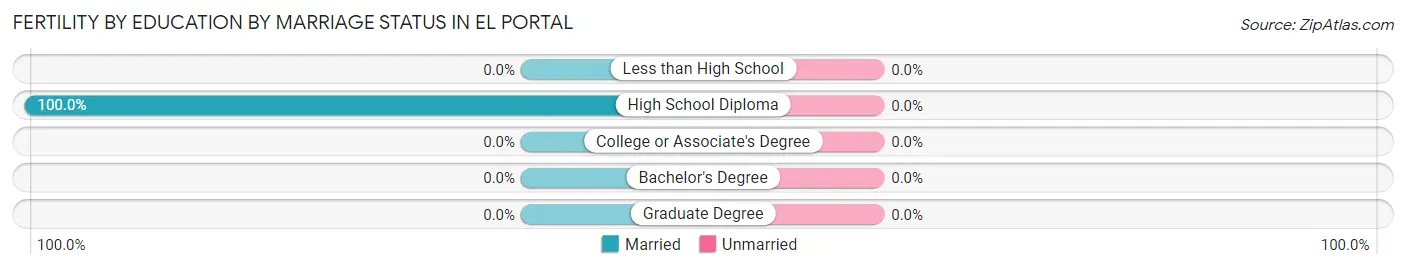
| Educational Attainment | Married | Unmarried |
| Less than High School | 0 (0.0%) | 0 (0.0%) |
| High School Diploma | 9 (100.0%) | 0 (0.0%) |
| College or Associate's Degree | 0 (0.0%) | 0 (0.0%) |
| Bachelor's Degree | 0 (0.0%) | 0 (0.0%) |
| Graduate Degree | 0 (0.0%) | 0 (0.0%) |
| Total | 9 (100.0%) | 0 (0.0%) |
Employment Characteristics in El Portal
Employment by Class of Employer in El Portal
Among the 299 employed individuals in El Portal, federal government employees (161 | 53.8%), local government employees (94 | 31.4%), and not-for-profit organizations (23 | 7.7%) make up the most common classes of employment.
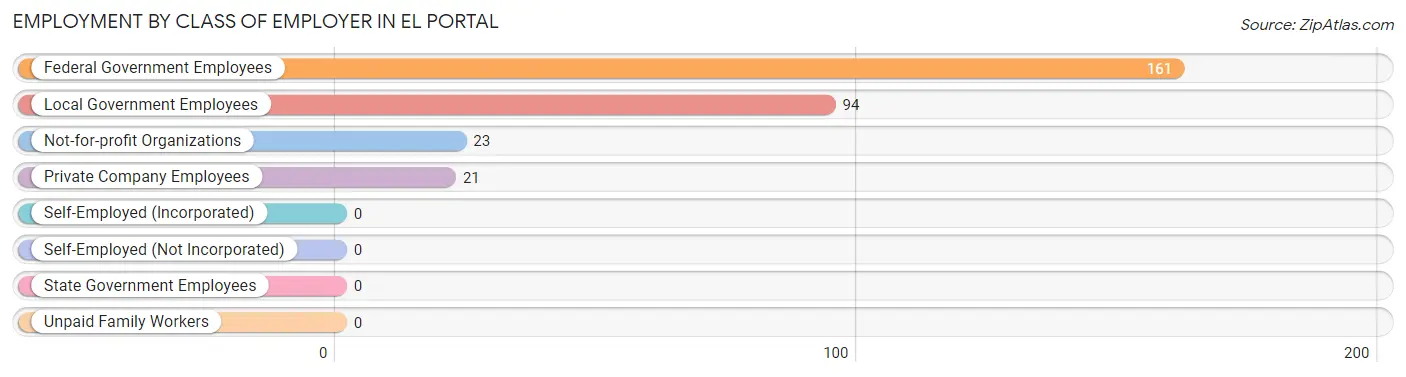
| Employer Class | # Employees | % Employees |
| Private Company Employees | 21 | 7.0% |
| Self-Employed (Incorporated) | 0 | 0.0% |
| Self-Employed (Not Incorporated) | 0 | 0.0% |
| Not-for-profit Organizations | 23 | 7.7% |
| Local Government Employees | 94 | 31.4% |
| State Government Employees | 0 | 0.0% |
| Federal Government Employees | 161 | 53.8% |
| Unpaid Family Workers | 0 | 0.0% |
| Total | 299 | 100.0% |
Employment Status by Age in El Portal
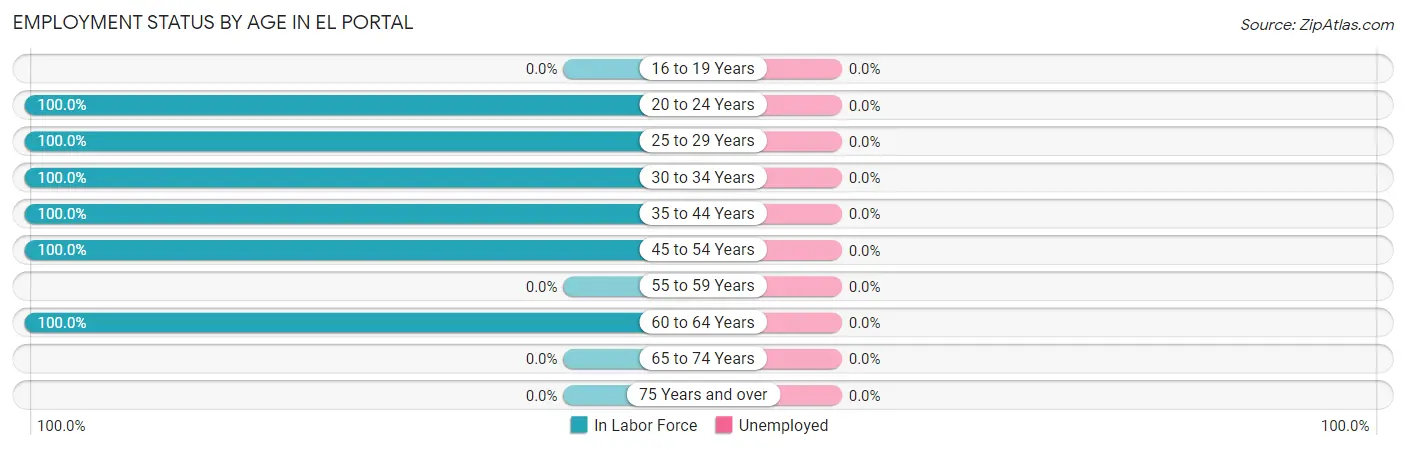
| Age Bracket | In Labor Force | Unemployed |
| 16 to 19 Years | 0 (0.0%) | 0 (0.0%) |
| 20 to 24 Years | 34 (100.0%) | 0 (0.0%) |
| 25 to 29 Years | 27 (100.0%) | 0 (0.0%) |
| 30 to 34 Years | 42 (100.0%) | 0 (0.0%) |
| 35 to 44 Years | 38 (100.0%) | 0 (0.0%) |
| 45 to 54 Years | 138 (100.0%) | 0 (0.0%) |
| 55 to 59 Years | 0 (0.0%) | 0 (0.0%) |
| 60 to 64 Years | 20 (100.0%) | 0 (0.0%) |
| 65 to 74 Years | 0 (0.0%) | 0 (0.0%) |
| 75 Years and over | 0 (0.0%) | 0 (0.0%) |
| Total | 299 (83.5%) | 0 (0.0%) |
Employment Status by Educational Attainment in El Portal
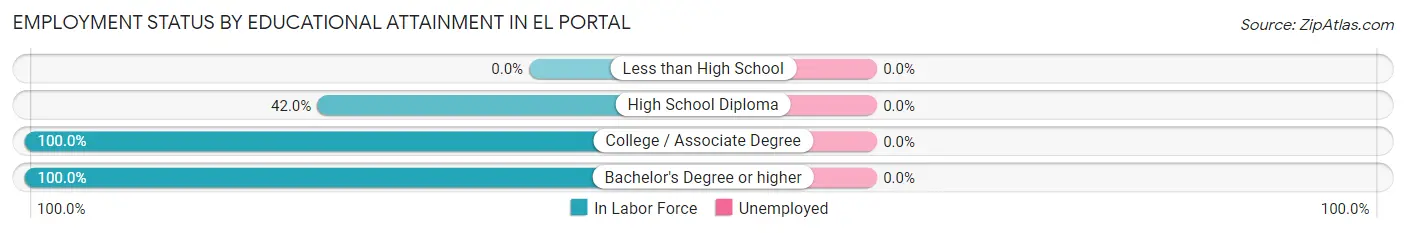
| Educational Attainment | In Labor Force | Unemployed |
| Less than High School | 0 (0.0%) | 0 (0.0%) |
| High School Diploma | 21 (42.0%) | 0 (0.0%) |
| College / Associate Degree | 11 (100.0%) | 0 (0.0%) |
| Bachelor's Degree or higher | 233 (100.0%) | 0 (0.0%) |
| Total | 265 (90.1%) | 0 (0.0%) |
Employment Occupations by Sex in El Portal
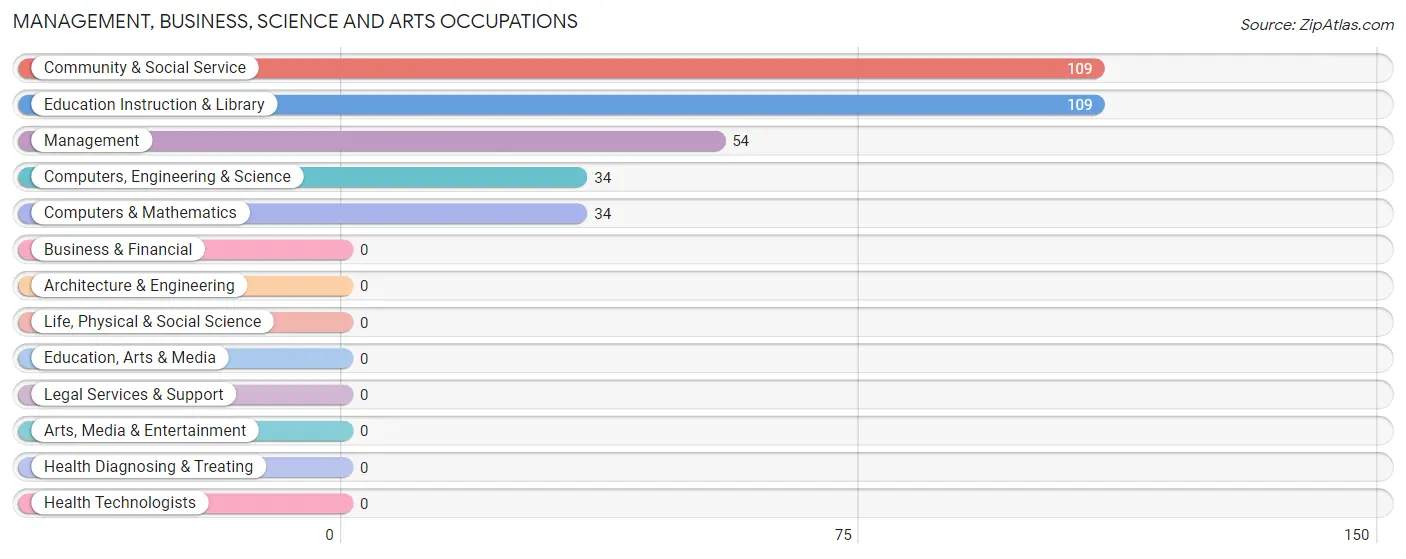
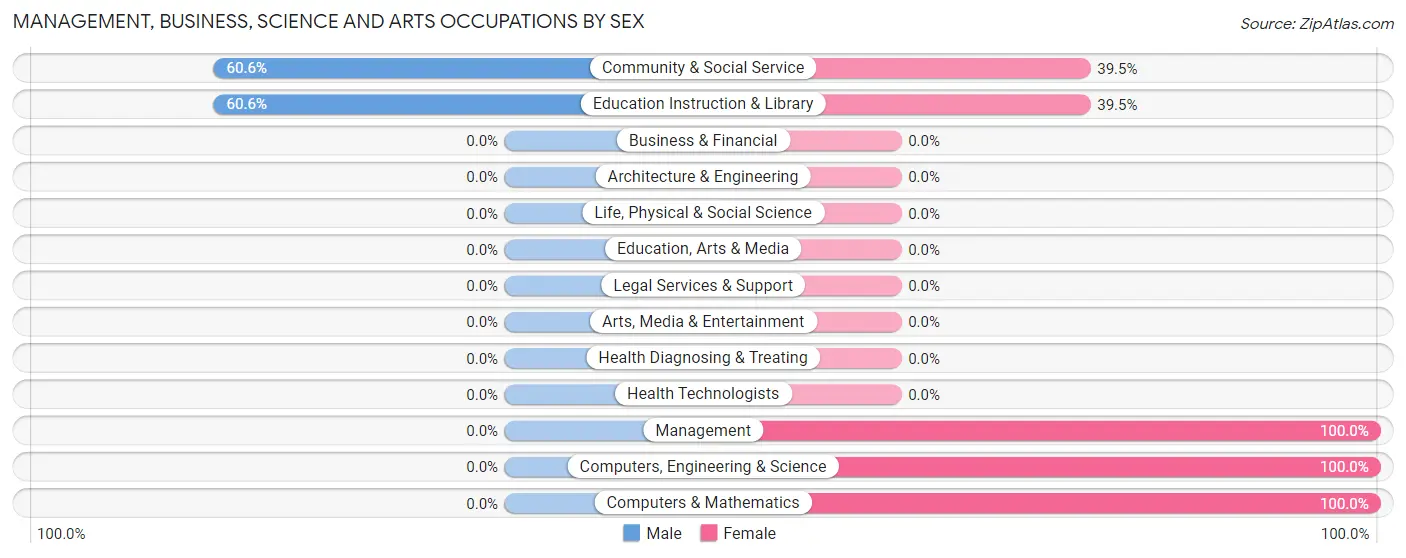
Management, Business, Science and Arts Occupations
The most common Management, Business, Science and Arts occupations in El Portal are Community & Social Service (109 | 36.4%), Education Instruction & Library (109 | 36.4%), Management (54 | 18.1%), Computers, Engineering & Science (34 | 11.4%), and Computers & Mathematics (34 | 11.4%).
Management, Business, Science and Arts Occupations by Sex
Within the Management, Business, Science and Arts occupations in El Portal, the most male-oriented occupations are Community & Social Service (60.6%), and Education Instruction & Library (60.6%), while the most female-oriented occupations are Management (100.0%), Computers, Engineering & Science (100.0%), and Computers & Mathematics (100.0%).
| Occupation | Male | Female |
| Management | 0 (0.0%) | 54 (100.0%) |
| Business & Financial | 0 (0.0%) | 0 (0.0%) |
| Computers, Engineering & Science | 0 (0.0%) | 34 (100.0%) |
| Computers & Mathematics | 0 (0.0%) | 34 (100.0%) |
| Architecture & Engineering | 0 (0.0%) | 0 (0.0%) |
| Life, Physical & Social Science | 0 (0.0%) | 0 (0.0%) |
| Community & Social Service | 66 (60.6%) | 43 (39.5%) |
| Education, Arts & Media | 0 (0.0%) | 0 (0.0%) |
| Legal Services & Support | 0 (0.0%) | 0 (0.0%) |
| Education Instruction & Library | 66 (60.6%) | 43 (39.5%) |
| Arts, Media & Entertainment | 0 (0.0%) | 0 (0.0%) |
| Health Diagnosing & Treating | 0 (0.0%) | 0 (0.0%) |
| Health Technologists | 0 (0.0%) | 0 (0.0%) |
| Total (Category) | 66 (33.5%) | 131 (66.5%) |
| Total (Overall) | 89 (29.8%) | 210 (70.2%) |
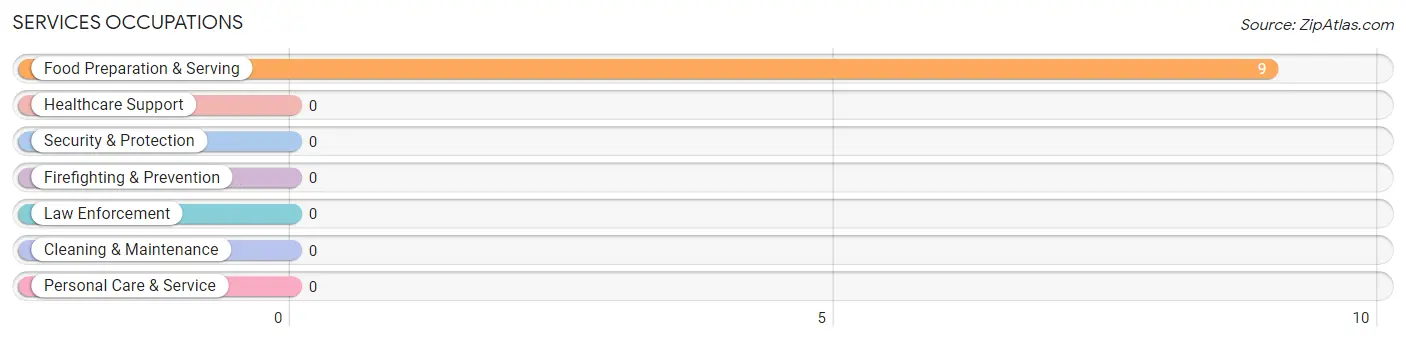
Services Occupations
The most common Services occupations in El Portal are , and Food Preparation & Serving (9 | 3.0%).
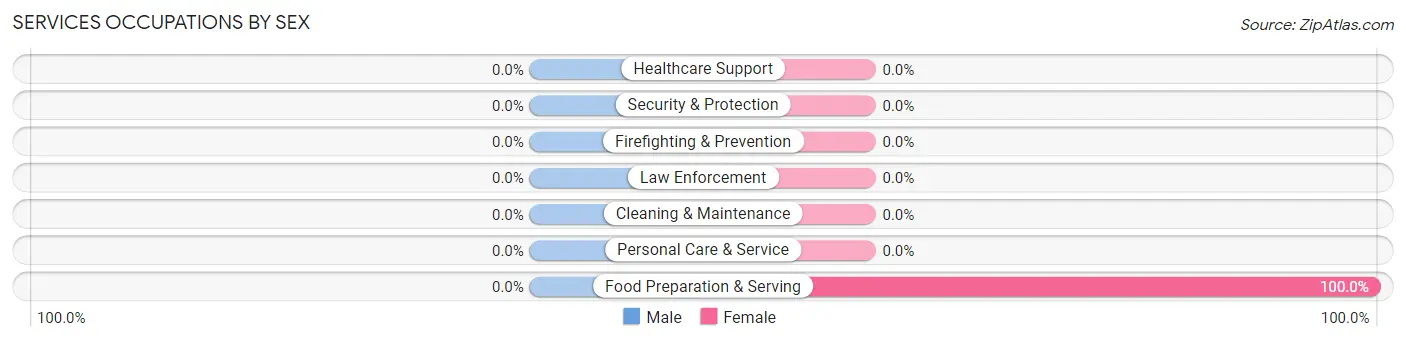
Services Occupations by Sex
| Occupation | Male | Female |
| Healthcare Support | 0 (0.0%) | 0 (0.0%) |
| Security & Protection | 0 (0.0%) | 0 (0.0%) |
| Firefighting & Prevention | 0 (0.0%) | 0 (0.0%) |
| Law Enforcement | 0 (0.0%) | 0 (0.0%) |
| Food Preparation & Serving | 0 (0.0%) | 9 (100.0%) |
| Cleaning & Maintenance | 0 (0.0%) | 0 (0.0%) |
| Personal Care & Service | 0 (0.0%) | 0 (0.0%) |
| Total (Category) | 0 (0.0%) | 9 (100.0%) |
| Total (Overall) | 89 (29.8%) | 210 (70.2%) |
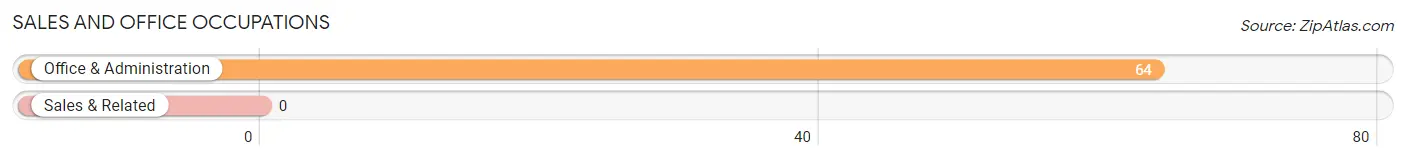
Sales and Office Occupations
The most common Sales and Office occupations in El Portal are , and Office & Administration (64 | 21.4%).
Sales and Office Occupations by Sex

| Occupation | Male | Female |
| Sales & Related | 0 (0.0%) | 0 (0.0%) |
| Office & Administration | 11 (17.2%) | 53 (82.8%) |
| Total (Category) | 11 (17.2%) | 53 (82.8%) |
| Total (Overall) | 89 (29.8%) | 210 (70.2%) |
Natural Resources, Construction and Maintenance Occupations
The most common Natural Resources, Construction and Maintenance occupations in El Portal are , and Installation, Maintenance & Repair (12 | 4.0%).
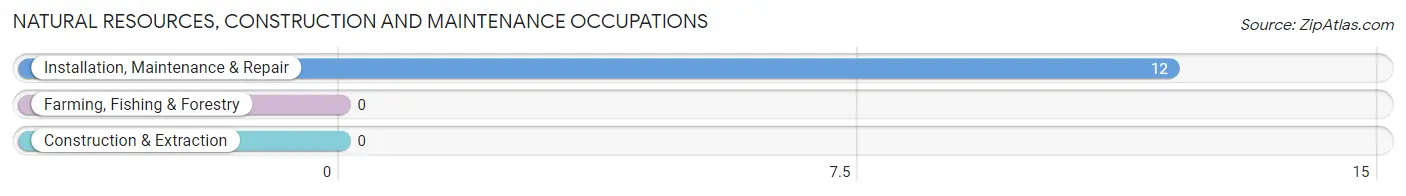
Natural Resources, Construction and Maintenance Occupations by Sex
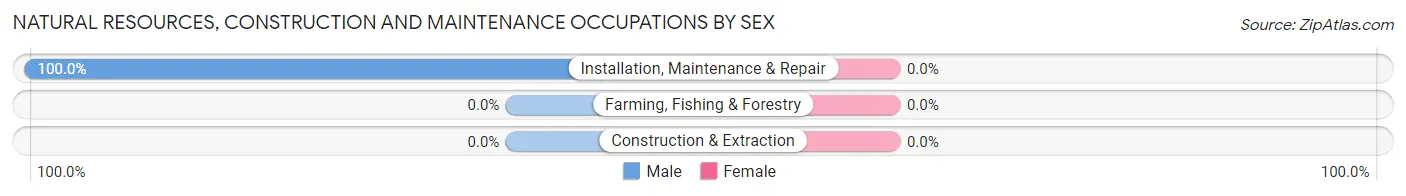
| Occupation | Male | Female |
| Farming, Fishing & Forestry | 0 (0.0%) | 0 (0.0%) |
| Construction & Extraction | 0 (0.0%) | 0 (0.0%) |
| Installation, Maintenance & Repair | 12 (100.0%) | 0 (0.0%) |
| Total (Category) | 12 (100.0%) | 0 (0.0%) |
| Total (Overall) | 89 (29.8%) | 210 (70.2%) |
Production, Transportation and Moving Occupations
The most common Production, Transportation and Moving occupations in El Portal are , and Material Moving (17 | 5.7%).
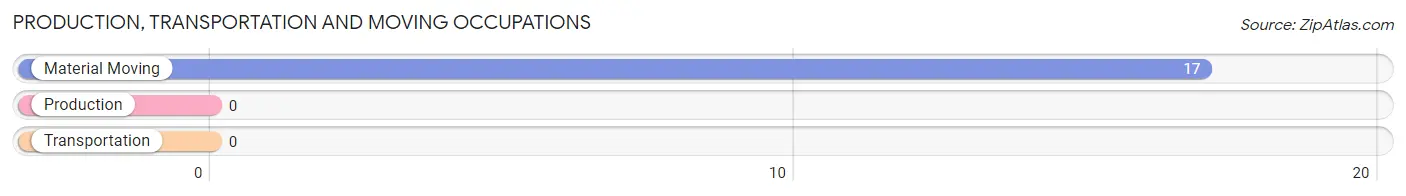
Production, Transportation and Moving Occupations by Sex
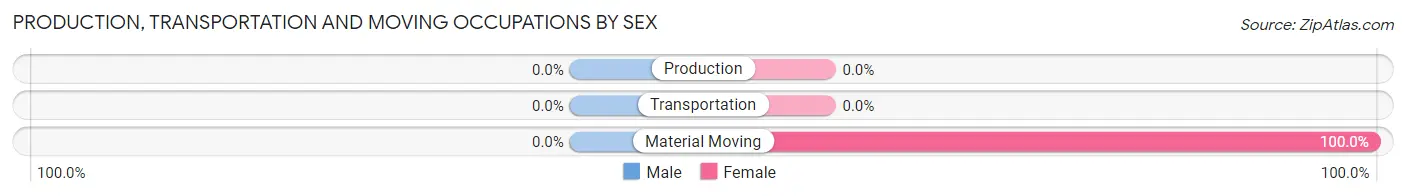
| Occupation | Male | Female |
| Production | 0 (0.0%) | 0 (0.0%) |
| Transportation | 0 (0.0%) | 0 (0.0%) |
| Material Moving | 0 (0.0%) | 17 (100.0%) |
| Total (Category) | 0 (0.0%) | 17 (100.0%) |
| Total (Overall) | 89 (29.8%) | 210 (70.2%) |
Employment Industries by Sex in El Portal
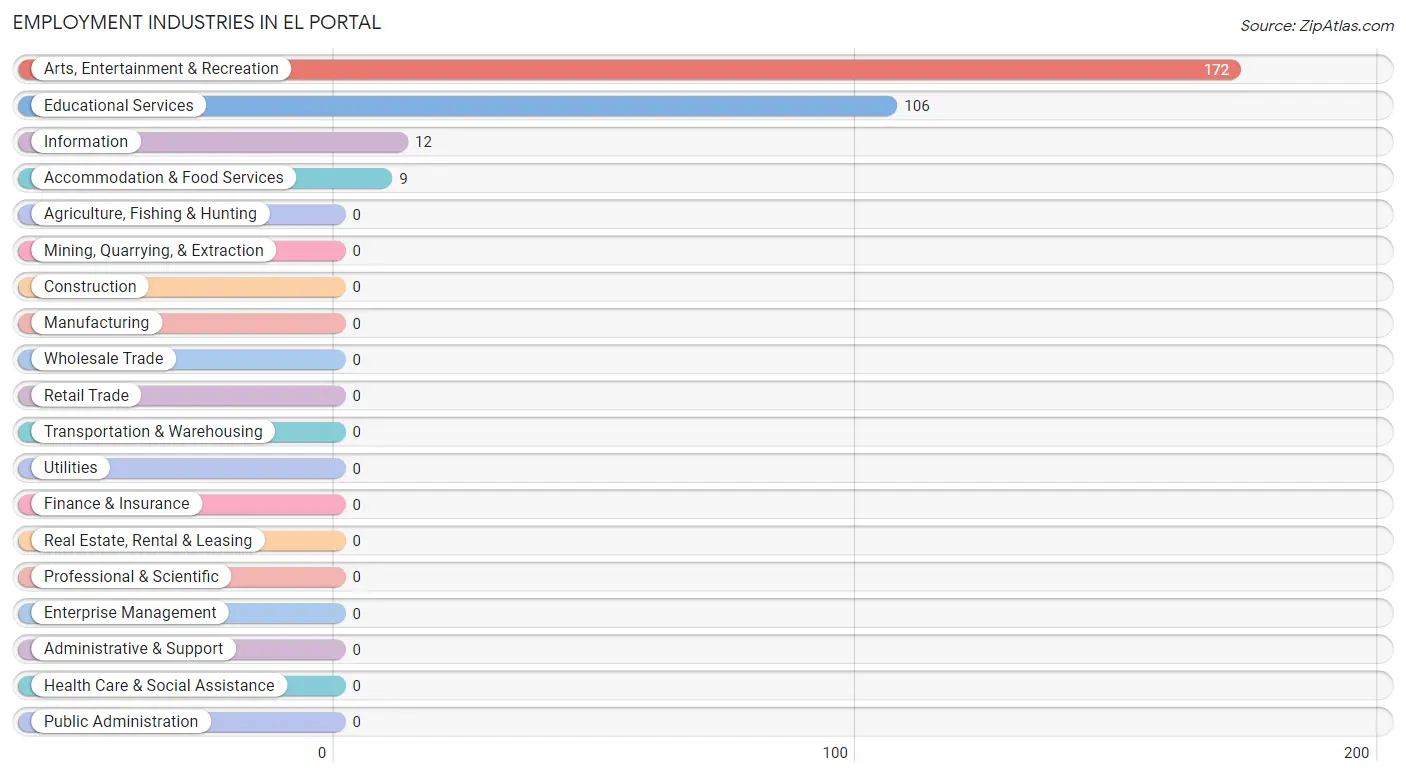
Employment Industries in El Portal
The major employment industries in El Portal include Arts, Entertainment & Recreation (172 | 57.5%), Educational Services (106 | 35.4%), Information (12 | 4.0%), and Accommodation & Food Services (9 | 3.0%).
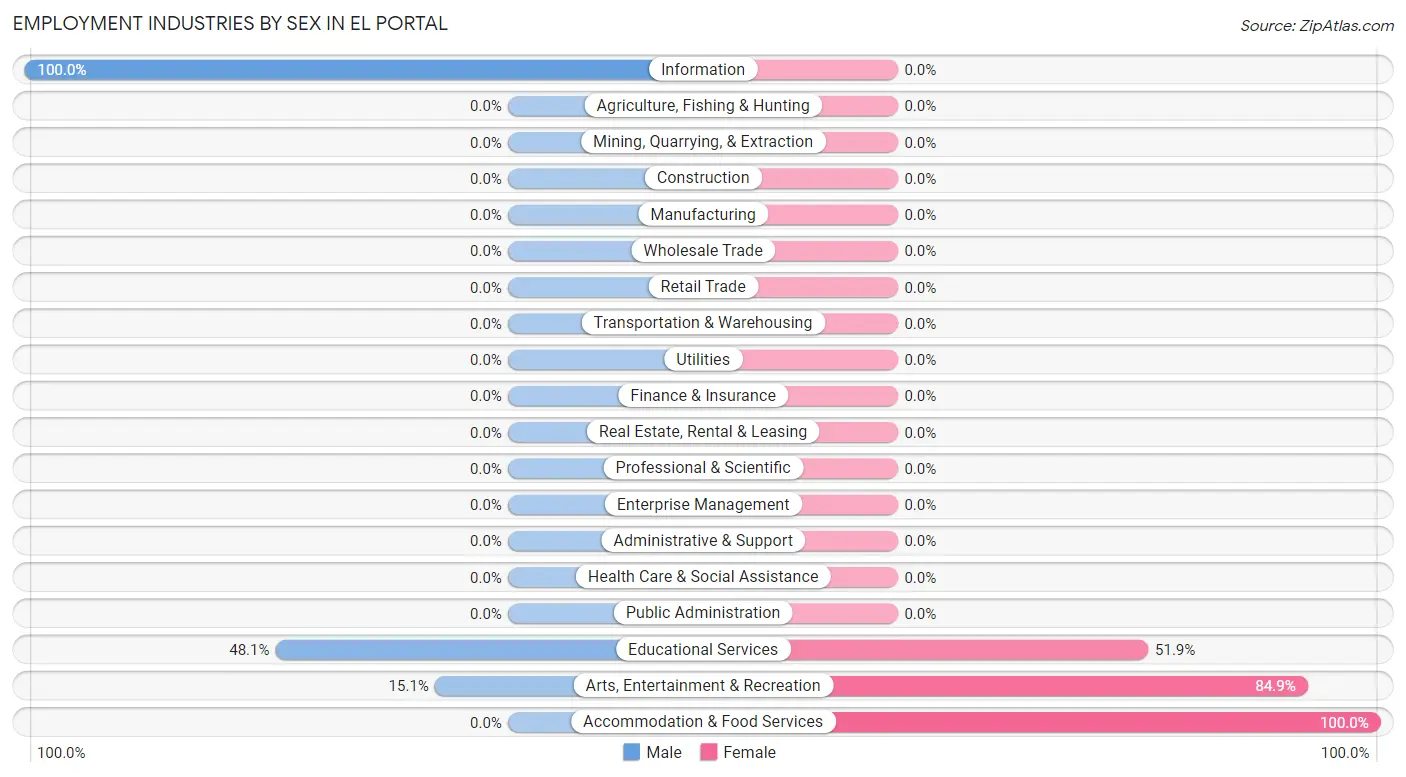
Employment Industries by Sex in El Portal
The El Portal industries that see more men than women are Information (100.0%), Educational Services (48.1%), and Arts, Entertainment & Recreation (15.1%), whereas the industries that tend to have a higher number of women are Accommodation & Food Services (100.0%), Arts, Entertainment & Recreation (84.9%), and Educational Services (51.9%).
| Industry | Male | Female |
| Agriculture, Fishing & Hunting | 0 (0.0%) | 0 (0.0%) |
| Mining, Quarrying, & Extraction | 0 (0.0%) | 0 (0.0%) |
| Construction | 0 (0.0%) | 0 (0.0%) |
| Manufacturing | 0 (0.0%) | 0 (0.0%) |
| Wholesale Trade | 0 (0.0%) | 0 (0.0%) |
| Retail Trade | 0 (0.0%) | 0 (0.0%) |
| Transportation & Warehousing | 0 (0.0%) | 0 (0.0%) |
| Utilities | 0 (0.0%) | 0 (0.0%) |
| Information | 12 (100.0%) | 0 (0.0%) |
| Finance & Insurance | 0 (0.0%) | 0 (0.0%) |
| Real Estate, Rental & Leasing | 0 (0.0%) | 0 (0.0%) |
| Professional & Scientific | 0 (0.0%) | 0 (0.0%) |
| Enterprise Management | 0 (0.0%) | 0 (0.0%) |
| Administrative & Support | 0 (0.0%) | 0 (0.0%) |
| Educational Services | 51 (48.1%) | 55 (51.9%) |
| Health Care & Social Assistance | 0 (0.0%) | 0 (0.0%) |
| Arts, Entertainment & Recreation | 26 (15.1%) | 146 (84.9%) |
| Accommodation & Food Services | 0 (0.0%) | 9 (100.0%) |
| Public Administration | 0 (0.0%) | 0 (0.0%) |
| Total | 89 (29.8%) | 210 (70.2%) |
Education in El Portal
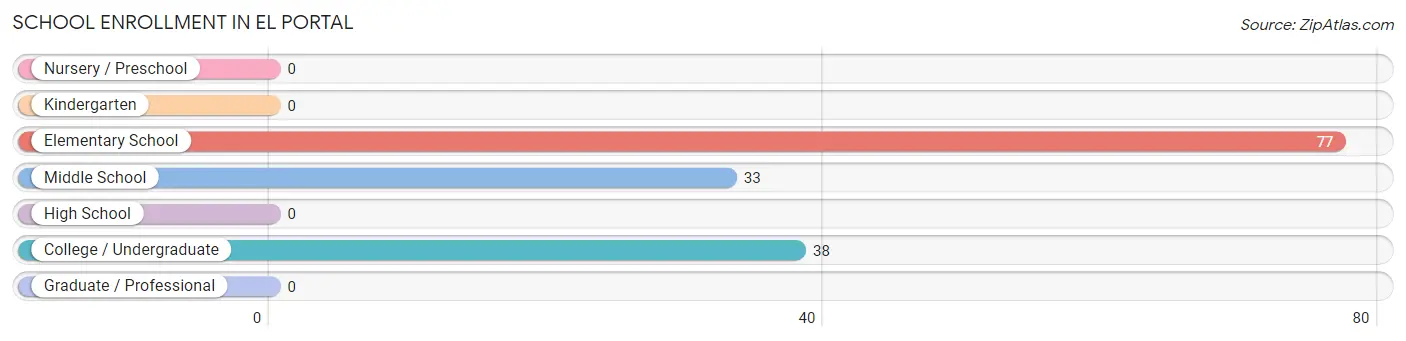
School Enrollment in El Portal
The most common levels of schooling among the 148 students in El Portal are elementary school (77 | 52.0%), college / undergraduate (38 | 25.7%), and middle school (33 | 22.3%).
| School Level | # Students | % Students |
| Nursery / Preschool | 0 | 0.0% |
| Kindergarten | 0 | 0.0% |
| Elementary School | 77 | 52.0% |
| Middle School | 33 | 22.3% |
| High School | 0 | 0.0% |
| College / Undergraduate | 38 | 25.7% |
| Graduate / Professional | 0 | 0.0% |
| Total | 148 | 100.0% |
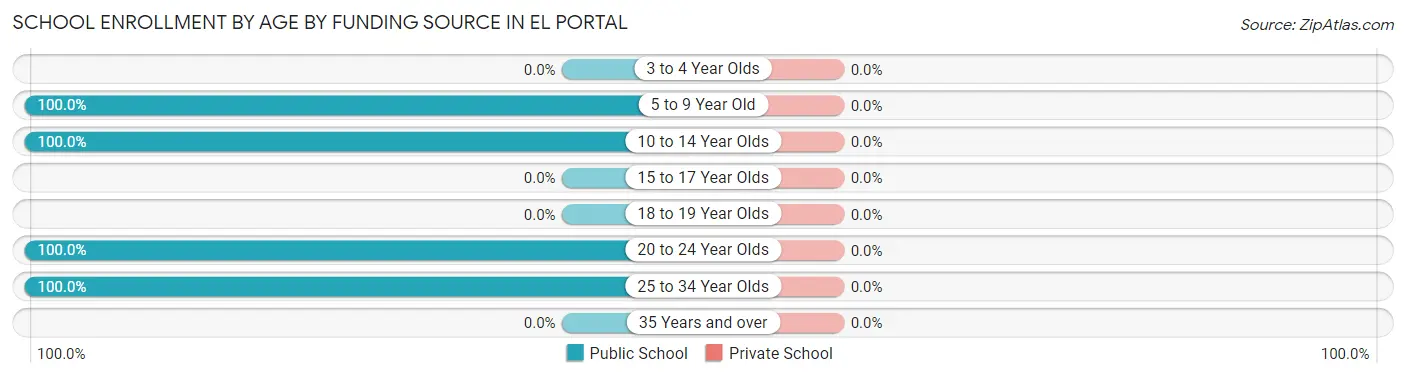
School Enrollment by Age by Funding Source in El Portal
| Age Bracket | Public School | Private School |
| 3 to 4 Year Olds | 0 (0.0%) | 0 (0.0%) |
| 5 to 9 Year Old | 77 (100.0%) | 0 (0.0%) |
| 10 to 14 Year Olds | 33 (100.0%) | 0 (0.0%) |
| 15 to 17 Year Olds | 0 (0.0%) | 0 (0.0%) |
| 18 to 19 Year Olds | 0 (0.0%) | 0 (0.0%) |
| 20 to 24 Year Olds | 34 (100.0%) | 0 (0.0%) |
| 25 to 34 Year Olds | 4 (100.0%) | 0 (0.0%) |
| 35 Years and over | 0 (0.0%) | 0 (0.0%) |
| Total | 148 (100.0%) | 0 (0.0%) |
Educational Attainment by Field of Study in El Portal
Bio, nature & agricultural (100 | 30.1%), multidisciplinary studies (57 | 17.2%), arts & humanities (49 | 14.8%), physical & health sciences (43 | 13.0%), and education (42 | 12.7%) are the most common fields of study among 332 individuals in El Portal who have obtained a bachelor's degree or higher.
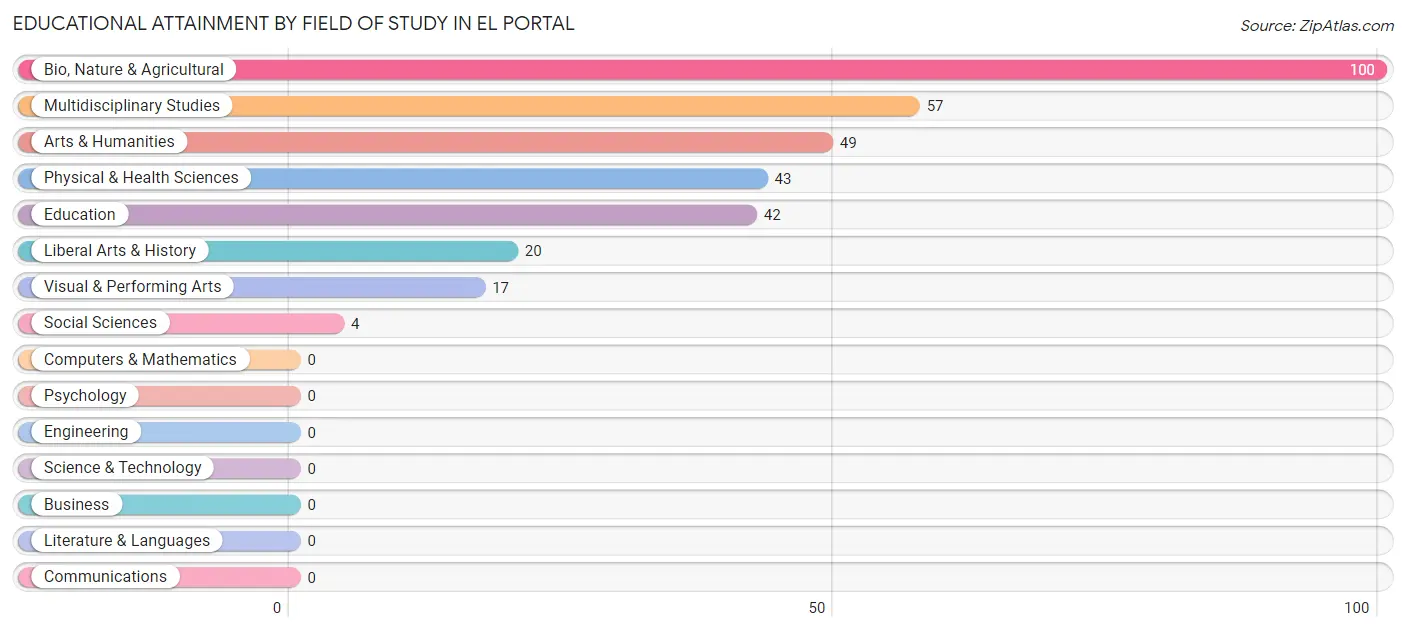
| Field of Study | # Graduates | % Graduates |
| Computers & Mathematics | 0 | 0.0% |
| Bio, Nature & Agricultural | 100 | 30.1% |
| Physical & Health Sciences | 43 | 13.0% |
| Psychology | 0 | 0.0% |
| Social Sciences | 4 | 1.2% |
| Engineering | 0 | 0.0% |
| Multidisciplinary Studies | 57 | 17.2% |
| Science & Technology | 0 | 0.0% |
| Business | 0 | 0.0% |
| Education | 42 | 12.7% |
| Literature & Languages | 0 | 0.0% |
| Liberal Arts & History | 20 | 6.0% |
| Visual & Performing Arts | 17 | 5.1% |
| Communications | 0 | 0.0% |
| Arts & Humanities | 49 | 14.8% |
| Total | 332 | 100.0% |
Transportation & Commute in El Portal
Vehicle Availability by Sex in El Portal
The most prevalent vehicle ownership categories in El Portal are males with 2 vehicles (58, accounting for 65.2%) and females with 2 vehicles (132, making up 27.6%).
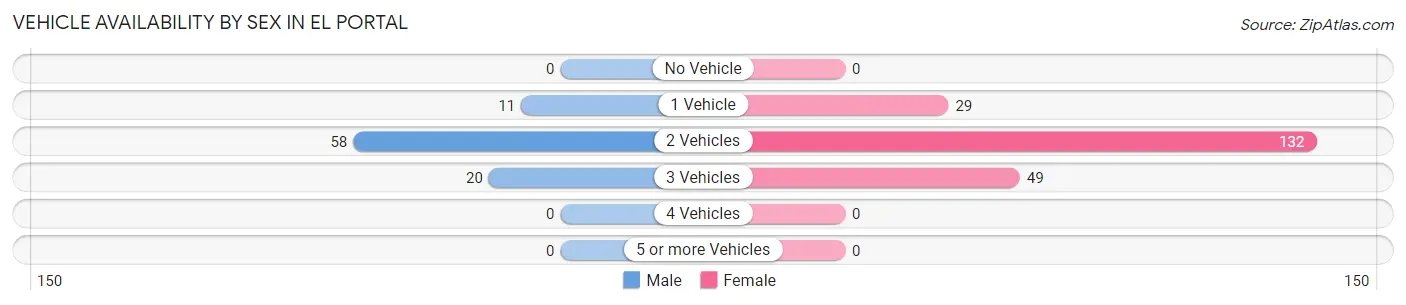
| Vehicles Available | Male | Female |
| No Vehicle | 0 (0.0%) | 0 (0.0%) |
| 1 Vehicle | 11 (12.4%) | 29 (13.8%) |
| 2 Vehicles | 58 (65.2%) | 132 (62.9%) |
| 3 Vehicles | 20 (22.5%) | 49 (23.3%) |
| 4 Vehicles | 0 (0.0%) | 0 (0.0%) |
| 5 or more Vehicles | 0 (0.0%) | 0 (0.0%) |
| Total | 89 (100.0%) | 210 (100.0%) |
Commute Time in El Portal
The most frequently occuring commute durations in El Portal are 5 to 9 minutes (82 commuters, 29.4%), 30 to 34 minutes (74 commuters, 26.5%), and less than 5 minutes (54 commuters, 19.4%).
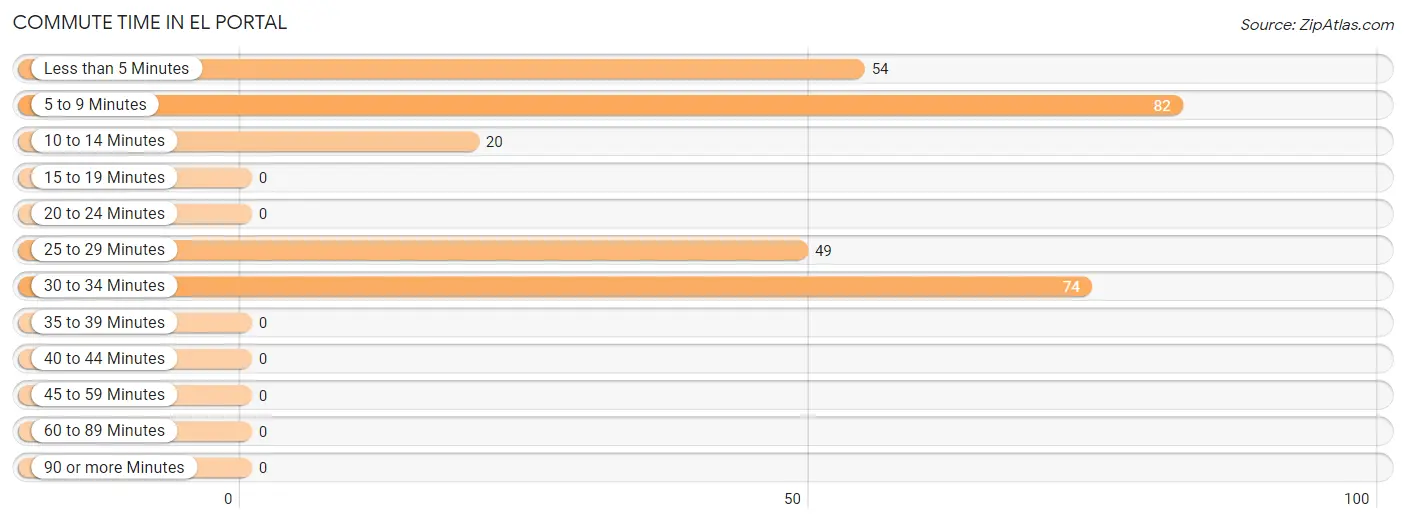
| Commute Time | # Commuters | % Commuters |
| Less than 5 Minutes | 54 | 19.4% |
| 5 to 9 Minutes | 82 | 29.4% |
| 10 to 14 Minutes | 20 | 7.2% |
| 15 to 19 Minutes | 0 | 0.0% |
| 20 to 24 Minutes | 0 | 0.0% |
| 25 to 29 Minutes | 49 | 17.6% |
| 30 to 34 Minutes | 74 | 26.5% |
| 35 to 39 Minutes | 0 | 0.0% |
| 40 to 44 Minutes | 0 | 0.0% |
| 45 to 59 Minutes | 0 | 0.0% |
| 60 to 89 Minutes | 0 | 0.0% |
| 90 or more Minutes | 0 | 0.0% |
Commute Time by Sex in El Portal
The most common commute times in El Portal are 5 to 9 minutes (31 commuters, 39.7%) for males and 30 to 34 minutes (59 commuters, 29.3%) for females.
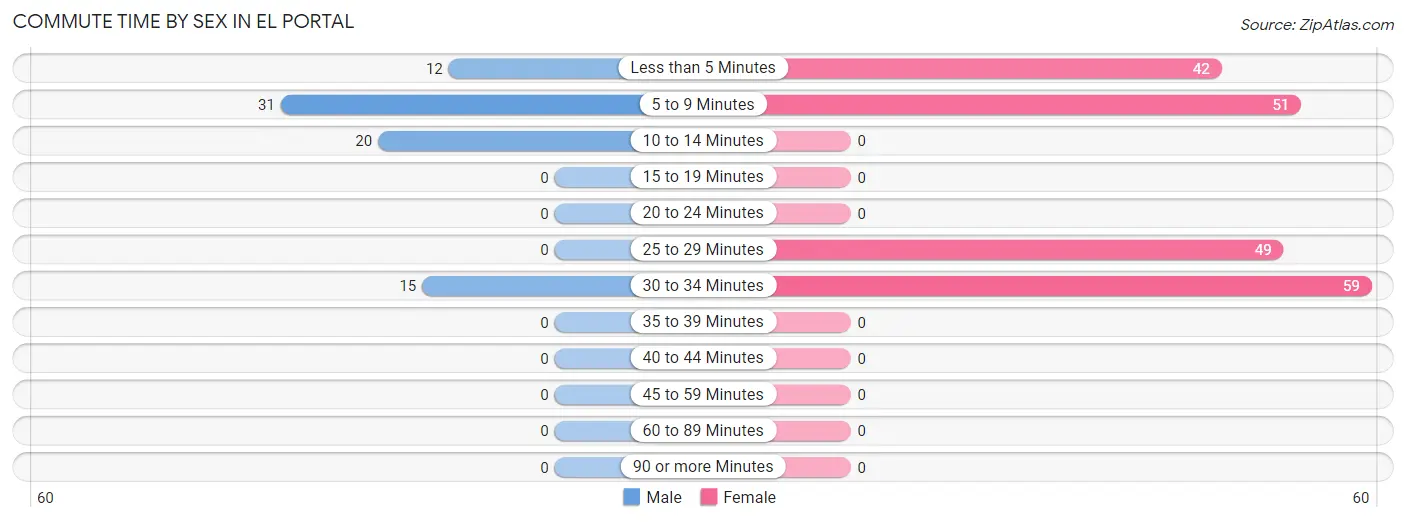
| Commute Time | Male | Female |
| Less than 5 Minutes | 12 (15.4%) | 42 (20.9%) |
| 5 to 9 Minutes | 31 (39.7%) | 51 (25.4%) |
| 10 to 14 Minutes | 20 (25.6%) | 0 (0.0%) |
| 15 to 19 Minutes | 0 (0.0%) | 0 (0.0%) |
| 20 to 24 Minutes | 0 (0.0%) | 0 (0.0%) |
| 25 to 29 Minutes | 0 (0.0%) | 49 (24.4%) |
| 30 to 34 Minutes | 15 (19.2%) | 59 (29.3%) |
| 35 to 39 Minutes | 0 (0.0%) | 0 (0.0%) |
| 40 to 44 Minutes | 0 (0.0%) | 0 (0.0%) |
| 45 to 59 Minutes | 0 (0.0%) | 0 (0.0%) |
| 60 to 89 Minutes | 0 (0.0%) | 0 (0.0%) |
| 90 or more Minutes | 0 (0.0%) | 0 (0.0%) |
Time of Departure to Work by Sex in El Portal
The most frequent times of departure to work in El Portal are 8:00 AM to 8:29 AM (43, 55.1%) for males and 8:00 AM to 8:29 AM (85, 42.3%) for females.
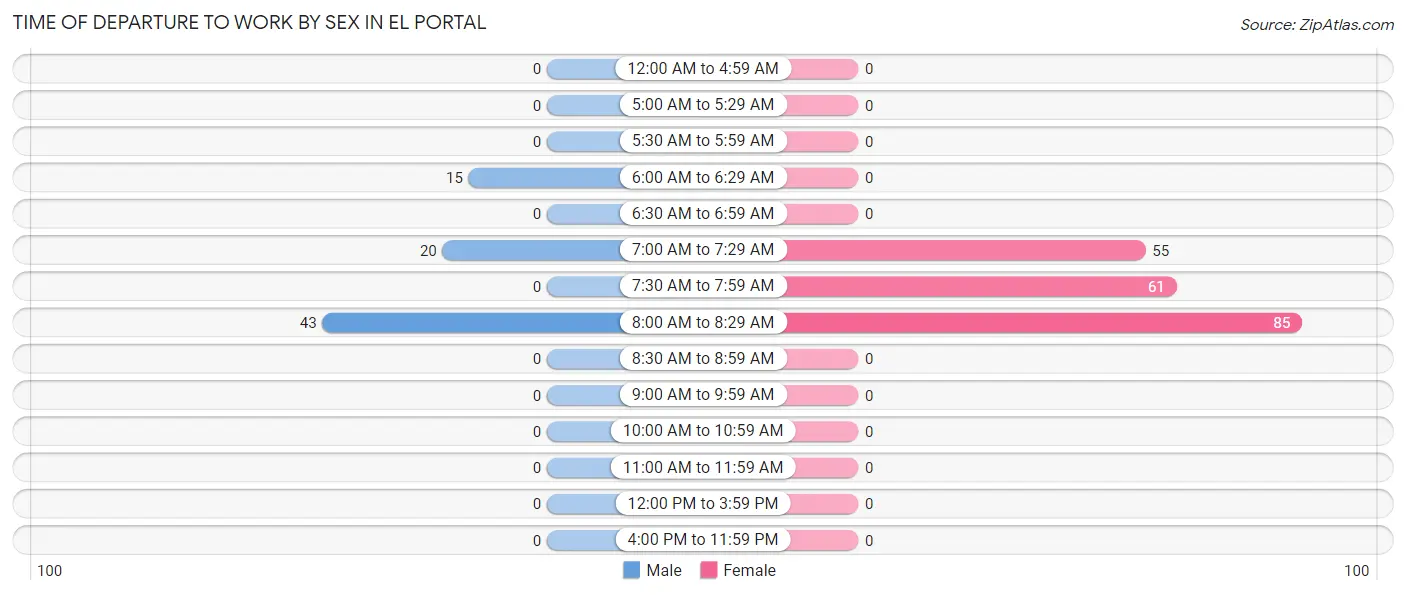
| Time of Departure | Male | Female |
| 12:00 AM to 4:59 AM | 0 (0.0%) | 0 (0.0%) |
| 5:00 AM to 5:29 AM | 0 (0.0%) | 0 (0.0%) |
| 5:30 AM to 5:59 AM | 0 (0.0%) | 0 (0.0%) |
| 6:00 AM to 6:29 AM | 15 (19.2%) | 0 (0.0%) |
| 6:30 AM to 6:59 AM | 0 (0.0%) | 0 (0.0%) |
| 7:00 AM to 7:29 AM | 20 (25.6%) | 55 (27.4%) |
| 7:30 AM to 7:59 AM | 0 (0.0%) | 61 (30.3%) |
| 8:00 AM to 8:29 AM | 43 (55.1%) | 85 (42.3%) |
| 8:30 AM to 8:59 AM | 0 (0.0%) | 0 (0.0%) |
| 9:00 AM to 9:59 AM | 0 (0.0%) | 0 (0.0%) |
| 10:00 AM to 10:59 AM | 0 (0.0%) | 0 (0.0%) |
| 11:00 AM to 11:59 AM | 0 (0.0%) | 0 (0.0%) |
| 12:00 PM to 3:59 PM | 0 (0.0%) | 0 (0.0%) |
| 4:00 PM to 11:59 PM | 0 (0.0%) | 0 (0.0%) |
| Total | 78 (100.0%) | 201 (100.0%) |
Housing Occupancy in El Portal
Occupancy by Ownership in El Portal
Of the total 240 dwellings in El Portal, owner-occupied units account for 151 (62.9%), while renter-occupied units make up 89 (37.1%).
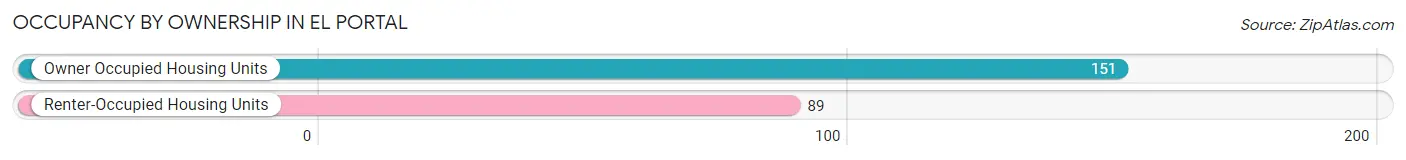
| Occupancy | # Housing Units | % Housing Units |
| Owner Occupied Housing Units | 151 | 62.9% |
| Renter-Occupied Housing Units | 89 | 37.1% |
| Total Occupied Housing Units | 240 | 100.0% |
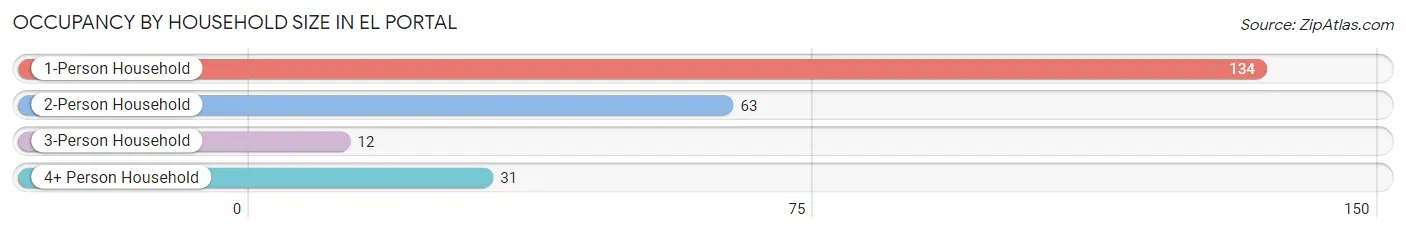
Occupancy by Household Size in El Portal
| Household Size | # Housing Units | % Housing Units |
| 1-Person Household | 134 | 55.8% |
| 2-Person Household | 63 | 26.3% |
| 3-Person Household | 12 | 5.0% |
| 4+ Person Household | 31 | 12.9% |
| Total Housing Units | 240 | 100.0% |
Occupancy by Ownership by Household Size in El Portal
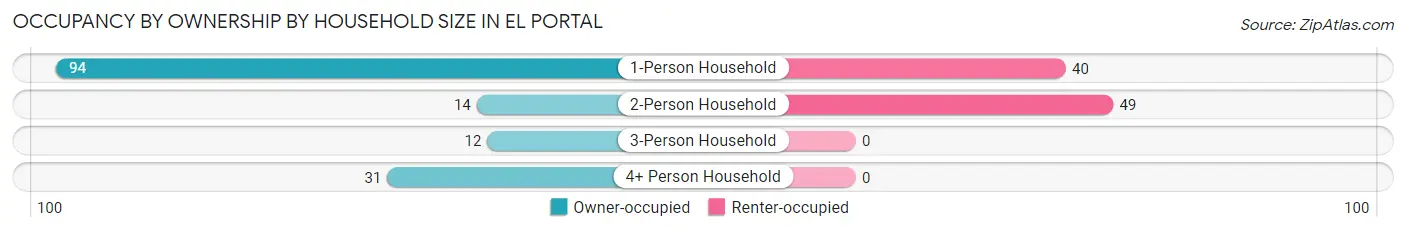
| Household Size | Owner-occupied | Renter-occupied |
| 1-Person Household | 94 (70.2%) | 40 (29.8%) |
| 2-Person Household | 14 (22.2%) | 49 (77.8%) |
| 3-Person Household | 12 (100.0%) | 0 (0.0%) |
| 4+ Person Household | 31 (100.0%) | 0 (0.0%) |
| Total Housing Units | 151 (62.9%) | 89 (37.1%) |
Occupancy by Educational Attainment in El Portal
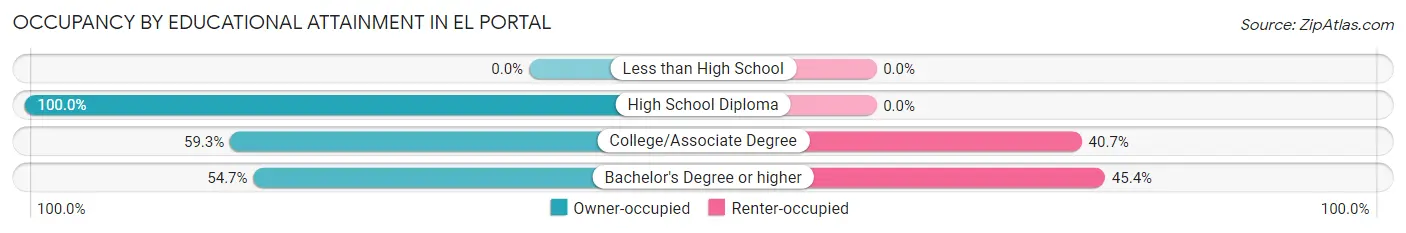
| Household Size | Owner-occupied | Renter-occupied |
| Less than High School | 0 (0.0%) | 0 (0.0%) |
| High School Diploma | 41 (100.0%) | 0 (0.0%) |
| College/Associate Degree | 16 (59.3%) | 11 (40.7%) |
| Bachelor's Degree or higher | 94 (54.6%) | 78 (45.4%) |
Occupancy by Age of Householder in El Portal
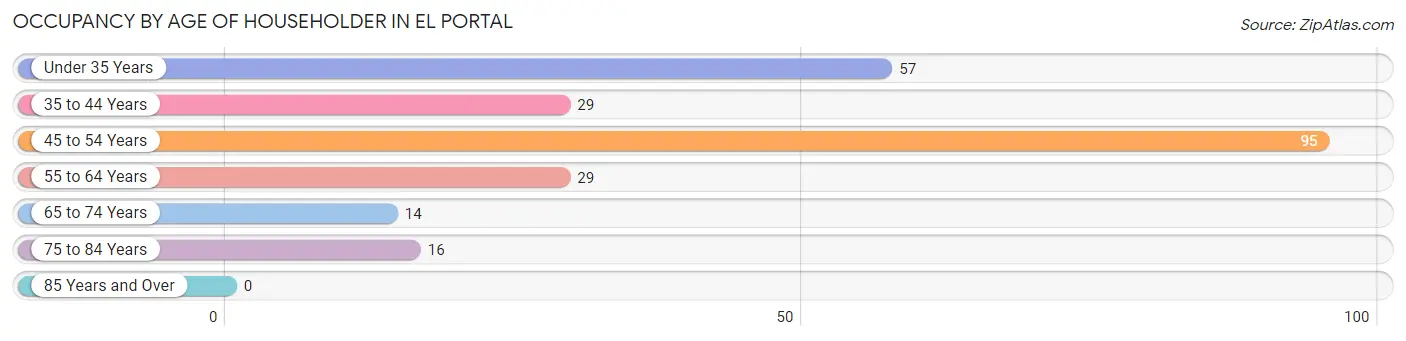
| Age Bracket | # Households | % Households |
| Under 35 Years | 57 | 23.7% |
| 35 to 44 Years | 29 | 12.1% |
| 45 to 54 Years | 95 | 39.6% |
| 55 to 64 Years | 29 | 12.1% |
| 65 to 74 Years | 14 | 5.8% |
| 75 to 84 Years | 16 | 6.7% |
| 85 Years and Over | 0 | 0.0% |
| Total | 240 | 100.0% |
Housing Finances in El Portal
Median Income by Occupancy in El Portal
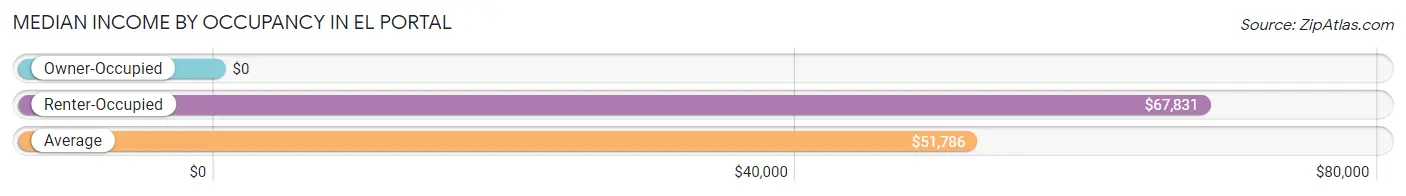
| Occupancy Type | # Households | Median Income |
| Owner-Occupied | 151 (62.9%) | $0 |
| Renter-Occupied | 89 (37.1%) | $67,831 |
| Average | 240 (100.0%) | $51,786 |
Occupancy by Householder Income Bracket in El Portal
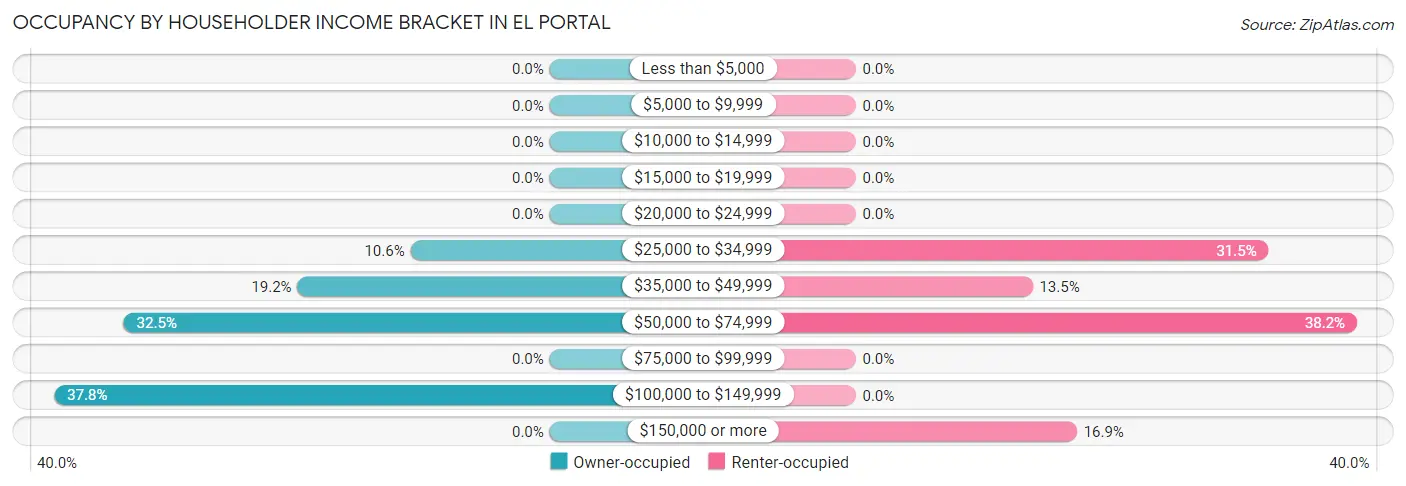
| Income Bracket | Owner-occupied | Renter-occupied |
| Less than $5,000 | 0 (0.0%) | 0 (0.0%) |
| $5,000 to $9,999 | 0 (0.0%) | 0 (0.0%) |
| $10,000 to $14,999 | 0 (0.0%) | 0 (0.0%) |
| $15,000 to $19,999 | 0 (0.0%) | 0 (0.0%) |
| $20,000 to $24,999 | 0 (0.0%) | 0 (0.0%) |
| $25,000 to $34,999 | 16 (10.6%) | 28 (31.5%) |
| $35,000 to $49,999 | 29 (19.2%) | 12 (13.5%) |
| $50,000 to $74,999 | 49 (32.5%) | 34 (38.2%) |
| $75,000 to $99,999 | 0 (0.0%) | 0 (0.0%) |
| $100,000 to $149,999 | 57 (37.8%) | 0 (0.0%) |
| $150,000 or more | 0 (0.0%) | 15 (16.9%) |
| Total | 151 (100.0%) | 89 (100.0%) |
Monthly Housing Cost Tiers in El Portal
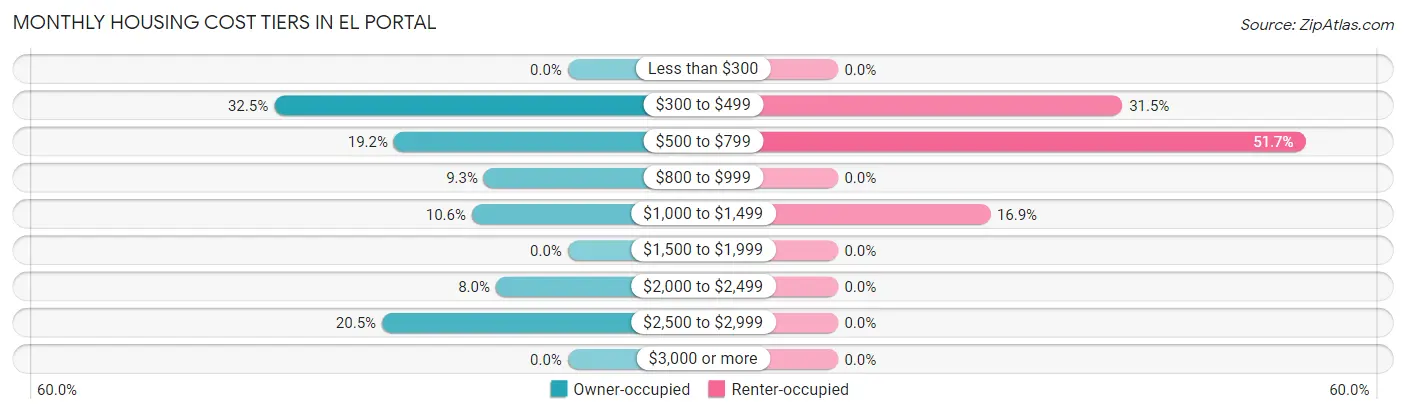
| Monthly Cost | Owner-occupied | Renter-occupied |
| Less than $300 | 0 (0.0%) | 0 (0.0%) |
| $300 to $499 | 49 (32.5%) | 28 (31.5%) |
| $500 to $799 | 29 (19.2%) | 46 (51.7%) |
| $800 to $999 | 14 (9.3%) | 0 (0.0%) |
| $1,000 to $1,499 | 16 (10.6%) | 15 (16.9%) |
| $1,500 to $1,999 | 0 (0.0%) | 0 (0.0%) |
| $2,000 to $2,499 | 12 (8.0%) | 0 (0.0%) |
| $2,500 to $2,999 | 31 (20.5%) | 0 (0.0%) |
| $3,000 or more | 0 (0.0%) | 0 (0.0%) |
| Total | 151 (100.0%) | 89 (100.0%) |
Physical Housing Characteristics in El Portal
Housing Structures in El Portal
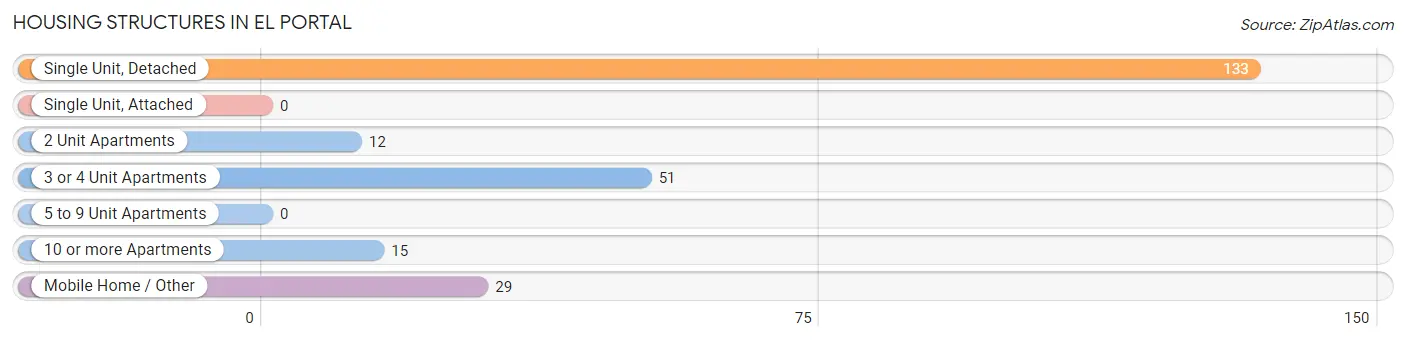
| Structure Type | # Housing Units | % Housing Units |
| Single Unit, Detached | 133 | 55.4% |
| Single Unit, Attached | 0 | 0.0% |
| 2 Unit Apartments | 12 | 5.0% |
| 3 or 4 Unit Apartments | 51 | 21.2% |
| 5 to 9 Unit Apartments | 0 | 0.0% |
| 10 or more Apartments | 15 | 6.2% |
| Mobile Home / Other | 29 | 12.1% |
| Total | 240 | 100.0% |
Housing Structures by Occupancy in El Portal
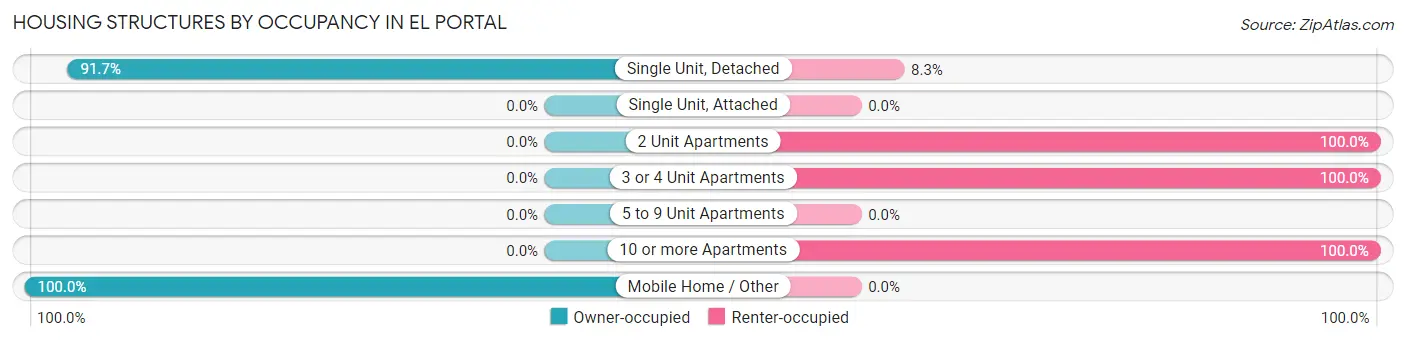
| Structure Type | Owner-occupied | Renter-occupied |
| Single Unit, Detached | 122 (91.7%) | 11 (8.3%) |
| Single Unit, Attached | 0 (0.0%) | 0 (0.0%) |
| 2 Unit Apartments | 0 (0.0%) | 12 (100.0%) |
| 3 or 4 Unit Apartments | 0 (0.0%) | 51 (100.0%) |
| 5 to 9 Unit Apartments | 0 (0.0%) | 0 (0.0%) |
| 10 or more Apartments | 0 (0.0%) | 15 (100.0%) |
| Mobile Home / Other | 29 (100.0%) | 0 (0.0%) |
| Total | 151 (62.9%) | 89 (37.1%) |
Housing Structures by Number of Rooms in El Portal
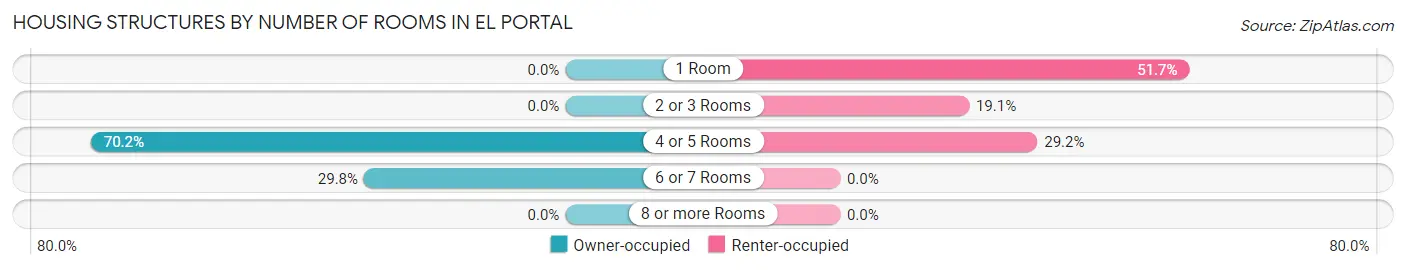
| Number of Rooms | Owner-occupied | Renter-occupied |
| 1 Room | 0 (0.0%) | 46 (51.7%) |
| 2 or 3 Rooms | 0 (0.0%) | 17 (19.1%) |
| 4 or 5 Rooms | 106 (70.2%) | 26 (29.2%) |
| 6 or 7 Rooms | 45 (29.8%) | 0 (0.0%) |
| 8 or more Rooms | 0 (0.0%) | 0 (0.0%) |
| Total | 151 (100.0%) | 89 (100.0%) |
Housing Structure by Heating Type in El Portal
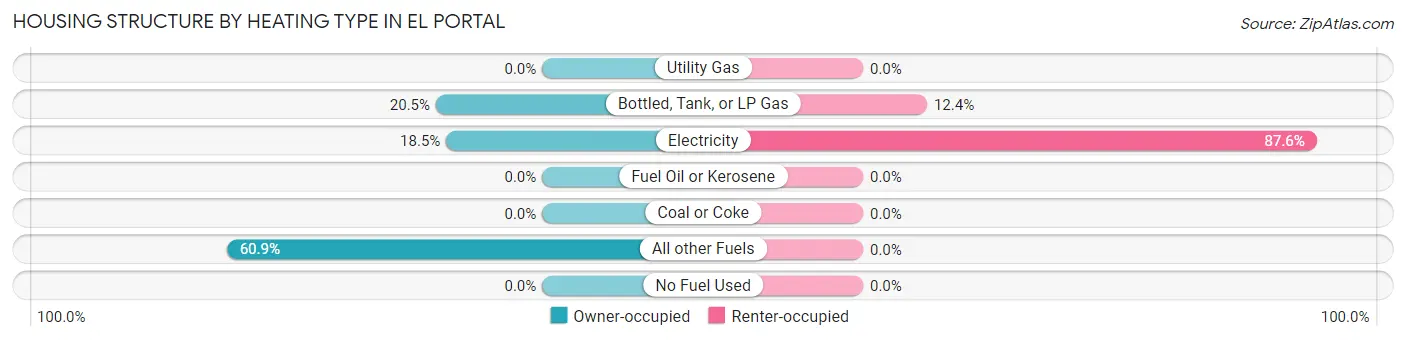
| Heating Type | Owner-occupied | Renter-occupied |
| Utility Gas | 0 (0.0%) | 0 (0.0%) |
| Bottled, Tank, or LP Gas | 31 (20.5%) | 11 (12.4%) |
| Electricity | 28 (18.5%) | 78 (87.6%) |
| Fuel Oil or Kerosene | 0 (0.0%) | 0 (0.0%) |
| Coal or Coke | 0 (0.0%) | 0 (0.0%) |
| All other Fuels | 92 (60.9%) | 0 (0.0%) |
| No Fuel Used | 0 (0.0%) | 0 (0.0%) |
| Total | 151 (100.0%) | 89 (100.0%) |
Household Vehicle Usage in El Portal
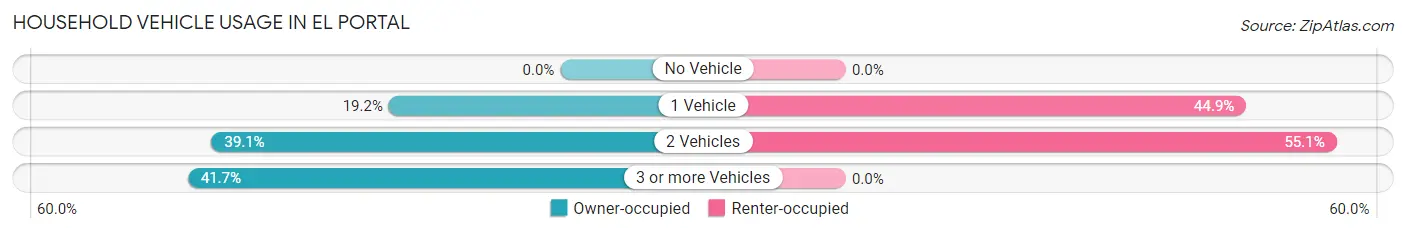
| Vehicles per Household | Owner-occupied | Renter-occupied |
| No Vehicle | 0 (0.0%) | 0 (0.0%) |
| 1 Vehicle | 29 (19.2%) | 40 (44.9%) |
| 2 Vehicles | 59 (39.1%) | 49 (55.1%) |
| 3 or more Vehicles | 63 (41.7%) | 0 (0.0%) |
| Total | 151 (100.0%) | 89 (100.0%) |
Real Estate & Mortgages in El Portal
Real Estate and Mortgage Overview in El Portal
| Characteristic | Without Mortgage | With Mortgage |
| Housing Units | 108 | 43 |
| Median Property Value | $241,500 | $0 |
| Median Household Income | $50,459 | $0 |
| Monthly Housing Costs | $617 | $0 |
| Real Estate Taxes | $963 | $0 |
Property Value by Mortgage Status in El Portal
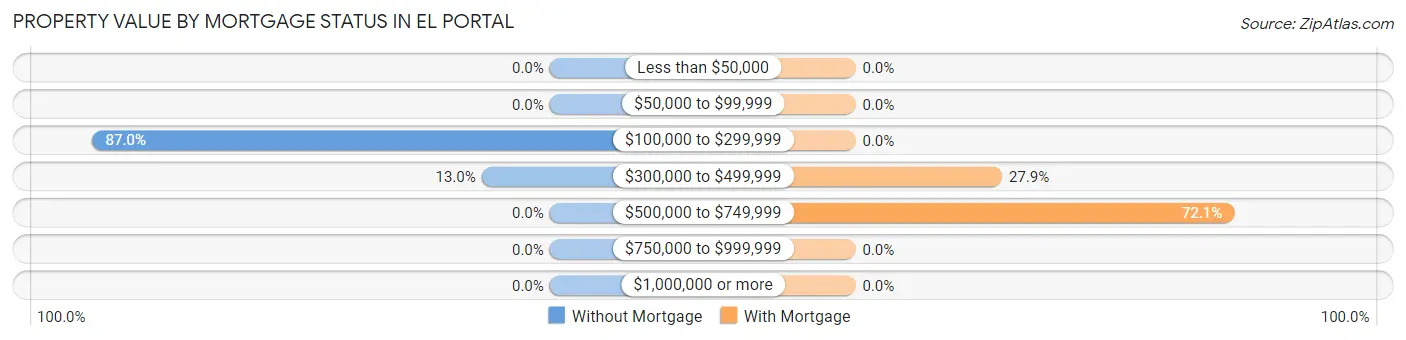
| Property Value | Without Mortgage | With Mortgage |
| Less than $50,000 | 0 (0.0%) | 0 (0.0%) |
| $50,000 to $99,999 | 0 (0.0%) | 0 (0.0%) |
| $100,000 to $299,999 | 94 (87.0%) | 0 (0.0%) |
| $300,000 to $499,999 | 14 (13.0%) | 12 (27.9%) |
| $500,000 to $749,999 | 0 (0.0%) | 31 (72.1%) |
| $750,000 to $999,999 | 0 (0.0%) | 0 (0.0%) |
| $1,000,000 or more | 0 (0.0%) | 0 (0.0%) |
| Total | 108 (100.0%) | 43 (100.0%) |
Household Income by Mortgage Status in El Portal
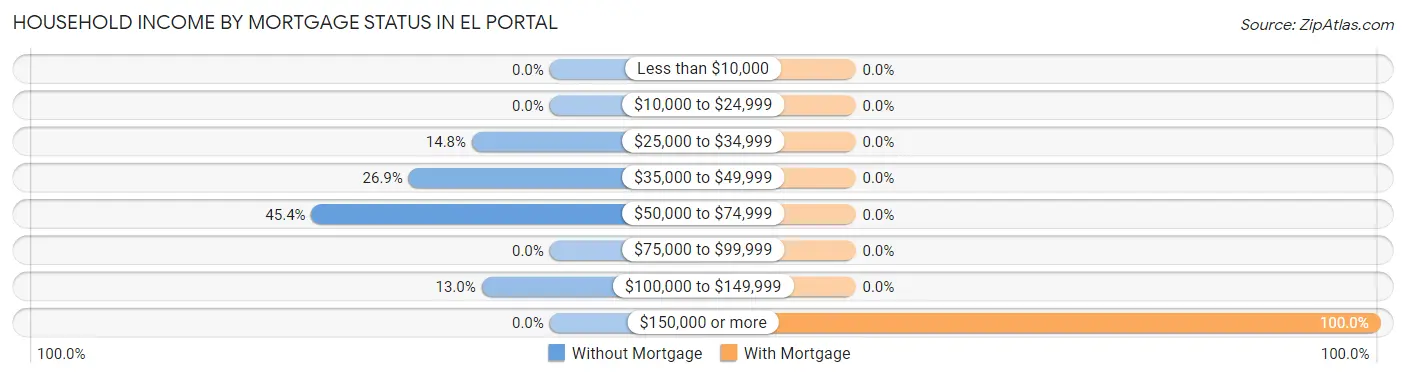
| Household Income | Without Mortgage | With Mortgage |
| Less than $10,000 | 0 (0.0%) | 0 (0.0%) |
| $10,000 to $24,999 | 0 (0.0%) | 0 (0.0%) |
| $25,000 to $34,999 | 16 (14.8%) | 0 (0.0%) |
| $35,000 to $49,999 | 29 (26.9%) | 0 (0.0%) |
| $50,000 to $74,999 | 49 (45.4%) | 0 (0.0%) |
| $75,000 to $99,999 | 0 (0.0%) | 0 (0.0%) |
| $100,000 to $149,999 | 14 (13.0%) | 0 (0.0%) |
| $150,000 or more | 0 (0.0%) | 43 (100.0%) |
| Total | 108 (100.0%) | 43 (100.0%) |
Property Value to Household Income Ratio in El Portal
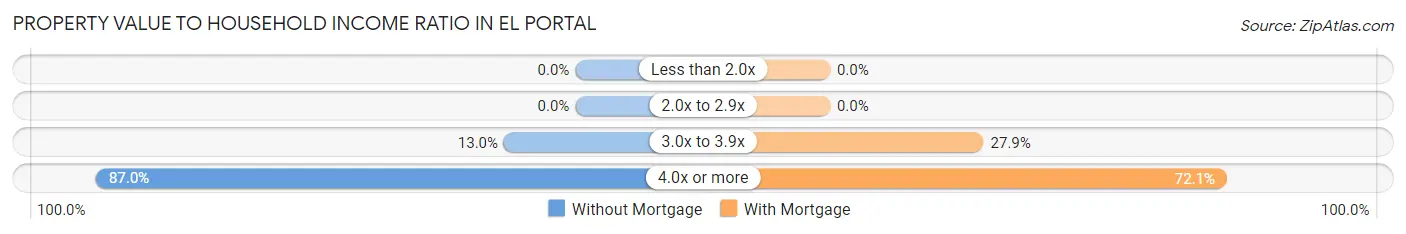
| Value-to-Income Ratio | Without Mortgage | With Mortgage |
| Less than 2.0x | 0 (0.0%) | 0 (0.0%) |
| 2.0x to 2.9x | 0 (0.0%) | 0 (0.0%) |
| 3.0x to 3.9x | 14 (13.0%) | 12 (27.9%) |
| 4.0x or more | 94 (87.0%) | 31 (72.1%) |
| Total | 108 (100.0%) | 43 (100.0%) |
Real Estate Taxes by Mortgage Status in El Portal
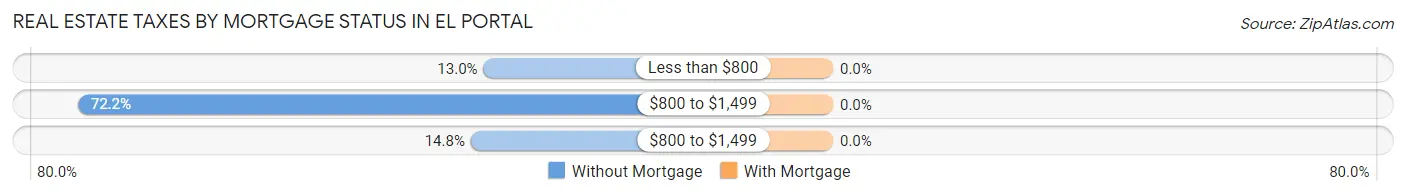
| Property Taxes | Without Mortgage | With Mortgage |
| Less than $800 | 14 (13.0%) | 0 (0.0%) |
| $800 to $1,499 | 78 (72.2%) | 0 (0.0%) |
| $800 to $1,499 | 16 (14.8%) | 0 (0.0%) |
| Total | 108 (100.0%) | 43 (100.0%) |
Health & Disability in El Portal
Health Insurance Coverage by Age in El Portal
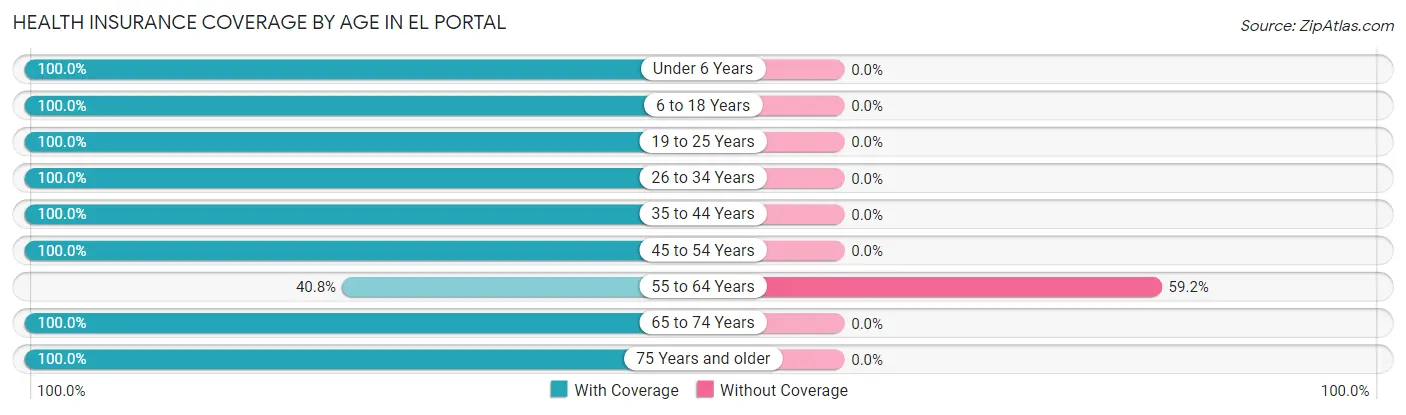
| Age Bracket | With Coverage | Without Coverage |
| Under 6 Years | 11 (100.0%) | 0 (0.0%) |
| 6 to 18 Years | 110 (100.0%) | 0 (0.0%) |
| 19 to 25 Years | 38 (100.0%) | 0 (0.0%) |
| 26 to 34 Years | 65 (100.0%) | 0 (0.0%) |
| 35 to 44 Years | 38 (100.0%) | 0 (0.0%) |
| 45 to 54 Years | 138 (100.0%) | 0 (0.0%) |
| 55 to 64 Years | 20 (40.8%) | 29 (59.2%) |
| 65 to 74 Years | 14 (100.0%) | 0 (0.0%) |
| 75 Years and older | 16 (100.0%) | 0 (0.0%) |
| Total | 450 (94.0%) | 29 (6.0%) |
Health Insurance Coverage by Citizenship Status in El Portal
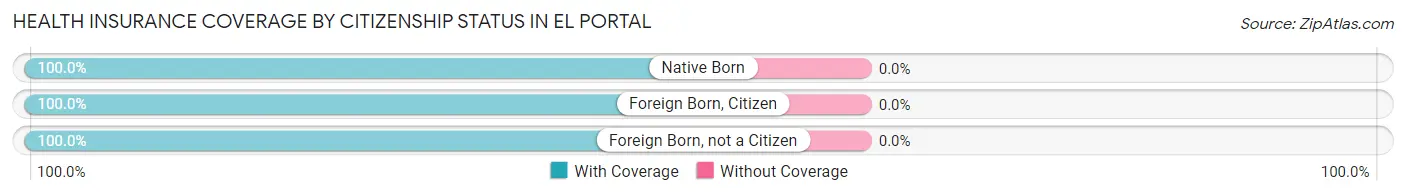
| Citizenship Status | With Coverage | Without Coverage |
| Native Born | 11 (100.0%) | 0 (0.0%) |
| Foreign Born, Citizen | 110 (100.0%) | 0 (0.0%) |
| Foreign Born, not a Citizen | 38 (100.0%) | 0 (0.0%) |
Health Insurance Coverage by Household Income in El Portal
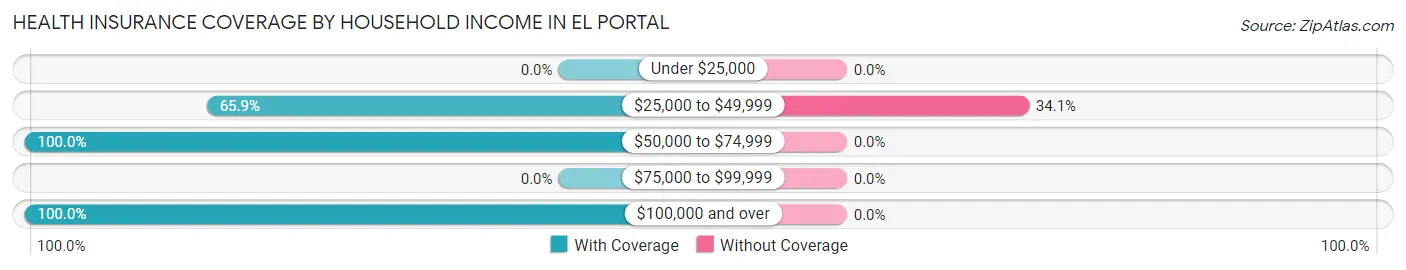
| Household Income | With Coverage | Without Coverage |
| Under $25,000 | 0 (0.0%) | 0 (0.0%) |
| $25,000 to $49,999 | 56 (65.9%) | 29 (34.1%) |
| $50,000 to $74,999 | 87 (100.0%) | 0 (0.0%) |
| $75,000 to $99,999 | 0 (0.0%) | 0 (0.0%) |
| $100,000 and over | 307 (100.0%) | 0 (0.0%) |
Public vs Private Health Insurance Coverage by Age in El Portal
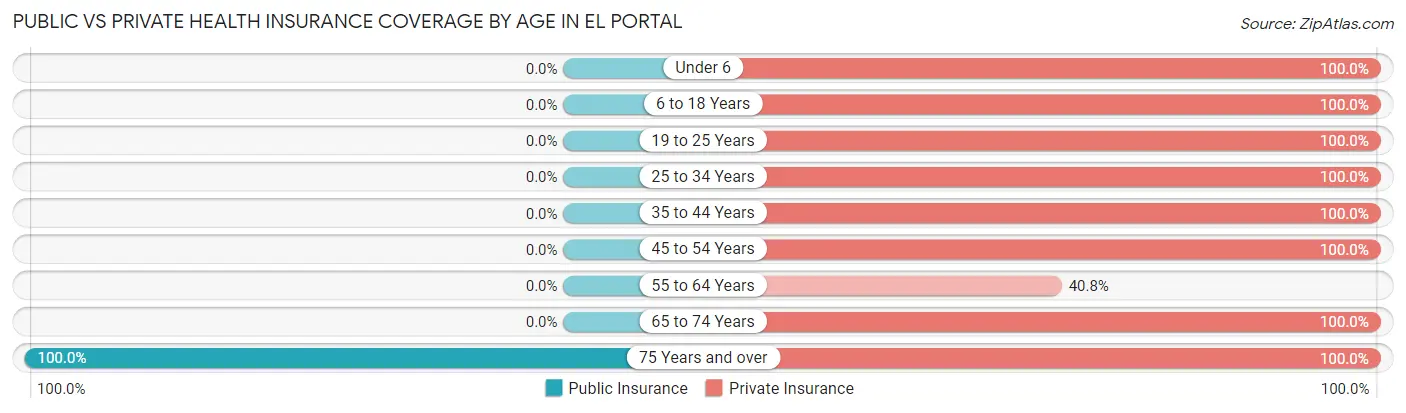
| Age Bracket | Public Insurance | Private Insurance |
| Under 6 | 0 (0.0%) | 11 (100.0%) |
| 6 to 18 Years | 0 (0.0%) | 110 (100.0%) |
| 19 to 25 Years | 0 (0.0%) | 38 (100.0%) |
| 25 to 34 Years | 0 (0.0%) | 65 (100.0%) |
| 35 to 44 Years | 0 (0.0%) | 38 (100.0%) |
| 45 to 54 Years | 0 (0.0%) | 138 (100.0%) |
| 55 to 64 Years | 0 (0.0%) | 20 (40.8%) |
| 65 to 74 Years | 0 (0.0%) | 14 (100.0%) |
| 75 Years and over | 16 (100.0%) | 16 (100.0%) |
| Total | 16 (3.3%) | 450 (94.0%) |
Disability Status by Sex by Age in El Portal
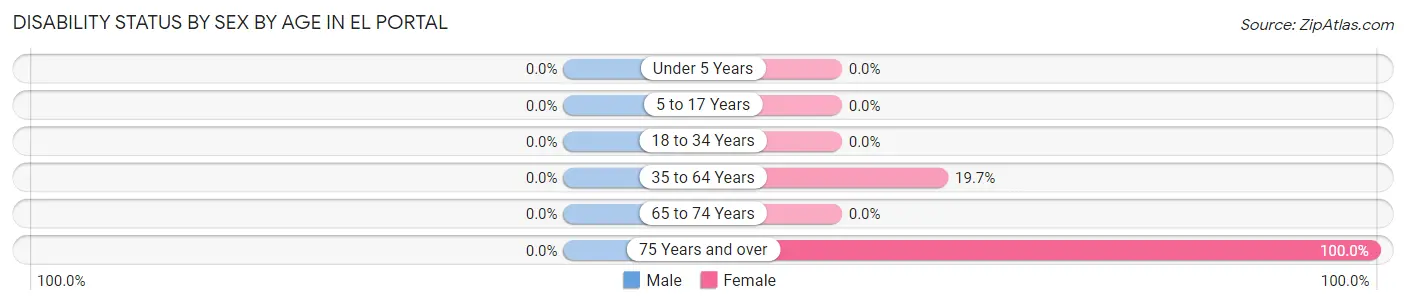
| Age Bracket | Male | Female |
| Under 5 Years | 0 (0.0%) | 0 (0.0%) |
| 5 to 17 Years | 0 (0.0%) | 0 (0.0%) |
| 18 to 34 Years | 0 (0.0%) | 0 (0.0%) |
| 35 to 64 Years | 0 (0.0%) | 29 (19.7%) |
| 65 to 74 Years | 0 (0.0%) | 0 (0.0%) |
| 75 Years and over | 0 (0.0%) | 16 (100.0%) |
Disability Class by Sex by Age in El Portal
Disability Class: Hearing Difficulty
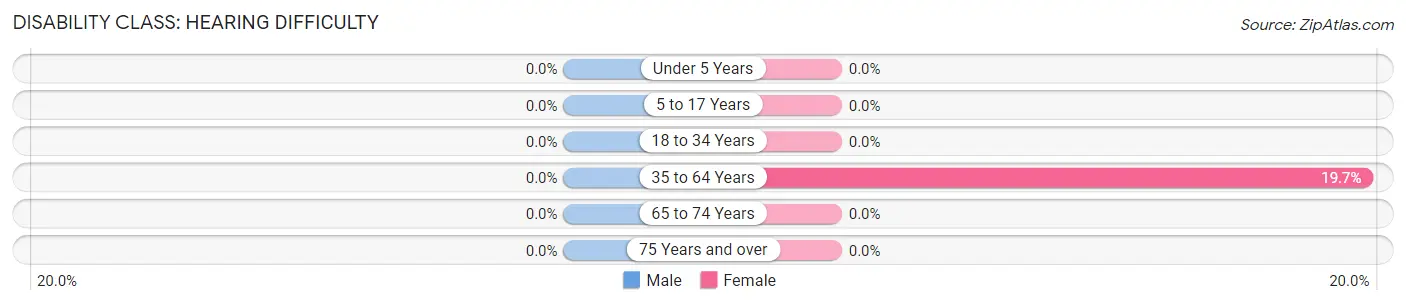
| Age Bracket | Male | Female |
| Under 5 Years | 0 (0.0%) | 0 (0.0%) |
| 5 to 17 Years | 0 (0.0%) | 0 (0.0%) |
| 18 to 34 Years | 0 (0.0%) | 0 (0.0%) |
| 35 to 64 Years | 0 (0.0%) | 29 (19.7%) |
| 65 to 74 Years | 0 (0.0%) | 0 (0.0%) |
| 75 Years and over | 0 (0.0%) | 0 (0.0%) |
Disability Class: Vision Difficulty
| Age Bracket | Male | Female |
| Under 5 Years | 0 (0.0%) | 0 (0.0%) |
| 5 to 17 Years | 0 (0.0%) | 0 (0.0%) |
| 18 to 34 Years | 0 (0.0%) | 0 (0.0%) |
| 35 to 64 Years | 0 (0.0%) | 0 (0.0%) |
| 65 to 74 Years | 0 (0.0%) | 0 (0.0%) |
| 75 Years and over | 0 (0.0%) | 0 (0.0%) |
Disability Class: Cognitive Difficulty
| Age Bracket | Male | Female |
| 5 to 17 Years | 0 (0.0%) | 0 (0.0%) |
| 18 to 34 Years | 0 (0.0%) | 0 (0.0%) |
| 35 to 64 Years | 0 (0.0%) | 0 (0.0%) |
| 65 to 74 Years | 0 (0.0%) | 0 (0.0%) |
| 75 Years and over | 0 (0.0%) | 0 (0.0%) |
Disability Class: Ambulatory Difficulty
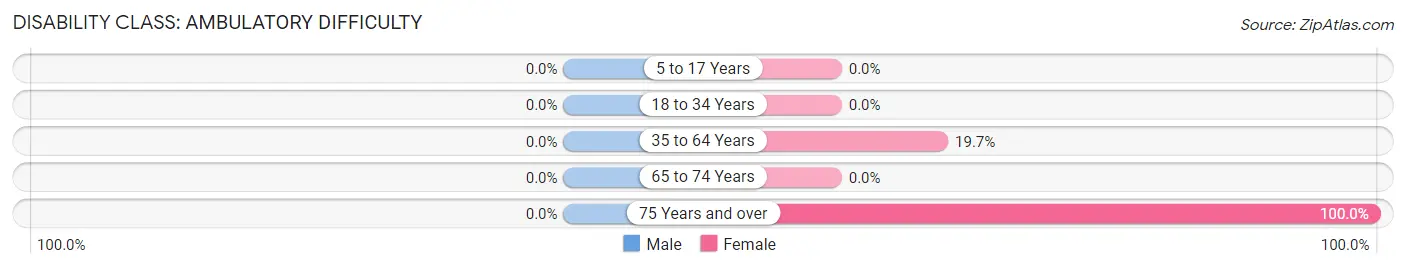
| Age Bracket | Male | Female |
| 5 to 17 Years | 0 (0.0%) | 0 (0.0%) |
| 18 to 34 Years | 0 (0.0%) | 0 (0.0%) |
| 35 to 64 Years | 0 (0.0%) | 29 (19.7%) |
| 65 to 74 Years | 0 (0.0%) | 0 (0.0%) |
| 75 Years and over | 0 (0.0%) | 16 (100.0%) |
Disability Class: Self-Care Difficulty
| Age Bracket | Male | Female |
| 5 to 17 Years | 0 (0.0%) | 0 (0.0%) |
| 18 to 34 Years | 0 (0.0%) | 0 (0.0%) |
| 35 to 64 Years | 0 (0.0%) | 0 (0.0%) |
| 65 to 74 Years | 0 (0.0%) | 0 (0.0%) |
| 75 Years and over | 0 (0.0%) | 0 (0.0%) |
Technology Access in El Portal
Computing Device Access in El Portal
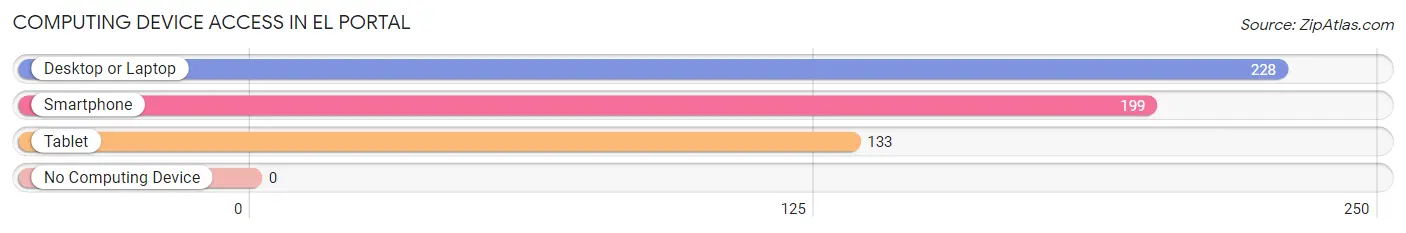
| Device Type | # Households | % Households |
| Desktop or Laptop | 228 | 95.0% |
| Smartphone | 199 | 82.9% |
| Tablet | 133 | 55.4% |
| No Computing Device | 0 | 0.0% |
| Total | 240 | 100.0% |
Internet Access in El Portal
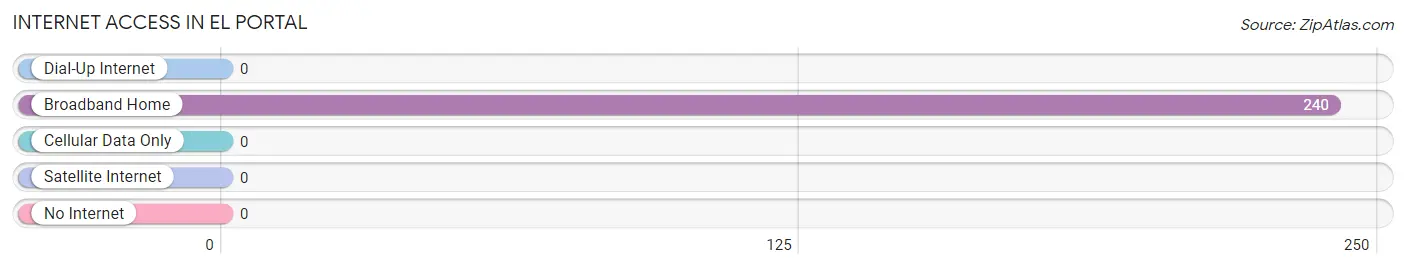
| Internet Type | # Households | % Households |
| Dial-Up Internet | 0 | 0.0% |
| Broadband Home | 240 | 100.0% |
| Cellular Data Only | 0 | 0.0% |
| Satellite Internet | 0 | 0.0% |
| No Internet | 0 | 0.0% |
| Total | 240 | 100.0% |
El Portal Summary
History
El Portal is a small unincorporated community located in Mariposa County, California. It is situated in the Sierra Nevada foothills, approximately 8 miles east of the Yosemite National Park entrance. The area was first inhabited by the Ahwahneechee Native Americans, who lived in the area for thousands of years before the arrival of European settlers.
The first European settlers arrived in the area in the mid-1800s, and the town of El Portal was established in 1875. The town was named after the nearby El Portal Bridge, which was built in 1875 to span the Merced River. The bridge was the first bridge to span the river, and it was a major transportation route for the area.
The town of El Portal grew slowly over the years, and by the early 1900s it had become a popular tourist destination. The town was known for its scenic beauty, and it was a popular spot for fishing, camping, and other outdoor activities.
In the late 1940s, the town was chosen as the site of the Yosemite National Park entrance. This brought a large influx of tourists to the area, and the town began to grow rapidly. By the late 1950s, the town had become a popular destination for tourists from all over the world.
Geography
El Portal is located in the Sierra Nevada foothills, approximately 8 miles east of the Yosemite National Park entrance. The town is situated at an elevation of 2,000 feet, and it is surrounded by the Merced River and the Sierra National Forest. The town is located in a temperate climate, with hot summers and mild winters.
The town is located in a rural area, and it is surrounded by rolling hills and forests. The town is home to a variety of wildlife, including deer, bears, and other animals. The town is also home to a variety of birds, including hawks, eagles, and other species.
Economy
The economy of El Portal is largely based on tourism. The town is a popular destination for tourists from all over the world, and it is home to a variety of hotels, restaurants, and other businesses that cater to tourists. The town is also home to a variety of outdoor activities, including fishing, camping, and hiking.
The town is also home to a variety of small businesses, including shops, restaurants, and other services. The town is also home to a variety of art galleries, museums, and other cultural attractions.
Demographics
As of the 2010 census, the population of El Portal was 1,845. The town is predominantly white, with a small Hispanic population. The median household income in the town is $45,000, and the median home value is $250,000. The town has a low unemployment rate, and the majority of the population is employed in the tourism industry.
Common Questions
What is Per Capita Income in El Portal?
Per Capita income in El Portal is $42,990.
What is the Median Family Income in El Portal?
Median Family Income in El Portal is $143,669.
What is the Median Household income in El Portal?
Median Household Income in El Portal is $51,786.
What is Income or Wage Gap in El Portal?
Income or Wage Gap in El Portal is 37.3%.
Women in El Portal earn 62.7 cents for every dollar earned by a man.
What is Inequality or Gini Index in El Portal?
Inequality or Gini Index in El Portal is 0.33.
What is the Total Population of El Portal?
Total Population of El Portal is 479.
What is the Total Male Population of El Portal?
Total Male Population of El Portal is 133.
What is the Total Female Population of El Portal?
Total Female Population of El Portal is 346.
What is the Ratio of Males per 100 Females in El Portal?
There are 38.44 Males per 100 Females in El Portal.
What is the Ratio of Females per 100 Males in El Portal?
There are 260.15 Females per 100 Males in El Portal.
What is the Median Population Age in El Portal?
Median Population Age in El Portal is 36.6 Years.
What is the Average Family Size in El Portal
Average Family Size in El Portal is 4.4 People.
What is the Average Household Size in El Portal
Average Household Size in El Portal is 2.0 People.
How Large is the Labor Force in El Portal?
There are 299 People in the Labor Forcein in El Portal.
What is the Percentage of People in the Labor Force in El Portal?
83.5% of People are in the Labor Force in El Portal.