Copper Mountain, CO Map & Demographics
Copper Mountain Map
Copper Mountain Overview
$56,871
PER CAPITA INCOME
$117,926
AVG HOUSEHOLD INCOME
0.16
INEQUALITY / GINI INDEX
285
TOTAL POPULATION
241
MALE POPULATION
44
FEMALE POPULATION
547.73
MALES / 100 FEMALES
18.26
FEMALES / 100 MALES
57.1
MEDIAN AGE
1.9
AVG FAMILY SIZE
1.3
AVG HOUSEHOLD SIZE
205
LABOR FORCE [ PEOPLE ]
71.9%
PERCENT IN LABOR FORCE
Income in Copper Mountain
Income Overview in Copper Mountain
| Characteristic | Number | Measure |
| Per Capita Income | 285 | $56,871 |
| Median Family Income | 44 | $0 |
| Mean Family Income | 44 | $0 |
| Median Household Income | 141 | $117,926 |
| Mean Household Income | 141 | $105,995 |
| Income Deficit | 44 | $0 |
| Wage / Income Gap (%) | 285 | 0.00% |
| Wage / Income Gap ($) | 285 | 100.00¢ per $1 |
| Gini / Inequality Index | 285 | 0.16 |
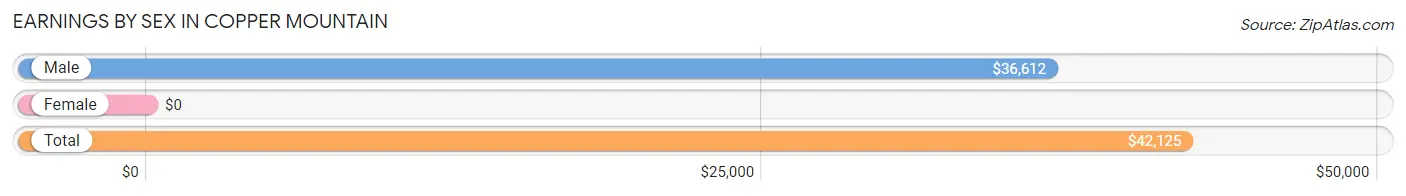
Earnings by Sex in Copper Mountain
| Sex | Number | Average Earnings |
| Male | 241 (84.6%) | $36,612 |
| Female | 44 (15.4%) | $0 |
| Total | 285 (100.0%) | $42,125 |
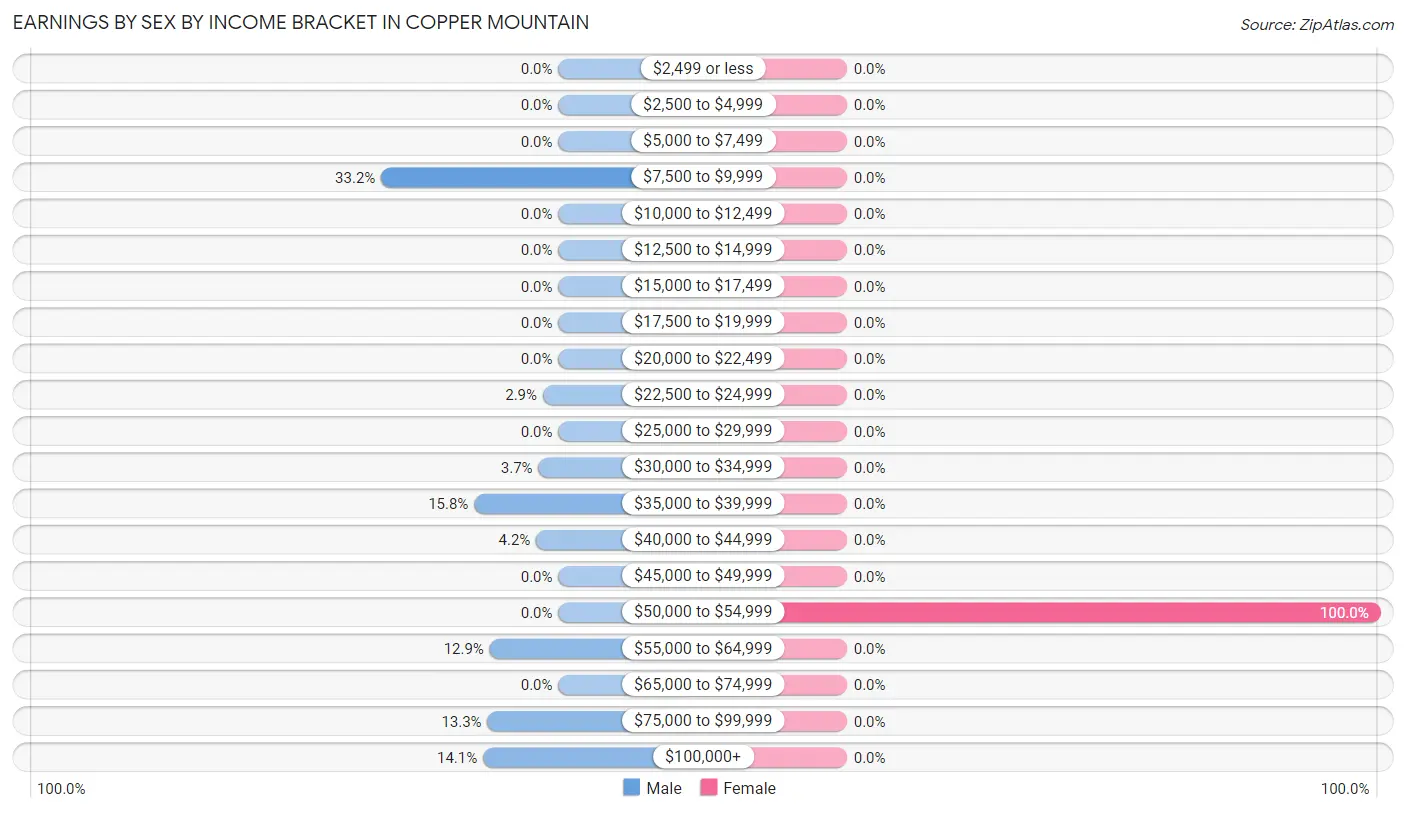
Earnings by Sex by Income Bracket in Copper Mountain
The most common earnings brackets in Copper Mountain are $7,500 to $9,999 for men (80 | 33.2%) and $50,000 to $54,999 for women (44 | 100.0%).
| Income | Male | Female |
| $2,499 or less | 0 (0.0%) | 0 (0.0%) |
| $2,500 to $4,999 | 0 (0.0%) | 0 (0.0%) |
| $5,000 to $7,499 | 0 (0.0%) | 0 (0.0%) |
| $7,500 to $9,999 | 80 (33.2%) | 0 (0.0%) |
| $10,000 to $12,499 | 0 (0.0%) | 0 (0.0%) |
| $12,500 to $14,999 | 0 (0.0%) | 0 (0.0%) |
| $15,000 to $17,499 | 0 (0.0%) | 0 (0.0%) |
| $17,500 to $19,999 | 0 (0.0%) | 0 (0.0%) |
| $20,000 to $22,499 | 0 (0.0%) | 0 (0.0%) |
| $22,500 to $24,999 | 7 (2.9%) | 0 (0.0%) |
| $25,000 to $29,999 | 0 (0.0%) | 0 (0.0%) |
| $30,000 to $34,999 | 9 (3.7%) | 0 (0.0%) |
| $35,000 to $39,999 | 38 (15.8%) | 0 (0.0%) |
| $40,000 to $44,999 | 10 (4.2%) | 0 (0.0%) |
| $45,000 to $49,999 | 0 (0.0%) | 0 (0.0%) |
| $50,000 to $54,999 | 0 (0.0%) | 44 (100.0%) |
| $55,000 to $64,999 | 31 (12.9%) | 0 (0.0%) |
| $65,000 to $74,999 | 0 (0.0%) | 0 (0.0%) |
| $75,000 to $99,999 | 32 (13.3%) | 0 (0.0%) |
| $100,000+ | 34 (14.1%) | 0 (0.0%) |
| Total | 241 (100.0%) | 44 (100.0%) |
Earnings by Sex by Educational Attainment in Copper Mountain
| Educational Attainment | Male Income | Female Income |
| Less than High School | - | - |
| High School Diploma | - | - |
| College or Associate's Degree | - | - |
| Bachelor's Degree | - | - |
| Graduate Degree | - | - |
| Total | - | - |
Family Income in Copper Mountain
Family Income Brackets in Copper Mountain
According to the Copper Mountain family income data, there are 44 families falling into the $100,000 to $149,999 income range, which is the most common income bracket and makes up 100.0% of all families.
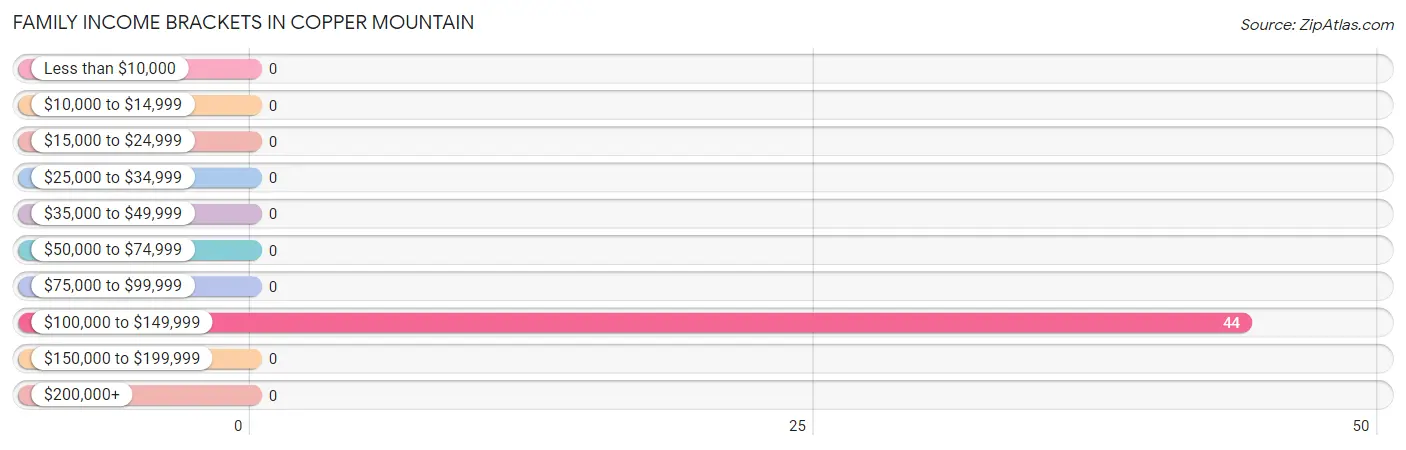
| Income Bracket | # Families | % Families |
| Less than $10,000 | 0 | 0.0% |
| $10,000 to $14,999 | 0 | 0.0% |
| $15,000 to $24,999 | 0 | 0.0% |
| $25,000 to $34,999 | 0 | 0.0% |
| $35,000 to $49,999 | 0 | 0.0% |
| $50,000 to $74,999 | 0 | 0.0% |
| $75,000 to $99,999 | 0 | 0.0% |
| $100,000 to $149,999 | 44 | 100.0% |
| $150,000 to $199,999 | 0 | 0.0% |
| $200,000+ | 0 | 0.0% |
Family Income by Famaliy Size in Copper Mountain
| Income Bracket | # Families | Median Income |
| 2-Person Families | 44 (100.0%) | $0 |
| 3-Person Families | 0 (0.0%) | $0 |
| 4-Person Families | 0 (0.0%) | $0 |
| 5-Person Families | 0 (0.0%) | $0 |
| 6-Person Families | 0 (0.0%) | $0 |
| 7+ Person Families | 0 (0.0%) | $0 |
| Total | 44 (100.0%) | $0 |
Family Income by Number of Earners in Copper Mountain
| Number of Earners | # Families | Median Income |
| No Earners | 0 (0.0%) | $0 |
| 1 Earner | 0 (0.0%) | $0 |
| 2 Earners | 44 (100.0%) | $0 |
| 3+ Earners | 0 (0.0%) | $0 |
| Total | 44 (100.0%) | $0 |
Household Income in Copper Mountain
Household Income Brackets in Copper Mountain
With 78 households falling in the category, the $100,000 to $149,999 income range is the most frequent in Copper Mountain, accounting for 55.3% of all households.
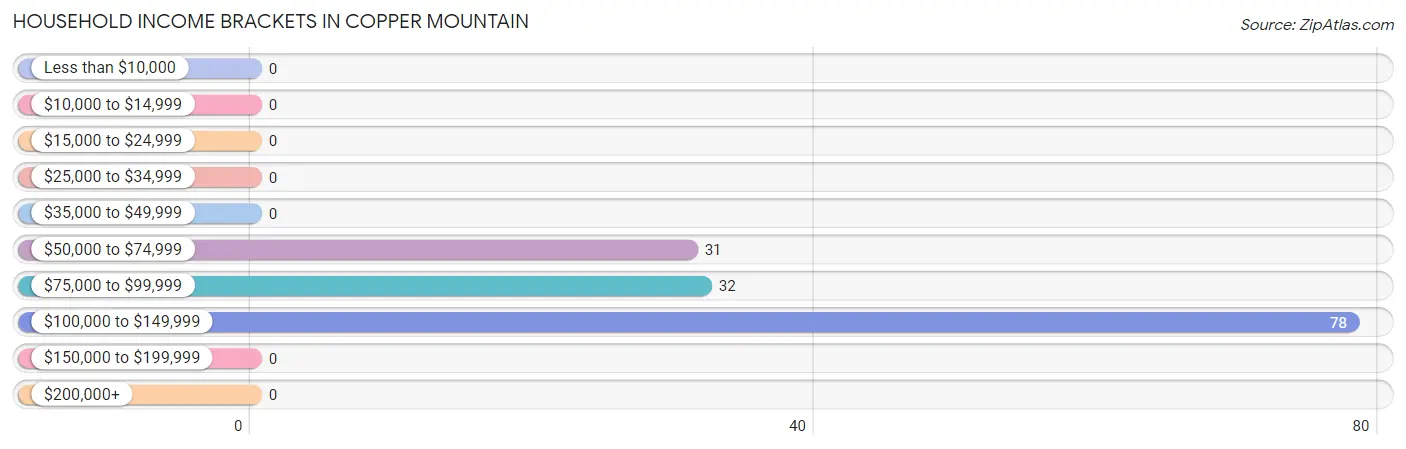
| Income Bracket | # Households | % Households |
| Less than $10,000 | 0 | 0.0% |
| $10,000 to $14,999 | 0 | 0.0% |
| $15,000 to $24,999 | 0 | 0.0% |
| $25,000 to $34,999 | 0 | 0.0% |
| $35,000 to $49,999 | 0 | 0.0% |
| $50,000 to $74,999 | 31 | 22.0% |
| $75,000 to $99,999 | 32 | 22.7% |
| $100,000 to $149,999 | 78 | 55.3% |
| $150,000 to $199,999 | 0 | 0.0% |
| $200,000+ | 0 | 0.0% |
Household Income by Householder Age in Copper Mountain
The median household income in Copper Mountain is $117,926, with the highest median household income of $117,926 found in the 45 to 64 years age bracket for the primary householder. A total of 141 households (100.0%) fall into this category.
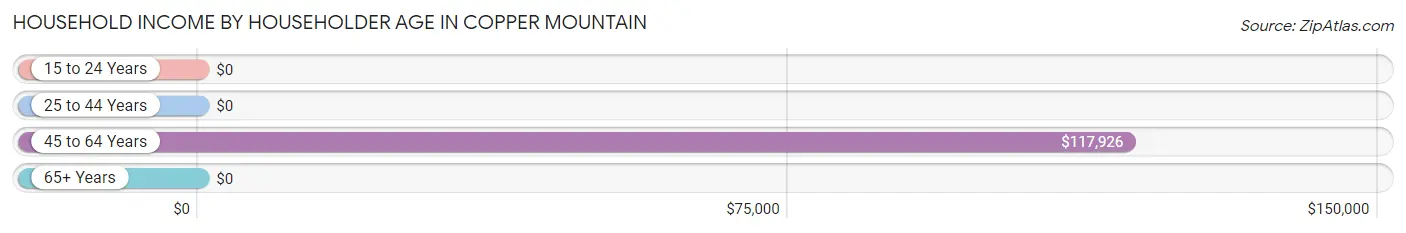
| Income Bracket | # Households | Median Income |
| 15 to 24 Years | 0 (0.0%) | $0 |
| 25 to 44 Years | 0 (0.0%) | $0 |
| 45 to 64 Years | 141 (100.0%) | $117,926 |
| 65+ Years | 0 (0.0%) | $0 |
| Total | 141 (100.0%) | $117,926 |
Poverty in Copper Mountain
Income Below Poverty by Sex and Age in Copper Mountain
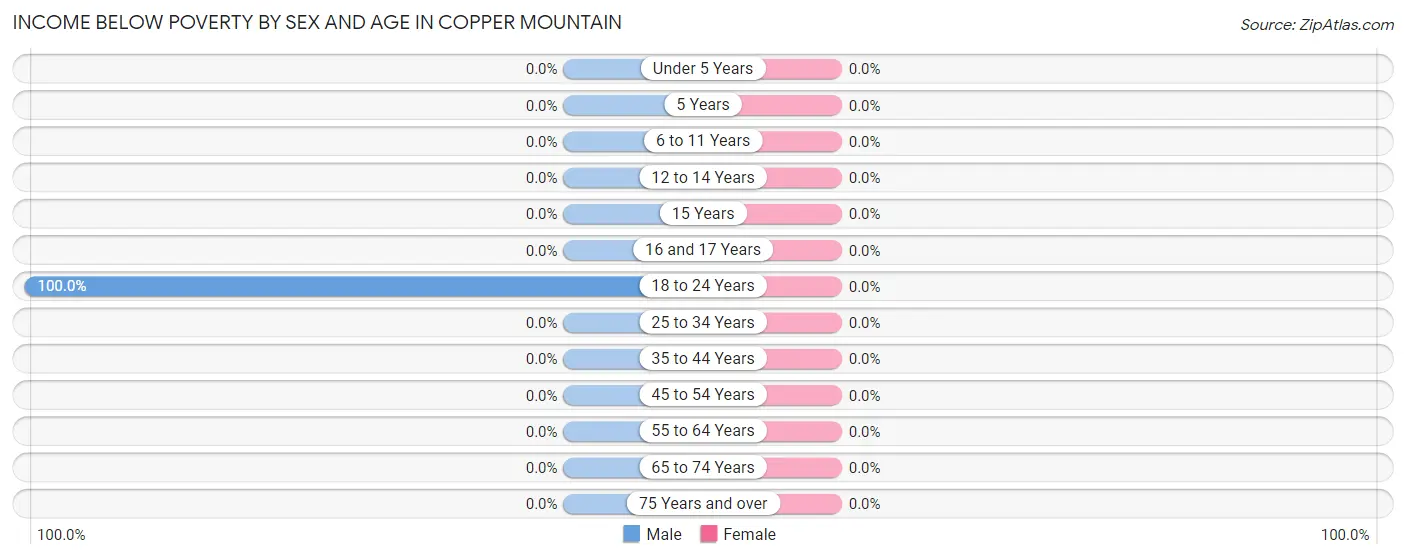
| Age Bracket | Male | Female |
| Under 5 Years | 0 (0.0%) | 0 (0.0%) |
| 5 Years | 0 (0.0%) | 0 (0.0%) |
| 6 to 11 Years | 0 (0.0%) | 0 (0.0%) |
| 12 to 14 Years | 0 (0.0%) | 0 (0.0%) |
| 15 Years | 0 (0.0%) | 0 (0.0%) |
| 16 and 17 Years | 0 (0.0%) | 0 (0.0%) |
| 18 to 24 Years | 80 (100.0%) | 0 (0.0%) |
| 25 to 34 Years | 0 (0.0%) | 0 (0.0%) |
| 35 to 44 Years | 0 (0.0%) | 0 (0.0%) |
| 45 to 54 Years | 0 (0.0%) | 0 (0.0%) |
| 55 to 64 Years | 0 (0.0%) | 0 (0.0%) |
| 65 to 74 Years | 0 (0.0%) | 0 (0.0%) |
| 75 Years and over | 0 (0.0%) | 0 (0.0%) |
| Total | 80 (33.2%) | 0 (0.0%) |
Income Above Poverty by Sex and Age in Copper Mountain
According to the poverty statistics in Copper Mountain, males aged 25 to 34 years and females aged 55 to 64 years are the age groups that are most secure financially, with 100.0% of males and 100.0% of females in these age groups living above the poverty line.
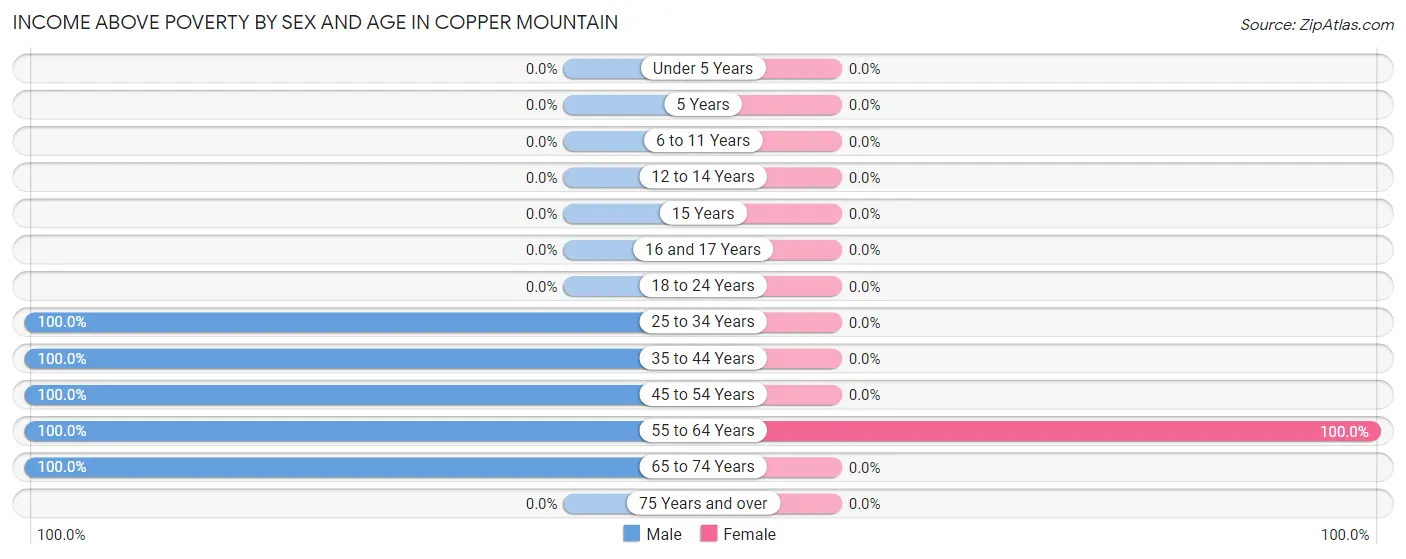
| Age Bracket | Male | Female |
| Under 5 Years | 0 (0.0%) | 0 (0.0%) |
| 5 Years | 0 (0.0%) | 0 (0.0%) |
| 6 to 11 Years | 0 (0.0%) | 0 (0.0%) |
| 12 to 14 Years | 0 (0.0%) | 0 (0.0%) |
| 15 Years | 0 (0.0%) | 0 (0.0%) |
| 16 and 17 Years | 0 (0.0%) | 0 (0.0%) |
| 18 to 24 Years | 0 (0.0%) | 0 (0.0%) |
| 25 to 34 Years | 7 (100.0%) | 0 (0.0%) |
| 35 to 44 Years | 19 (100.0%) | 0 (0.0%) |
| 45 to 54 Years | 31 (100.0%) | 0 (0.0%) |
| 55 to 64 Years | 66 (100.0%) | 44 (100.0%) |
| 65 to 74 Years | 38 (100.0%) | 0 (0.0%) |
| 75 Years and over | 0 (0.0%) | 0 (0.0%) |
| Total | 161 (66.8%) | 44 (100.0%) |
Income Below Poverty Among Married-Couple Families in Copper Mountain
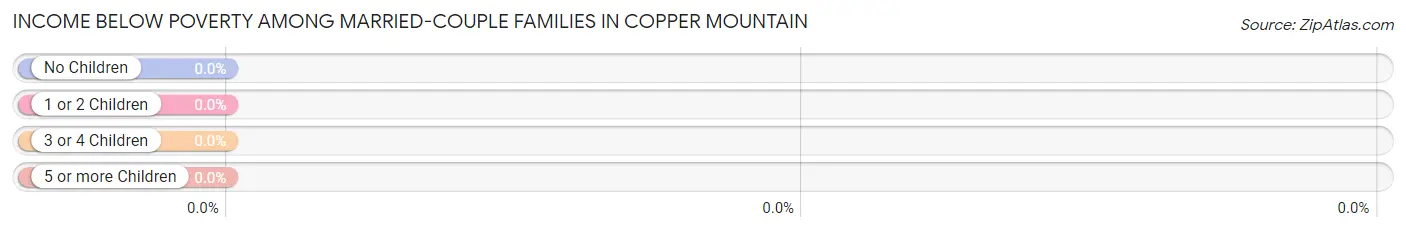
| Children | Above Poverty | Below Poverty |
| No Children | 44 (100.0%) | 0 (0.0%) |
| 1 or 2 Children | 0 (0.0%) | 0 (0.0%) |
| 3 or 4 Children | 0 (0.0%) | 0 (0.0%) |
| 5 or more Children | 0 (0.0%) | 0 (0.0%) |
| Total | 44 (100.0%) | 0 (0.0%) |
Income Below Poverty Among Single-Parent Households in Copper Mountain
| Children | Single Father | Single Mother |
| No Children | 0 (0.0%) | 0 (0.0%) |
| 1 or 2 Children | 0 (0.0%) | 0 (0.0%) |
| 3 or 4 Children | 0 (0.0%) | 0 (0.0%) |
| 5 or more Children | 0 (0.0%) | 0 (0.0%) |
| Total | 0 (0.0%) | 0 (0.0%) |
Income Below Poverty Among Married-Couple vs Single-Parent Households in Copper Mountain
| Children | Married-Couple Families | Single-Parent Households |
| No Children | 0 (0.0%) | 0 (0.0%) |
| 1 or 2 Children | 0 (0.0%) | 0 (0.0%) |
| 3 or 4 Children | 0 (0.0%) | 0 (0.0%) |
| 5 or more Children | 0 (0.0%) | 0 (0.0%) |
| Total | 0 (0.0%) | 0 (0.0%) |
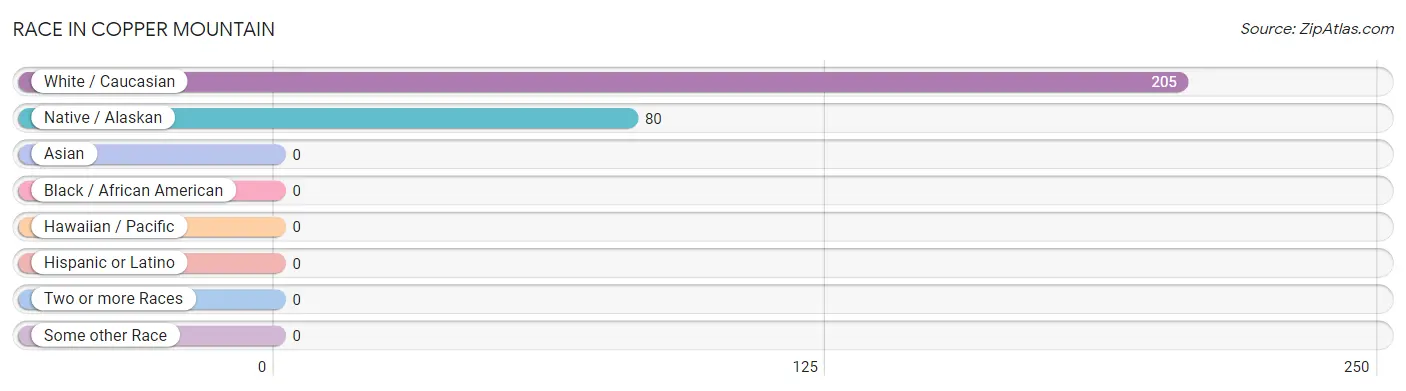
Race in Copper Mountain
The most populous races in Copper Mountain are White / Caucasian (205 | 71.9%), and Native / Alaskan (80 | 28.1%).
| Race | # Population | % Population |
| Asian | 0 | 0.0% |
| Black / African American | 0 | 0.0% |
| Hawaiian / Pacific | 0 | 0.0% |
| Hispanic or Latino | 0 | 0.0% |
| Native / Alaskan | 80 | 28.1% |
| White / Caucasian | 205 | 71.9% |
| Two or more Races | 0 | 0.0% |
| Some other Race | 0 | 0.0% |
| Total | 285 | 100.0% |
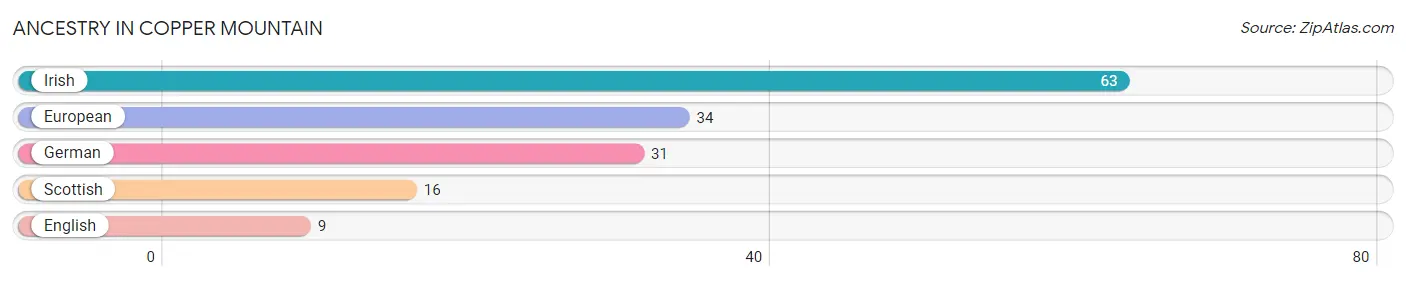
Ancestry in Copper Mountain
The most populous ancestries reported in Copper Mountain are Irish (63 | 22.1%), European (34 | 11.9%), German (31 | 10.9%), Scottish (16 | 5.6%), and English (9 | 3.2%), together accounting for 53.7% of all Copper Mountain residents.
| Ancestry | # Population | % Population |
| English | 9 | 3.2% |
| European | 34 | 11.9% |
| German | 31 | 10.9% |
| Irish | 63 | 22.1% |
| Scottish | 16 | 5.6% | View All 5 Rows |
Immigrants in Copper Mountain

| Immigration Origin | # Population | % Population | View All 0 Rows |
Sex and Age in Copper Mountain
Sex and Age in Copper Mountain
The most populous age groups in Copper Mountain are 15 to 19 Years (80 | 33.2%) for men and 55 to 59 Years (44 | 100.0%) for women.
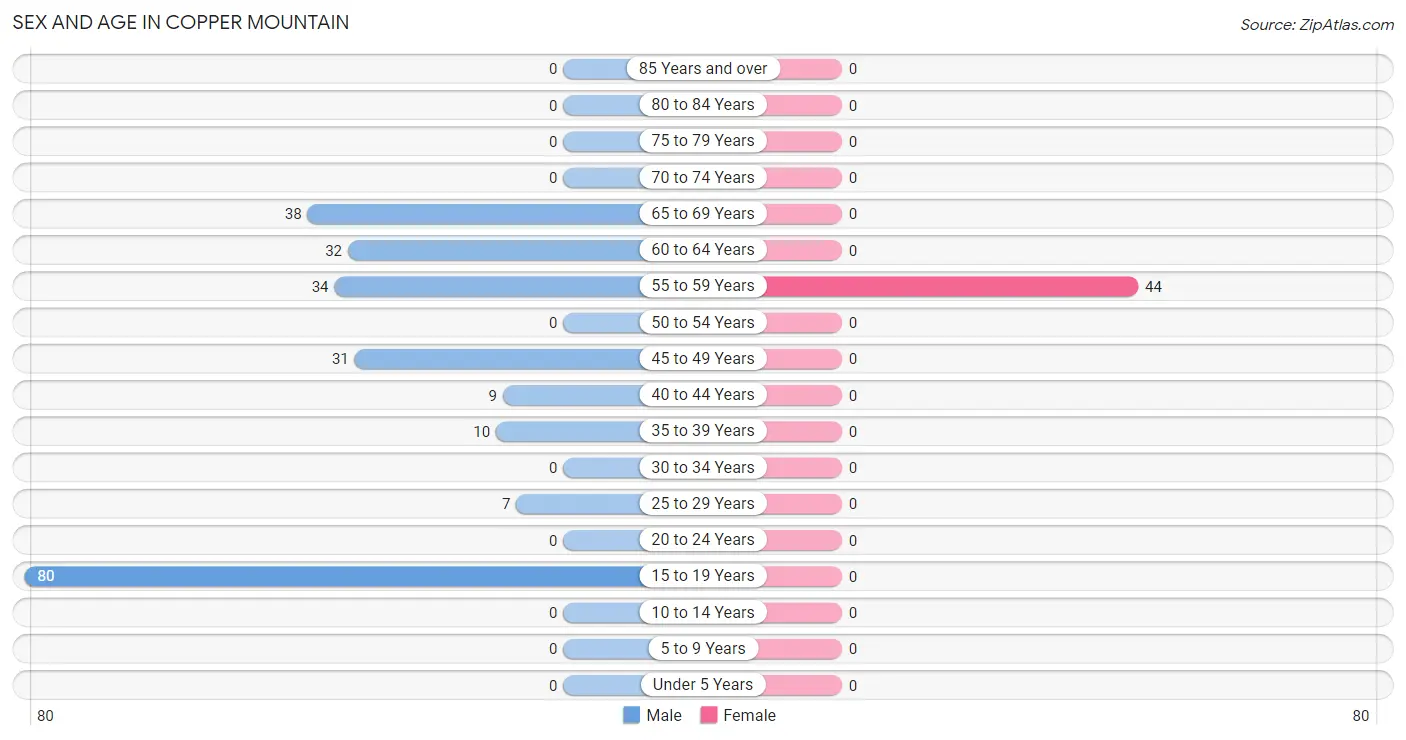
| Age Bracket | Male | Female |
| Under 5 Years | 0 (0.0%) | 0 (0.0%) |
| 5 to 9 Years | 0 (0.0%) | 0 (0.0%) |
| 10 to 14 Years | 0 (0.0%) | 0 (0.0%) |
| 15 to 19 Years | 80 (33.2%) | 0 (0.0%) |
| 20 to 24 Years | 0 (0.0%) | 0 (0.0%) |
| 25 to 29 Years | 7 (2.9%) | 0 (0.0%) |
| 30 to 34 Years | 0 (0.0%) | 0 (0.0%) |
| 35 to 39 Years | 10 (4.2%) | 0 (0.0%) |
| 40 to 44 Years | 9 (3.7%) | 0 (0.0%) |
| 45 to 49 Years | 31 (12.9%) | 0 (0.0%) |
| 50 to 54 Years | 0 (0.0%) | 0 (0.0%) |
| 55 to 59 Years | 34 (14.1%) | 44 (100.0%) |
| 60 to 64 Years | 32 (13.3%) | 0 (0.0%) |
| 65 to 69 Years | 38 (15.8%) | 0 (0.0%) |
| 70 to 74 Years | 0 (0.0%) | 0 (0.0%) |
| 75 to 79 Years | 0 (0.0%) | 0 (0.0%) |
| 80 to 84 Years | 0 (0.0%) | 0 (0.0%) |
| 85 Years and over | 0 (0.0%) | 0 (0.0%) |
| Total | 241 (100.0%) | 44 (100.0%) |
Families and Households in Copper Mountain
Median Family Size in Copper Mountain
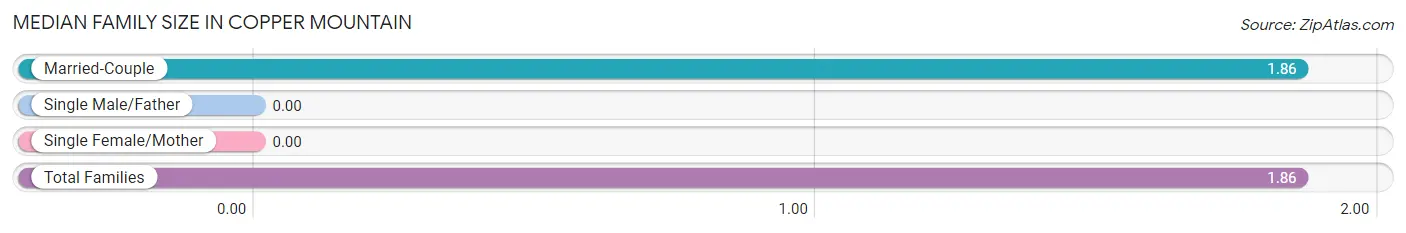
| Family Type | # Families | Family Size |
| Married-Couple | 44 (100.0%) | 1.86 |
| Single Male/Father | 0 (0.0%) | - |
| Single Female/Mother | 0 (0.0%) | - |
| Total Families | 44 (100.0%) | 1.86 |
Median Household Size in Copper Mountain
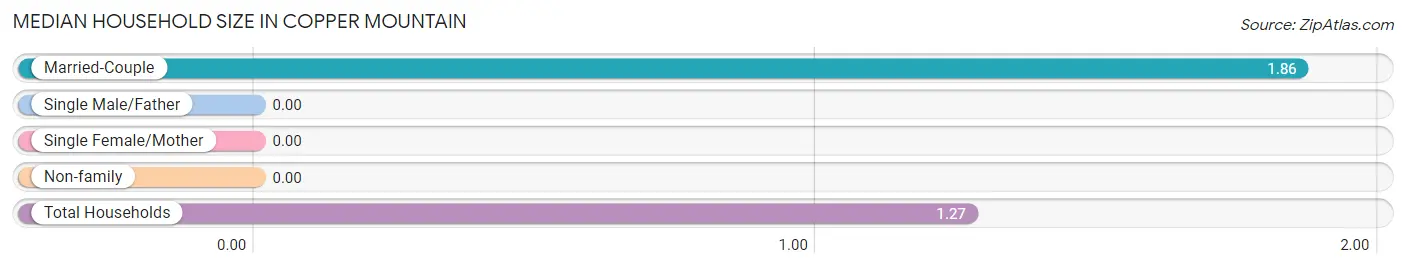
| Household Type | # Households | Household Size |
| Married-Couple | 44 (31.2%) | 1.86 |
| Single Male/Father | 0 (0.0%) | - |
| Single Female/Mother | 0 (0.0%) | - |
| Non-family | 97 (68.8%) | - |
| Total Households | 141 (100.0%) | 1.27 |
Household Size by Marriage Status in Copper Mountain
Out of a total of 141 households in Copper Mountain, 44 (31.2%) are family households, while 97 (68.8%) are nonfamily households. The most numerous type of family households are 2-person households, comprising 44, and the most common type of nonfamily households are 1-person households, comprising 97.
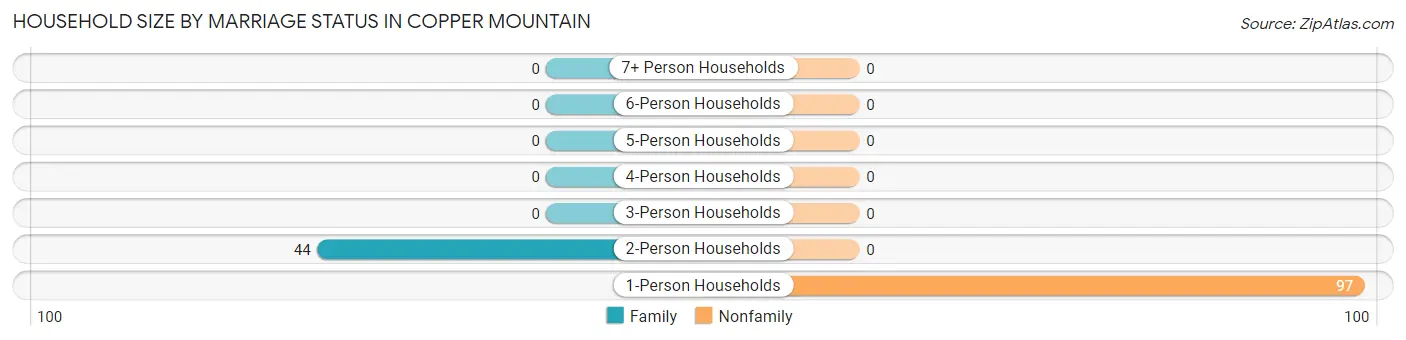
| Household Size | Family Households | Nonfamily Households |
| 1-Person Households | - | 97 (68.8%) |
| 2-Person Households | 44 (31.2%) | 0 (0.0%) |
| 3-Person Households | 0 (0.0%) | 0 (0.0%) |
| 4-Person Households | 0 (0.0%) | 0 (0.0%) |
| 5-Person Households | 0 (0.0%) | 0 (0.0%) |
| 6-Person Households | 0 (0.0%) | 0 (0.0%) |
| 7+ Person Households | 0 (0.0%) | 0 (0.0%) |
| Total | 44 (31.2%) | 97 (68.8%) |
Female Fertility in Copper Mountain
Fertility by Age in Copper Mountain
| Age Bracket | Women with Births | Births / 1,000 Women |
| 15 to 19 years | 0 (0.0%) | 0.0 |
| 20 to 34 years | 0 (0.0%) | 0.0 |
| 35 to 50 years | 0 (0.0%) | 0.0 |
| Total | 0 (0.0%) | 0.0 |
Fertility by Age by Marriage Status in Copper Mountain
| Age Bracket | Married | Unmarried |
| 15 to 19 years | 0 (0.0%) | 0 (0.0%) |
| 20 to 34 years | 0 (0.0%) | 0 (0.0%) |
| 35 to 50 years | 0 (0.0%) | 0 (0.0%) |
| Total | 0 (0.0%) | 0 (0.0%) |
Fertility by Education in Copper Mountain
| Educational Attainment | Women with Births | Births / 1,000 Women |
| Less than High School | 0 (0.0%) | 0.0 |
| High School Diploma | 0 (0.0%) | 0.0 |
| College or Associate's Degree | 0 (0.0%) | 0.0 |
| Bachelor's Degree | 0 (0.0%) | 0.0 |
| Graduate Degree | 0 (0.0%) | 0.0 |
| Total | 0 (0.0%) | 0.0 |
Fertility by Education by Marriage Status in Copper Mountain
| Educational Attainment | Married | Unmarried |
| Less than High School | 0 (0.0%) | 0 (0.0%) |
| High School Diploma | 0 (0.0%) | 0 (0.0%) |
| College or Associate's Degree | 0 (0.0%) | 0 (0.0%) |
| Bachelor's Degree | 0 (0.0%) | 0 (0.0%) |
| Graduate Degree | 0 (0.0%) | 0 (0.0%) |
| Total | 0 (0.0%) | 0 (0.0%) |
Employment Characteristics in Copper Mountain
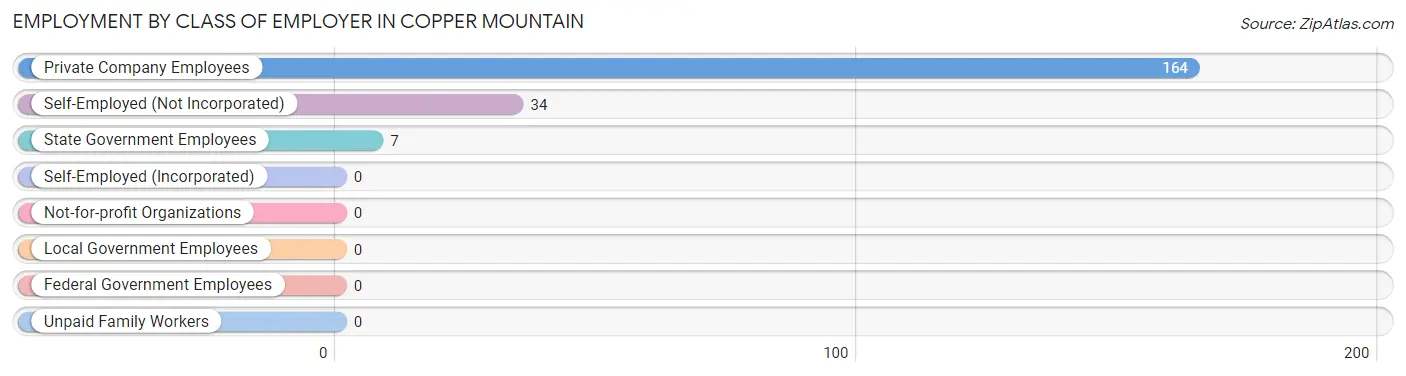
Employment by Class of Employer in Copper Mountain
Among the 205 employed individuals in Copper Mountain, private company employees (164 | 80.0%), self-employed (not incorporated) (34 | 16.6%), and state government employees (7 | 3.4%) make up the most common classes of employment.
| Employer Class | # Employees | % Employees |
| Private Company Employees | 164 | 80.0% |
| Self-Employed (Incorporated) | 0 | 0.0% |
| Self-Employed (Not Incorporated) | 34 | 16.6% |
| Not-for-profit Organizations | 0 | 0.0% |
| Local Government Employees | 0 | 0.0% |
| State Government Employees | 7 | 3.4% |
| Federal Government Employees | 0 | 0.0% |
| Unpaid Family Workers | 0 | 0.0% |
| Total | 205 | 100.0% |
Employment Status by Age in Copper Mountain
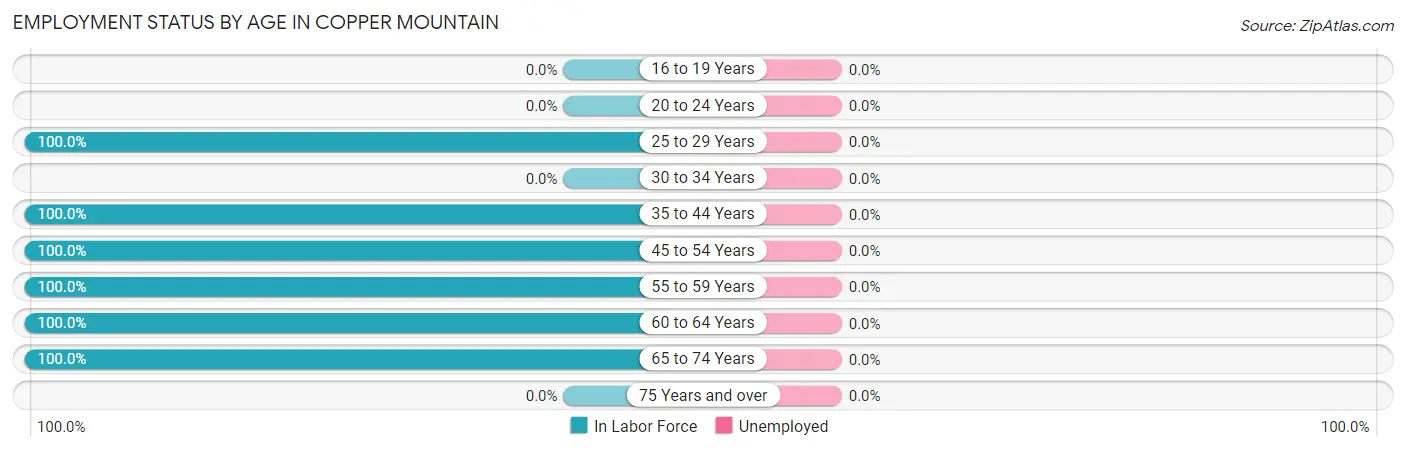
| Age Bracket | In Labor Force | Unemployed |
| 16 to 19 Years | 0 (0.0%) | 0 (0.0%) |
| 20 to 24 Years | 0 (0.0%) | 0 (0.0%) |
| 25 to 29 Years | 7 (100.0%) | 0 (0.0%) |
| 30 to 34 Years | 0 (0.0%) | 0 (0.0%) |
| 35 to 44 Years | 19 (100.0%) | 0 (0.0%) |
| 45 to 54 Years | 31 (100.0%) | 0 (0.0%) |
| 55 to 59 Years | 78 (100.0%) | 0 (0.0%) |
| 60 to 64 Years | 32 (100.0%) | 0 (0.0%) |
| 65 to 74 Years | 38 (100.0%) | 0 (0.0%) |
| 75 Years and over | 0 (0.0%) | 0 (0.0%) |
| Total | 205 (71.9%) | 0 (0.0%) |
Employment Status by Educational Attainment in Copper Mountain
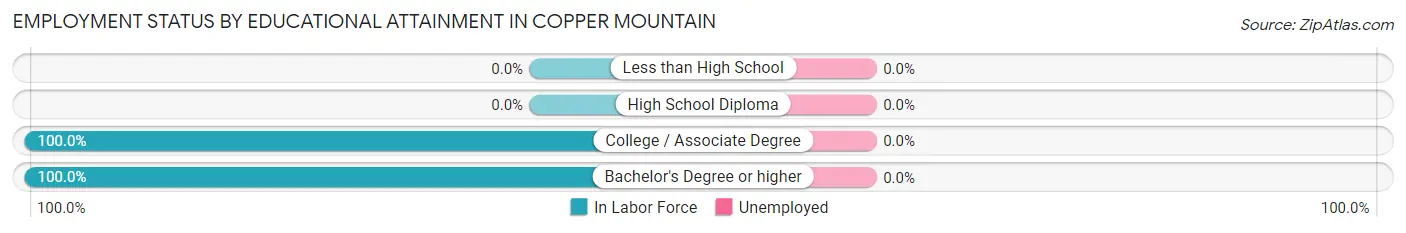
| Educational Attainment | In Labor Force | Unemployed |
| Less than High School | 0 (0.0%) | 0 (0.0%) |
| High School Diploma | 0 (0.0%) | 0 (0.0%) |
| College / Associate Degree | 117 (100.0%) | 0 (0.0%) |
| Bachelor's Degree or higher | 50 (100.0%) | 0 (0.0%) |
| Total | 167 (100.0%) | 0 (0.0%) |
Employment Occupations by Sex in Copper Mountain
Management, Business, Science and Arts Occupations
The most common Management, Business, Science and Arts occupations in Copper Mountain are , and Management (109 | 53.2%).
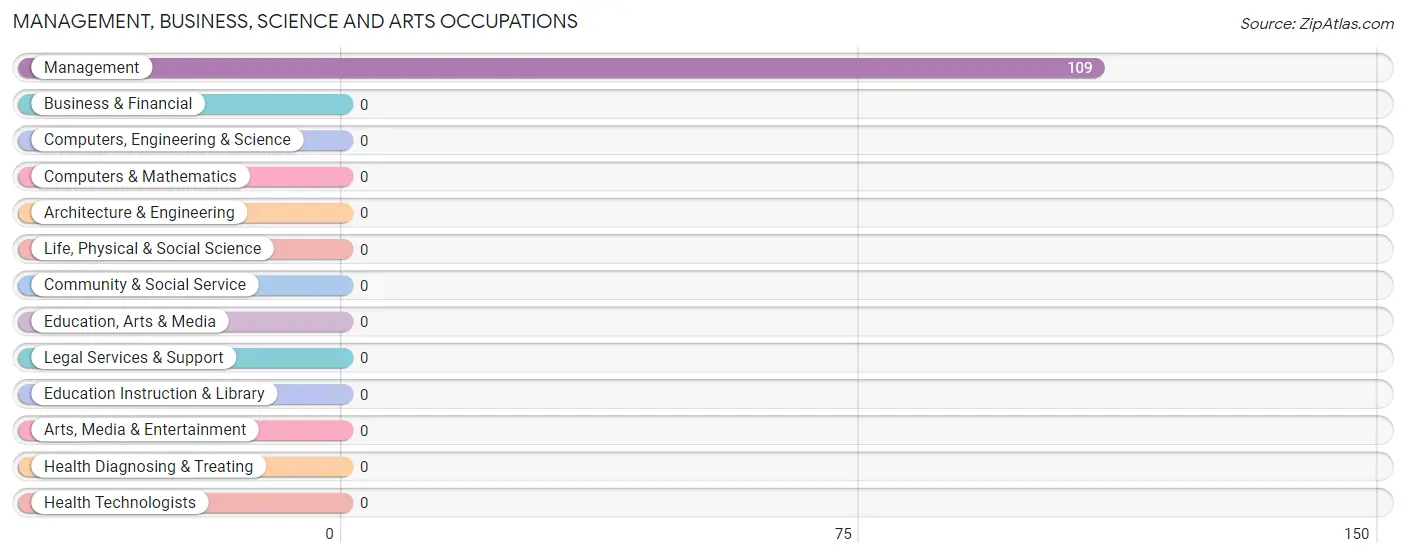
Management, Business, Science and Arts Occupations by Sex
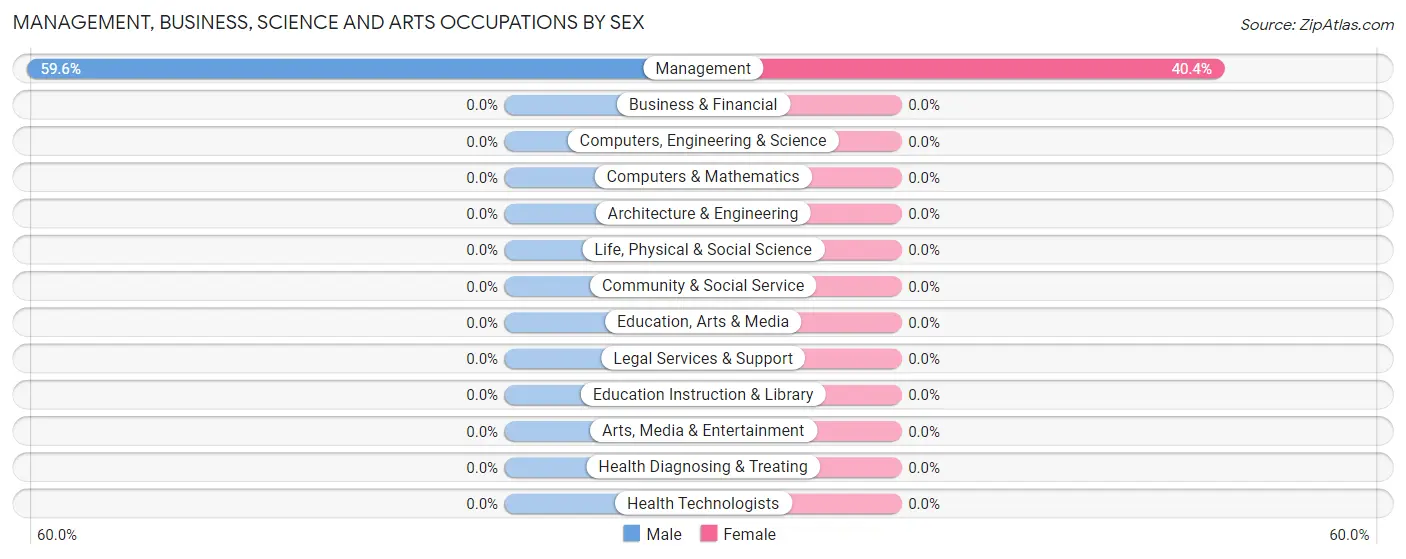
| Occupation | Male | Female |
| Management | 65 (59.6%) | 44 (40.4%) |
| Business & Financial | 0 (0.0%) | 0 (0.0%) |
| Computers, Engineering & Science | 0 (0.0%) | 0 (0.0%) |
| Computers & Mathematics | 0 (0.0%) | 0 (0.0%) |
| Architecture & Engineering | 0 (0.0%) | 0 (0.0%) |
| Life, Physical & Social Science | 0 (0.0%) | 0 (0.0%) |
| Community & Social Service | 0 (0.0%) | 0 (0.0%) |
| Education, Arts & Media | 0 (0.0%) | 0 (0.0%) |
| Legal Services & Support | 0 (0.0%) | 0 (0.0%) |
| Education Instruction & Library | 0 (0.0%) | 0 (0.0%) |
| Arts, Media & Entertainment | 0 (0.0%) | 0 (0.0%) |
| Health Diagnosing & Treating | 0 (0.0%) | 0 (0.0%) |
| Health Technologists | 0 (0.0%) | 0 (0.0%) |
| Total (Category) | 65 (59.6%) | 44 (40.4%) |
| Total (Overall) | 161 (78.5%) | 44 (21.5%) |
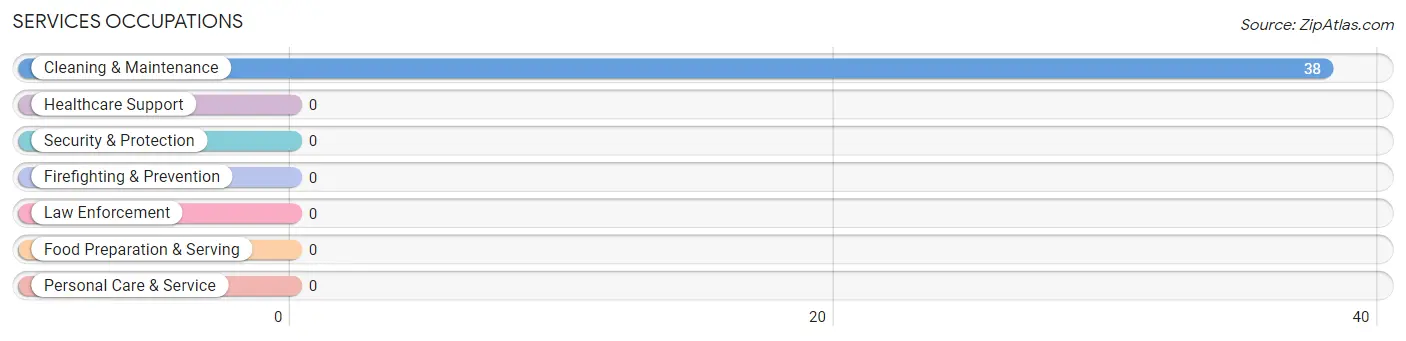
Services Occupations
The most common Services occupations in Copper Mountain are , and Cleaning & Maintenance (38 | 18.5%).
Services Occupations by Sex
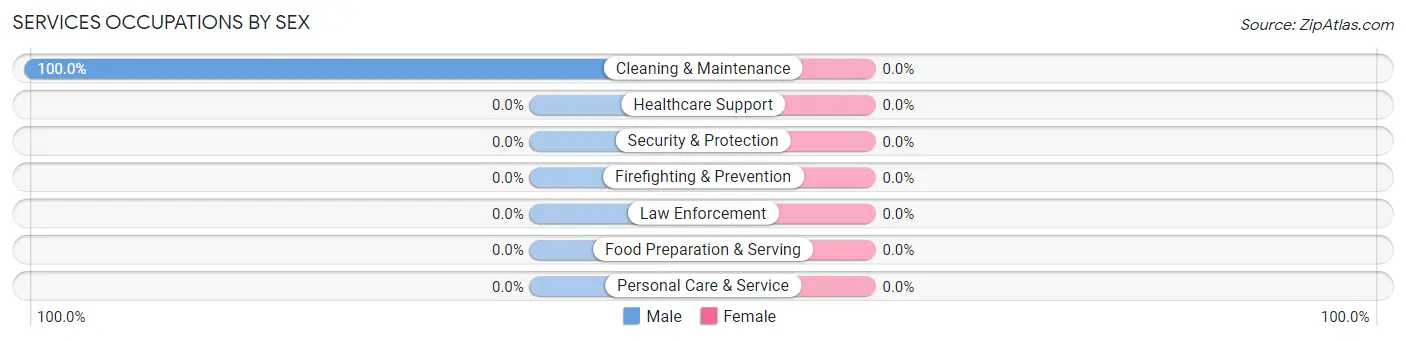
| Occupation | Male | Female |
| Healthcare Support | 0 (0.0%) | 0 (0.0%) |
| Security & Protection | 0 (0.0%) | 0 (0.0%) |
| Firefighting & Prevention | 0 (0.0%) | 0 (0.0%) |
| Law Enforcement | 0 (0.0%) | 0 (0.0%) |
| Food Preparation & Serving | 0 (0.0%) | 0 (0.0%) |
| Cleaning & Maintenance | 38 (100.0%) | 0 (0.0%) |
| Personal Care & Service | 0 (0.0%) | 0 (0.0%) |
| Total (Category) | 38 (100.0%) | 0 (0.0%) |
| Total (Overall) | 161 (78.5%) | 44 (21.5%) |
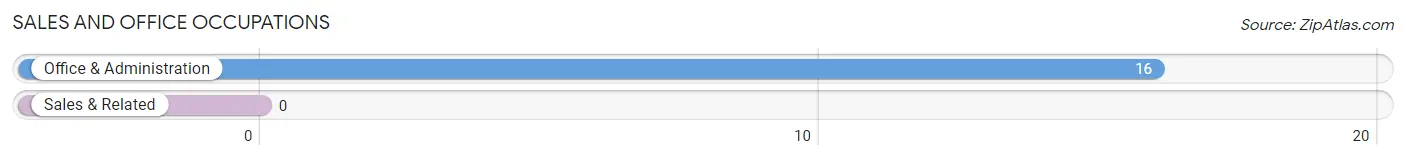
Sales and Office Occupations
The most common Sales and Office occupations in Copper Mountain are , and Office & Administration (16 | 7.8%).
Sales and Office Occupations by Sex
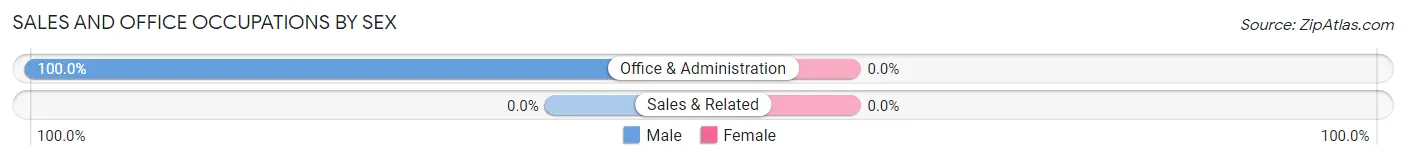
| Occupation | Male | Female |
| Sales & Related | 0 (0.0%) | 0 (0.0%) |
| Office & Administration | 16 (100.0%) | 0 (0.0%) |
| Total (Category) | 16 (100.0%) | 0 (0.0%) |
| Total (Overall) | 161 (78.5%) | 44 (21.5%) |
Natural Resources, Construction and Maintenance Occupations
The most common Natural Resources, Construction and Maintenance occupations in Copper Mountain are , and Installation, Maintenance & Repair (10 | 4.9%).
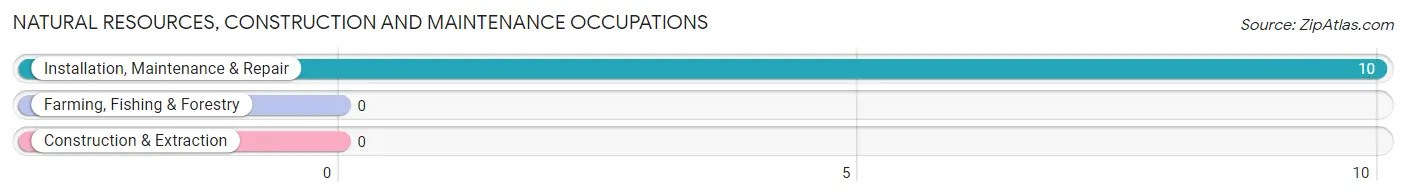
Natural Resources, Construction and Maintenance Occupations by Sex
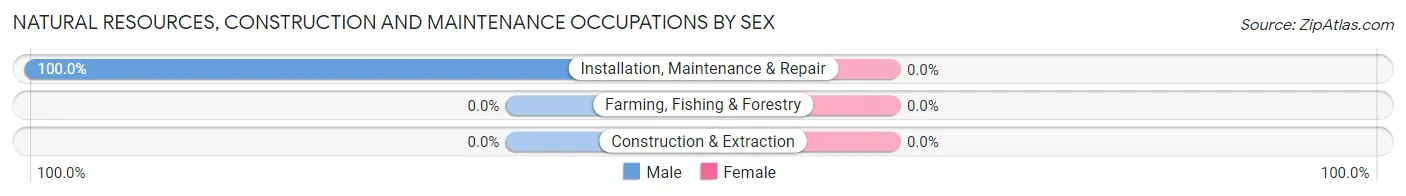
| Occupation | Male | Female |
| Farming, Fishing & Forestry | 0 (0.0%) | 0 (0.0%) |
| Construction & Extraction | 0 (0.0%) | 0 (0.0%) |
| Installation, Maintenance & Repair | 10 (100.0%) | 0 (0.0%) |
| Total (Category) | 10 (100.0%) | 0 (0.0%) |
| Total (Overall) | 161 (78.5%) | 44 (21.5%) |
Production, Transportation and Moving Occupations
The most common Production, Transportation and Moving occupations in Copper Mountain are , and Production (32 | 15.6%).
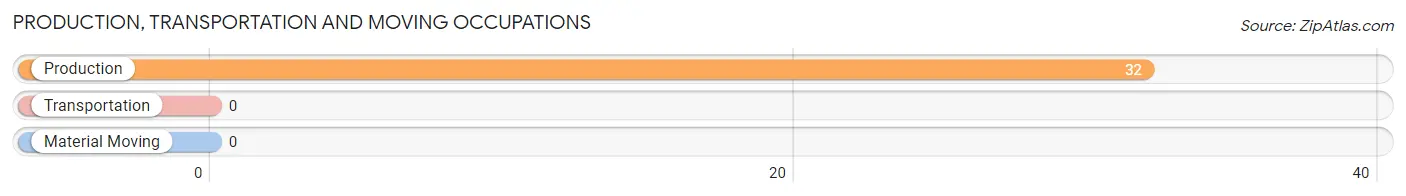
Production, Transportation and Moving Occupations by Sex
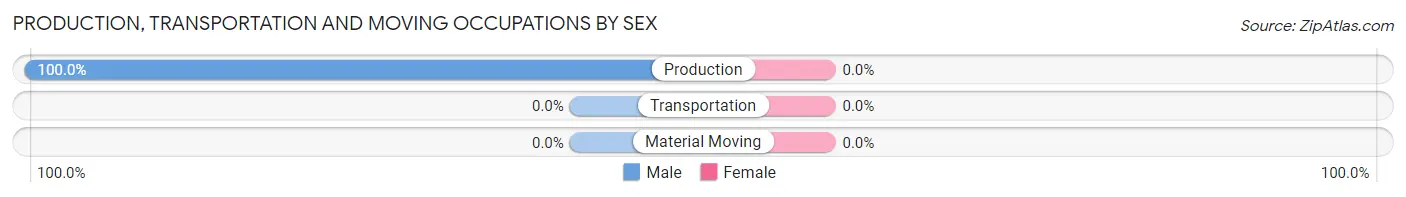
| Occupation | Male | Female |
| Production | 32 (100.0%) | 0 (0.0%) |
| Transportation | 0 (0.0%) | 0 (0.0%) |
| Material Moving | 0 (0.0%) | 0 (0.0%) |
| Total (Category) | 32 (100.0%) | 0 (0.0%) |
| Total (Overall) | 161 (78.5%) | 44 (21.5%) |
Employment Industries by Sex in Copper Mountain
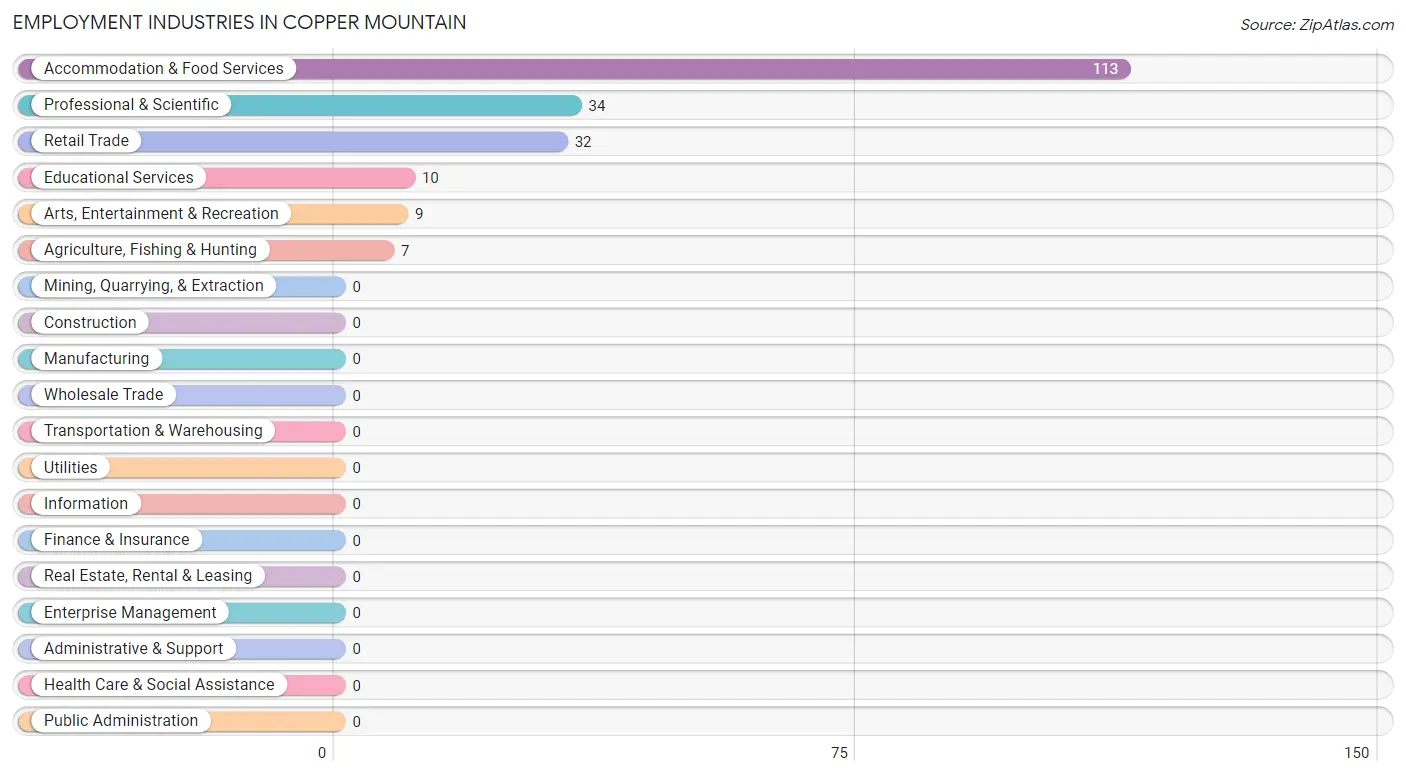
Employment Industries in Copper Mountain
The major employment industries in Copper Mountain include Accommodation & Food Services (113 | 55.1%), Professional & Scientific (34 | 16.6%), Retail Trade (32 | 15.6%), Educational Services (10 | 4.9%), and Arts, Entertainment & Recreation (9 | 4.4%).
Employment Industries by Sex in Copper Mountain
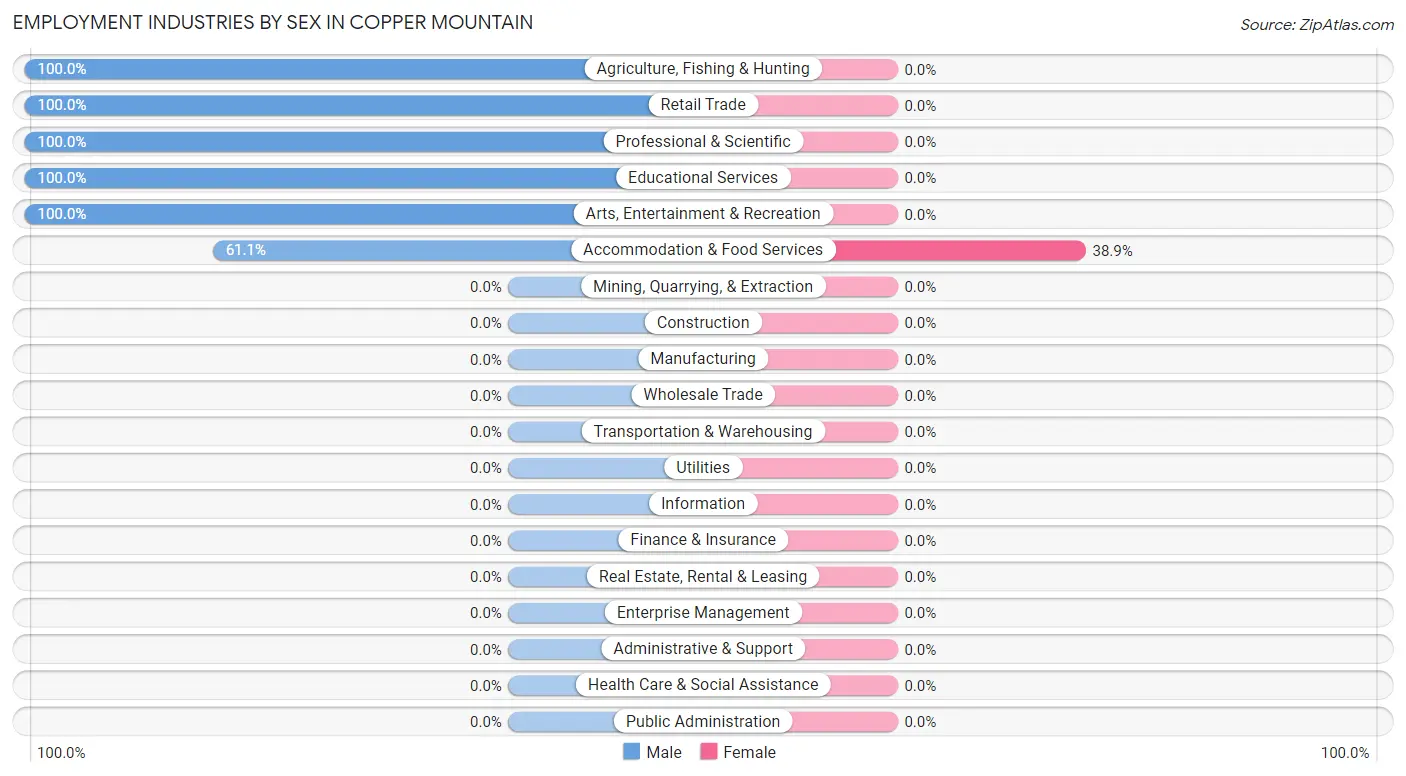
| Industry | Male | Female |
| Agriculture, Fishing & Hunting | 7 (100.0%) | 0 (0.0%) |
| Mining, Quarrying, & Extraction | 0 (0.0%) | 0 (0.0%) |
| Construction | 0 (0.0%) | 0 (0.0%) |
| Manufacturing | 0 (0.0%) | 0 (0.0%) |
| Wholesale Trade | 0 (0.0%) | 0 (0.0%) |
| Retail Trade | 32 (100.0%) | 0 (0.0%) |
| Transportation & Warehousing | 0 (0.0%) | 0 (0.0%) |
| Utilities | 0 (0.0%) | 0 (0.0%) |
| Information | 0 (0.0%) | 0 (0.0%) |
| Finance & Insurance | 0 (0.0%) | 0 (0.0%) |
| Real Estate, Rental & Leasing | 0 (0.0%) | 0 (0.0%) |
| Professional & Scientific | 34 (100.0%) | 0 (0.0%) |
| Enterprise Management | 0 (0.0%) | 0 (0.0%) |
| Administrative & Support | 0 (0.0%) | 0 (0.0%) |
| Educational Services | 10 (100.0%) | 0 (0.0%) |
| Health Care & Social Assistance | 0 (0.0%) | 0 (0.0%) |
| Arts, Entertainment & Recreation | 9 (100.0%) | 0 (0.0%) |
| Accommodation & Food Services | 69 (61.1%) | 44 (38.9%) |
| Public Administration | 0 (0.0%) | 0 (0.0%) |
| Total | 161 (78.5%) | 44 (21.5%) |
Education in Copper Mountain
School Enrollment in Copper Mountain
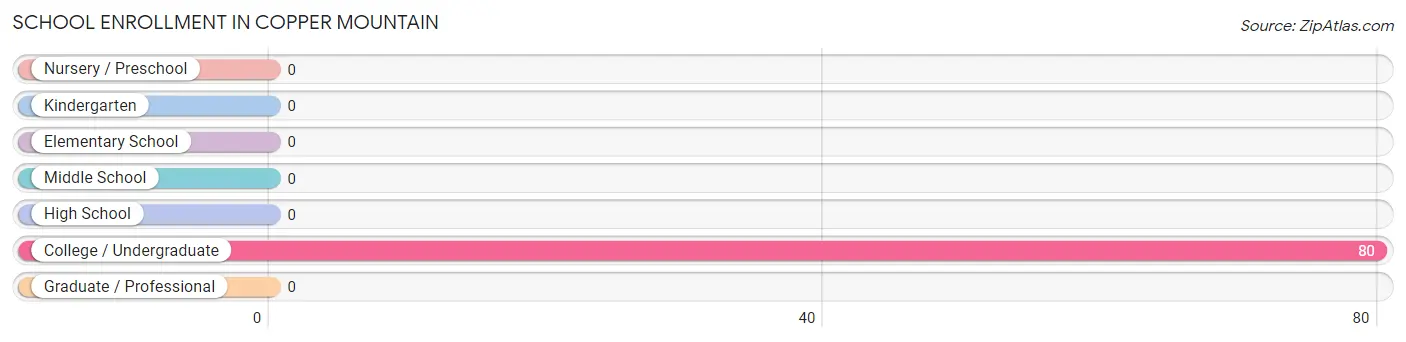
| School Level | # Students | % Students |
| Nursery / Preschool | 0 | 0.0% |
| Kindergarten | 0 | 0.0% |
| Elementary School | 0 | 0.0% |
| Middle School | 0 | 0.0% |
| High School | 0 | 0.0% |
| College / Undergraduate | 80 | 100.0% |
| Graduate / Professional | 0 | 0.0% |
| Total | 80 | 100.0% |
School Enrollment by Age by Funding Source in Copper Mountain
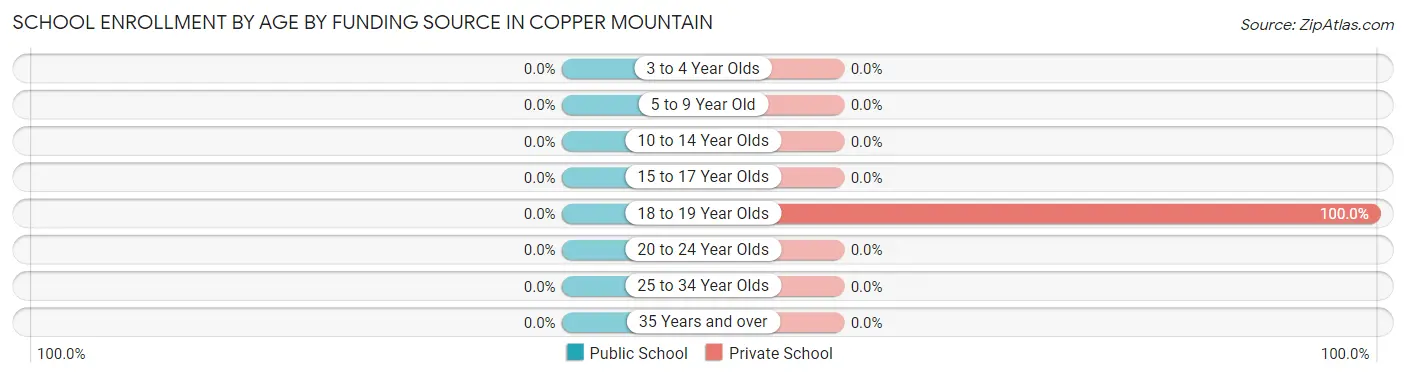
| Age Bracket | Public School | Private School |
| 3 to 4 Year Olds | 0 (0.0%) | 0 (0.0%) |
| 5 to 9 Year Old | 0 (0.0%) | 0 (0.0%) |
| 10 to 14 Year Olds | 0 (0.0%) | 0 (0.0%) |
| 15 to 17 Year Olds | 0 (0.0%) | 0 (0.0%) |
| 18 to 19 Year Olds | 0 (0.0%) | 80 (100.0%) |
| 20 to 24 Year Olds | 0 (0.0%) | 0 (0.0%) |
| 25 to 34 Year Olds | 0 (0.0%) | 0 (0.0%) |
| 35 Years and over | 0 (0.0%) | 0 (0.0%) |
| Total | 0 (0.0%) | 80 (100.0%) |
Educational Attainment by Field of Study in Copper Mountain
Science & technology (34 | 68.0%), social sciences (9 | 18.0%), and bio, nature & agricultural (7 | 14.0%) are the most common fields of study among 50 individuals in Copper Mountain who have obtained a bachelor's degree or higher.
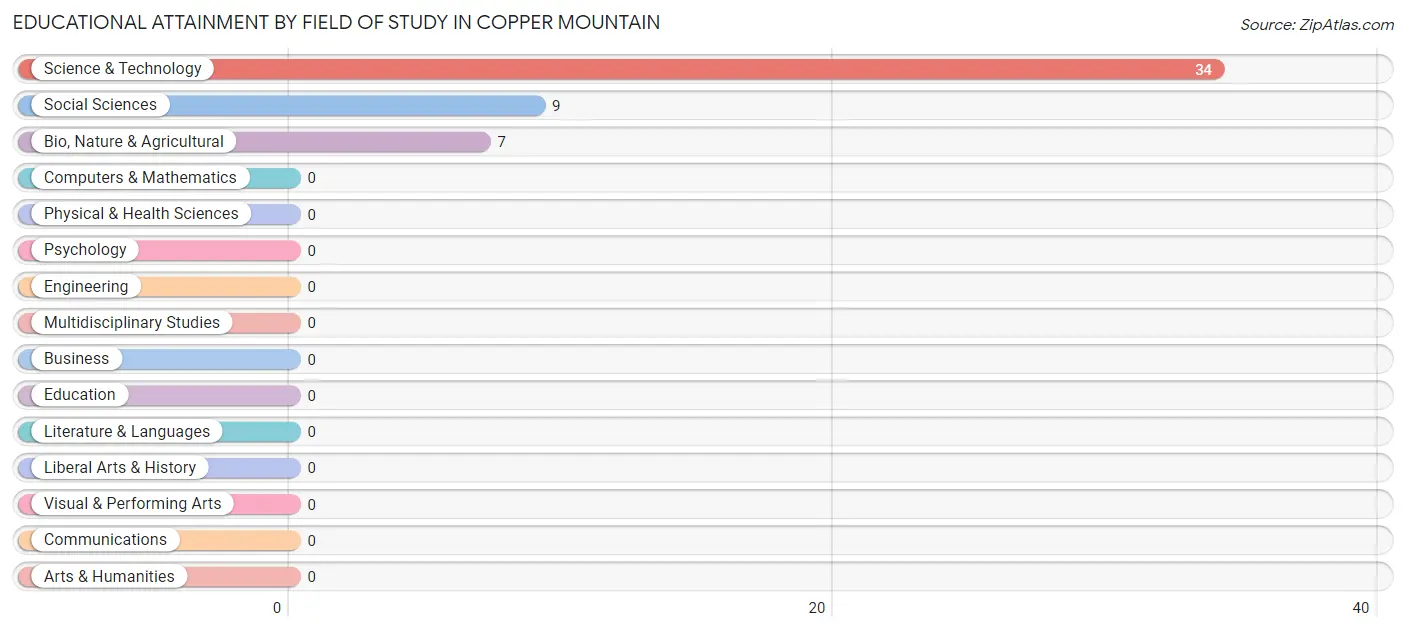
| Field of Study | # Graduates | % Graduates |
| Computers & Mathematics | 0 | 0.0% |
| Bio, Nature & Agricultural | 7 | 14.0% |
| Physical & Health Sciences | 0 | 0.0% |
| Psychology | 0 | 0.0% |
| Social Sciences | 9 | 18.0% |
| Engineering | 0 | 0.0% |
| Multidisciplinary Studies | 0 | 0.0% |
| Science & Technology | 34 | 68.0% |
| Business | 0 | 0.0% |
| Education | 0 | 0.0% |
| Literature & Languages | 0 | 0.0% |
| Liberal Arts & History | 0 | 0.0% |
| Visual & Performing Arts | 0 | 0.0% |
| Communications | 0 | 0.0% |
| Arts & Humanities | 0 | 0.0% |
| Total | 50 | 100.0% |
Transportation & Commute in Copper Mountain
Vehicle Availability by Sex in Copper Mountain
The most prevalent vehicle ownership categories in Copper Mountain are males with 1 vehicle (97, accounting for 71.9%) and females with 1 vehicle (0, making up 220.4%).
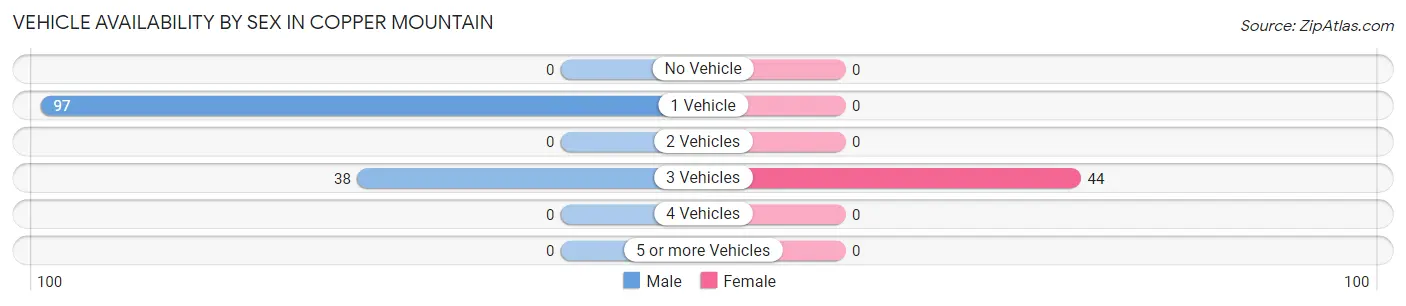
| Vehicles Available | Male | Female |
| No Vehicle | 0 (0.0%) | 0 (0.0%) |
| 1 Vehicle | 97 (71.9%) | 0 (0.0%) |
| 2 Vehicles | 0 (0.0%) | 0 (0.0%) |
| 3 Vehicles | 38 (28.1%) | 44 (100.0%) |
| 4 Vehicles | 0 (0.0%) | 0 (0.0%) |
| 5 or more Vehicles | 0 (0.0%) | 0 (0.0%) |
| Total | 135 (100.0%) | 44 (100.0%) |
Commute Time in Copper Mountain
The most frequently occuring commute durations in Copper Mountain are less than 5 minutes (113 commuters, 55.1%), 10 to 14 minutes (75 commuters, 36.6%), and 5 to 9 minutes (17 commuters, 8.3%).
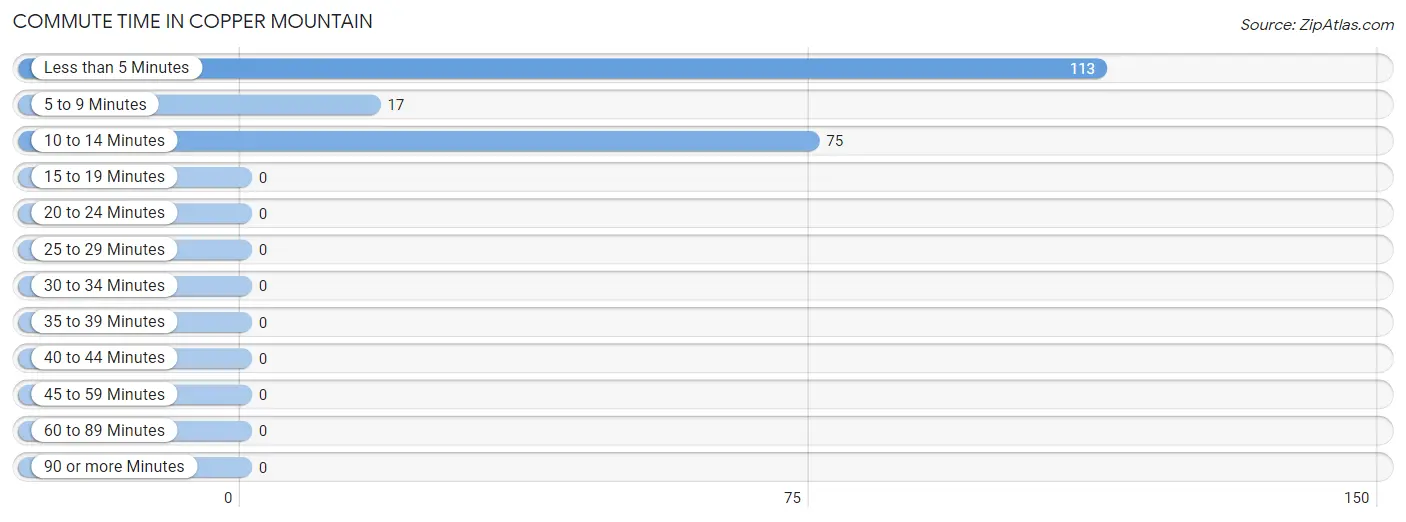
| Commute Time | # Commuters | % Commuters |
| Less than 5 Minutes | 113 | 55.1% |
| 5 to 9 Minutes | 17 | 8.3% |
| 10 to 14 Minutes | 75 | 36.6% |
| 15 to 19 Minutes | 0 | 0.0% |
| 20 to 24 Minutes | 0 | 0.0% |
| 25 to 29 Minutes | 0 | 0.0% |
| 30 to 34 Minutes | 0 | 0.0% |
| 35 to 39 Minutes | 0 | 0.0% |
| 40 to 44 Minutes | 0 | 0.0% |
| 45 to 59 Minutes | 0 | 0.0% |
| 60 to 89 Minutes | 0 | 0.0% |
| 90 or more Minutes | 0 | 0.0% |
Commute Time by Sex in Copper Mountain
The most common commute times in Copper Mountain are 10 to 14 minutes (75 commuters, 46.6%) for males and less than 5 minutes (44 commuters, 100.0%) for females.
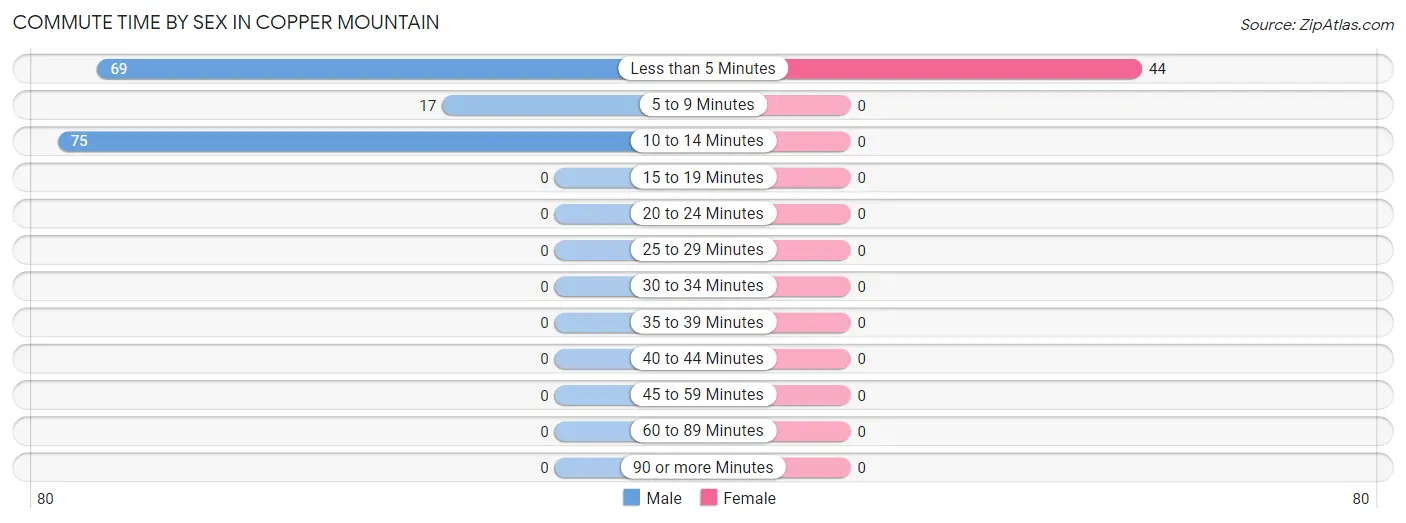
| Commute Time | Male | Female |
| Less than 5 Minutes | 69 (42.9%) | 44 (100.0%) |
| 5 to 9 Minutes | 17 (10.6%) | 0 (0.0%) |
| 10 to 14 Minutes | 75 (46.6%) | 0 (0.0%) |
| 15 to 19 Minutes | 0 (0.0%) | 0 (0.0%) |
| 20 to 24 Minutes | 0 (0.0%) | 0 (0.0%) |
| 25 to 29 Minutes | 0 (0.0%) | 0 (0.0%) |
| 30 to 34 Minutes | 0 (0.0%) | 0 (0.0%) |
| 35 to 39 Minutes | 0 (0.0%) | 0 (0.0%) |
| 40 to 44 Minutes | 0 (0.0%) | 0 (0.0%) |
| 45 to 59 Minutes | 0 (0.0%) | 0 (0.0%) |
| 60 to 89 Minutes | 0 (0.0%) | 0 (0.0%) |
| 90 or more Minutes | 0 (0.0%) | 0 (0.0%) |
Time of Departure to Work by Sex in Copper Mountain
The most frequent times of departure to work in Copper Mountain are 6:30 AM to 6:59 AM (50, 31.1%) for males and 6:00 AM to 6:29 AM (44, 100.0%) for females.
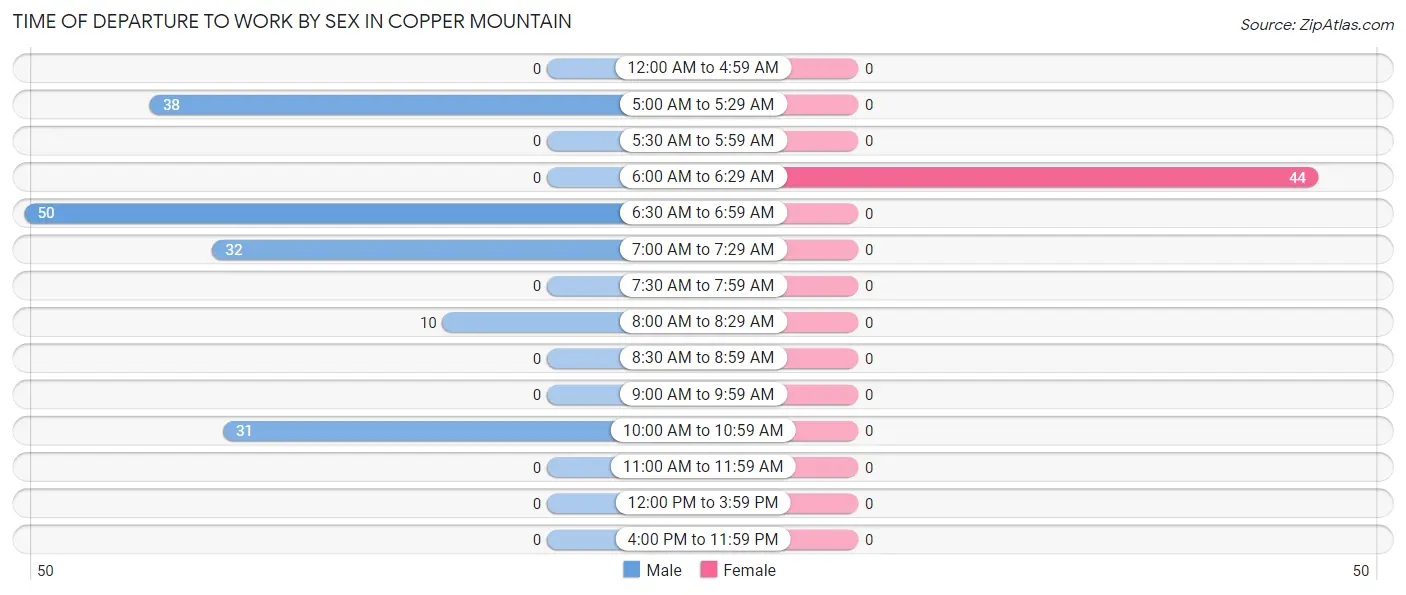
| Time of Departure | Male | Female |
| 12:00 AM to 4:59 AM | 0 (0.0%) | 0 (0.0%) |
| 5:00 AM to 5:29 AM | 38 (23.6%) | 0 (0.0%) |
| 5:30 AM to 5:59 AM | 0 (0.0%) | 0 (0.0%) |
| 6:00 AM to 6:29 AM | 0 (0.0%) | 44 (100.0%) |
| 6:30 AM to 6:59 AM | 50 (31.1%) | 0 (0.0%) |
| 7:00 AM to 7:29 AM | 32 (19.9%) | 0 (0.0%) |
| 7:30 AM to 7:59 AM | 0 (0.0%) | 0 (0.0%) |
| 8:00 AM to 8:29 AM | 10 (6.2%) | 0 (0.0%) |
| 8:30 AM to 8:59 AM | 0 (0.0%) | 0 (0.0%) |
| 9:00 AM to 9:59 AM | 0 (0.0%) | 0 (0.0%) |
| 10:00 AM to 10:59 AM | 31 (19.3%) | 0 (0.0%) |
| 11:00 AM to 11:59 AM | 0 (0.0%) | 0 (0.0%) |
| 12:00 PM to 3:59 PM | 0 (0.0%) | 0 (0.0%) |
| 4:00 PM to 11:59 PM | 0 (0.0%) | 0 (0.0%) |
| Total | 161 (100.0%) | 44 (100.0%) |
Housing Occupancy in Copper Mountain
Occupancy by Ownership in Copper Mountain
Of the total 141 dwellings in Copper Mountain, owner-occupied units account for 65 (46.1%), while renter-occupied units make up 76 (53.9%).
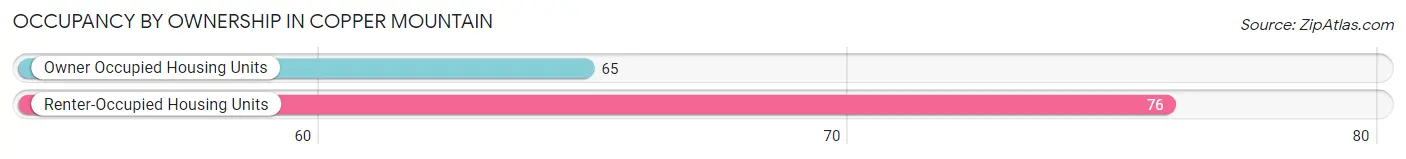
| Occupancy | # Housing Units | % Housing Units |
| Owner Occupied Housing Units | 65 | 46.1% |
| Renter-Occupied Housing Units | 76 | 53.9% |
| Total Occupied Housing Units | 141 | 100.0% |
Occupancy by Household Size in Copper Mountain
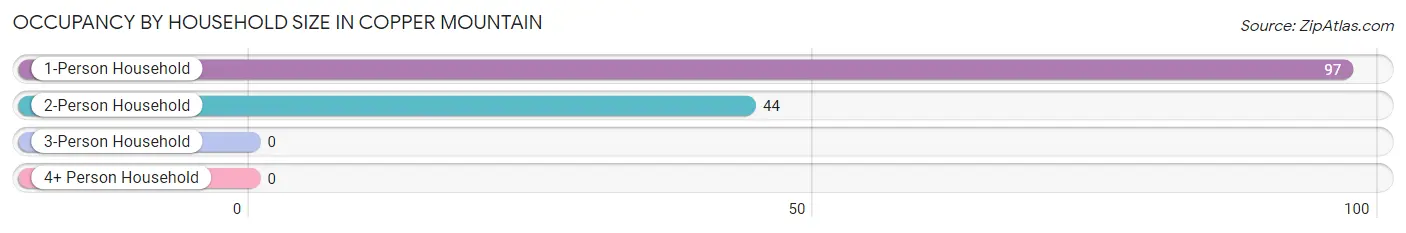
| Household Size | # Housing Units | % Housing Units |
| 1-Person Household | 97 | 68.8% |
| 2-Person Household | 44 | 31.2% |
| 3-Person Household | 0 | 0.0% |
| 4+ Person Household | 0 | 0.0% |
| Total Housing Units | 141 | 100.0% |
Occupancy by Ownership by Household Size in Copper Mountain
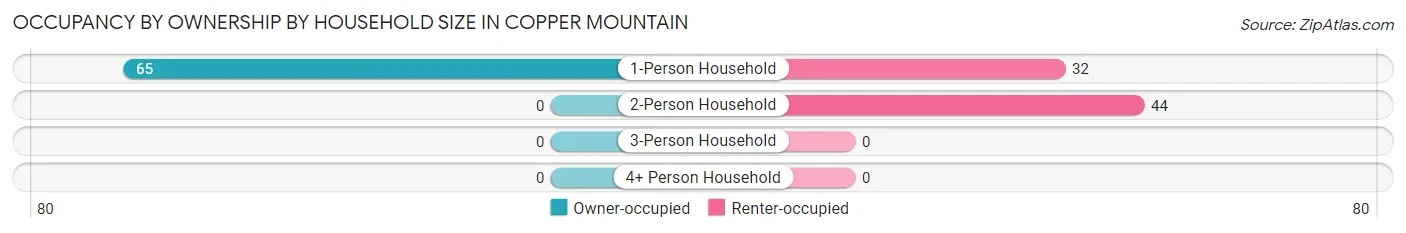
| Household Size | Owner-occupied | Renter-occupied |
| 1-Person Household | 65 (67.0%) | 32 (33.0%) |
| 2-Person Household | 0 (0.0%) | 44 (100.0%) |
| 3-Person Household | 0 (0.0%) | 0 (0.0%) |
| 4+ Person Household | 0 (0.0%) | 0 (0.0%) |
| Total Housing Units | 65 (46.1%) | 76 (53.9%) |
Occupancy by Educational Attainment in Copper Mountain
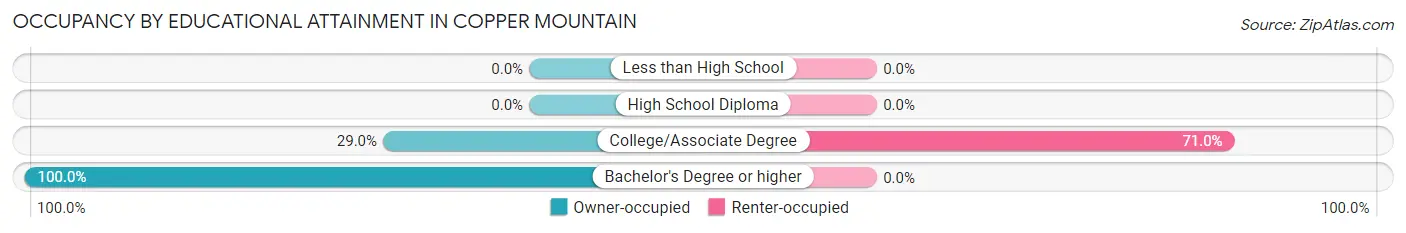
| Household Size | Owner-occupied | Renter-occupied |
| Less than High School | 0 (0.0%) | 0 (0.0%) |
| High School Diploma | 0 (0.0%) | 0 (0.0%) |
| College/Associate Degree | 31 (29.0%) | 76 (71.0%) |
| Bachelor's Degree or higher | 34 (100.0%) | 0 (0.0%) |
Occupancy by Age of Householder in Copper Mountain
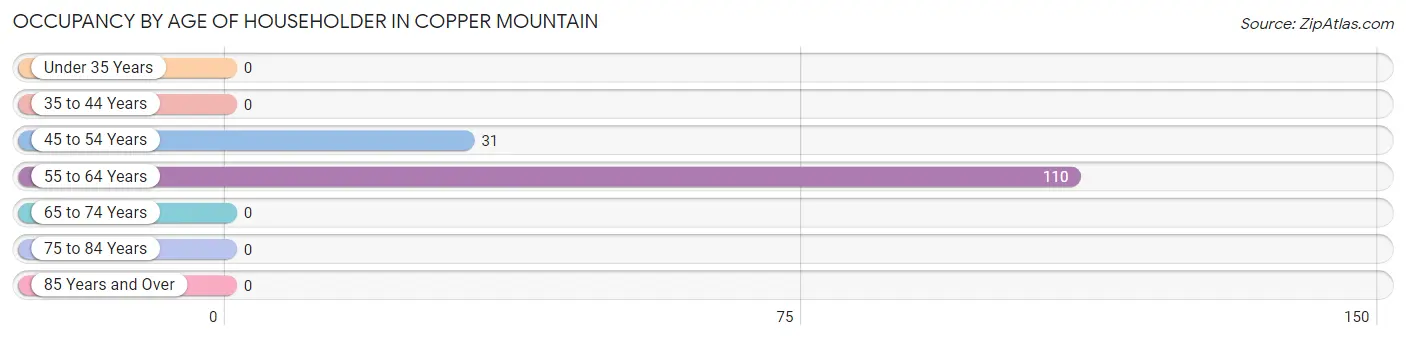
| Age Bracket | # Households | % Households |
| Under 35 Years | 0 | 0.0% |
| 35 to 44 Years | 0 | 0.0% |
| 45 to 54 Years | 31 | 22.0% |
| 55 to 64 Years | 110 | 78.0% |
| 65 to 74 Years | 0 | 0.0% |
| 75 to 84 Years | 0 | 0.0% |
| 85 Years and Over | 0 | 0.0% |
| Total | 141 | 100.0% |
Housing Finances in Copper Mountain
Median Income by Occupancy in Copper Mountain
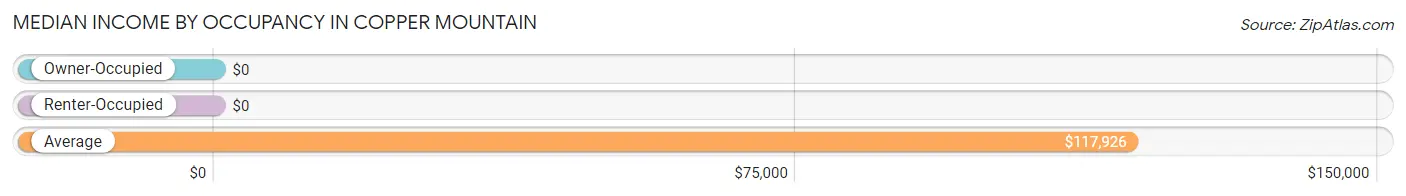
| Occupancy Type | # Households | Median Income |
| Owner-Occupied | 65 (46.1%) | $0 |
| Renter-Occupied | 76 (53.9%) | $0 |
| Average | 141 (100.0%) | $117,926 |
Occupancy by Householder Income Bracket in Copper Mountain
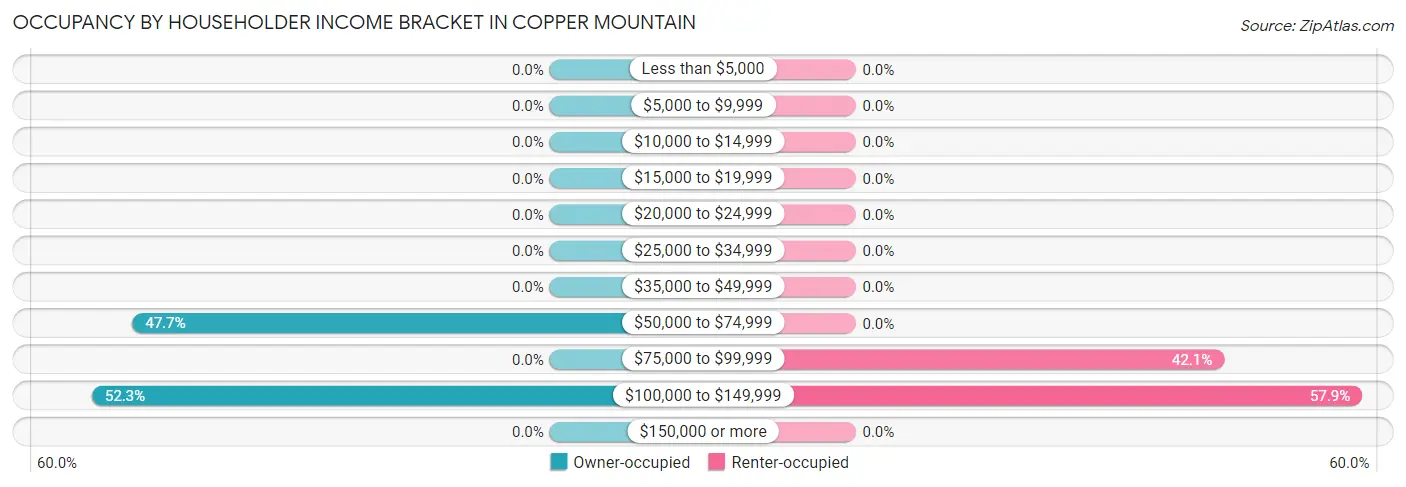
| Income Bracket | Owner-occupied | Renter-occupied |
| Less than $5,000 | 0 (0.0%) | 0 (0.0%) |
| $5,000 to $9,999 | 0 (0.0%) | 0 (0.0%) |
| $10,000 to $14,999 | 0 (0.0%) | 0 (0.0%) |
| $15,000 to $19,999 | 0 (0.0%) | 0 (0.0%) |
| $20,000 to $24,999 | 0 (0.0%) | 0 (0.0%) |
| $25,000 to $34,999 | 0 (0.0%) | 0 (0.0%) |
| $35,000 to $49,999 | 0 (0.0%) | 0 (0.0%) |
| $50,000 to $74,999 | 31 (47.7%) | 0 (0.0%) |
| $75,000 to $99,999 | 0 (0.0%) | 32 (42.1%) |
| $100,000 to $149,999 | 34 (52.3%) | 44 (57.9%) |
| $150,000 or more | 0 (0.0%) | 0 (0.0%) |
| Total | 65 (100.0%) | 76 (100.0%) |
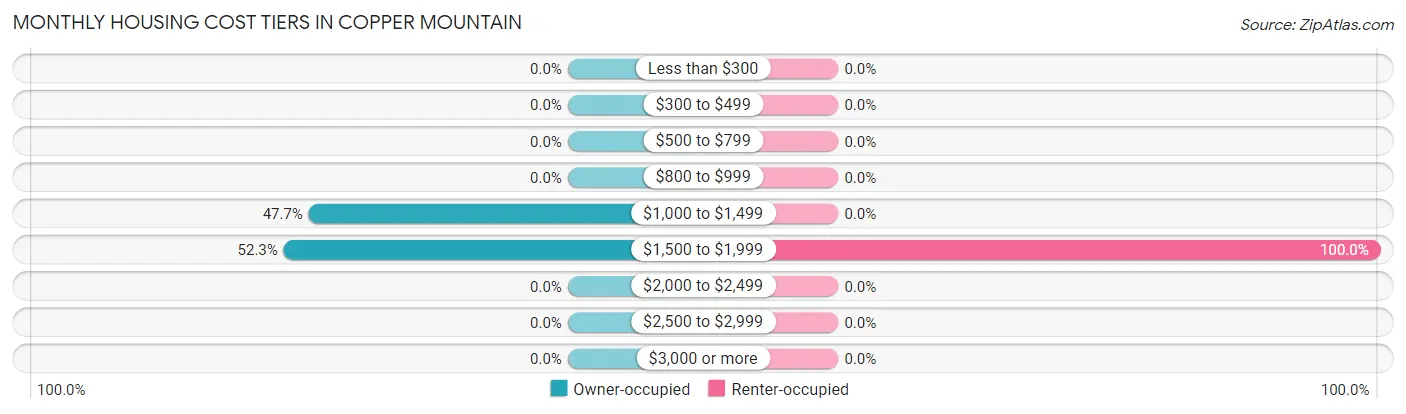
Monthly Housing Cost Tiers in Copper Mountain
| Monthly Cost | Owner-occupied | Renter-occupied |
| Less than $300 | 0 (0.0%) | 0 (0.0%) |
| $300 to $499 | 0 (0.0%) | 0 (0.0%) |
| $500 to $799 | 0 (0.0%) | 0 (0.0%) |
| $800 to $999 | 0 (0.0%) | 0 (0.0%) |
| $1,000 to $1,499 | 31 (47.7%) | 0 (0.0%) |
| $1,500 to $1,999 | 34 (52.3%) | 76 (100.0%) |
| $2,000 to $2,499 | 0 (0.0%) | 0 (0.0%) |
| $2,500 to $2,999 | 0 (0.0%) | 0 (0.0%) |
| $3,000 or more | 0 (0.0%) | 0 (0.0%) |
| Total | 65 (100.0%) | 76 (100.0%) |
Physical Housing Characteristics in Copper Mountain
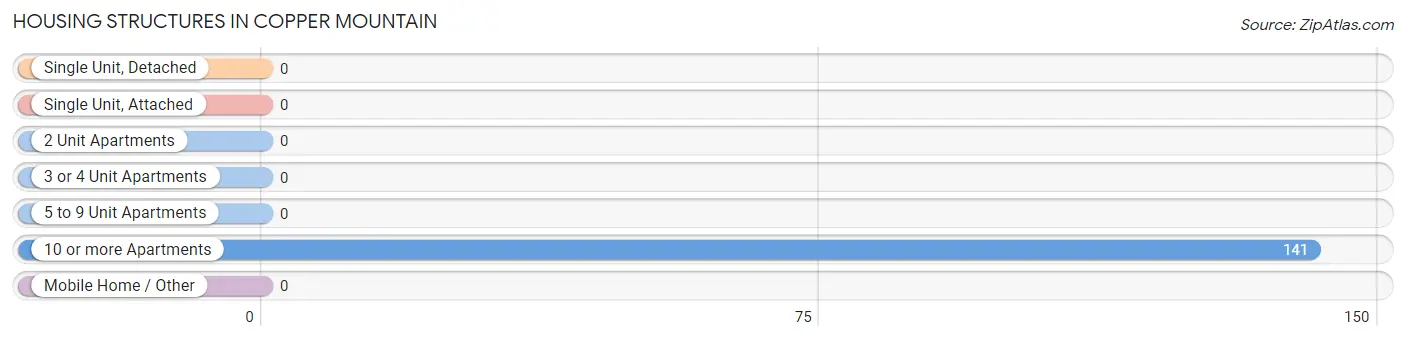
Housing Structures in Copper Mountain
| Structure Type | # Housing Units | % Housing Units |
| Single Unit, Detached | 0 | 0.0% |
| Single Unit, Attached | 0 | 0.0% |
| 2 Unit Apartments | 0 | 0.0% |
| 3 or 4 Unit Apartments | 0 | 0.0% |
| 5 to 9 Unit Apartments | 0 | 0.0% |
| 10 or more Apartments | 141 | 100.0% |
| Mobile Home / Other | 0 | 0.0% |
| Total | 141 | 100.0% |
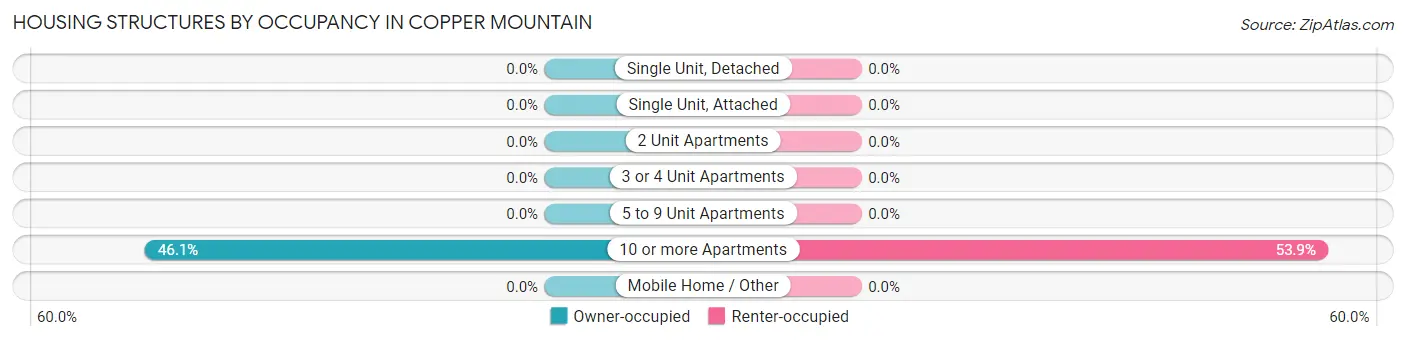
Housing Structures by Occupancy in Copper Mountain
| Structure Type | Owner-occupied | Renter-occupied |
| Single Unit, Detached | 0 (0.0%) | 0 (0.0%) |
| Single Unit, Attached | 0 (0.0%) | 0 (0.0%) |
| 2 Unit Apartments | 0 (0.0%) | 0 (0.0%) |
| 3 or 4 Unit Apartments | 0 (0.0%) | 0 (0.0%) |
| 5 to 9 Unit Apartments | 0 (0.0%) | 0 (0.0%) |
| 10 or more Apartments | 65 (46.1%) | 76 (53.9%) |
| Mobile Home / Other | 0 (0.0%) | 0 (0.0%) |
| Total | 65 (46.1%) | 76 (53.9%) |
Housing Structures by Number of Rooms in Copper Mountain
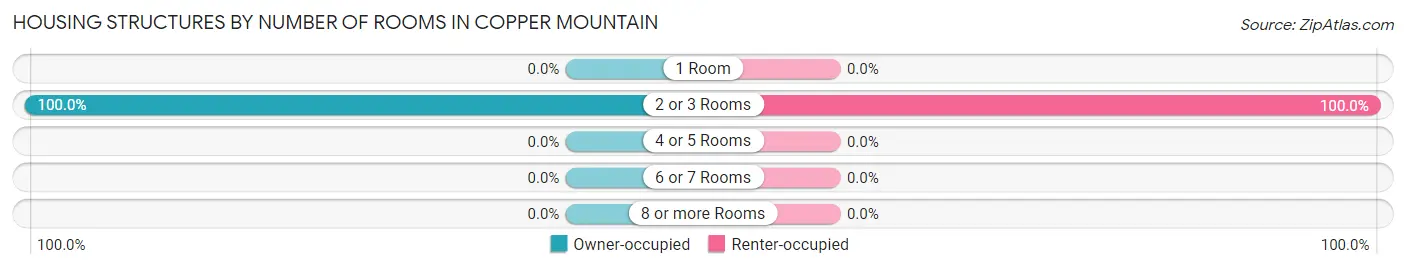
| Number of Rooms | Owner-occupied | Renter-occupied |
| 1 Room | 0 (0.0%) | 0 (0.0%) |
| 2 or 3 Rooms | 65 (100.0%) | 76 (100.0%) |
| 4 or 5 Rooms | 0 (0.0%) | 0 (0.0%) |
| 6 or 7 Rooms | 0 (0.0%) | 0 (0.0%) |
| 8 or more Rooms | 0 (0.0%) | 0 (0.0%) |
| Total | 65 (100.0%) | 76 (100.0%) |
Housing Structure by Heating Type in Copper Mountain
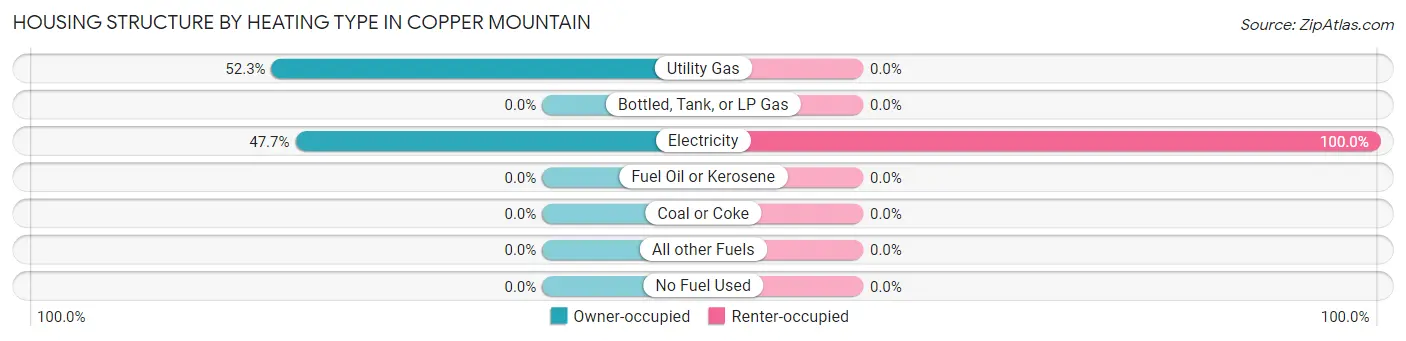
| Heating Type | Owner-occupied | Renter-occupied |
| Utility Gas | 34 (52.3%) | 0 (0.0%) |
| Bottled, Tank, or LP Gas | 0 (0.0%) | 0 (0.0%) |
| Electricity | 31 (47.7%) | 76 (100.0%) |
| Fuel Oil or Kerosene | 0 (0.0%) | 0 (0.0%) |
| Coal or Coke | 0 (0.0%) | 0 (0.0%) |
| All other Fuels | 0 (0.0%) | 0 (0.0%) |
| No Fuel Used | 0 (0.0%) | 0 (0.0%) |
| Total | 65 (100.0%) | 76 (100.0%) |
Household Vehicle Usage in Copper Mountain
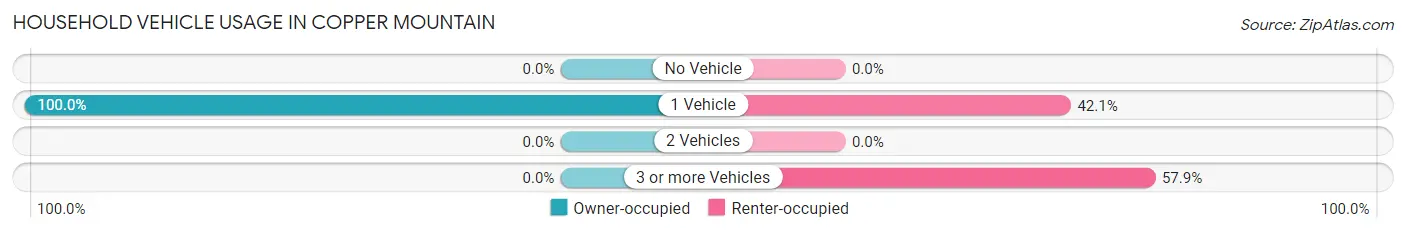
| Vehicles per Household | Owner-occupied | Renter-occupied |
| No Vehicle | 0 (0.0%) | 0 (0.0%) |
| 1 Vehicle | 65 (100.0%) | 32 (42.1%) |
| 2 Vehicles | 0 (0.0%) | 0 (0.0%) |
| 3 or more Vehicles | 0 (0.0%) | 44 (57.9%) |
| Total | 65 (100.0%) | 76 (100.0%) |
Real Estate & Mortgages in Copper Mountain
Real Estate and Mortgage Overview in Copper Mountain
| Characteristic | Without Mortgage | With Mortgage |
| Housing Units | 0 | 65 |
| Median Property Value | - | - |
| Median Household Income | - | - |
| Monthly Housing Costs | - | - |
| Real Estate Taxes | - | - |
Property Value by Mortgage Status in Copper Mountain
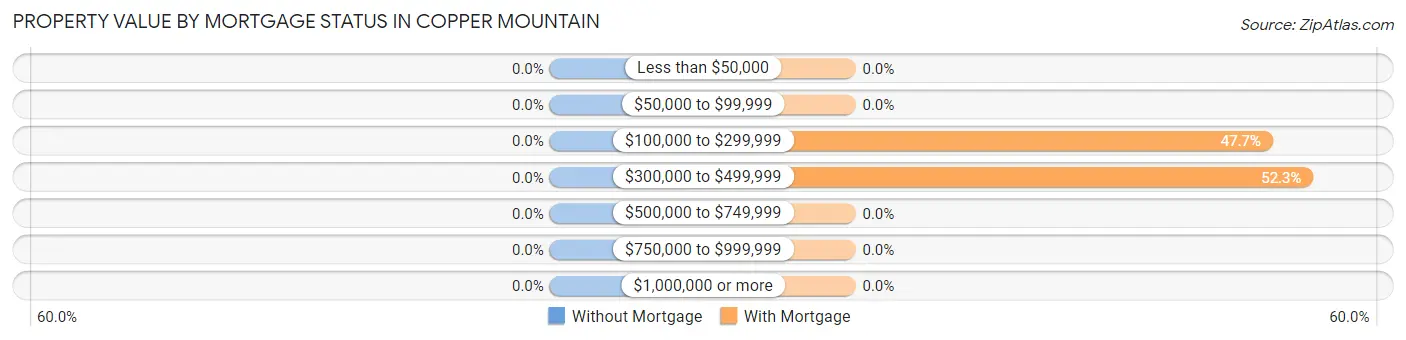
| Property Value | Without Mortgage | With Mortgage |
| Less than $50,000 | 0 (0.0%) | 0 (0.0%) |
| $50,000 to $99,999 | 0 (0.0%) | 0 (0.0%) |
| $100,000 to $299,999 | 0 (0.0%) | 31 (47.7%) |
| $300,000 to $499,999 | 0 (0.0%) | 34 (52.3%) |
| $500,000 to $749,999 | 0 (0.0%) | 0 (0.0%) |
| $750,000 to $999,999 | 0 (0.0%) | 0 (0.0%) |
| $1,000,000 or more | 0 (0.0%) | 0 (0.0%) |
| Total | 0 (0.0%) | 65 (100.0%) |
Household Income by Mortgage Status in Copper Mountain
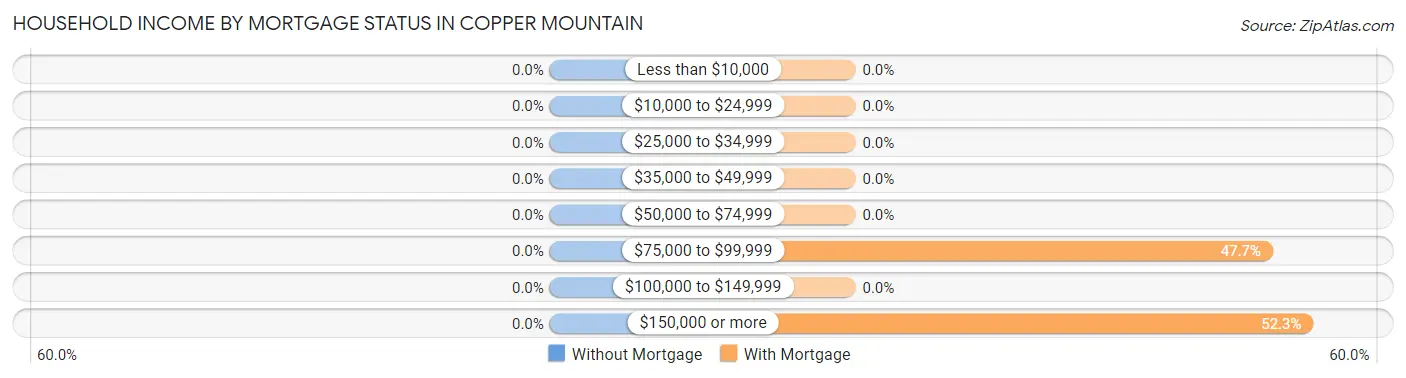
| Household Income | Without Mortgage | With Mortgage |
| Less than $10,000 | 0 (0.0%) | 0 (0.0%) |
| $10,000 to $24,999 | 0 (0.0%) | 0 (0.0%) |
| $25,000 to $34,999 | 0 (0.0%) | 0 (0.0%) |
| $35,000 to $49,999 | 0 (0.0%) | 0 (0.0%) |
| $50,000 to $74,999 | 0 (0.0%) | 0 (0.0%) |
| $75,000 to $99,999 | 0 (0.0%) | 31 (47.7%) |
| $100,000 to $149,999 | 0 (0.0%) | 0 (0.0%) |
| $150,000 or more | 0 (0.0%) | 34 (52.3%) |
| Total | 0 (0.0%) | 65 (100.0%) |
Property Value to Household Income Ratio in Copper Mountain
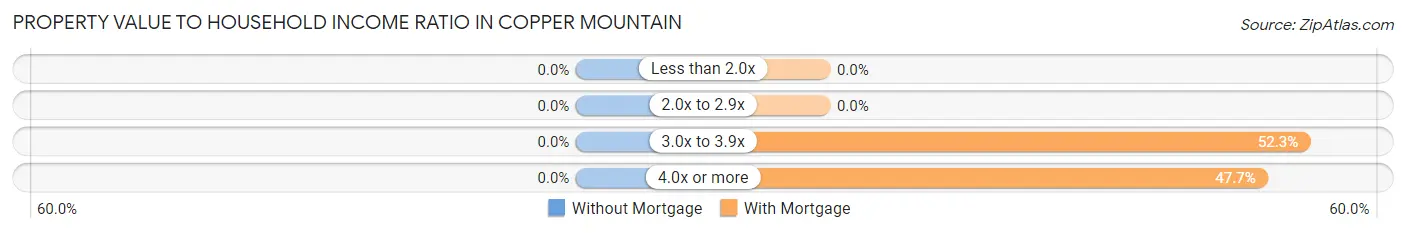
| Value-to-Income Ratio | Without Mortgage | With Mortgage |
| Less than 2.0x | 0 (0.0%) | 0 (0.0%) |
| 2.0x to 2.9x | 0 (0.0%) | 0 (0.0%) |
| 3.0x to 3.9x | 0 (0.0%) | 34 (52.3%) |
| 4.0x or more | 0 (0.0%) | 31 (47.7%) |
| Total | 0 (0.0%) | 65 (100.0%) |
Real Estate Taxes by Mortgage Status in Copper Mountain
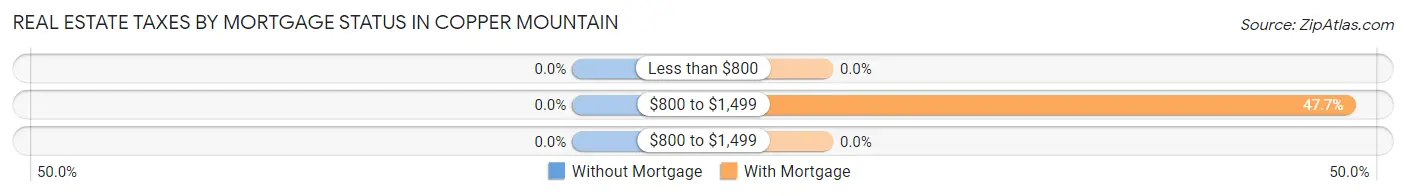
| Property Taxes | Without Mortgage | With Mortgage |
| Less than $800 | 0 (0.0%) | 0 (0.0%) |
| $800 to $1,499 | 0 (0.0%) | 31 (47.7%) |
| $800 to $1,499 | 0 (0.0%) | 0 (0.0%) |
| Total | 0 (0.0%) | 65 (100.0%) |
Health & Disability in Copper Mountain
Health Insurance Coverage by Age in Copper Mountain
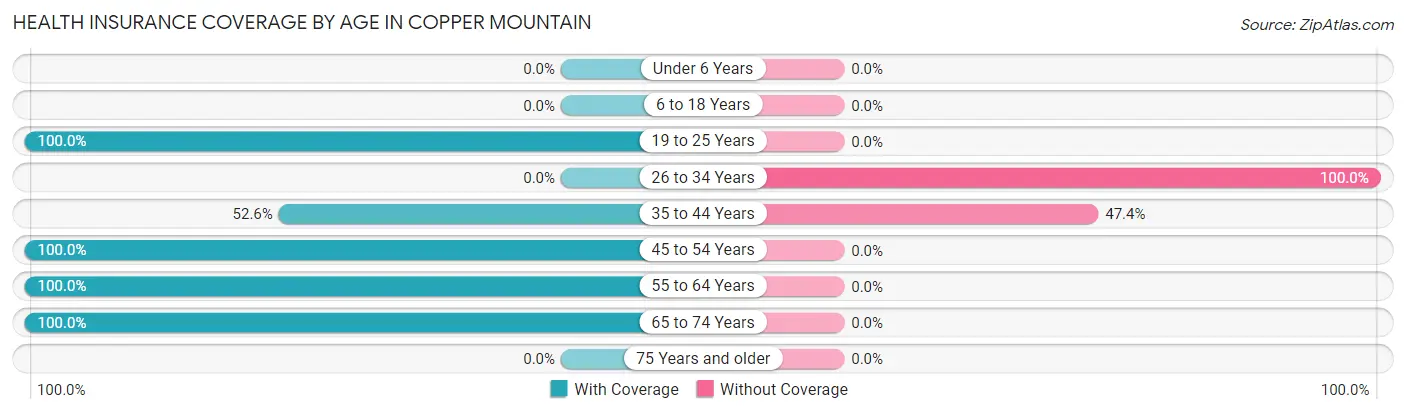
| Age Bracket | With Coverage | Without Coverage |
| Under 6 Years | 0 (0.0%) | 0 (0.0%) |
| 6 to 18 Years | 0 (0.0%) | 0 (0.0%) |
| 19 to 25 Years | 80 (100.0%) | 0 (0.0%) |
| 26 to 34 Years | 0 (0.0%) | 7 (100.0%) |
| 35 to 44 Years | 10 (52.6%) | 9 (47.4%) |
| 45 to 54 Years | 31 (100.0%) | 0 (0.0%) |
| 55 to 64 Years | 110 (100.0%) | 0 (0.0%) |
| 65 to 74 Years | 38 (100.0%) | 0 (0.0%) |
| 75 Years and older | 0 (0.0%) | 0 (0.0%) |
| Total | 269 (94.4%) | 16 (5.6%) |
Health Insurance Coverage by Citizenship Status in Copper Mountain
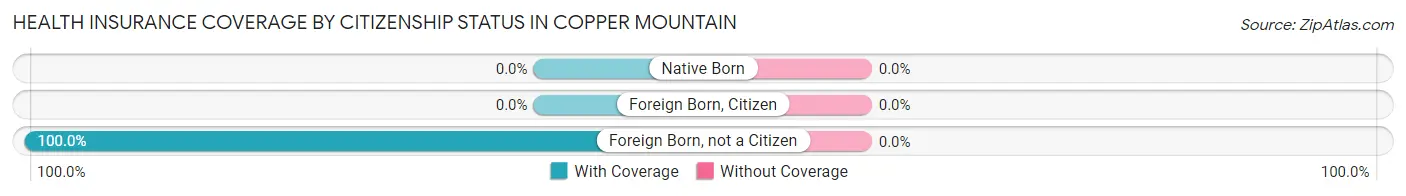
| Citizenship Status | With Coverage | Without Coverage |
| Native Born | 0 (0.0%) | 0 (0.0%) |
| Foreign Born, Citizen | 0 (0.0%) | 0 (0.0%) |
| Foreign Born, not a Citizen | 80 (100.0%) | 0 (0.0%) |
Health Insurance Coverage by Household Income in Copper Mountain
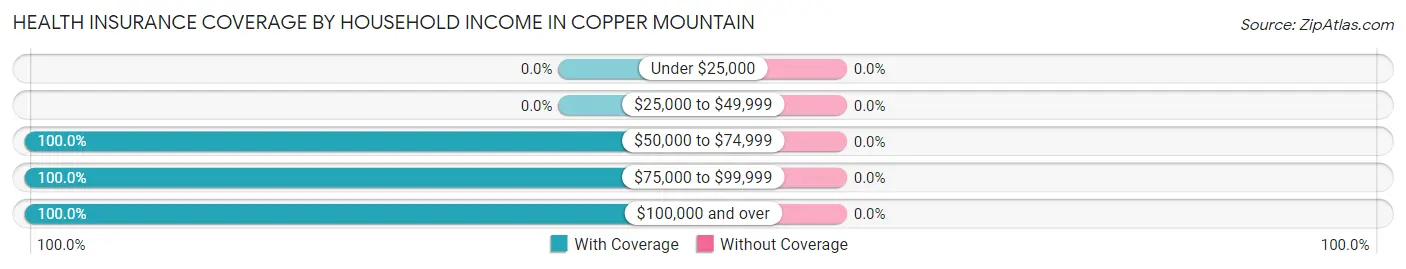
| Household Income | With Coverage | Without Coverage |
| Under $25,000 | 0 (0.0%) | 0 (0.0%) |
| $25,000 to $49,999 | 0 (0.0%) | 0 (0.0%) |
| $50,000 to $74,999 | 31 (100.0%) | 0 (0.0%) |
| $75,000 to $99,999 | 32 (100.0%) | 0 (0.0%) |
| $100,000 and over | 116 (100.0%) | 0 (0.0%) |
Public vs Private Health Insurance Coverage by Age in Copper Mountain
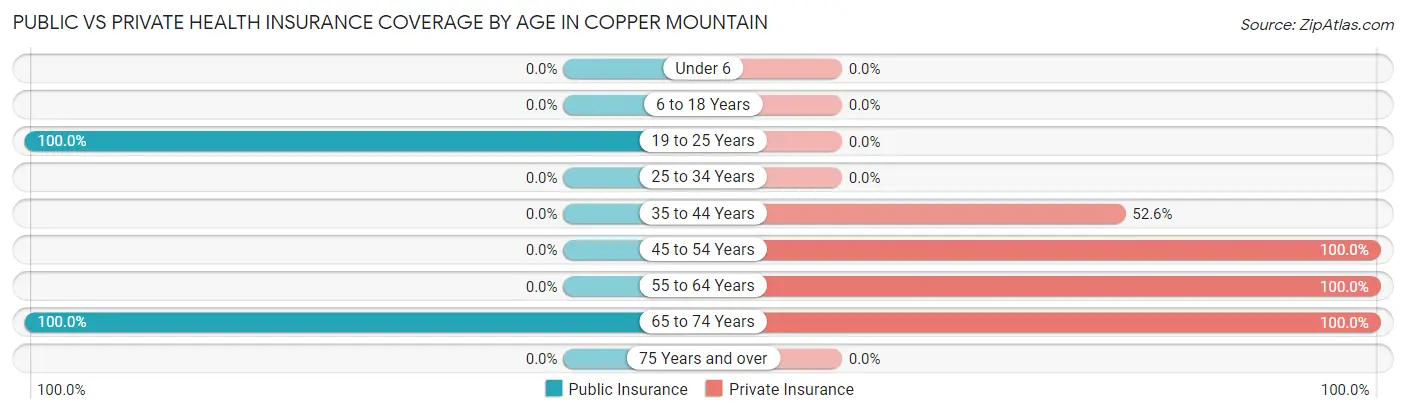
| Age Bracket | Public Insurance | Private Insurance |
| Under 6 | 0 (0.0%) | 0 (0.0%) |
| 6 to 18 Years | 0 (0.0%) | 0 (0.0%) |
| 19 to 25 Years | 80 (100.0%) | 0 (0.0%) |
| 25 to 34 Years | 0 (0.0%) | 0 (0.0%) |
| 35 to 44 Years | 0 (0.0%) | 10 (52.6%) |
| 45 to 54 Years | 0 (0.0%) | 31 (100.0%) |
| 55 to 64 Years | 0 (0.0%) | 110 (100.0%) |
| 65 to 74 Years | 38 (100.0%) | 38 (100.0%) |
| 75 Years and over | 0 (0.0%) | 0 (0.0%) |
| Total | 118 (41.4%) | 189 (66.3%) |
Disability Status by Sex by Age in Copper Mountain
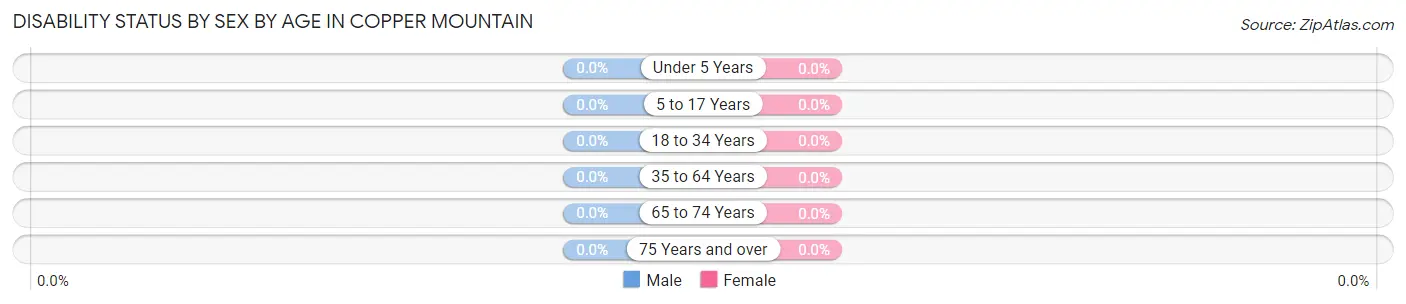
| Age Bracket | Male | Female |
| Under 5 Years | 0 (0.0%) | 0 (0.0%) |
| 5 to 17 Years | 0 (0.0%) | 0 (0.0%) |
| 18 to 34 Years | 0 (0.0%) | 0 (0.0%) |
| 35 to 64 Years | 0 (0.0%) | 0 (0.0%) |
| 65 to 74 Years | 0 (0.0%) | 0 (0.0%) |
| 75 Years and over | 0 (0.0%) | 0 (0.0%) |
Disability Class by Sex by Age in Copper Mountain
Disability Class: Hearing Difficulty
| Age Bracket | Male | Female |
| Under 5 Years | 0 (0.0%) | 0 (0.0%) |
| 5 to 17 Years | 0 (0.0%) | 0 (0.0%) |
| 18 to 34 Years | 0 (0.0%) | 0 (0.0%) |
| 35 to 64 Years | 0 (0.0%) | 0 (0.0%) |
| 65 to 74 Years | 0 (0.0%) | 0 (0.0%) |
| 75 Years and over | 0 (0.0%) | 0 (0.0%) |
Disability Class: Vision Difficulty
| Age Bracket | Male | Female |
| Under 5 Years | 0 (0.0%) | 0 (0.0%) |
| 5 to 17 Years | 0 (0.0%) | 0 (0.0%) |
| 18 to 34 Years | 0 (0.0%) | 0 (0.0%) |
| 35 to 64 Years | 0 (0.0%) | 0 (0.0%) |
| 65 to 74 Years | 0 (0.0%) | 0 (0.0%) |
| 75 Years and over | 0 (0.0%) | 0 (0.0%) |
Disability Class: Cognitive Difficulty
| Age Bracket | Male | Female |
| 5 to 17 Years | 0 (0.0%) | 0 (0.0%) |
| 18 to 34 Years | 0 (0.0%) | 0 (0.0%) |
| 35 to 64 Years | 0 (0.0%) | 0 (0.0%) |
| 65 to 74 Years | 0 (0.0%) | 0 (0.0%) |
| 75 Years and over | 0 (0.0%) | 0 (0.0%) |
Disability Class: Ambulatory Difficulty
| Age Bracket | Male | Female |
| 5 to 17 Years | 0 (0.0%) | 0 (0.0%) |
| 18 to 34 Years | 0 (0.0%) | 0 (0.0%) |
| 35 to 64 Years | 0 (0.0%) | 0 (0.0%) |
| 65 to 74 Years | 0 (0.0%) | 0 (0.0%) |
| 75 Years and over | 0 (0.0%) | 0 (0.0%) |
Disability Class: Self-Care Difficulty
| Age Bracket | Male | Female |
| 5 to 17 Years | 0 (0.0%) | 0 (0.0%) |
| 18 to 34 Years | 0 (0.0%) | 0 (0.0%) |
| 35 to 64 Years | 0 (0.0%) | 0 (0.0%) |
| 65 to 74 Years | 0 (0.0%) | 0 (0.0%) |
| 75 Years and over | 0 (0.0%) | 0 (0.0%) |
Technology Access in Copper Mountain
Computing Device Access in Copper Mountain
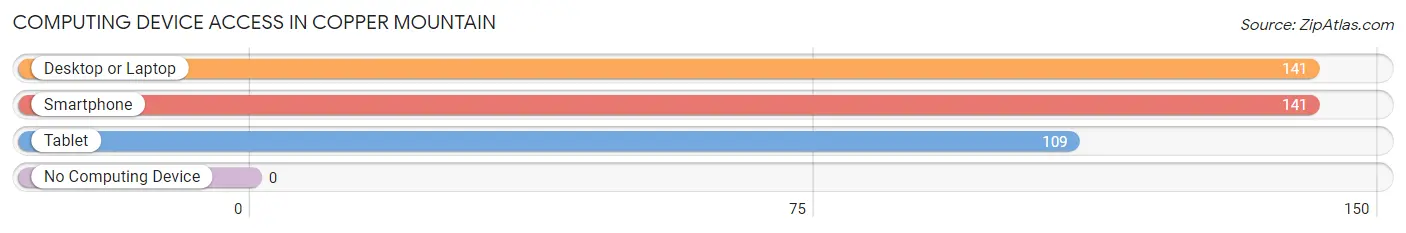
| Device Type | # Households | % Households |
| Desktop or Laptop | 141 | 100.0% |
| Smartphone | 141 | 100.0% |
| Tablet | 109 | 77.3% |
| No Computing Device | 0 | 0.0% |
| Total | 141 | 100.0% |
Internet Access in Copper Mountain
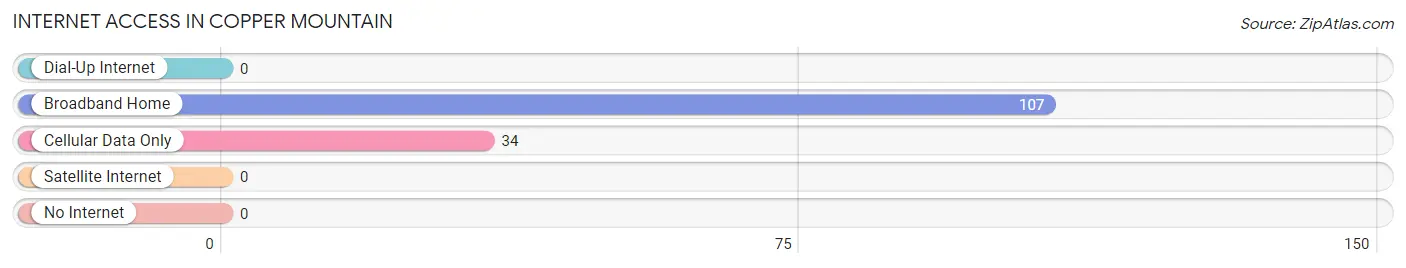
| Internet Type | # Households | % Households |
| Dial-Up Internet | 0 | 0.0% |
| Broadband Home | 107 | 75.9% |
| Cellular Data Only | 34 | 24.1% |
| Satellite Internet | 0 | 0.0% |
| No Internet | 0 | 0.0% |
| Total | 141 | 100.0% |
Copper Mountain Summary
Copper Mountain, Colorado is a small mountain town located in Summit County, Colorado. It is situated in the Tenmile Range of the Rocky Mountains, approximately 75 miles west of Denver. The town is known for its ski resort, which is one of the most popular ski destinations in the state. Copper Mountain is also home to a variety of other outdoor activities, including hiking, biking, fishing, and camping.
History
Copper Mountain was first settled in the late 1800s by miners who were searching for copper ore. The town was originally called Wheeler Junction, but was later renamed Copper Mountain in the early 1900s. The town was incorporated in 1972 and has since grown to become a popular ski destination.
Geography
Copper Mountain is located in Summit County, Colorado, in the Tenmile Range of the Rocky Mountains. The town is situated at an elevation of 9,712 feet, making it one of the highest towns in the state. The town is surrounded by the White River National Forest, which provides a variety of outdoor activities for visitors.
Economy
Copper Mountain’s economy is largely based on tourism. The town is home to a popular ski resort, which attracts visitors from all over the world. The resort offers a variety of activities, including skiing, snowboarding, tubing, and snowshoeing. The town also has a variety of restaurants, shops, and lodging options for visitors.
Demographics
As of the 2010 census, Copper Mountain had a population of 463. The town is predominantly white, with 91.2% of the population identifying as such. The median household income in Copper Mountain is $63,750, and the median age is 37.
Copper Mountain is a small mountain town with a rich history and a vibrant economy. The town is known for its ski resort, which attracts visitors from all over the world. The town also offers a variety of other outdoor activities, making it a great destination for those looking to explore the Rocky Mountains.
Common Questions
What is Per Capita Income in Copper Mountain?
Per Capita income in Copper Mountain is $56,871.
What is the Median Household income in Copper Mountain?
Median Household Income in Copper Mountain is $117,926.
What is Inequality or Gini Index in Copper Mountain?
Inequality or Gini Index in Copper Mountain is 0.16.
What is the Total Population of Copper Mountain?
Total Population of Copper Mountain is 285.
What is the Total Male Population of Copper Mountain?
Total Male Population of Copper Mountain is 241.
What is the Total Female Population of Copper Mountain?
Total Female Population of Copper Mountain is 44.
What is the Ratio of Males per 100 Females in Copper Mountain?
There are 547.73 Males per 100 Females in Copper Mountain.
What is the Ratio of Females per 100 Males in Copper Mountain?
There are 18.26 Females per 100 Males in Copper Mountain.
What is the Median Population Age in Copper Mountain?
Median Population Age in Copper Mountain is 57.1 Years.
What is the Average Family Size in Copper Mountain
Average Family Size in Copper Mountain is 1.9 People.
What is the Average Household Size in Copper Mountain
Average Household Size in Copper Mountain is 1.3 People.
How Large is the Labor Force in Copper Mountain?
There are 205 People in the Labor Forcein in Copper Mountain.
What is the Percentage of People in the Labor Force in Copper Mountain?
71.9% of People are in the Labor Force in Copper Mountain.