Bodega, CA Map & Demographics
Bodega Map
Bodega Overview
$56,724
PER CAPITA INCOME
$143,103
AVG FAMILY INCOME
$170,129
AVG HOUSEHOLD INCOME
0.44
INEQUALITY / GINI INDEX
547
TOTAL POPULATION
278
MALE POPULATION
269
FEMALE POPULATION
103.35
MALES / 100 FEMALES
96.76
FEMALES / 100 MALES
38.6
MEDIAN AGE
3.3
AVG FAMILY SIZE
5.2
AVG HOUSEHOLD SIZE
244
LABOR FORCE [ PEOPLE ]
57.7%
PERCENT IN LABOR FORCE
30.3%
UNEMPLOYMENT RATE
Bodega Zip Codes
Bodega Area Codes
Income in Bodega
Income Overview in Bodega
Per Capita Income in Bodega is $56,724, while median incomes of families and households are $143,103 and $170,129 respectively.
| Characteristic | Number | Measure |
| Per Capita Income | 547 | $56,724 |
| Median Family Income | 94 | $143,103 |
| Mean Family Income | 94 | $282,471 |
| Median Household Income | 105 | $170,129 |
| Mean Household Income | 105 | $264,244 |
| Income Deficit | 94 | $0 |
| Wage / Income Gap (%) | 547 | 0.00% |
| Wage / Income Gap ($) | 547 | 100.00¢ per $1 |
| Gini / Inequality Index | 547 | 0.44 |
Earnings by Sex in Bodega
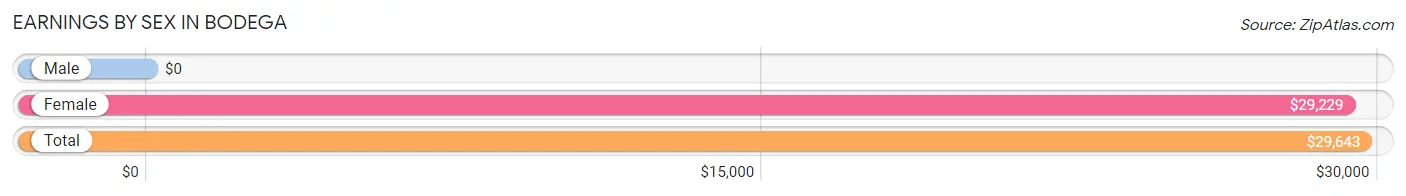
| Sex | Number | Average Earnings |
| Male | 113 (50.0%) | $0 |
| Female | 113 (50.0%) | $29,229 |
| Total | 226 (100.0%) | $29,643 |
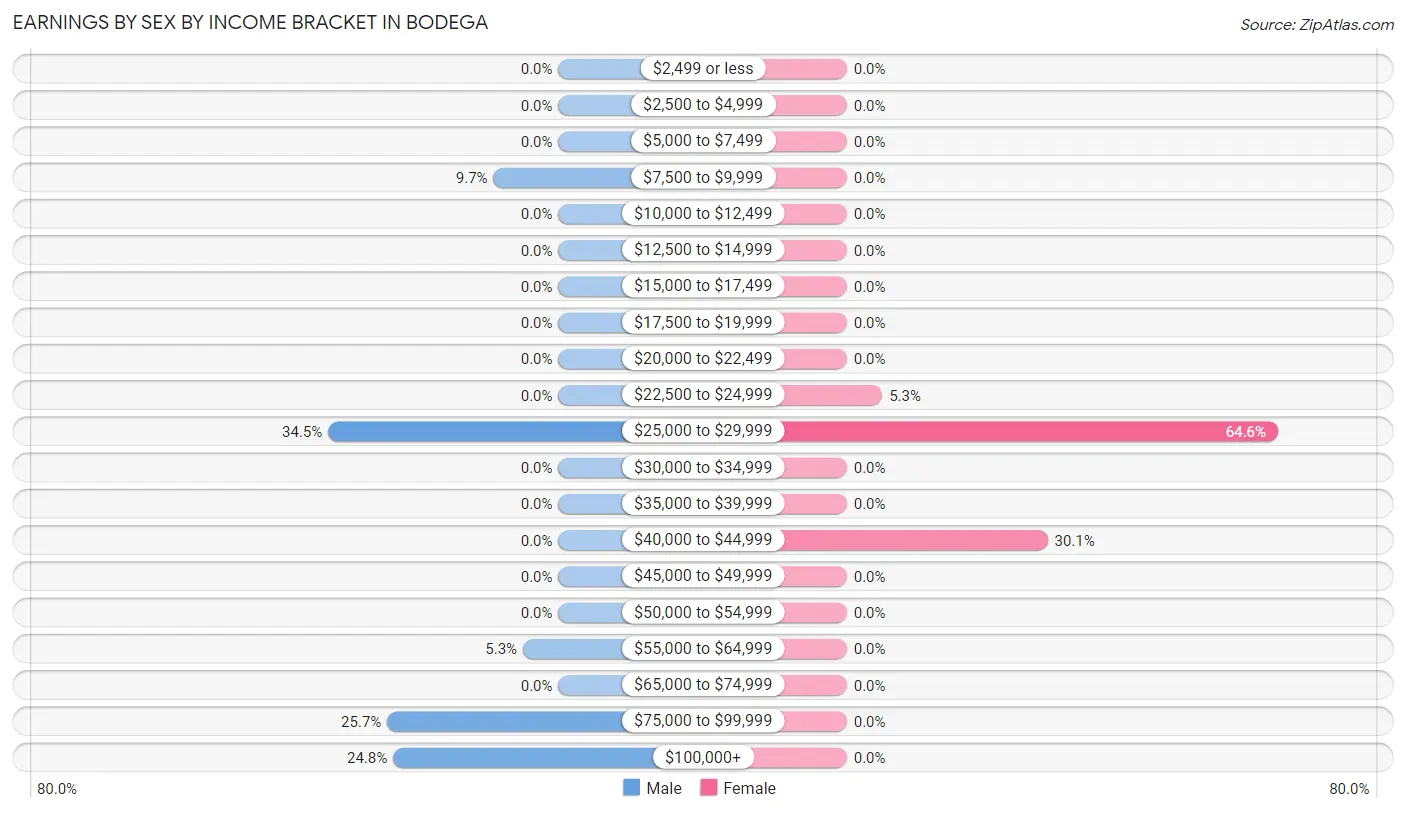
Earnings by Sex by Income Bracket in Bodega
The most common earnings brackets in Bodega are $25,000 to $29,999 for men (39 | 34.5%) and $25,000 to $29,999 for women (73 | 64.6%).
| Income | Male | Female |
| $2,499 or less | 0 (0.0%) | 0 (0.0%) |
| $2,500 to $4,999 | 0 (0.0%) | 0 (0.0%) |
| $5,000 to $7,499 | 0 (0.0%) | 0 (0.0%) |
| $7,500 to $9,999 | 11 (9.7%) | 0 (0.0%) |
| $10,000 to $12,499 | 0 (0.0%) | 0 (0.0%) |
| $12,500 to $14,999 | 0 (0.0%) | 0 (0.0%) |
| $15,000 to $17,499 | 0 (0.0%) | 0 (0.0%) |
| $17,500 to $19,999 | 0 (0.0%) | 0 (0.0%) |
| $20,000 to $22,499 | 0 (0.0%) | 0 (0.0%) |
| $22,500 to $24,999 | 0 (0.0%) | 6 (5.3%) |
| $25,000 to $29,999 | 39 (34.5%) | 73 (64.6%) |
| $30,000 to $34,999 | 0 (0.0%) | 0 (0.0%) |
| $35,000 to $39,999 | 0 (0.0%) | 0 (0.0%) |
| $40,000 to $44,999 | 0 (0.0%) | 34 (30.1%) |
| $45,000 to $49,999 | 0 (0.0%) | 0 (0.0%) |
| $50,000 to $54,999 | 0 (0.0%) | 0 (0.0%) |
| $55,000 to $64,999 | 6 (5.3%) | 0 (0.0%) |
| $65,000 to $74,999 | 0 (0.0%) | 0 (0.0%) |
| $75,000 to $99,999 | 29 (25.7%) | 0 (0.0%) |
| $100,000+ | 28 (24.8%) | 0 (0.0%) |
| Total | 113 (100.0%) | 113 (100.0%) |
Earnings by Sex by Educational Attainment in Bodega
| Educational Attainment | Male Income | Female Income |
| Less than High School | - | - |
| High School Diploma | - | - |
| College or Associate's Degree | - | - |
| Bachelor's Degree | - | - |
| Graduate Degree | - | - |
| Total | - | - |
Family Income in Bodega
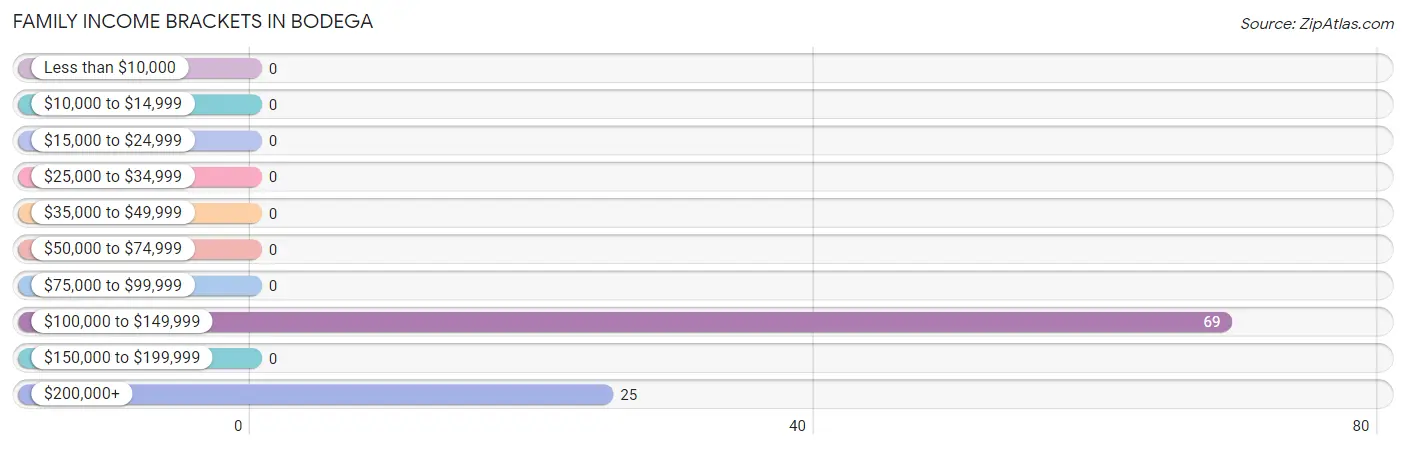
Family Income Brackets in Bodega
According to the Bodega family income data, there are 69 families falling into the $100,000 to $149,999 income range, which is the most common income bracket and makes up 73.4% of all families.
| Income Bracket | # Families | % Families |
| Less than $10,000 | 0 | 0.0% |
| $10,000 to $14,999 | 0 | 0.0% |
| $15,000 to $24,999 | 0 | 0.0% |
| $25,000 to $34,999 | 0 | 0.0% |
| $35,000 to $49,999 | 0 | 0.0% |
| $50,000 to $74,999 | 0 | 0.0% |
| $75,000 to $99,999 | 0 | 0.0% |
| $100,000 to $149,999 | 69 | 73.4% |
| $150,000 to $199,999 | 0 | 0.0% |
| $200,000+ | 25 | 26.6% |
Family Income by Famaliy Size in Bodega
| Income Bracket | # Families | Median Income |
| 2-Person Families | 59 (62.8%) | $0 |
| 3-Person Families | 0 (0.0%) | $0 |
| 4-Person Families | 29 (30.8%) | $0 |
| 5-Person Families | 6 (6.4%) | $0 |
| 6-Person Families | 0 (0.0%) | $0 |
| 7+ Person Families | 0 (0.0%) | $0 |
| Total | 94 (100.0%) | $143,103 |
Family Income by Number of Earners in Bodega
| Number of Earners | # Families | Median Income |
| No Earners | 0 (0.0%) | $0 |
| 1 Earner | 54 (57.5%) | $0 |
| 2 Earners | 40 (42.5%) | $0 |
| 3+ Earners | 0 (0.0%) | $0 |
| Total | 94 (100.0%) | $143,103 |
Household Income in Bodega
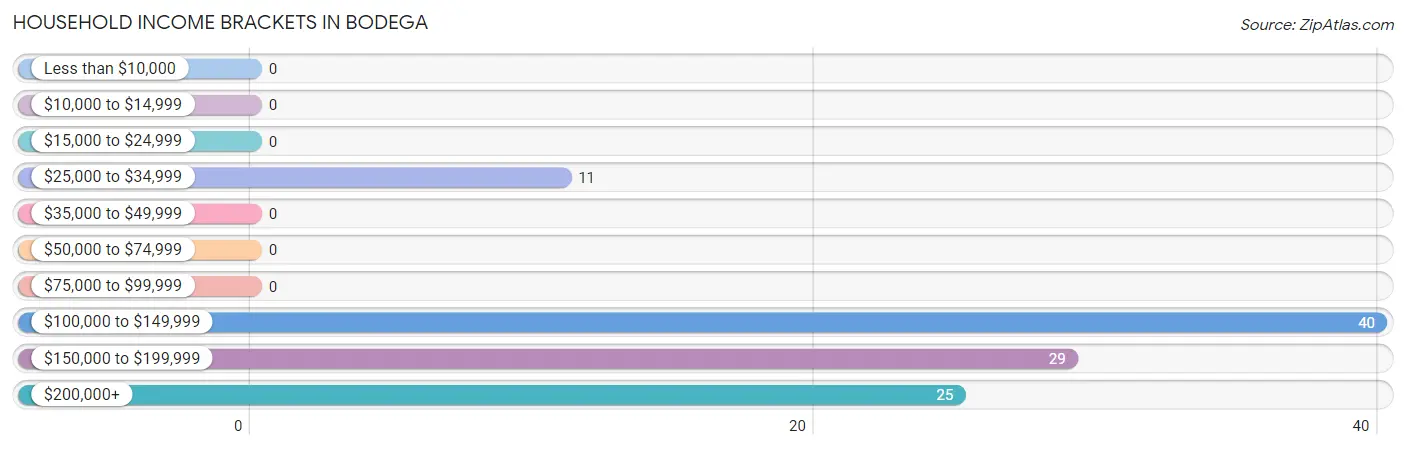
Household Income Brackets in Bodega
With 40 households falling in the category, the $100,000 to $149,999 income range is the most frequent in Bodega, accounting for 38.1% of all households.
| Income Bracket | # Households | % Households |
| Less than $10,000 | 0 | 0.0% |
| $10,000 to $14,999 | 0 | 0.0% |
| $15,000 to $24,999 | 0 | 0.0% |
| $25,000 to $34,999 | 11 | 10.5% |
| $35,000 to $49,999 | 0 | 0.0% |
| $50,000 to $74,999 | 0 | 0.0% |
| $75,000 to $99,999 | 0 | 0.0% |
| $100,000 to $149,999 | 40 | 38.1% |
| $150,000 to $199,999 | 29 | 27.6% |
| $200,000+ | 25 | 23.8% |
Household Income by Householder Age in Bodega
| Income Bracket | # Households | Median Income |
| 15 to 24 Years | 0 (0.0%) | $0 |
| 25 to 44 Years | 0 (0.0%) | $0 |
| 45 to 64 Years | 29 (27.6%) | $0 |
| 65+ Years | 76 (72.4%) | $0 |
| Total | 105 (100.0%) | $170,129 |
Poverty in Bodega
Income Below Poverty by Sex and Age in Bodega
With 19.8% poverty level for males and 13.0% for females among the residents of Bodega, 16 and 17 year old males and 35 to 44 year old females are the most vulnerable to poverty, with 40 males (100.0%) and 35 females (83.3%) in their respective age groups living below the poverty level.
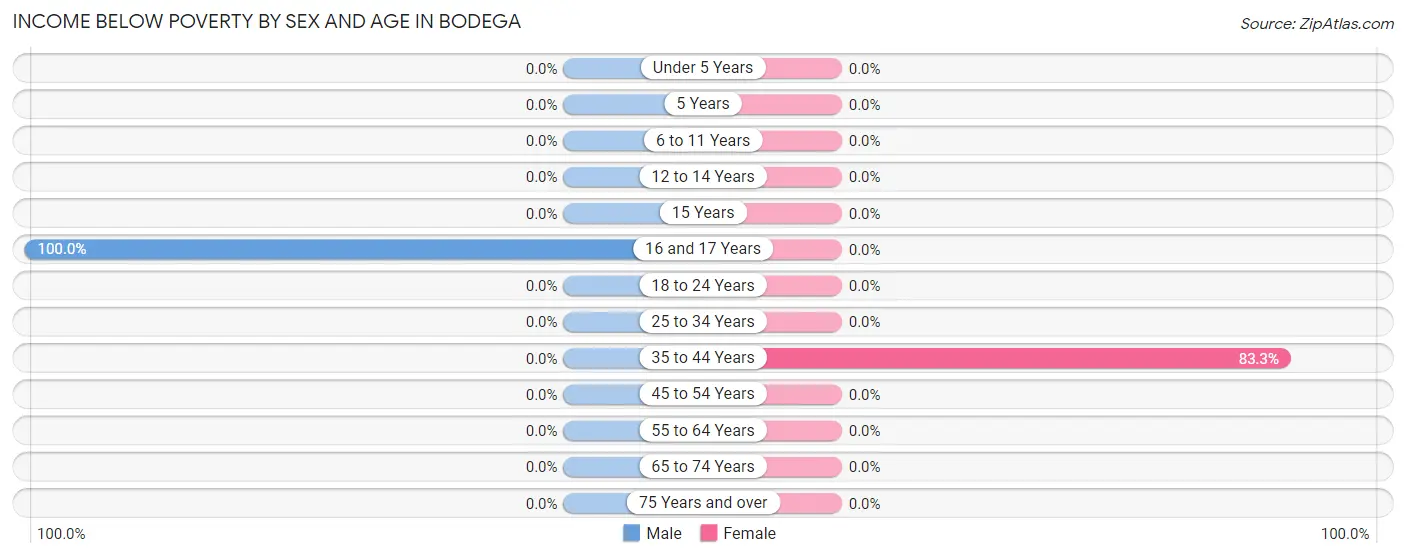
| Age Bracket | Male | Female |
| Under 5 Years | 0 (0.0%) | 0 (0.0%) |
| 5 Years | 0 (0.0%) | 0 (0.0%) |
| 6 to 11 Years | 0 (0.0%) | 0 (0.0%) |
| 12 to 14 Years | 0 (0.0%) | 0 (0.0%) |
| 15 Years | 0 (0.0%) | 0 (0.0%) |
| 16 and 17 Years | 40 (100.0%) | 0 (0.0%) |
| 18 to 24 Years | 0 (0.0%) | 0 (0.0%) |
| 25 to 34 Years | 0 (0.0%) | 0 (0.0%) |
| 35 to 44 Years | 0 (0.0%) | 35 (83.3%) |
| 45 to 54 Years | 0 (0.0%) | 0 (0.0%) |
| 55 to 64 Years | 0 (0.0%) | 0 (0.0%) |
| 65 to 74 Years | 0 (0.0%) | 0 (0.0%) |
| 75 Years and over | 0 (0.0%) | 0 (0.0%) |
| Total | 40 (19.8%) | 35 (13.0%) |
Income Above Poverty by Sex and Age in Bodega
According to the poverty statistics in Bodega, males aged 12 to 14 years and females aged under 5 years are the age groups that are most secure financially, with 100.0% of males and 100.0% of females in these age groups living above the poverty line.
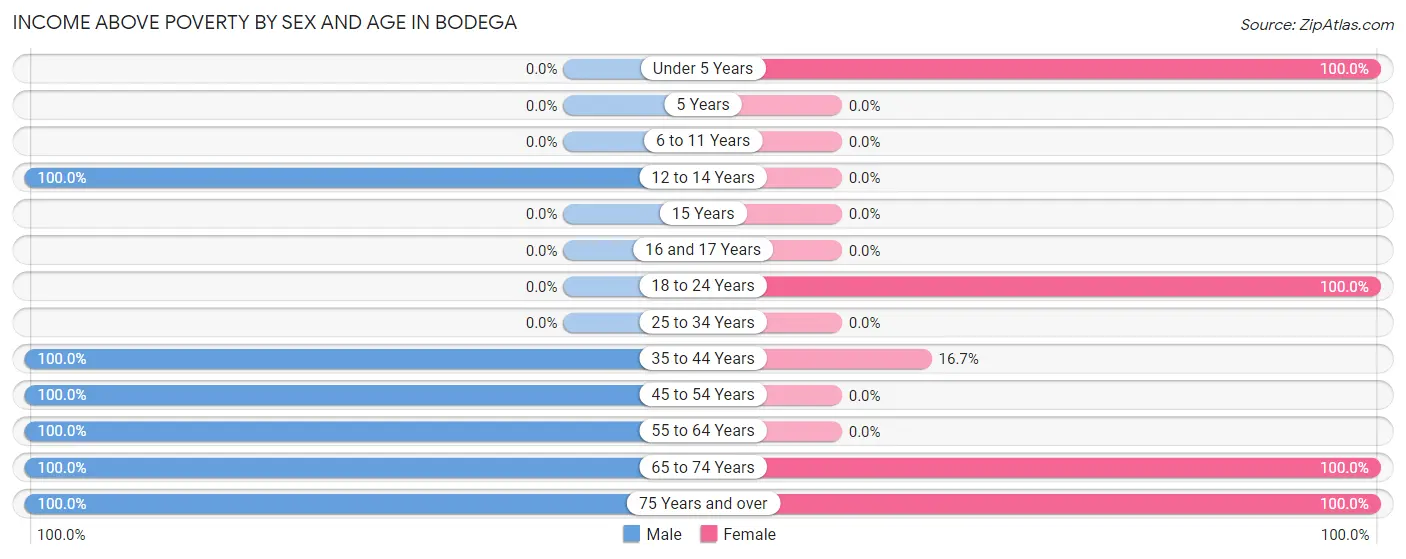
| Age Bracket | Male | Female |
| Under 5 Years | 0 (0.0%) | 6 (100.0%) |
| 5 Years | 0 (0.0%) | 0 (0.0%) |
| 6 to 11 Years | 0 (0.0%) | 0 (0.0%) |
| 12 to 14 Years | 42 (100.0%) | 0 (0.0%) |
| 15 Years | 0 (0.0%) | 0 (0.0%) |
| 16 and 17 Years | 0 (0.0%) | 0 (0.0%) |
| 18 to 24 Years | 0 (0.0%) | 73 (100.0%) |
| 25 to 34 Years | 0 (0.0%) | 0 (0.0%) |
| 35 to 44 Years | 46 (100.0%) | 7 (16.7%) |
| 45 to 54 Years | 29 (100.0%) | 0 (0.0%) |
| 55 to 64 Years | 28 (100.0%) | 0 (0.0%) |
| 65 to 74 Years | 6 (100.0%) | 89 (100.0%) |
| 75 Years and over | 11 (100.0%) | 59 (100.0%) |
| Total | 162 (80.2%) | 234 (87.0%) |
Income Below Poverty Among Married-Couple Families in Bodega
| Children | Above Poverty | Below Poverty |
| No Children | 25 (100.0%) | 0 (0.0%) |
| 1 or 2 Children | 6 (100.0%) | 0 (0.0%) |
| 3 or 4 Children | 0 (0.0%) | 0 (0.0%) |
| 5 or more Children | 0 (0.0%) | 0 (0.0%) |
| Total | 31 (100.0%) | 0 (0.0%) |
Income Below Poverty Among Single-Parent Households in Bodega
| Children | Single Father | Single Mother |
| No Children | 0 (0.0%) | 0 (0.0%) |
| 1 or 2 Children | 0 (0.0%) | 0 (0.0%) |
| 3 or 4 Children | 0 (0.0%) | 0 (0.0%) |
| 5 or more Children | 0 (0.0%) | 0 (0.0%) |
| Total | 0 (0.0%) | 0 (0.0%) |
Income Below Poverty Among Married-Couple vs Single-Parent Households in Bodega
| Children | Married-Couple Families | Single-Parent Households |
| No Children | 0 (0.0%) | 0 (0.0%) |
| 1 or 2 Children | 0 (0.0%) | 0 (0.0%) |
| 3 or 4 Children | 0 (0.0%) | 0 (0.0%) |
| 5 or more Children | 0 (0.0%) | 0 (0.0%) |
| Total | 0 (0.0%) | 0 (0.0%) |
Race in Bodega
The most populous races in Bodega are White / Caucasian (279 | 51.0%), Two or more Races (204 | 37.3%), and Native / Alaskan (35 | 6.4%).
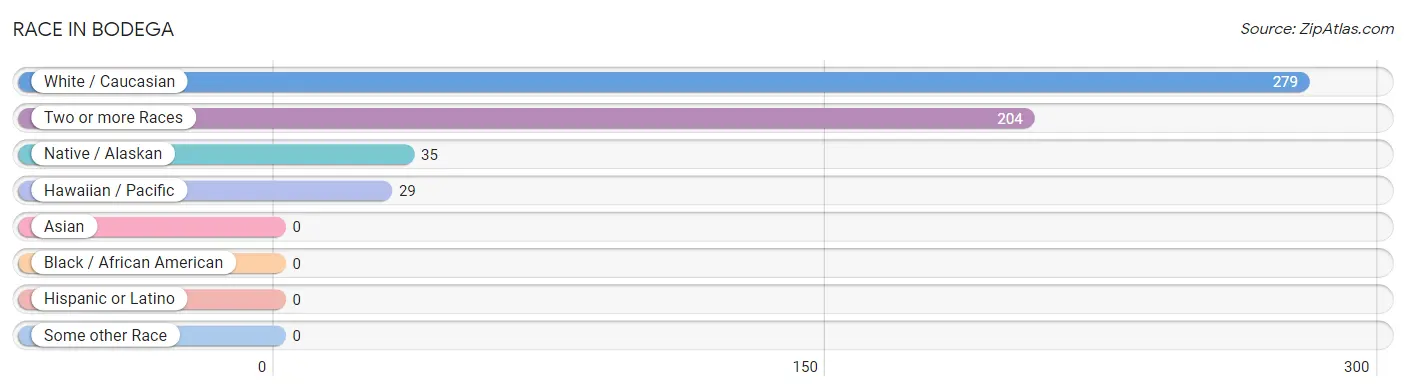
| Race | # Population | % Population |
| Asian | 0 | 0.0% |
| Black / African American | 0 | 0.0% |
| Hawaiian / Pacific | 29 | 5.3% |
| Hispanic or Latino | 0 | 0.0% |
| Native / Alaskan | 35 | 6.4% |
| White / Caucasian | 279 | 51.0% |
| Two or more Races | 204 | 37.3% |
| Some other Race | 0 | 0.0% |
| Total | 547 | 100.0% |
Ancestry in Bodega
The most populous ancestries reported in Bodega are Native Hawaiian (227 | 41.5%), German (75 | 13.7%), Italian (73 | 13.4%), English (64 | 11.7%), and Swedish (41 | 7.5%), together accounting for 87.8% of all Bodega residents.
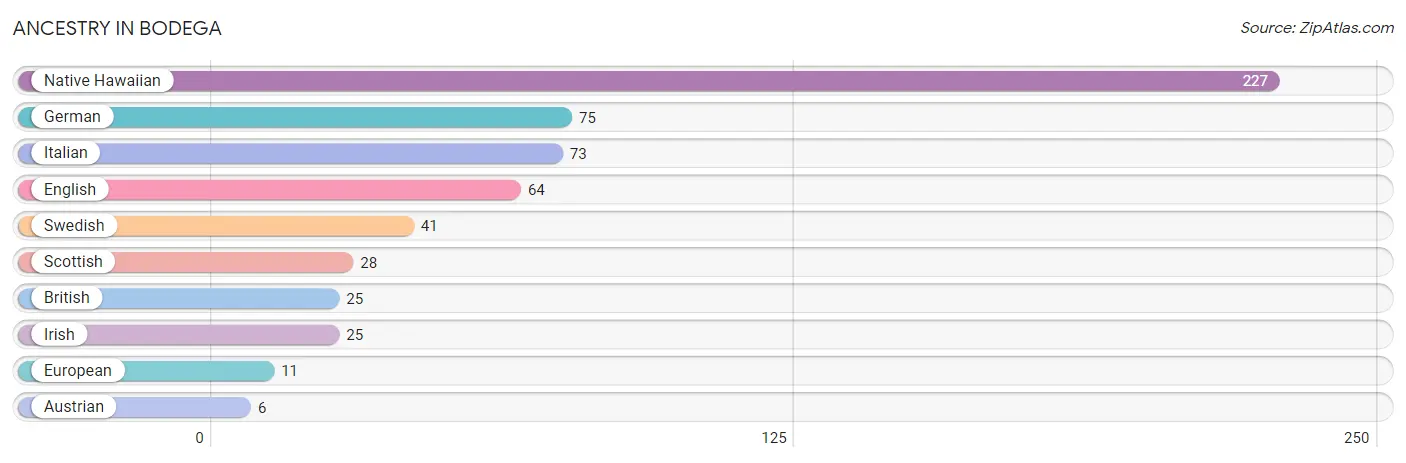
| Ancestry | # Population | % Population |
| Austrian | 6 | 1.1% |
| British | 25 | 4.6% |
| English | 64 | 11.7% |
| European | 11 | 2.0% |
| German | 75 | 13.7% |
| Irish | 25 | 4.6% |
| Italian | 73 | 13.4% |
| Native Hawaiian | 227 | 41.5% |
| Scottish | 28 | 5.1% |
| Swedish | 41 | 7.5% | View All 10 Rows |
Immigrants in Bodega

| Immigration Origin | # Population | % Population | View All 0 Rows |
Sex and Age in Bodega
Sex and Age in Bodega
The most populous age groups in Bodega are 10 to 14 Years (118 | 42.4%) for men and 15 to 19 Years (73 | 27.1%) for women.
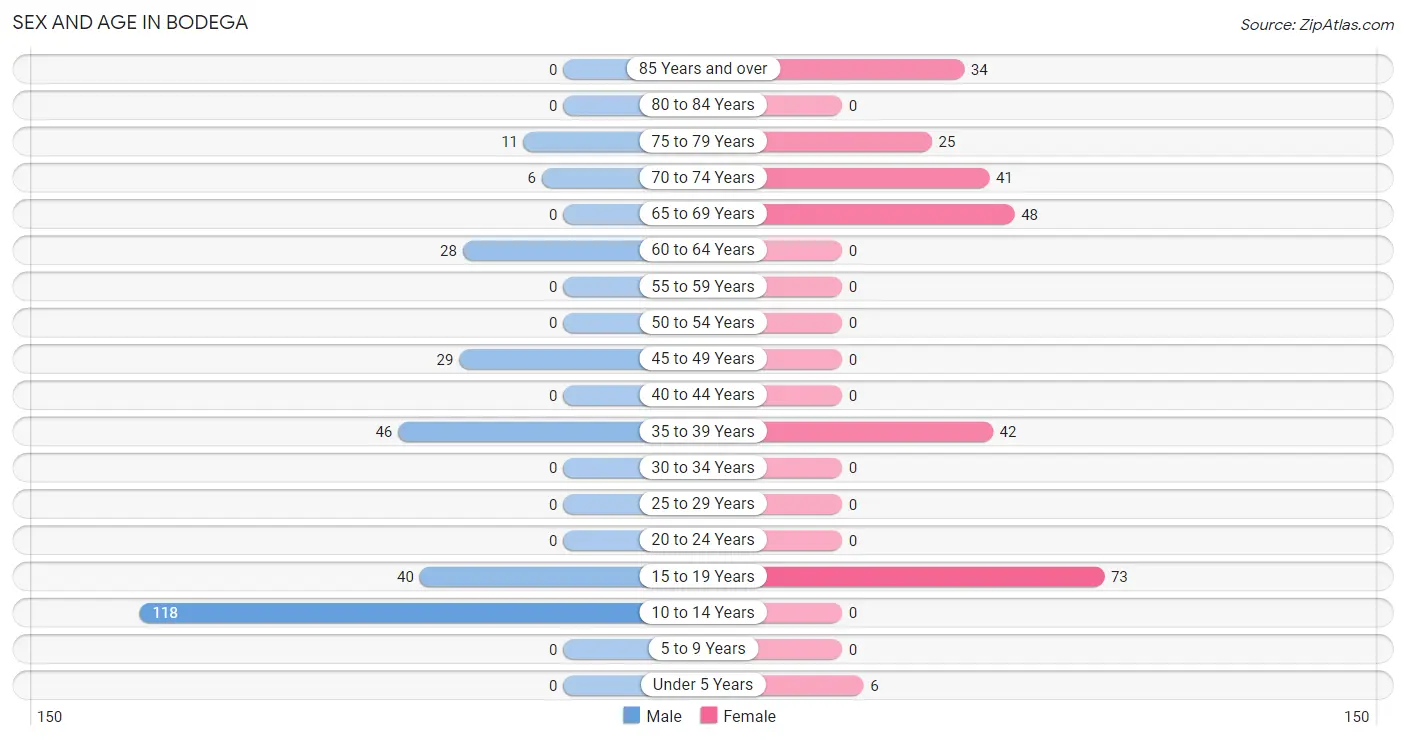
| Age Bracket | Male | Female |
| Under 5 Years | 0 (0.0%) | 6 (2.2%) |
| 5 to 9 Years | 0 (0.0%) | 0 (0.0%) |
| 10 to 14 Years | 118 (42.4%) | 0 (0.0%) |
| 15 to 19 Years | 40 (14.4%) | 73 (27.1%) |
| 20 to 24 Years | 0 (0.0%) | 0 (0.0%) |
| 25 to 29 Years | 0 (0.0%) | 0 (0.0%) |
| 30 to 34 Years | 0 (0.0%) | 0 (0.0%) |
| 35 to 39 Years | 46 (16.6%) | 42 (15.6%) |
| 40 to 44 Years | 0 (0.0%) | 0 (0.0%) |
| 45 to 49 Years | 29 (10.4%) | 0 (0.0%) |
| 50 to 54 Years | 0 (0.0%) | 0 (0.0%) |
| 55 to 59 Years | 0 (0.0%) | 0 (0.0%) |
| 60 to 64 Years | 28 (10.1%) | 0 (0.0%) |
| 65 to 69 Years | 0 (0.0%) | 48 (17.8%) |
| 70 to 74 Years | 6 (2.2%) | 41 (15.2%) |
| 75 to 79 Years | 11 (4.0%) | 25 (9.3%) |
| 80 to 84 Years | 0 (0.0%) | 0 (0.0%) |
| 85 Years and over | 0 (0.0%) | 34 (12.6%) |
| Total | 278 (100.0%) | 269 (100.0%) |
Families and Households in Bodega
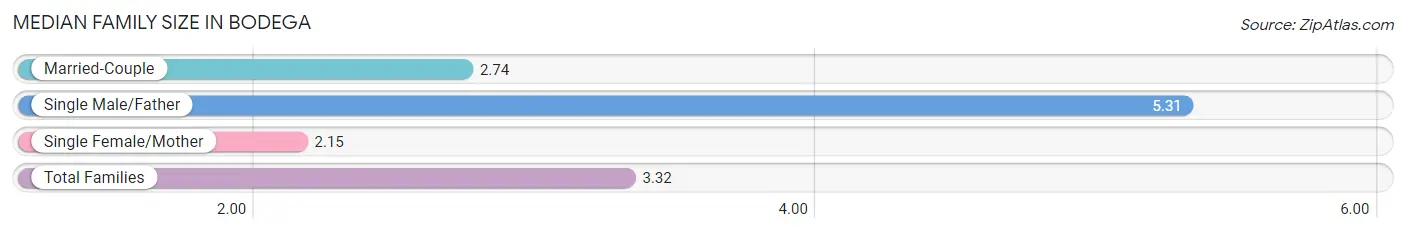
Median Family Size in Bodega
The median family size in Bodega is 3.32 persons per family, with single male/father families (29 | 30.8%) accounting for the largest median family size of 5.31 persons per family. On the other hand, single female/mother families (34 | 36.2%) represent the smallest median family size with 2.15 persons per family.
| Family Type | # Families | Family Size |
| Married-Couple | 31 (33.0%) | 2.74 |
| Single Male/Father | 29 (30.8%) | 5.31 |
| Single Female/Mother | 34 (36.2%) | 2.15 |
| Total Families | 94 (100.0%) | 3.32 |
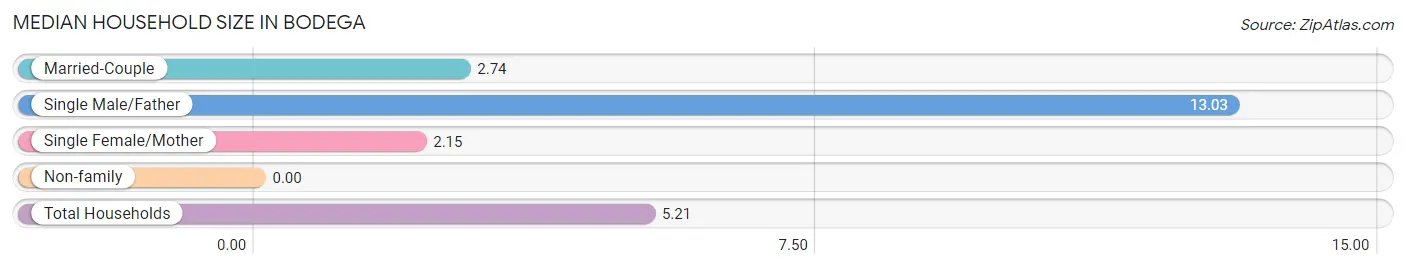
Median Household Size in Bodega
| Household Type | # Households | Household Size |
| Married-Couple | 31 (29.5%) | 2.74 |
| Single Male/Father | 29 (27.6%) | 13.03 |
| Single Female/Mother | 34 (32.4%) | 2.15 |
| Non-family | 11 (10.5%) | - |
| Total Households | 105 (100.0%) | 5.21 |
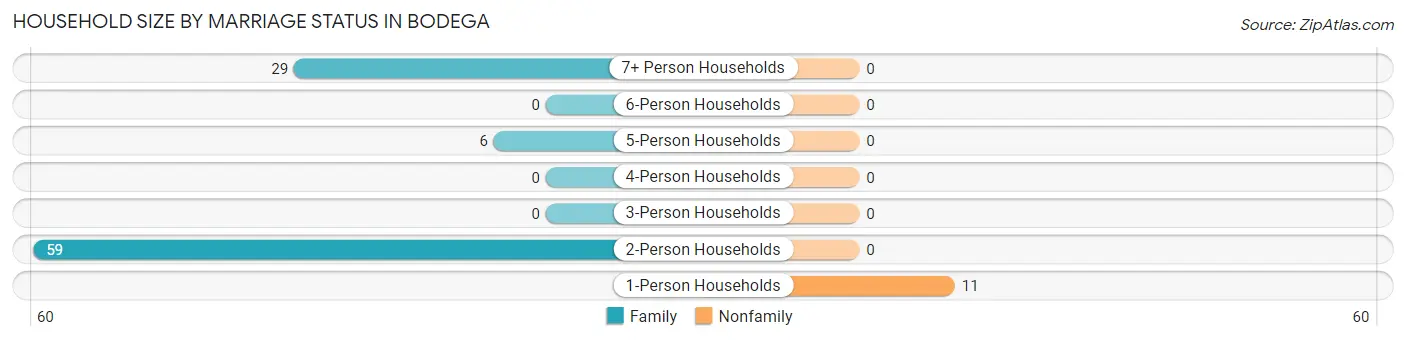
Household Size by Marriage Status in Bodega
Out of a total of 105 households in Bodega, 94 (89.5%) are family households, while 11 (10.5%) are nonfamily households. The most numerous type of family households are 2-person households, comprising 59, and the most common type of nonfamily households are 1-person households, comprising 11.
| Household Size | Family Households | Nonfamily Households |
| 1-Person Households | - | 11 (10.5%) |
| 2-Person Households | 59 (56.2%) | 0 (0.0%) |
| 3-Person Households | 0 (0.0%) | 0 (0.0%) |
| 4-Person Households | 0 (0.0%) | 0 (0.0%) |
| 5-Person Households | 6 (5.7%) | 0 (0.0%) |
| 6-Person Households | 0 (0.0%) | 0 (0.0%) |
| 7+ Person Households | 29 (27.6%) | 0 (0.0%) |
| Total | 94 (89.5%) | 11 (10.5%) |
Female Fertility in Bodega
Fertility by Age in Bodega
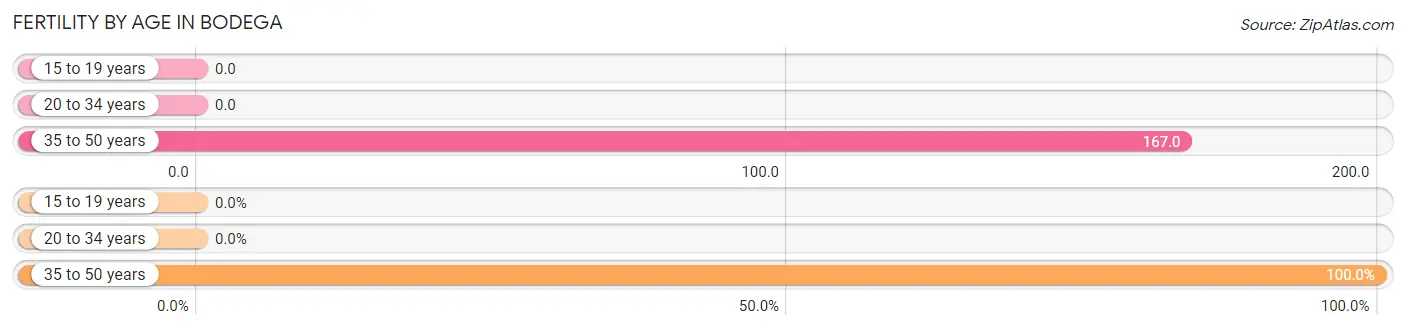
Average fertility rate in Bodega is 61.0 births per 1,000 women. Women in the age bracket of 35 to 50 years have the highest fertility rate with 167.0 births per 1,000 women. Women in the age bracket of 35 to 50 years acount for 100.0% of all women with births.
| Age Bracket | Women with Births | Births / 1,000 Women |
| 15 to 19 years | 0 (0.0%) | 0.0 |
| 20 to 34 years | 0 (0.0%) | 0.0 |
| 35 to 50 years | 7 (100.0%) | 167.0 |
| Total | 7 (100.0%) | 61.0 |
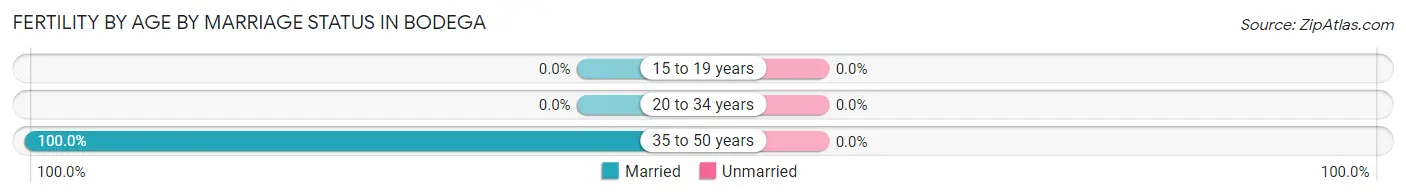
Fertility by Age by Marriage Status in Bodega
| Age Bracket | Married | Unmarried |
| 15 to 19 years | 0 (0.0%) | 0 (0.0%) |
| 20 to 34 years | 0 (0.0%) | 0 (0.0%) |
| 35 to 50 years | 7 (100.0%) | 0 (0.0%) |
| Total | 7 (100.0%) | 0 (0.0%) |
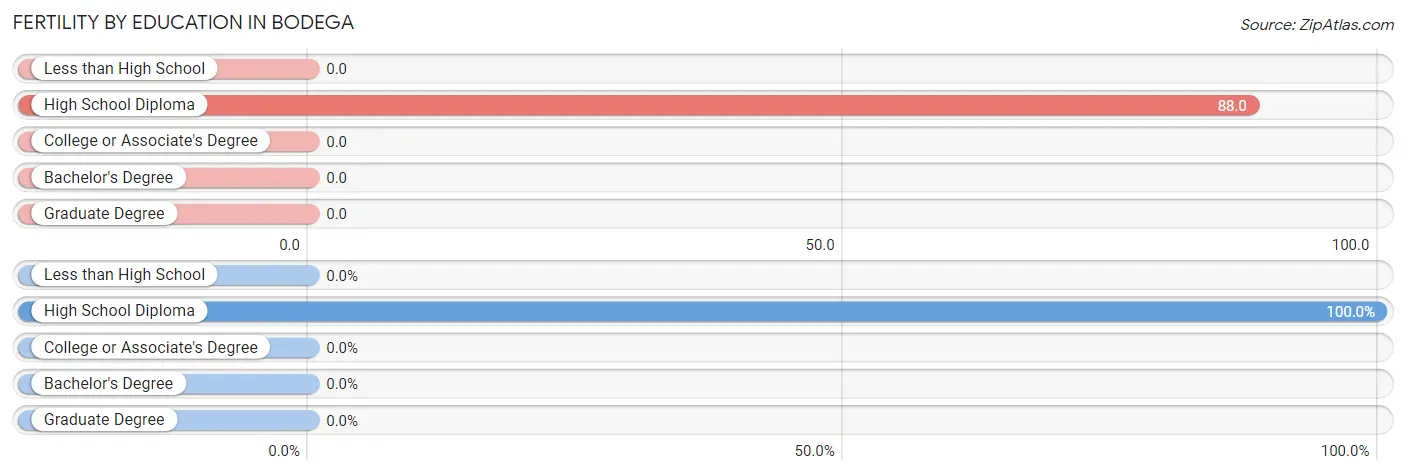
Fertility by Education in Bodega
| Educational Attainment | Women with Births | Births / 1,000 Women |
| Less than High School | 0 (0.0%) | 0.0 |
| High School Diploma | 7 (100.0%) | 88.0 |
| College or Associate's Degree | 0 (0.0%) | 0.0 |
| Bachelor's Degree | 0 (0.0%) | 0.0 |
| Graduate Degree | 0 (0.0%) | 0.0 |
| Total | 7 (100.0%) | 61.0 |
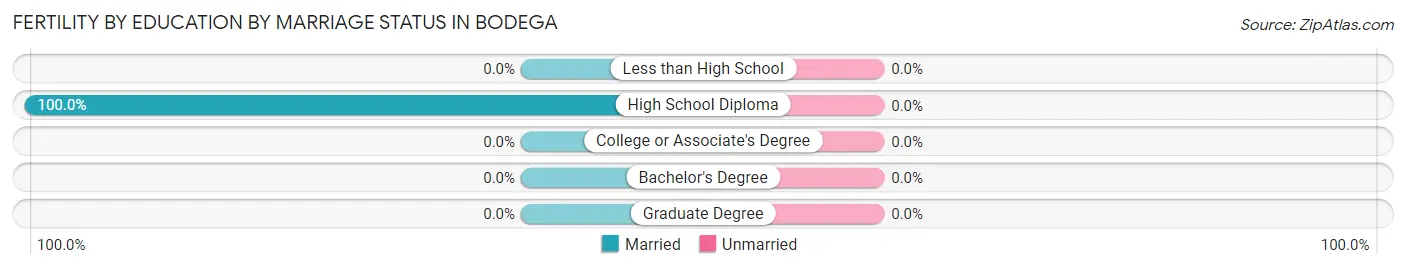
Fertility by Education by Marriage Status in Bodega
| Educational Attainment | Married | Unmarried |
| Less than High School | 0 (0.0%) | 0 (0.0%) |
| High School Diploma | 7 (100.0%) | 0 (0.0%) |
| College or Associate's Degree | 0 (0.0%) | 0 (0.0%) |
| Bachelor's Degree | 0 (0.0%) | 0 (0.0%) |
| Graduate Degree | 0 (0.0%) | 0 (0.0%) |
| Total | 7 (100.0%) | 0 (0.0%) |
Employment Characteristics in Bodega
Employment by Class of Employer in Bodega
Among the 170 employed individuals in Bodega, private company employees (73 | 42.9%), self-employed (not incorporated) (40 | 23.5%), and self-employed (incorporated) (29 | 17.1%) make up the most common classes of employment.
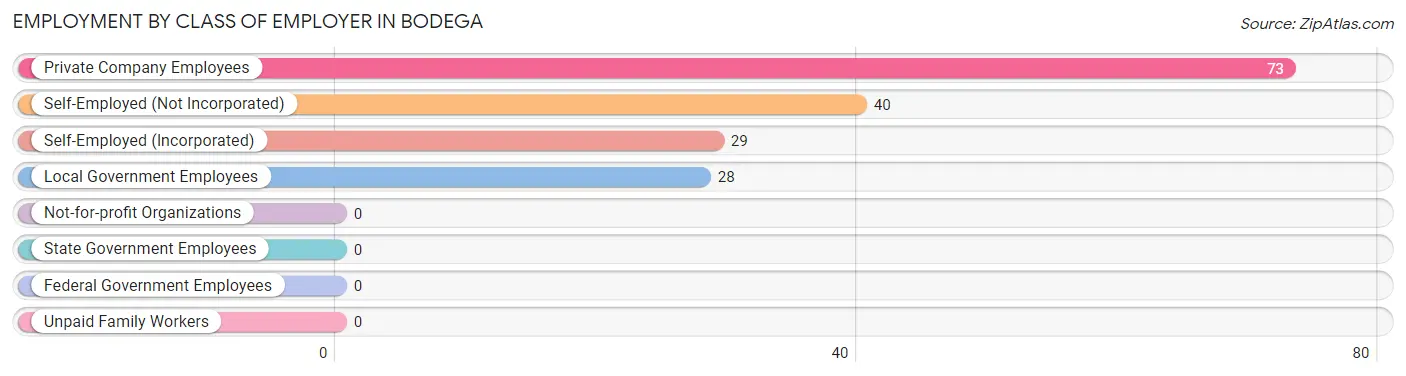
| Employer Class | # Employees | % Employees |
| Private Company Employees | 73 | 42.9% |
| Self-Employed (Incorporated) | 29 | 17.1% |
| Self-Employed (Not Incorporated) | 40 | 23.5% |
| Not-for-profit Organizations | 0 | 0.0% |
| Local Government Employees | 28 | 16.5% |
| State Government Employees | 0 | 0.0% |
| Federal Government Employees | 0 | 0.0% |
| Unpaid Family Workers | 0 | 0.0% |
| Total | 170 | 100.0% |
Employment Status by Age in Bodega
According to the labor force statistics for Bodega, out of the total population over 16 years of age (423), 57.7% or 244 individuals are in the labor force, with 30.3% or 74 of them unemployed. The age group with the highest labor force participation rate is 45 to 54 years, with 100.0% or 29 individuals in the labor force. Within the labor force, the 35 to 44 years age range has the highest percentage of unemployed individuals, with 100.0% or 74 of them being unemployed.
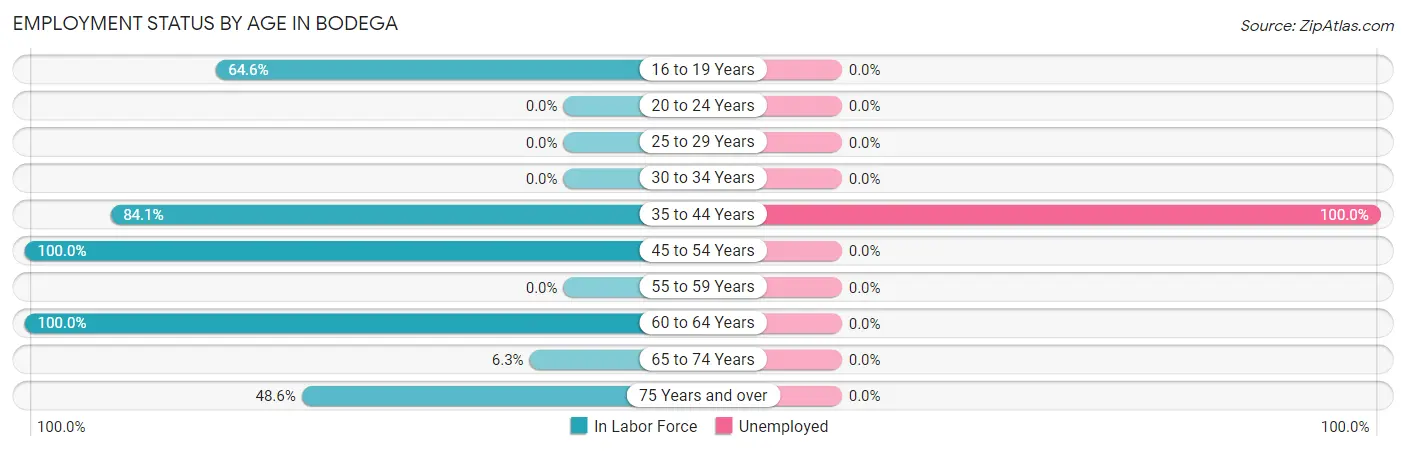
| Age Bracket | In Labor Force | Unemployed |
| 16 to 19 Years | 73 (64.6%) | 0 (0.0%) |
| 20 to 24 Years | 0 (0.0%) | 0 (0.0%) |
| 25 to 29 Years | 0 (0.0%) | 0 (0.0%) |
| 30 to 34 Years | 0 (0.0%) | 0 (0.0%) |
| 35 to 44 Years | 74 (84.1%) | 74 (100.0%) |
| 45 to 54 Years | 29 (100.0%) | 0 (0.0%) |
| 55 to 59 Years | 0 (0.0%) | 0 (0.0%) |
| 60 to 64 Years | 28 (100.0%) | 0 (0.0%) |
| 65 to 74 Years | 6 (6.3%) | 0 (0.0%) |
| 75 Years and over | 34 (48.6%) | 0 (0.0%) |
| Total | 244 (57.7%) | 74 (30.3%) |
Employment Status by Educational Attainment in Bodega
According to labor force statistics for Bodega, 90.3% of individuals (131) out of the total population between 25 and 64 years of age (145) are in the labor force, with 56.5% or 74 of them being unemployed. The group with the highest labor force participation rate are those with the educational attainment of less than high school, with 100.0% or 29 individuals in the labor force. Within the labor force, individuals with high school diploma education have the highest percentage of unemployment, with 100.0% or 39 of them being unemployed.
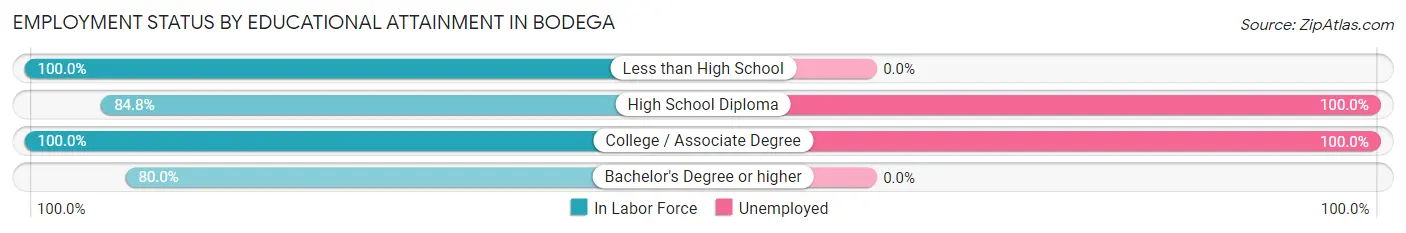
| Educational Attainment | In Labor Force | Unemployed |
| Less than High School | 29 (100.0%) | 0 (0.0%) |
| High School Diploma | 39 (84.8%) | 46 (100.0%) |
| College / Associate Degree | 35 (100.0%) | 35 (100.0%) |
| Bachelor's Degree or higher | 28 (80.0%) | 0 (0.0%) |
| Total | 131 (90.3%) | 82 (56.5%) |
Employment Occupations by Sex in Bodega
Management, Business, Science and Arts Occupations
The most common Management, Business, Science and Arts occupations in Bodega are Management (34 | 20.0%), Computers, Engineering & Science (28 | 16.5%), and Life, Physical & Social Science (28 | 16.5%).
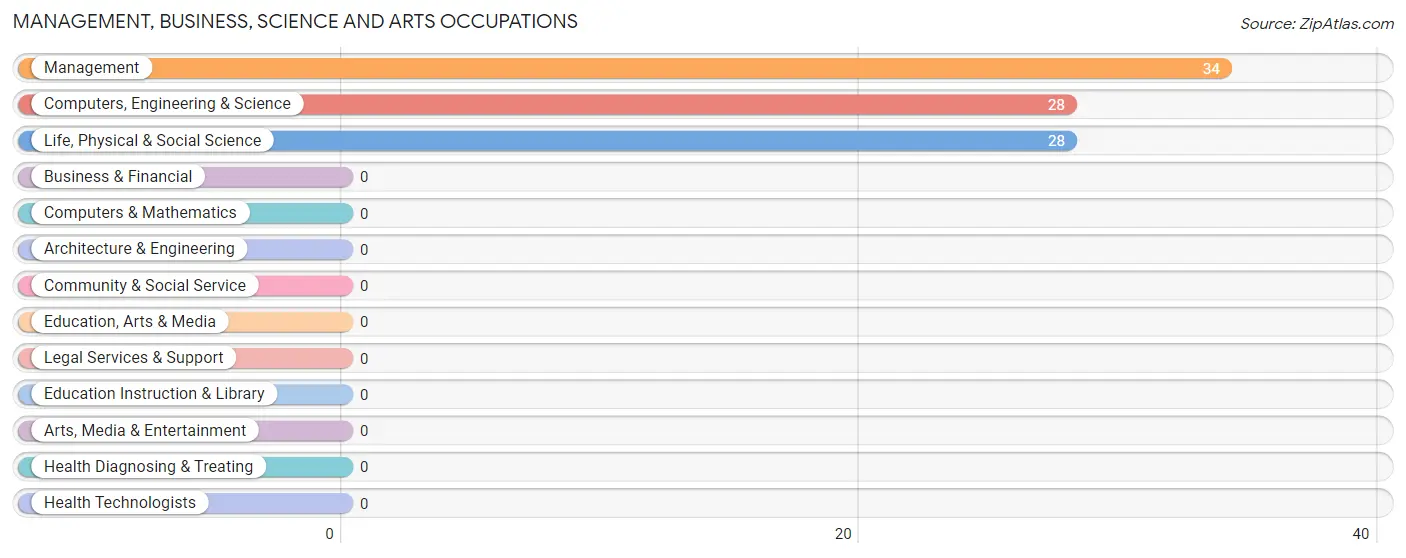
Management, Business, Science and Arts Occupations by Sex
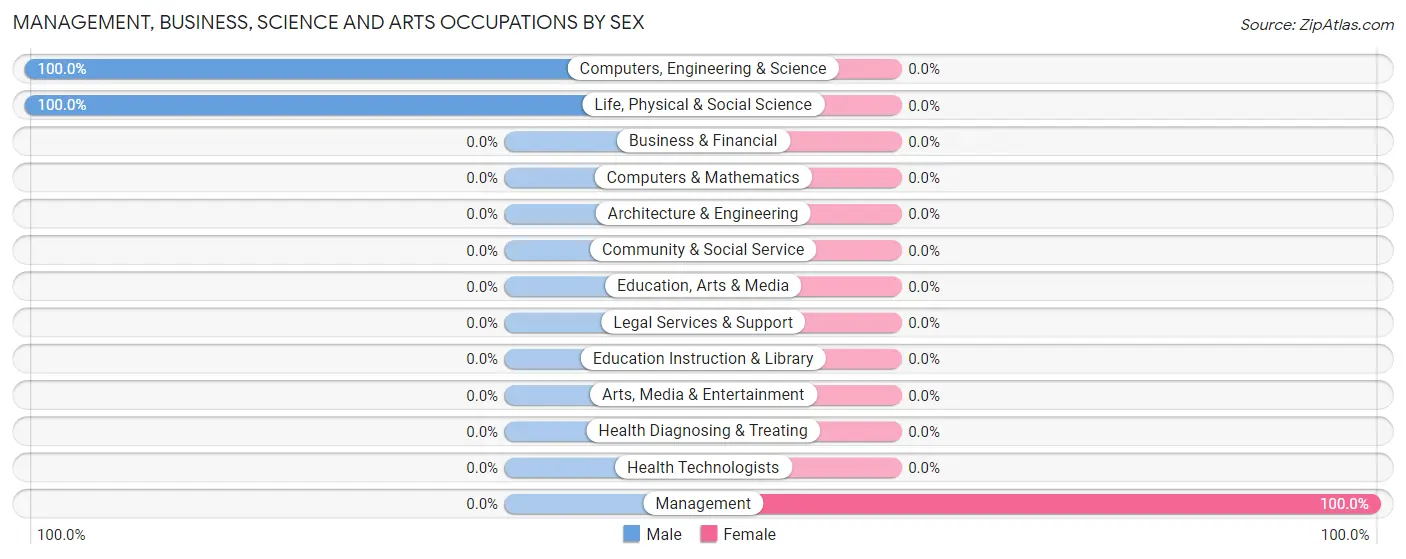
| Occupation | Male | Female |
| Management | 0 (0.0%) | 34 (100.0%) |
| Business & Financial | 0 (0.0%) | 0 (0.0%) |
| Computers, Engineering & Science | 28 (100.0%) | 0 (0.0%) |
| Computers & Mathematics | 0 (0.0%) | 0 (0.0%) |
| Architecture & Engineering | 0 (0.0%) | 0 (0.0%) |
| Life, Physical & Social Science | 28 (100.0%) | 0 (0.0%) |
| Community & Social Service | 0 (0.0%) | 0 (0.0%) |
| Education, Arts & Media | 0 (0.0%) | 0 (0.0%) |
| Legal Services & Support | 0 (0.0%) | 0 (0.0%) |
| Education Instruction & Library | 0 (0.0%) | 0 (0.0%) |
| Arts, Media & Entertainment | 0 (0.0%) | 0 (0.0%) |
| Health Diagnosing & Treating | 0 (0.0%) | 0 (0.0%) |
| Health Technologists | 0 (0.0%) | 0 (0.0%) |
| Total (Category) | 28 (45.2%) | 34 (54.8%) |
| Total (Overall) | 57 (33.5%) | 113 (66.5%) |
Services Occupations
The most common Services occupations in Bodega are , and Healthcare Support (6 | 3.5%).
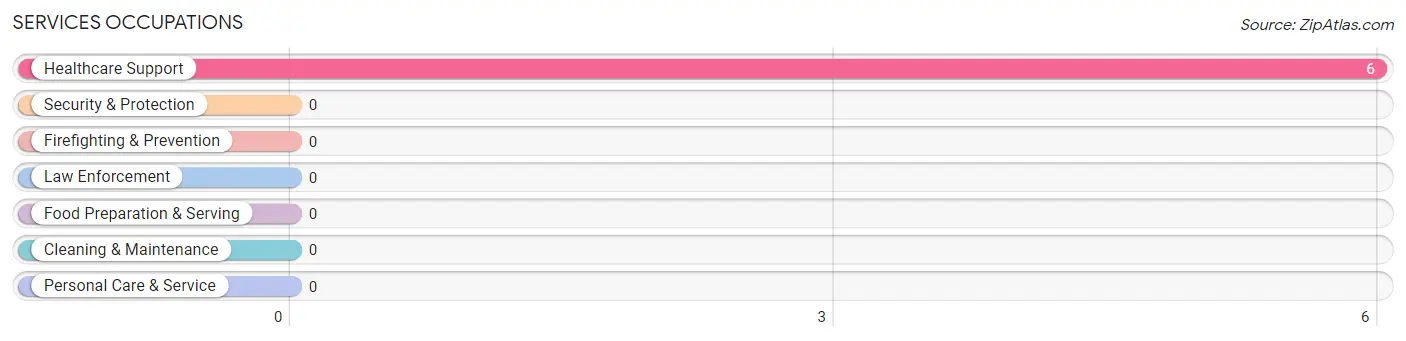
Services Occupations by Sex
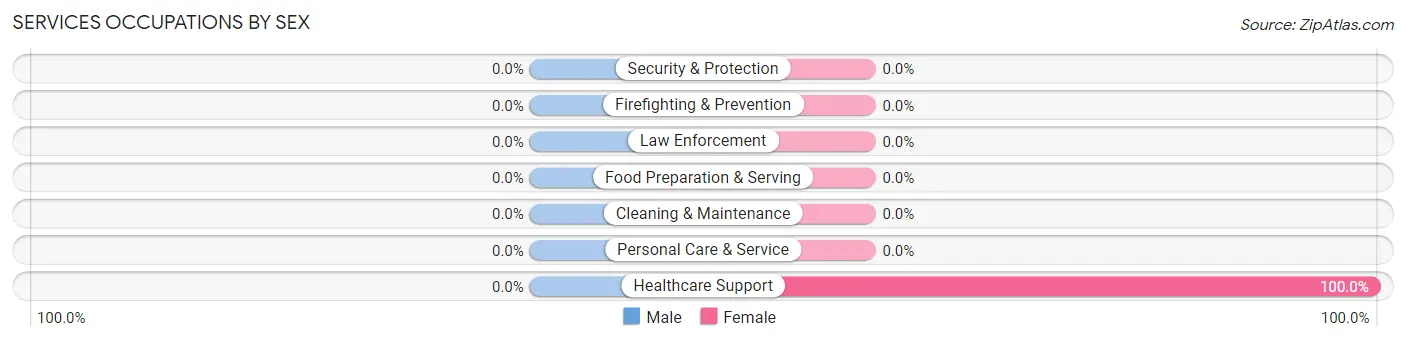
| Occupation | Male | Female |
| Healthcare Support | 0 (0.0%) | 6 (100.0%) |
| Security & Protection | 0 (0.0%) | 0 (0.0%) |
| Firefighting & Prevention | 0 (0.0%) | 0 (0.0%) |
| Law Enforcement | 0 (0.0%) | 0 (0.0%) |
| Food Preparation & Serving | 0 (0.0%) | 0 (0.0%) |
| Cleaning & Maintenance | 0 (0.0%) | 0 (0.0%) |
| Personal Care & Service | 0 (0.0%) | 0 (0.0%) |
| Total (Category) | 0 (0.0%) | 6 (100.0%) |
| Total (Overall) | 57 (33.5%) | 113 (66.5%) |
Sales and Office Occupations
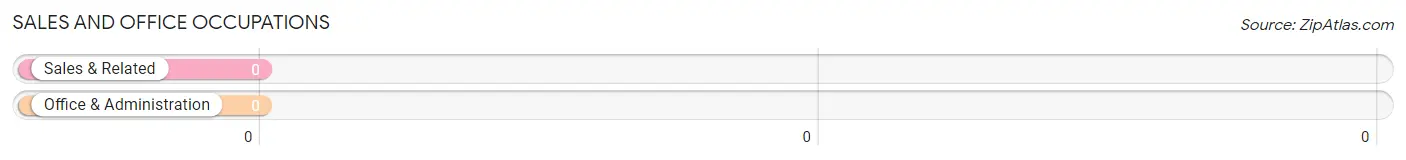
Sales and Office Occupations by Sex
| Occupation | Male | Female |
| Sales & Related | 0 (0.0%) | 0 (0.0%) |
| Office & Administration | 0 (0.0%) | 0 (0.0%) |
| Total (Category) | 0 (0.0%) | 0 (0.0%) |
| Total (Overall) | 57 (33.5%) | 113 (66.5%) |
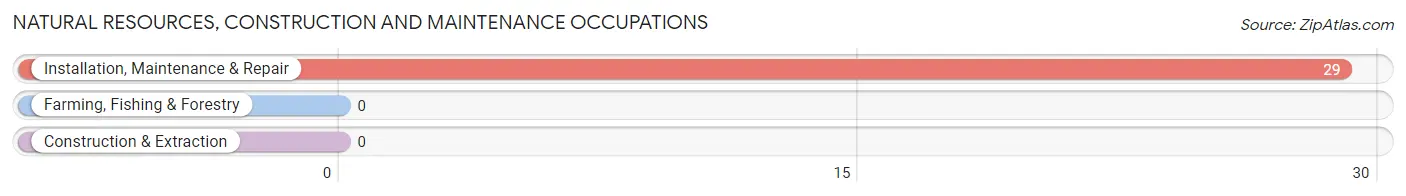
Natural Resources, Construction and Maintenance Occupations
The most common Natural Resources, Construction and Maintenance occupations in Bodega are , and Installation, Maintenance & Repair (29 | 17.1%).
Natural Resources, Construction and Maintenance Occupations by Sex
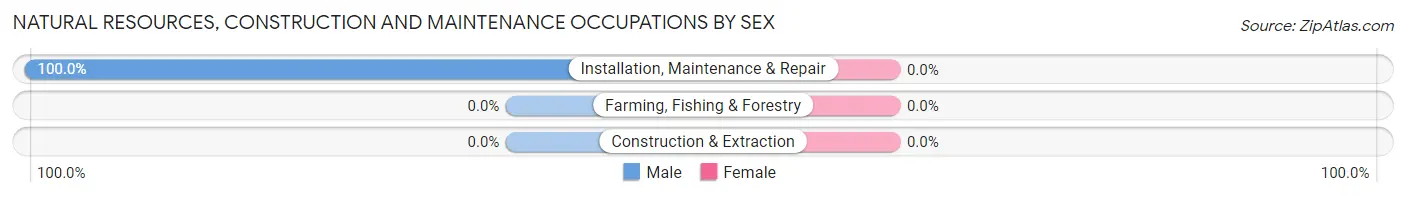
| Occupation | Male | Female |
| Farming, Fishing & Forestry | 0 (0.0%) | 0 (0.0%) |
| Construction & Extraction | 0 (0.0%) | 0 (0.0%) |
| Installation, Maintenance & Repair | 29 (100.0%) | 0 (0.0%) |
| Total (Category) | 29 (100.0%) | 0 (0.0%) |
| Total (Overall) | 57 (33.5%) | 113 (66.5%) |
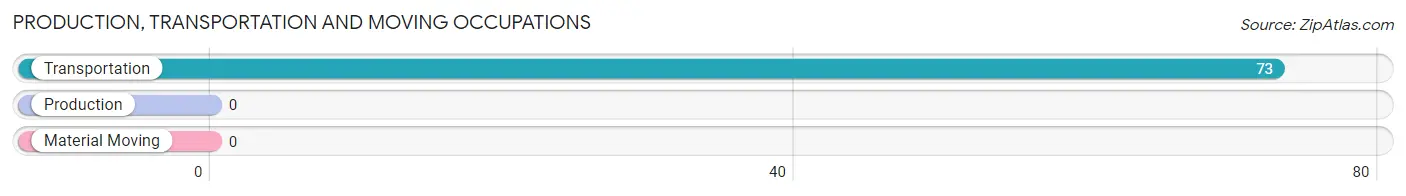
Production, Transportation and Moving Occupations
The most common Production, Transportation and Moving occupations in Bodega are , and Transportation (73 | 42.9%).
Production, Transportation and Moving Occupations by Sex
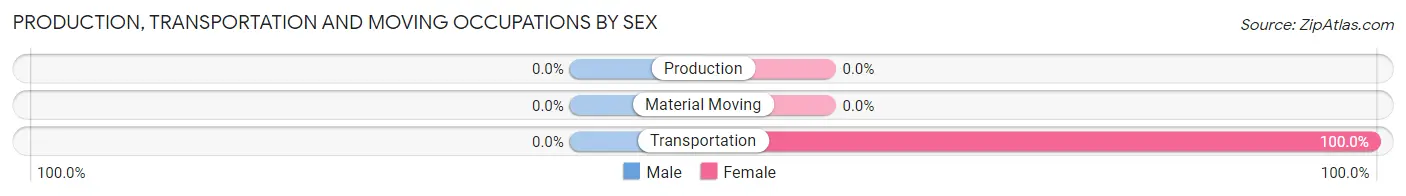
| Occupation | Male | Female |
| Production | 0 (0.0%) | 0 (0.0%) |
| Transportation | 0 (0.0%) | 73 (100.0%) |
| Material Moving | 0 (0.0%) | 0 (0.0%) |
| Total (Category) | 0 (0.0%) | 73 (100.0%) |
| Total (Overall) | 57 (33.5%) | 113 (66.5%) |
Employment Industries by Sex in Bodega
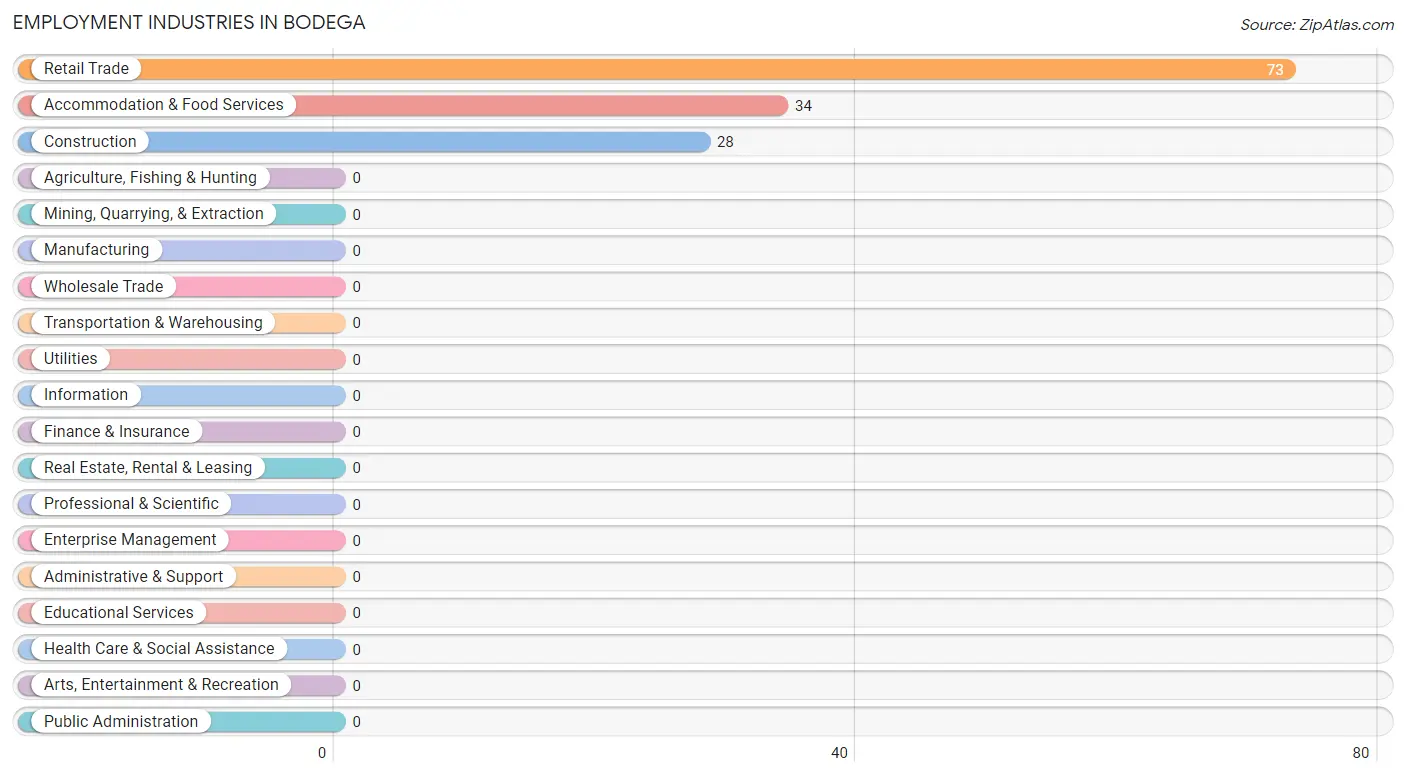
Employment Industries in Bodega
The major employment industries in Bodega include Retail Trade (73 | 42.9%), Accommodation & Food Services (34 | 20.0%), and Construction (28 | 16.5%).
Employment Industries by Sex in Bodega
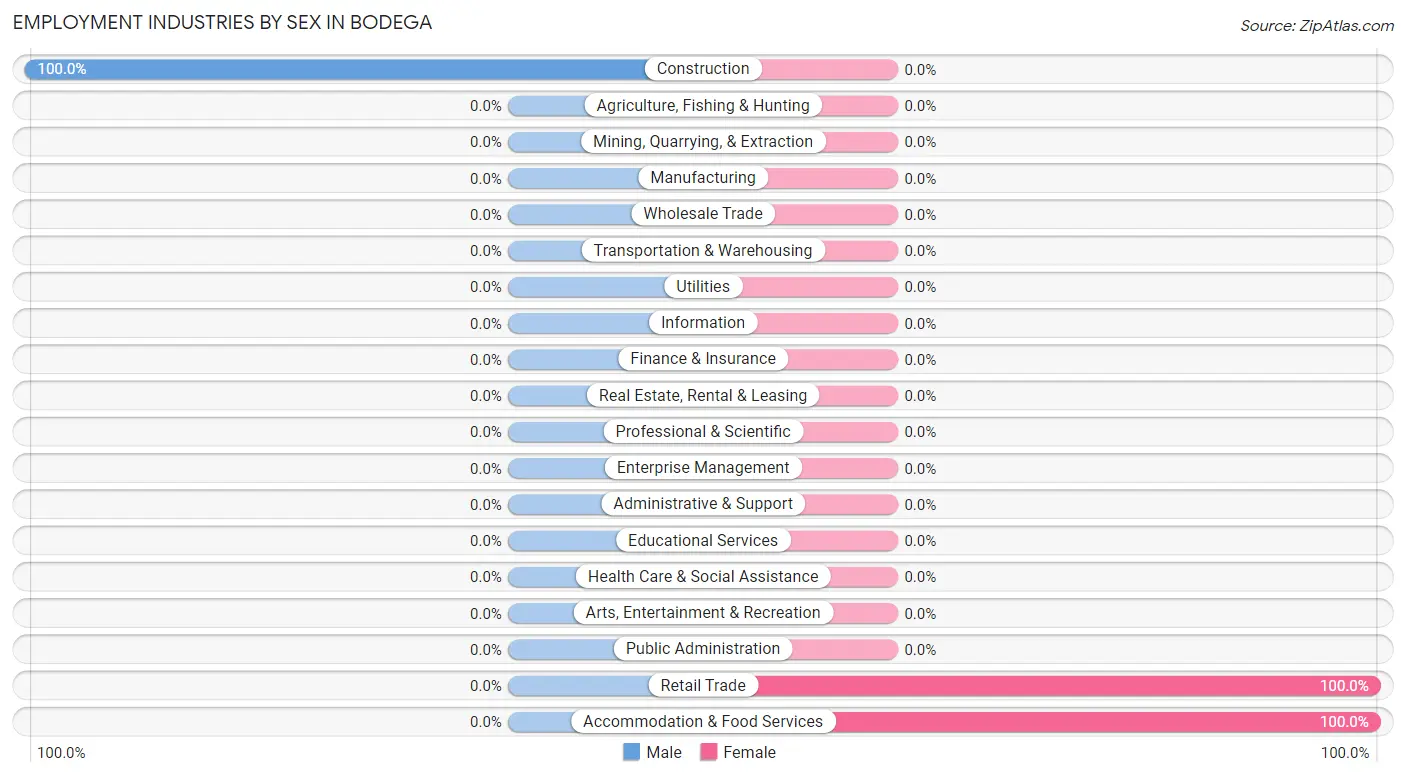
| Industry | Male | Female |
| Agriculture, Fishing & Hunting | 0 (0.0%) | 0 (0.0%) |
| Mining, Quarrying, & Extraction | 0 (0.0%) | 0 (0.0%) |
| Construction | 28 (100.0%) | 0 (0.0%) |
| Manufacturing | 0 (0.0%) | 0 (0.0%) |
| Wholesale Trade | 0 (0.0%) | 0 (0.0%) |
| Retail Trade | 0 (0.0%) | 73 (100.0%) |
| Transportation & Warehousing | 0 (0.0%) | 0 (0.0%) |
| Utilities | 0 (0.0%) | 0 (0.0%) |
| Information | 0 (0.0%) | 0 (0.0%) |
| Finance & Insurance | 0 (0.0%) | 0 (0.0%) |
| Real Estate, Rental & Leasing | 0 (0.0%) | 0 (0.0%) |
| Professional & Scientific | 0 (0.0%) | 0 (0.0%) |
| Enterprise Management | 0 (0.0%) | 0 (0.0%) |
| Administrative & Support | 0 (0.0%) | 0 (0.0%) |
| Educational Services | 0 (0.0%) | 0 (0.0%) |
| Health Care & Social Assistance | 0 (0.0%) | 0 (0.0%) |
| Arts, Entertainment & Recreation | 0 (0.0%) | 0 (0.0%) |
| Accommodation & Food Services | 0 (0.0%) | 34 (100.0%) |
| Public Administration | 0 (0.0%) | 0 (0.0%) |
| Total | 57 (33.5%) | 113 (66.5%) |
Education in Bodega
School Enrollment in Bodega
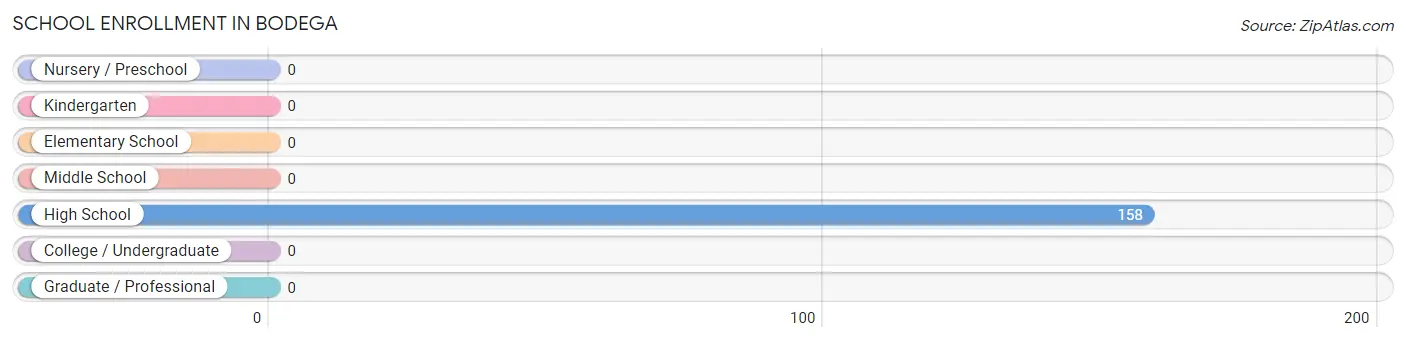
| School Level | # Students | % Students |
| Nursery / Preschool | 0 | 0.0% |
| Kindergarten | 0 | 0.0% |
| Elementary School | 0 | 0.0% |
| Middle School | 0 | 0.0% |
| High School | 158 | 100.0% |
| College / Undergraduate | 0 | 0.0% |
| Graduate / Professional | 0 | 0.0% |
| Total | 158 | 100.0% |
School Enrollment by Age by Funding Source in Bodega
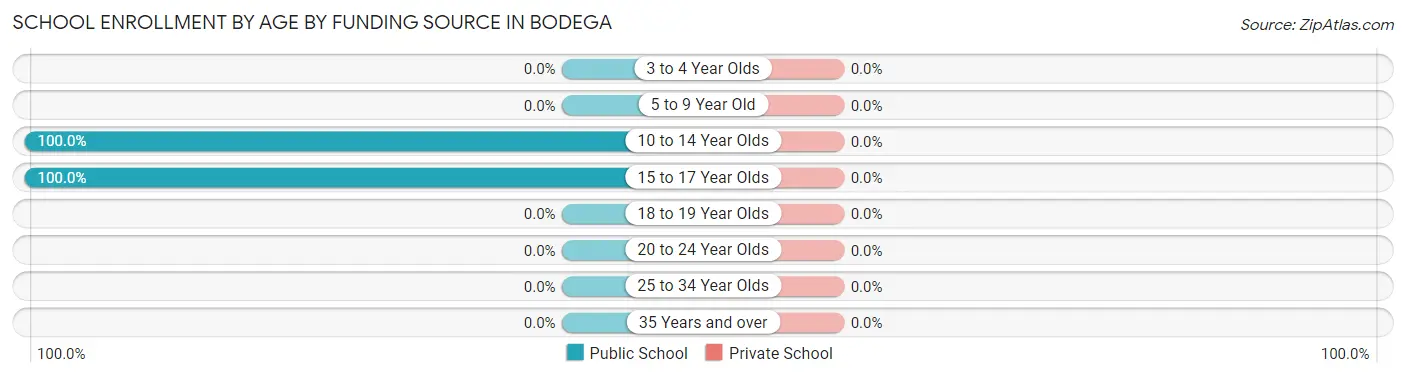
| Age Bracket | Public School | Private School |
| 3 to 4 Year Olds | 0 (0.0%) | 0 (0.0%) |
| 5 to 9 Year Old | 0 (0.0%) | 0 (0.0%) |
| 10 to 14 Year Olds | 118 (100.0%) | 0 (0.0%) |
| 15 to 17 Year Olds | 40 (100.0%) | 0 (0.0%) |
| 18 to 19 Year Olds | 0 (0.0%) | 0 (0.0%) |
| 20 to 24 Year Olds | 0 (0.0%) | 0 (0.0%) |
| 25 to 34 Year Olds | 0 (0.0%) | 0 (0.0%) |
| 35 Years and over | 0 (0.0%) | 0 (0.0%) |
| Total | 158 (100.0%) | 0 (0.0%) |
Educational Attainment by Field of Study in Bodega
Bio, nature & agricultural (53 | 68.8%), visual & performing arts (11 | 14.3%), business (7 | 9.1%), and education (6 | 7.8%) are the most common fields of study among 77 individuals in Bodega who have obtained a bachelor's degree or higher.
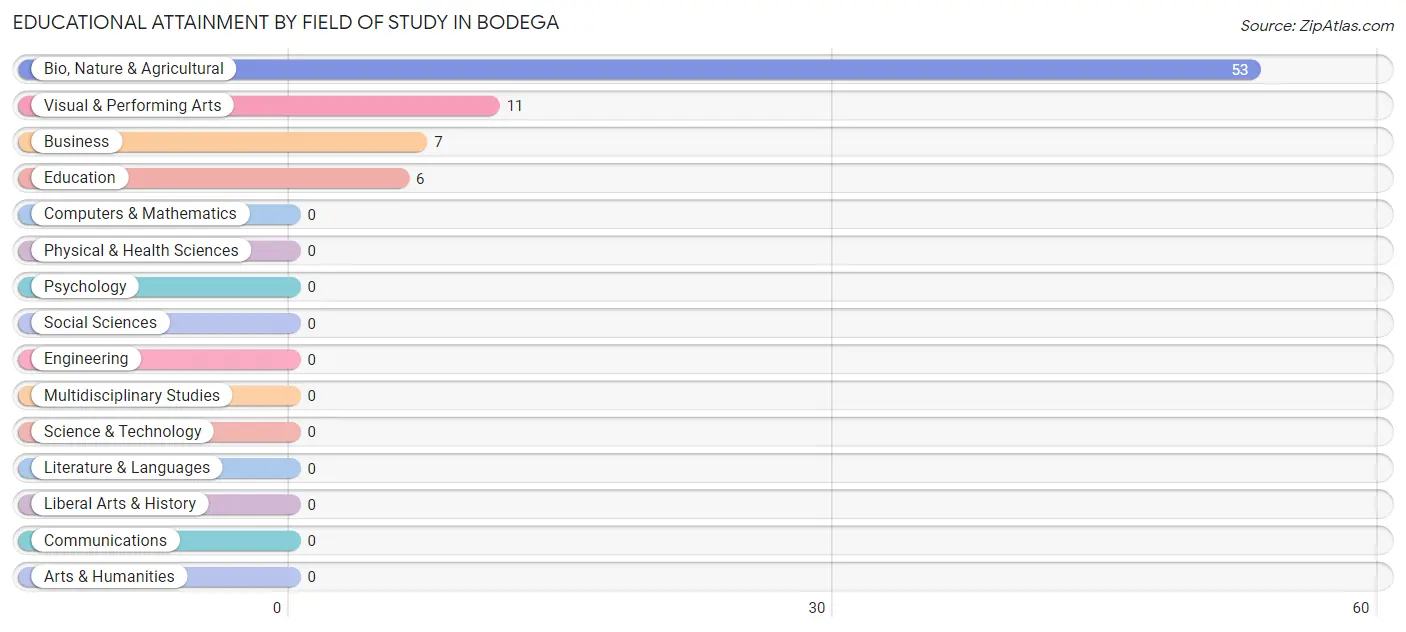
| Field of Study | # Graduates | % Graduates |
| Computers & Mathematics | 0 | 0.0% |
| Bio, Nature & Agricultural | 53 | 68.8% |
| Physical & Health Sciences | 0 | 0.0% |
| Psychology | 0 | 0.0% |
| Social Sciences | 0 | 0.0% |
| Engineering | 0 | 0.0% |
| Multidisciplinary Studies | 0 | 0.0% |
| Science & Technology | 0 | 0.0% |
| Business | 7 | 9.1% |
| Education | 6 | 7.8% |
| Literature & Languages | 0 | 0.0% |
| Liberal Arts & History | 0 | 0.0% |
| Visual & Performing Arts | 11 | 14.3% |
| Communications | 0 | 0.0% |
| Arts & Humanities | 0 | 0.0% |
| Total | 77 | 100.0% |
Transportation & Commute in Bodega
Vehicle Availability by Sex in Bodega
The most prevalent vehicle ownership categories in Bodega are males with 3 vehicles (29, accounting for 50.9%) and females with 3 vehicles (73, making up 25.7%).
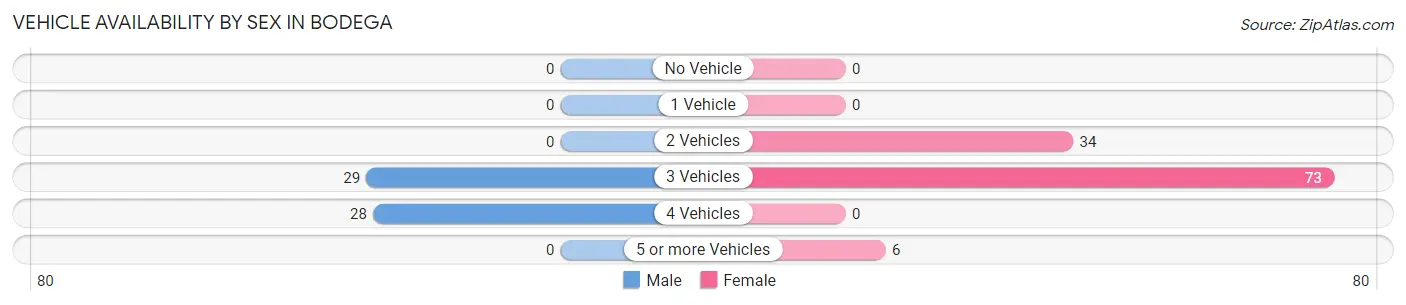
| Vehicles Available | Male | Female |
| No Vehicle | 0 (0.0%) | 0 (0.0%) |
| 1 Vehicle | 0 (0.0%) | 0 (0.0%) |
| 2 Vehicles | 0 (0.0%) | 34 (30.1%) |
| 3 Vehicles | 29 (50.9%) | 73 (64.6%) |
| 4 Vehicles | 28 (49.1%) | 0 (0.0%) |
| 5 or more Vehicles | 0 (0.0%) | 6 (5.3%) |
| Total | 57 (100.0%) | 113 (100.0%) |
Commute Time in Bodega
The most frequently occuring commute durations in Bodega are 25 to 29 minutes (101 commuters, 59.4%), less than 5 minutes (34 commuters, 20.0%), and 40 to 44 minutes (29 commuters, 17.1%).
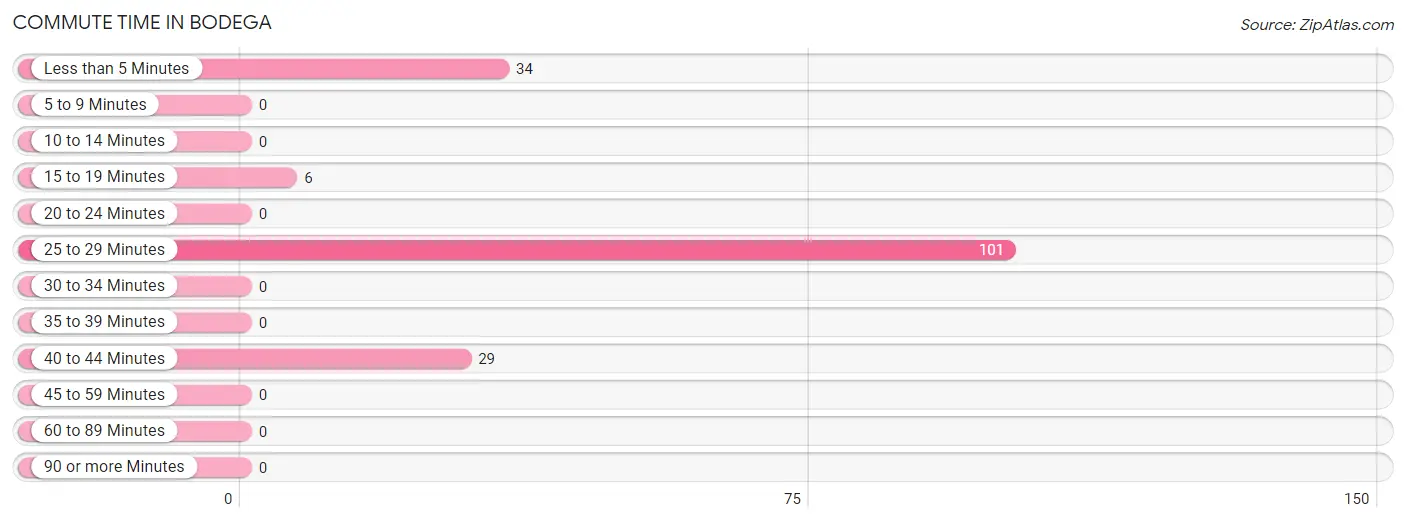
| Commute Time | # Commuters | % Commuters |
| Less than 5 Minutes | 34 | 20.0% |
| 5 to 9 Minutes | 0 | 0.0% |
| 10 to 14 Minutes | 0 | 0.0% |
| 15 to 19 Minutes | 6 | 3.5% |
| 20 to 24 Minutes | 0 | 0.0% |
| 25 to 29 Minutes | 101 | 59.4% |
| 30 to 34 Minutes | 0 | 0.0% |
| 35 to 39 Minutes | 0 | 0.0% |
| 40 to 44 Minutes | 29 | 17.1% |
| 45 to 59 Minutes | 0 | 0.0% |
| 60 to 89 Minutes | 0 | 0.0% |
| 90 or more Minutes | 0 | 0.0% |
Commute Time by Sex in Bodega
The most common commute times in Bodega are 40 to 44 minutes (29 commuters, 50.9%) for males and 25 to 29 minutes (73 commuters, 64.6%) for females.
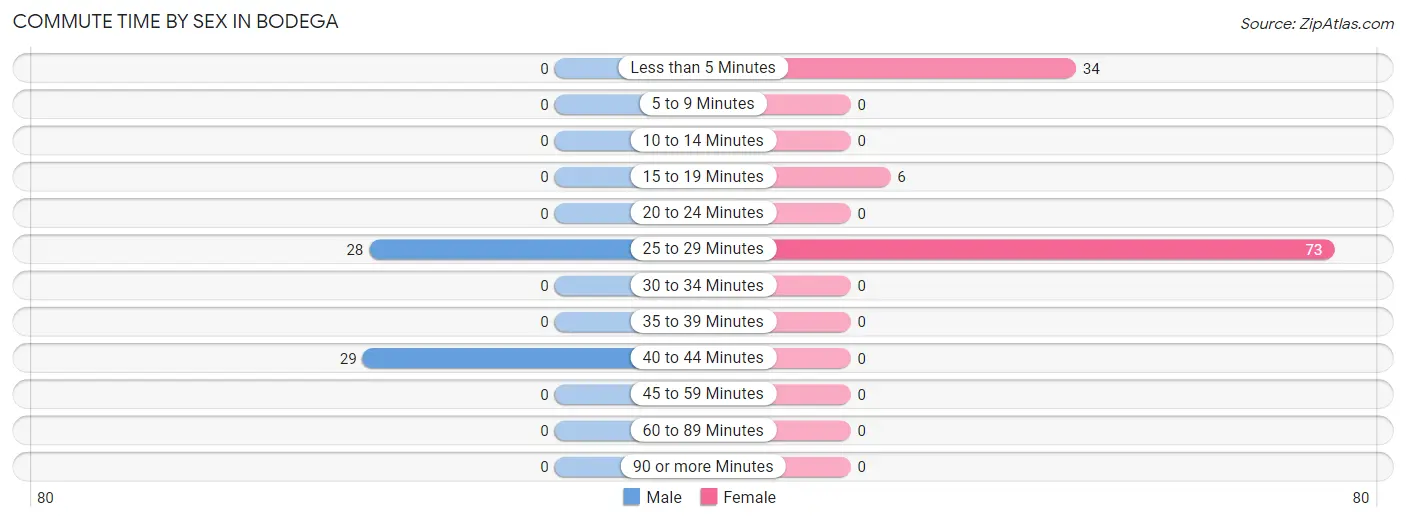
| Commute Time | Male | Female |
| Less than 5 Minutes | 0 (0.0%) | 34 (30.1%) |
| 5 to 9 Minutes | 0 (0.0%) | 0 (0.0%) |
| 10 to 14 Minutes | 0 (0.0%) | 0 (0.0%) |
| 15 to 19 Minutes | 0 (0.0%) | 6 (5.3%) |
| 20 to 24 Minutes | 0 (0.0%) | 0 (0.0%) |
| 25 to 29 Minutes | 28 (49.1%) | 73 (64.6%) |
| 30 to 34 Minutes | 0 (0.0%) | 0 (0.0%) |
| 35 to 39 Minutes | 0 (0.0%) | 0 (0.0%) |
| 40 to 44 Minutes | 29 (50.9%) | 0 (0.0%) |
| 45 to 59 Minutes | 0 (0.0%) | 0 (0.0%) |
| 60 to 89 Minutes | 0 (0.0%) | 0 (0.0%) |
| 90 or more Minutes | 0 (0.0%) | 0 (0.0%) |
Time of Departure to Work by Sex in Bodega
The most frequent times of departure to work in Bodega are 8:00 AM to 8:29 AM (29, 50.9%) for males and 6:30 AM to 6:59 AM (73, 64.6%) for females.
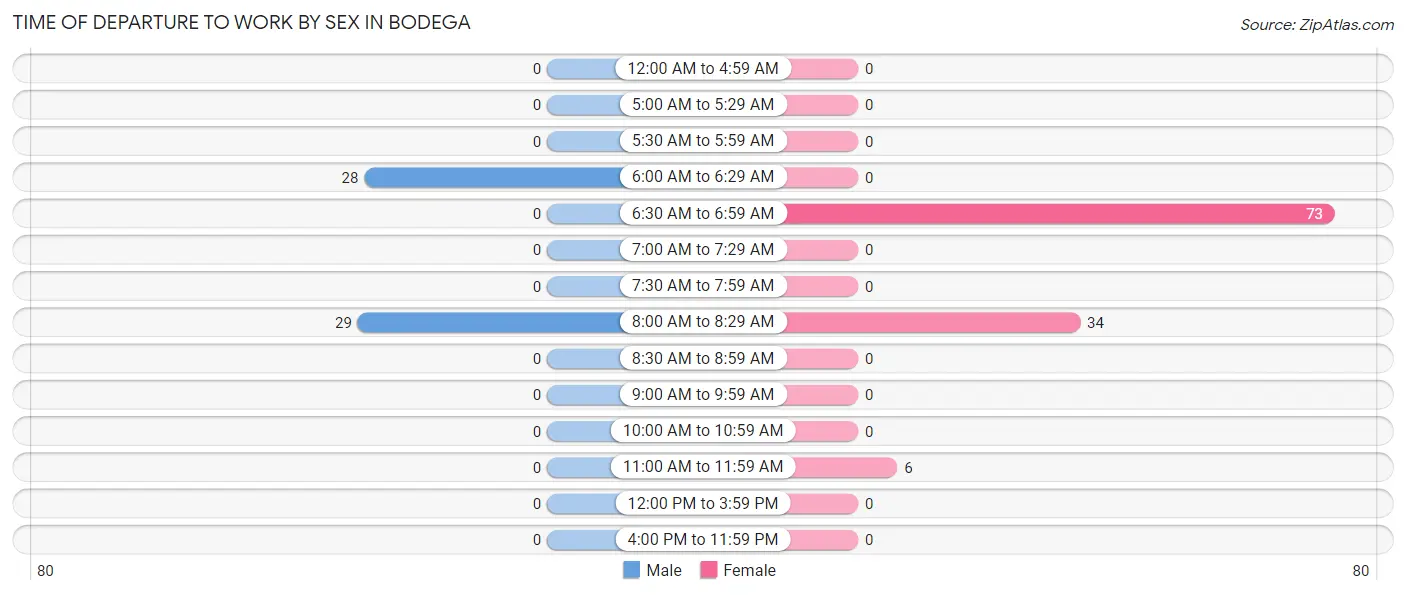
| Time of Departure | Male | Female |
| 12:00 AM to 4:59 AM | 0 (0.0%) | 0 (0.0%) |
| 5:00 AM to 5:29 AM | 0 (0.0%) | 0 (0.0%) |
| 5:30 AM to 5:59 AM | 0 (0.0%) | 0 (0.0%) |
| 6:00 AM to 6:29 AM | 28 (49.1%) | 0 (0.0%) |
| 6:30 AM to 6:59 AM | 0 (0.0%) | 73 (64.6%) |
| 7:00 AM to 7:29 AM | 0 (0.0%) | 0 (0.0%) |
| 7:30 AM to 7:59 AM | 0 (0.0%) | 0 (0.0%) |
| 8:00 AM to 8:29 AM | 29 (50.9%) | 34 (30.1%) |
| 8:30 AM to 8:59 AM | 0 (0.0%) | 0 (0.0%) |
| 9:00 AM to 9:59 AM | 0 (0.0%) | 0 (0.0%) |
| 10:00 AM to 10:59 AM | 0 (0.0%) | 0 (0.0%) |
| 11:00 AM to 11:59 AM | 0 (0.0%) | 6 (5.3%) |
| 12:00 PM to 3:59 PM | 0 (0.0%) | 0 (0.0%) |
| 4:00 PM to 11:59 PM | 0 (0.0%) | 0 (0.0%) |
| Total | 57 (100.0%) | 113 (100.0%) |
Housing Occupancy in Bodega
Occupancy by Ownership in Bodega
Of the total 105 dwellings in Bodega, owner-occupied units account for 105 (100.0%), while renter-occupied units make up 0 (0.0%).
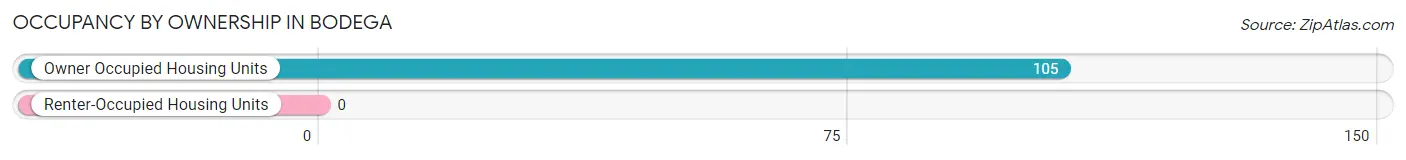
| Occupancy | # Housing Units | % Housing Units |
| Owner Occupied Housing Units | 105 | 100.0% |
| Renter-Occupied Housing Units | 0 | 0.0% |
| Total Occupied Housing Units | 105 | 100.0% |
Occupancy by Household Size in Bodega
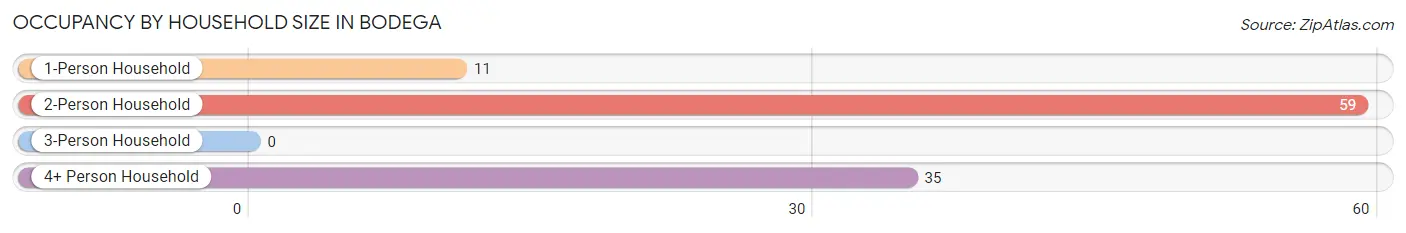
| Household Size | # Housing Units | % Housing Units |
| 1-Person Household | 11 | 10.5% |
| 2-Person Household | 59 | 56.2% |
| 3-Person Household | 0 | 0.0% |
| 4+ Person Household | 35 | 33.3% |
| Total Housing Units | 105 | 100.0% |
Occupancy by Ownership by Household Size in Bodega
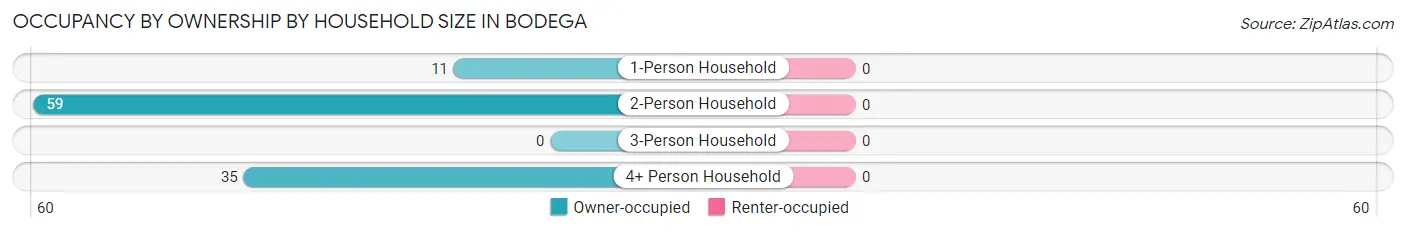
| Household Size | Owner-occupied | Renter-occupied |
| 1-Person Household | 11 (100.0%) | 0 (0.0%) |
| 2-Person Household | 59 (100.0%) | 0 (0.0%) |
| 3-Person Household | 0 (0.0%) | 0 (0.0%) |
| 4+ Person Household | 35 (100.0%) | 0 (0.0%) |
| Total Housing Units | 105 (100.0%) | 0 (0.0%) |
Occupancy by Educational Attainment in Bodega
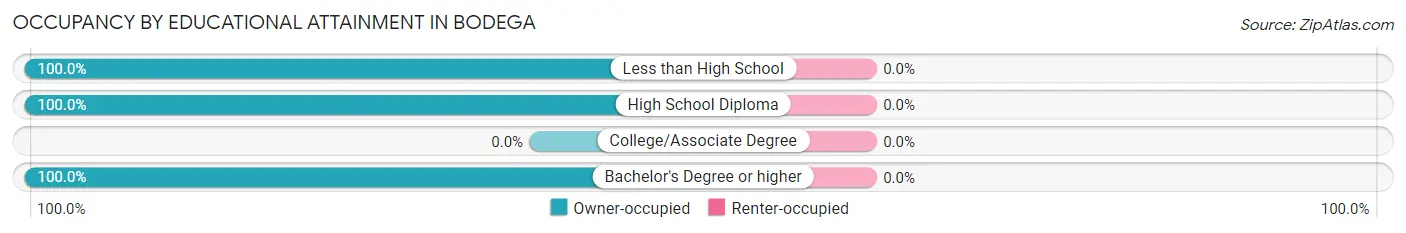
| Household Size | Owner-occupied | Renter-occupied |
| Less than High School | 29 (100.0%) | 0 (0.0%) |
| High School Diploma | 34 (100.0%) | 0 (0.0%) |
| College/Associate Degree | 0 (0.0%) | 0 (0.0%) |
| Bachelor's Degree or higher | 42 (100.0%) | 0 (0.0%) |
Occupancy by Age of Householder in Bodega
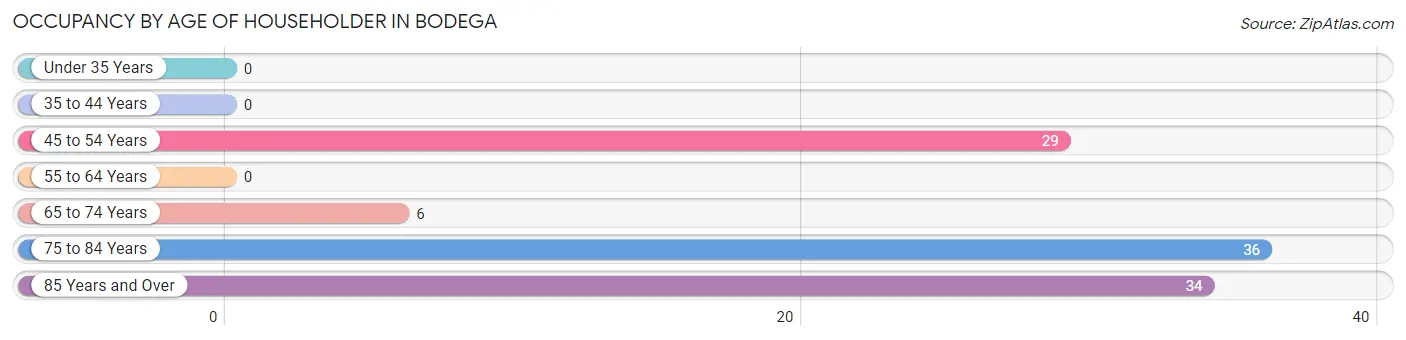
| Age Bracket | # Households | % Households |
| Under 35 Years | 0 | 0.0% |
| 35 to 44 Years | 0 | 0.0% |
| 45 to 54 Years | 29 | 27.6% |
| 55 to 64 Years | 0 | 0.0% |
| 65 to 74 Years | 6 | 5.7% |
| 75 to 84 Years | 36 | 34.3% |
| 85 Years and Over | 34 | 32.4% |
| Total | 105 | 100.0% |
Housing Finances in Bodega
Median Income by Occupancy in Bodega
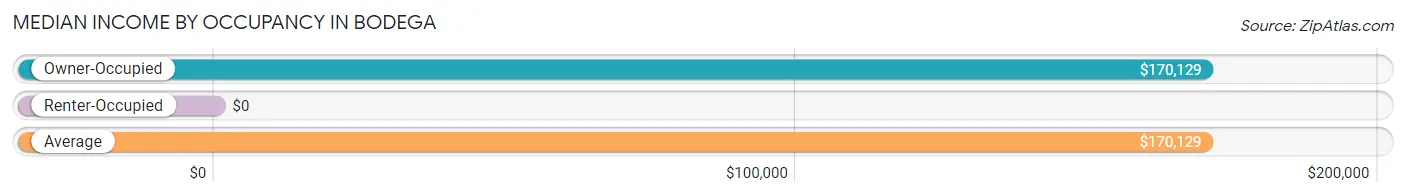
| Occupancy Type | # Households | Median Income |
| Owner-Occupied | 105 (100.0%) | $170,129 |
| Renter-Occupied | 0 (0.0%) | $0 |
| Average | 105 (100.0%) | $170,129 |
Occupancy by Householder Income Bracket in Bodega
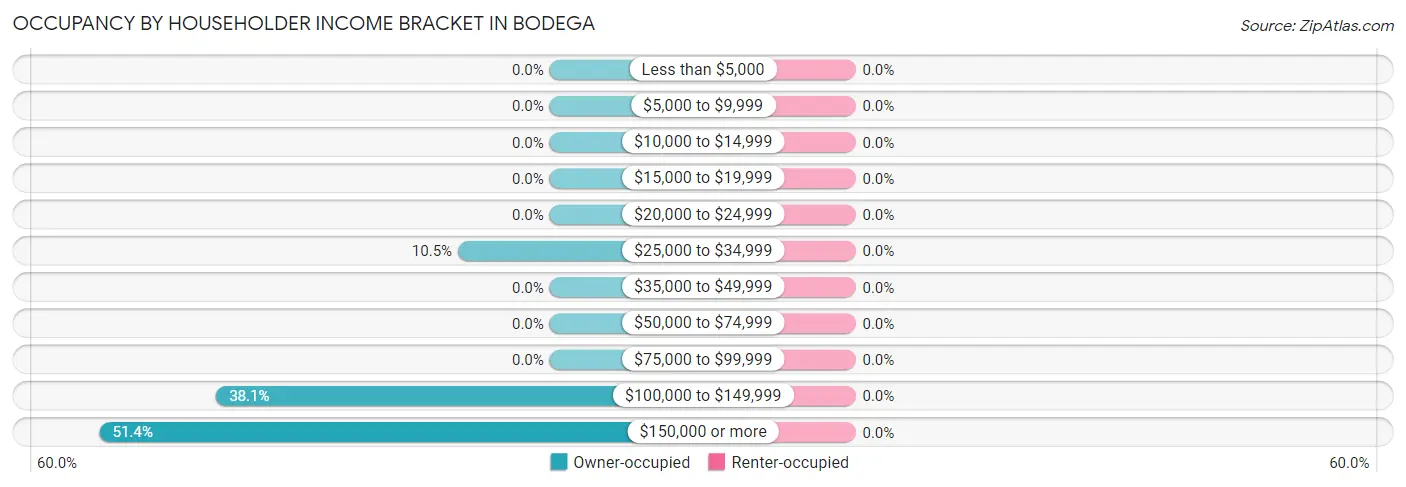
| Income Bracket | Owner-occupied | Renter-occupied |
| Less than $5,000 | 0 (0.0%) | 0 (0.0%) |
| $5,000 to $9,999 | 0 (0.0%) | 0 (0.0%) |
| $10,000 to $14,999 | 0 (0.0%) | 0 (0.0%) |
| $15,000 to $19,999 | 0 (0.0%) | 0 (0.0%) |
| $20,000 to $24,999 | 0 (0.0%) | 0 (0.0%) |
| $25,000 to $34,999 | 11 (10.5%) | 0 (0.0%) |
| $35,000 to $49,999 | 0 (0.0%) | 0 (0.0%) |
| $50,000 to $74,999 | 0 (0.0%) | 0 (0.0%) |
| $75,000 to $99,999 | 0 (0.0%) | 0 (0.0%) |
| $100,000 to $149,999 | 40 (38.1%) | 0 (0.0%) |
| $150,000 or more | 54 (51.4%) | 0 (0.0%) |
| Total | 105 (100.0%) | 0 (0.0%) |
Monthly Housing Cost Tiers in Bodega
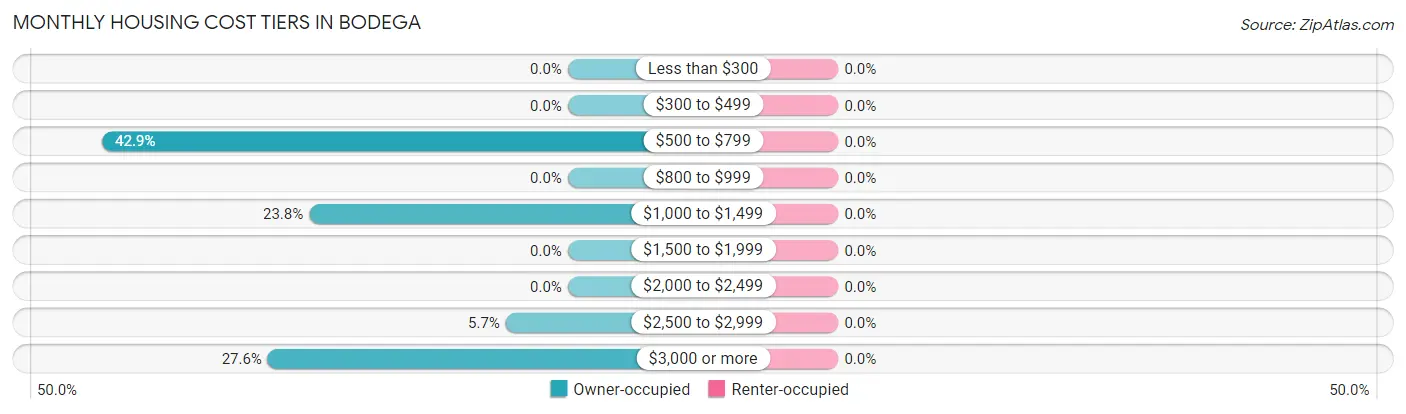
| Monthly Cost | Owner-occupied | Renter-occupied |
| Less than $300 | 0 (0.0%) | 0 (0.0%) |
| $300 to $499 | 0 (0.0%) | 0 (0.0%) |
| $500 to $799 | 45 (42.9%) | 0 (0.0%) |
| $800 to $999 | 0 (0.0%) | 0 (0.0%) |
| $1,000 to $1,499 | 25 (23.8%) | 0 (0.0%) |
| $1,500 to $1,999 | 0 (0.0%) | 0 (0.0%) |
| $2,000 to $2,499 | 0 (0.0%) | 0 (0.0%) |
| $2,500 to $2,999 | 6 (5.7%) | 0 (0.0%) |
| $3,000 or more | 29 (27.6%) | 0 (0.0%) |
| Total | 105 (100.0%) | 0 (0.0%) |
Physical Housing Characteristics in Bodega
Housing Structures in Bodega
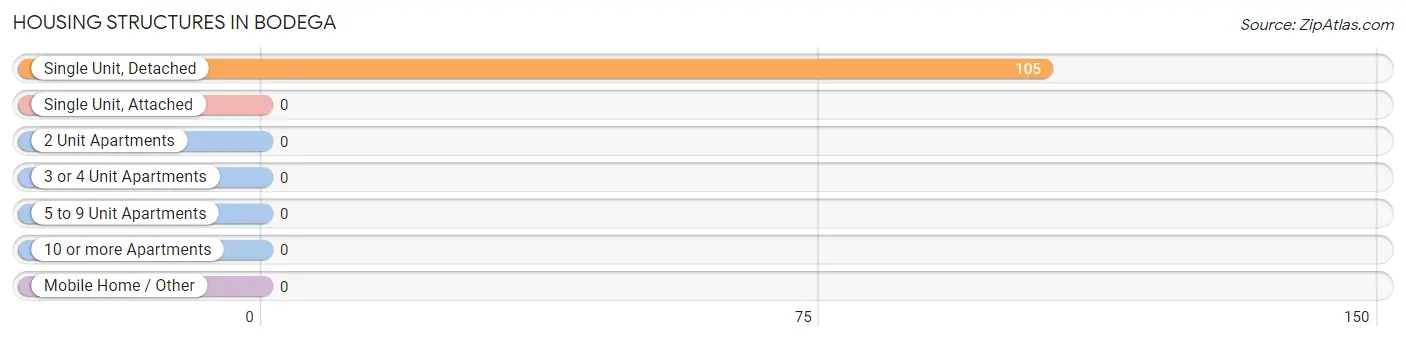
| Structure Type | # Housing Units | % Housing Units |
| Single Unit, Detached | 105 | 100.0% |
| Single Unit, Attached | 0 | 0.0% |
| 2 Unit Apartments | 0 | 0.0% |
| 3 or 4 Unit Apartments | 0 | 0.0% |
| 5 to 9 Unit Apartments | 0 | 0.0% |
| 10 or more Apartments | 0 | 0.0% |
| Mobile Home / Other | 0 | 0.0% |
| Total | 105 | 100.0% |
Housing Structures by Occupancy in Bodega
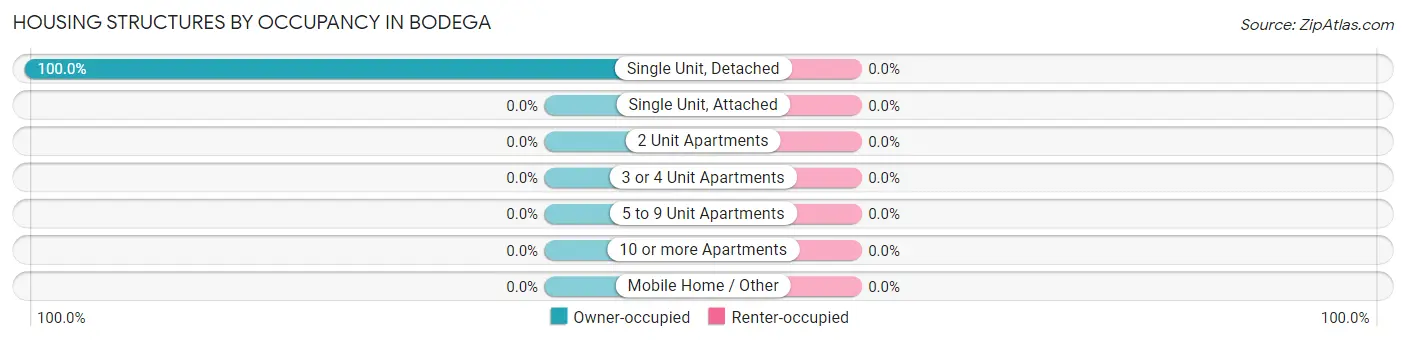
| Structure Type | Owner-occupied | Renter-occupied |
| Single Unit, Detached | 105 (100.0%) | 0 (0.0%) |
| Single Unit, Attached | 0 (0.0%) | 0 (0.0%) |
| 2 Unit Apartments | 0 (0.0%) | 0 (0.0%) |
| 3 or 4 Unit Apartments | 0 (0.0%) | 0 (0.0%) |
| 5 to 9 Unit Apartments | 0 (0.0%) | 0 (0.0%) |
| 10 or more Apartments | 0 (0.0%) | 0 (0.0%) |
| Mobile Home / Other | 0 (0.0%) | 0 (0.0%) |
| Total | 105 (100.0%) | 0 (0.0%) |
Housing Structures by Number of Rooms in Bodega
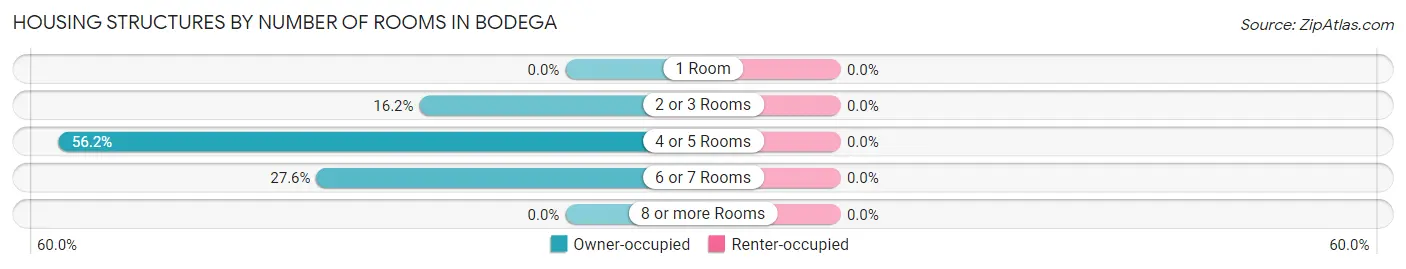
| Number of Rooms | Owner-occupied | Renter-occupied |
| 1 Room | 0 (0.0%) | 0 (0.0%) |
| 2 or 3 Rooms | 17 (16.2%) | 0 (0.0%) |
| 4 or 5 Rooms | 59 (56.2%) | 0 (0.0%) |
| 6 or 7 Rooms | 29 (27.6%) | 0 (0.0%) |
| 8 or more Rooms | 0 (0.0%) | 0 (0.0%) |
| Total | 105 (100.0%) | 0 (0.0%) |
Housing Structure by Heating Type in Bodega
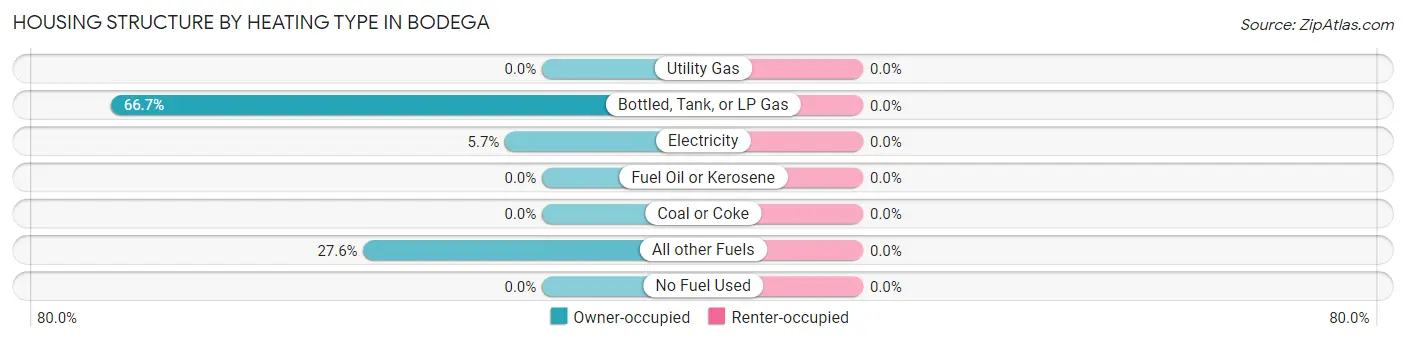
| Heating Type | Owner-occupied | Renter-occupied |
| Utility Gas | 0 (0.0%) | 0 (0.0%) |
| Bottled, Tank, or LP Gas | 70 (66.7%) | 0 (0.0%) |
| Electricity | 6 (5.7%) | 0 (0.0%) |
| Fuel Oil or Kerosene | 0 (0.0%) | 0 (0.0%) |
| Coal or Coke | 0 (0.0%) | 0 (0.0%) |
| All other Fuels | 29 (27.6%) | 0 (0.0%) |
| No Fuel Used | 0 (0.0%) | 0 (0.0%) |
| Total | 105 (100.0%) | 0 (0.0%) |
Household Vehicle Usage in Bodega
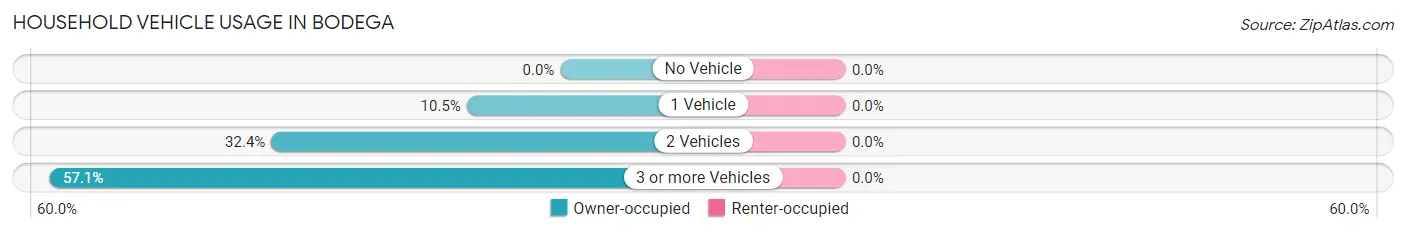
| Vehicles per Household | Owner-occupied | Renter-occupied |
| No Vehicle | 0 (0.0%) | 0 (0.0%) |
| 1 Vehicle | 11 (10.5%) | 0 (0.0%) |
| 2 Vehicles | 34 (32.4%) | 0 (0.0%) |
| 3 or more Vehicles | 60 (57.1%) | 0 (0.0%) |
| Total | 105 (100.0%) | 0 (0.0%) |
Real Estate & Mortgages in Bodega
Real Estate and Mortgage Overview in Bodega
| Characteristic | Without Mortgage | With Mortgage |
| Housing Units | 70 | 35 |
| Median Property Value | - | - |
| Median Household Income | - | - |
| Monthly Housing Costs | $771 | $29 |
| Real Estate Taxes | - | - |
Property Value by Mortgage Status in Bodega
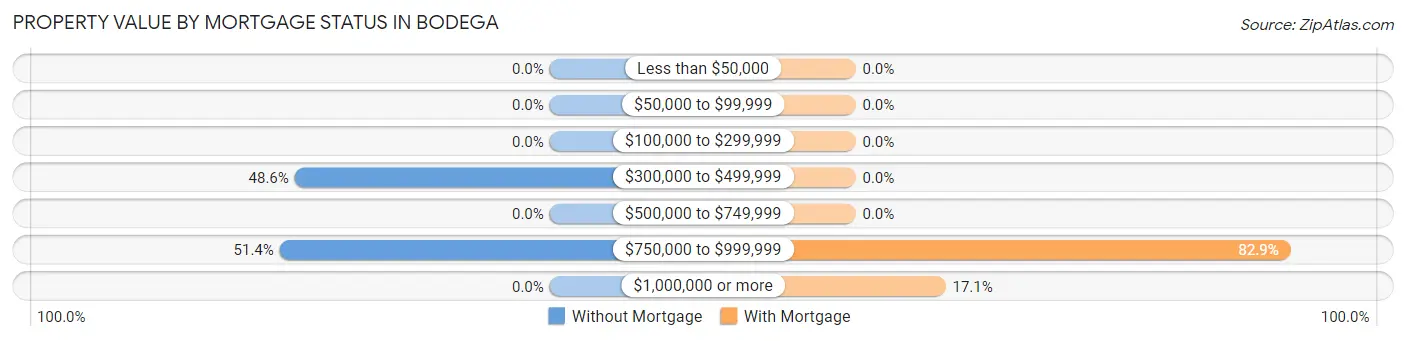
| Property Value | Without Mortgage | With Mortgage |
| Less than $50,000 | 0 (0.0%) | 0 (0.0%) |
| $50,000 to $99,999 | 0 (0.0%) | 0 (0.0%) |
| $100,000 to $299,999 | 0 (0.0%) | 0 (0.0%) |
| $300,000 to $499,999 | 34 (48.6%) | 0 (0.0%) |
| $500,000 to $749,999 | 0 (0.0%) | 0 (0.0%) |
| $750,000 to $999,999 | 36 (51.4%) | 29 (82.9%) |
| $1,000,000 or more | 0 (0.0%) | 6 (17.1%) |
| Total | 70 (100.0%) | 35 (100.0%) |
Household Income by Mortgage Status in Bodega
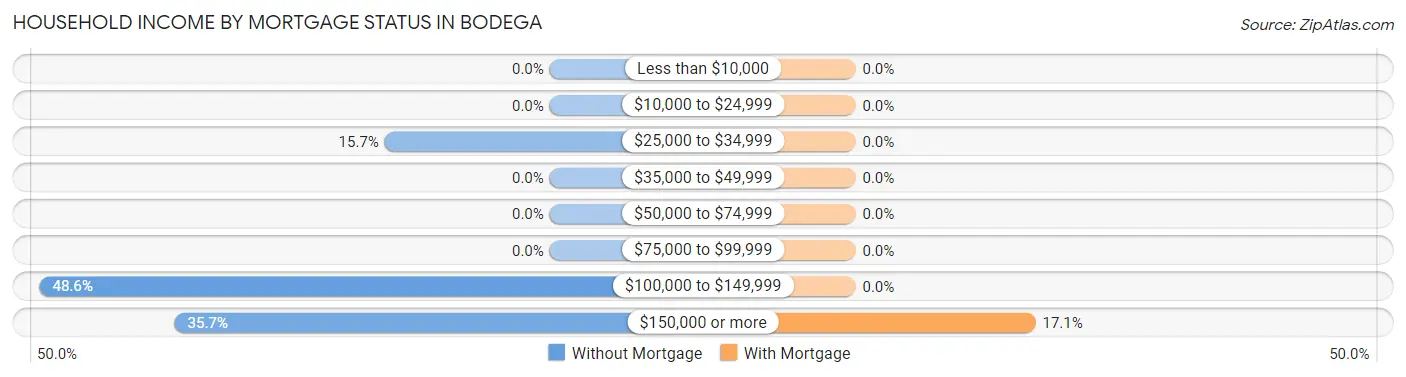
| Household Income | Without Mortgage | With Mortgage |
| Less than $10,000 | 0 (0.0%) | 0 (0.0%) |
| $10,000 to $24,999 | 0 (0.0%) | 0 (0.0%) |
| $25,000 to $34,999 | 11 (15.7%) | 0 (0.0%) |
| $35,000 to $49,999 | 0 (0.0%) | 0 (0.0%) |
| $50,000 to $74,999 | 0 (0.0%) | 0 (0.0%) |
| $75,000 to $99,999 | 0 (0.0%) | 0 (0.0%) |
| $100,000 to $149,999 | 34 (48.6%) | 0 (0.0%) |
| $150,000 or more | 25 (35.7%) | 6 (17.1%) |
| Total | 70 (100.0%) | 35 (100.0%) |
Property Value to Household Income Ratio in Bodega
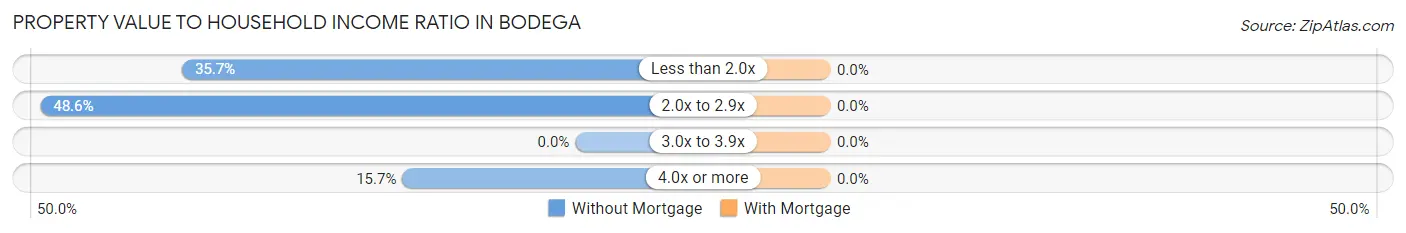
| Value-to-Income Ratio | Without Mortgage | With Mortgage |
| Less than 2.0x | 25 (35.7%) | 0 (0.0%) |
| 2.0x to 2.9x | 34 (48.6%) | 0 (0.0%) |
| 3.0x to 3.9x | 0 (0.0%) | 0 (0.0%) |
| 4.0x or more | 11 (15.7%) | 0 (0.0%) |
| Total | 70 (100.0%) | 35 (100.0%) |
Real Estate Taxes by Mortgage Status in Bodega
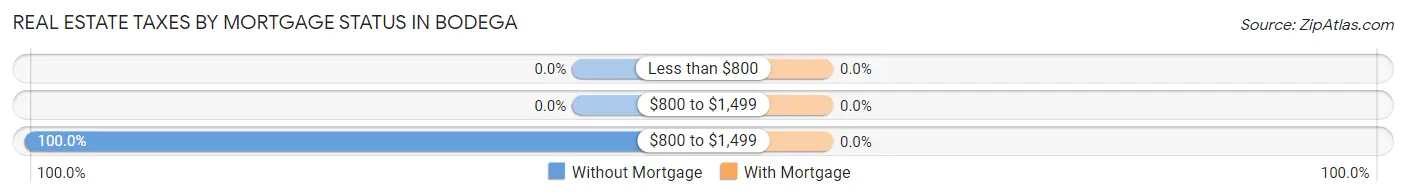
| Property Taxes | Without Mortgage | With Mortgage |
| Less than $800 | 0 (0.0%) | 0 (0.0%) |
| $800 to $1,499 | 0 (0.0%) | 0 (0.0%) |
| $800 to $1,499 | 70 (100.0%) | 0 (0.0%) |
| Total | 70 (100.0%) | 35 (100.0%) |
Health & Disability in Bodega
Health Insurance Coverage by Age in Bodega
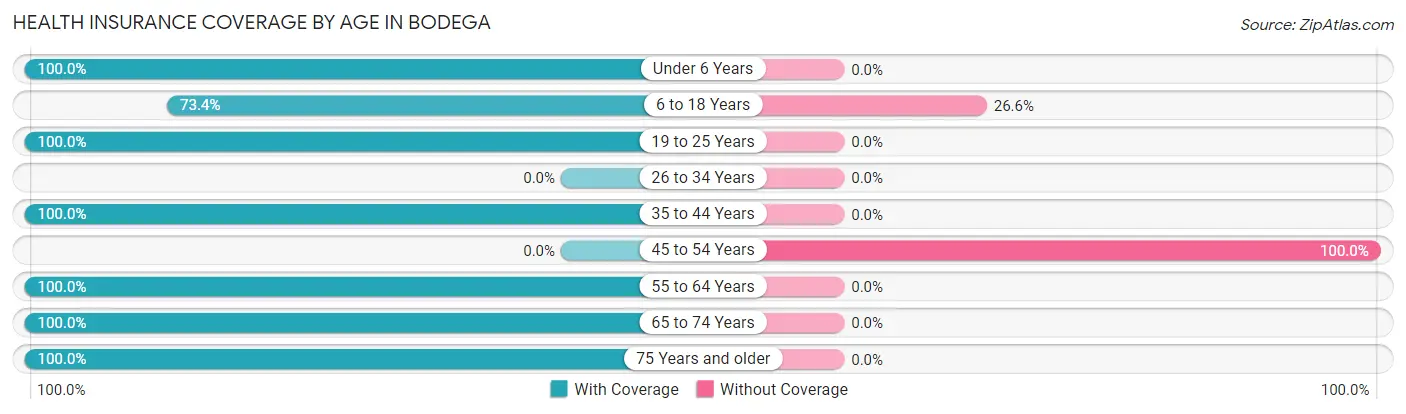
| Age Bracket | With Coverage | Without Coverage |
| Under 6 Years | 6 (100.0%) | 0 (0.0%) |
| 6 to 18 Years | 116 (73.4%) | 42 (26.6%) |
| 19 to 25 Years | 73 (100.0%) | 0 (0.0%) |
| 26 to 34 Years | 0 (0.0%) | 0 (0.0%) |
| 35 to 44 Years | 88 (100.0%) | 0 (0.0%) |
| 45 to 54 Years | 0 (0.0%) | 29 (100.0%) |
| 55 to 64 Years | 28 (100.0%) | 0 (0.0%) |
| 65 to 74 Years | 95 (100.0%) | 0 (0.0%) |
| 75 Years and older | 70 (100.0%) | 0 (0.0%) |
| Total | 476 (87.0%) | 71 (13.0%) |
Health Insurance Coverage by Citizenship Status in Bodega
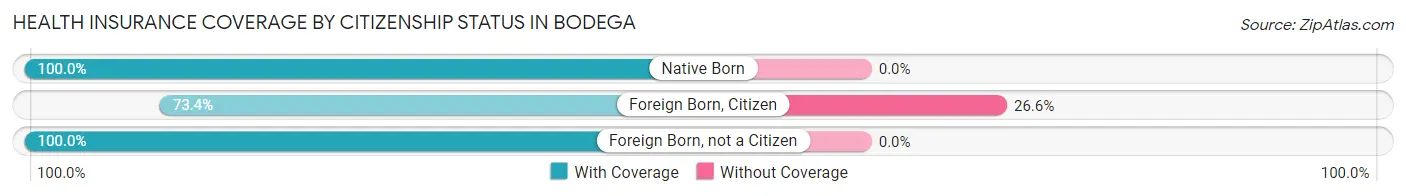
| Citizenship Status | With Coverage | Without Coverage |
| Native Born | 6 (100.0%) | 0 (0.0%) |
| Foreign Born, Citizen | 116 (73.4%) | 42 (26.6%) |
| Foreign Born, not a Citizen | 73 (100.0%) | 0 (0.0%) |
Health Insurance Coverage by Household Income in Bodega
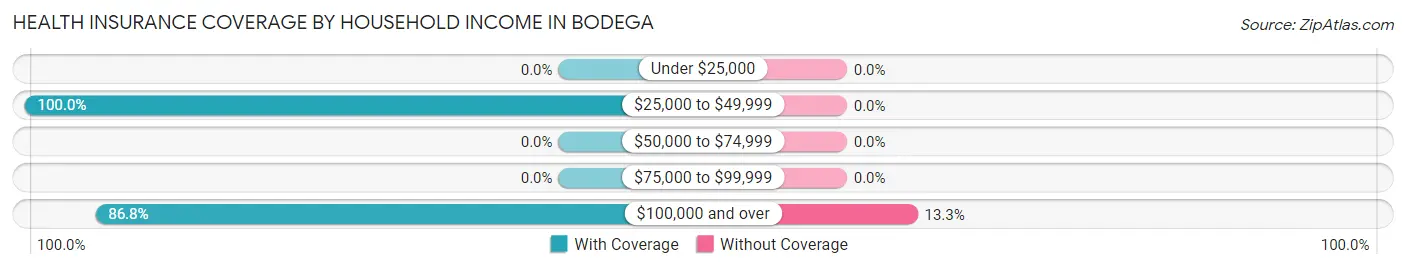
| Household Income | With Coverage | Without Coverage |
| Under $25,000 | 0 (0.0%) | 0 (0.0%) |
| $25,000 to $49,999 | 11 (100.0%) | 0 (0.0%) |
| $50,000 to $74,999 | 0 (0.0%) | 0 (0.0%) |
| $75,000 to $99,999 | 0 (0.0%) | 0 (0.0%) |
| $100,000 and over | 465 (86.8%) | 71 (13.3%) |
Public vs Private Health Insurance Coverage by Age in Bodega
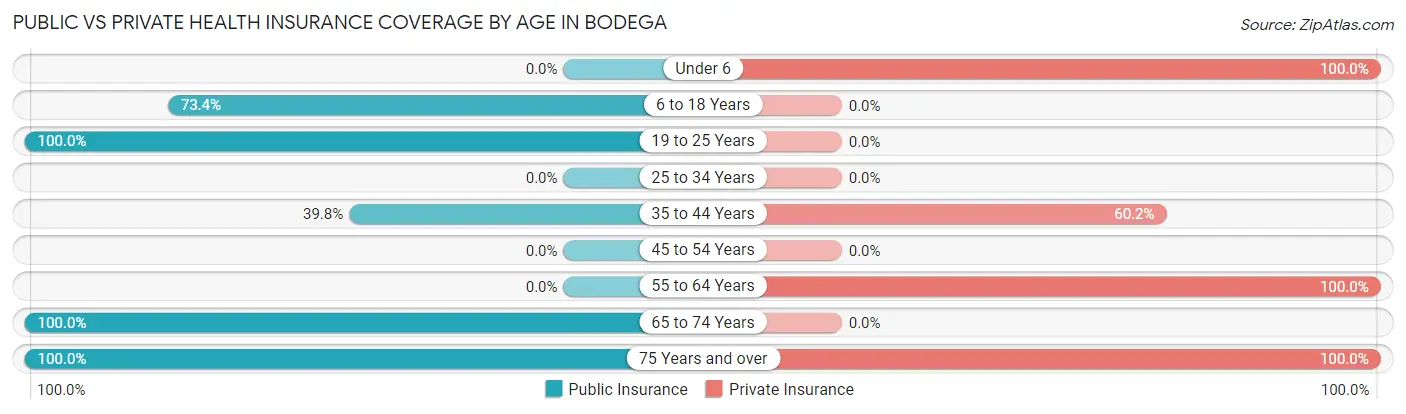
| Age Bracket | Public Insurance | Private Insurance |
| Under 6 | 0 (0.0%) | 6 (100.0%) |
| 6 to 18 Years | 116 (73.4%) | 0 (0.0%) |
| 19 to 25 Years | 73 (100.0%) | 0 (0.0%) |
| 25 to 34 Years | 0 (0.0%) | 0 (0.0%) |
| 35 to 44 Years | 35 (39.8%) | 53 (60.2%) |
| 45 to 54 Years | 0 (0.0%) | 0 (0.0%) |
| 55 to 64 Years | 0 (0.0%) | 28 (100.0%) |
| 65 to 74 Years | 95 (100.0%) | 0 (0.0%) |
| 75 Years and over | 70 (100.0%) | 70 (100.0%) |
| Total | 389 (71.1%) | 157 (28.7%) |
Disability Status by Sex by Age in Bodega
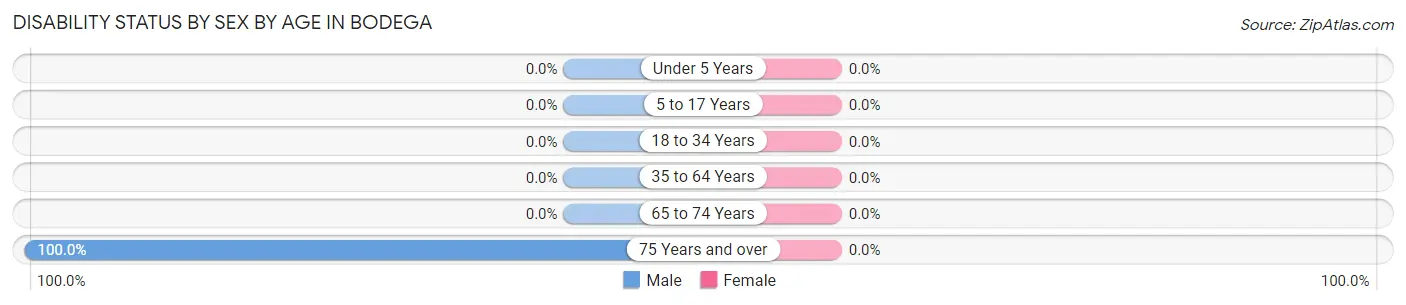
| Age Bracket | Male | Female |
| Under 5 Years | 0 (0.0%) | 0 (0.0%) |
| 5 to 17 Years | 0 (0.0%) | 0 (0.0%) |
| 18 to 34 Years | 0 (0.0%) | 0 (0.0%) |
| 35 to 64 Years | 0 (0.0%) | 0 (0.0%) |
| 65 to 74 Years | 0 (0.0%) | 0 (0.0%) |
| 75 Years and over | 11 (100.0%) | 0 (0.0%) |
Disability Class by Sex by Age in Bodega
Disability Class: Hearing Difficulty
| Age Bracket | Male | Female |
| Under 5 Years | 0 (0.0%) | 0 (0.0%) |
| 5 to 17 Years | 0 (0.0%) | 0 (0.0%) |
| 18 to 34 Years | 0 (0.0%) | 0 (0.0%) |
| 35 to 64 Years | 0 (0.0%) | 0 (0.0%) |
| 65 to 74 Years | 0 (0.0%) | 0 (0.0%) |
| 75 Years and over | 11 (100.0%) | 0 (0.0%) |
Disability Class: Vision Difficulty
| Age Bracket | Male | Female |
| Under 5 Years | 0 (0.0%) | 0 (0.0%) |
| 5 to 17 Years | 0 (0.0%) | 0 (0.0%) |
| 18 to 34 Years | 0 (0.0%) | 0 (0.0%) |
| 35 to 64 Years | 0 (0.0%) | 0 (0.0%) |
| 65 to 74 Years | 0 (0.0%) | 0 (0.0%) |
| 75 Years and over | 0 (0.0%) | 0 (0.0%) |
Disability Class: Cognitive Difficulty
| Age Bracket | Male | Female |
| 5 to 17 Years | 0 (0.0%) | 0 (0.0%) |
| 18 to 34 Years | 0 (0.0%) | 0 (0.0%) |
| 35 to 64 Years | 0 (0.0%) | 0 (0.0%) |
| 65 to 74 Years | 0 (0.0%) | 0 (0.0%) |
| 75 Years and over | 0 (0.0%) | 0 (0.0%) |
Disability Class: Ambulatory Difficulty
| Age Bracket | Male | Female |
| 5 to 17 Years | 0 (0.0%) | 0 (0.0%) |
| 18 to 34 Years | 0 (0.0%) | 0 (0.0%) |
| 35 to 64 Years | 0 (0.0%) | 0 (0.0%) |
| 65 to 74 Years | 0 (0.0%) | 0 (0.0%) |
| 75 Years and over | 0 (0.0%) | 0 (0.0%) |
Disability Class: Self-Care Difficulty
| Age Bracket | Male | Female |
| 5 to 17 Years | 0 (0.0%) | 0 (0.0%) |
| 18 to 34 Years | 0 (0.0%) | 0 (0.0%) |
| 35 to 64 Years | 0 (0.0%) | 0 (0.0%) |
| 65 to 74 Years | 0 (0.0%) | 0 (0.0%) |
| 75 Years and over | 0 (0.0%) | 0 (0.0%) |
Technology Access in Bodega
Computing Device Access in Bodega
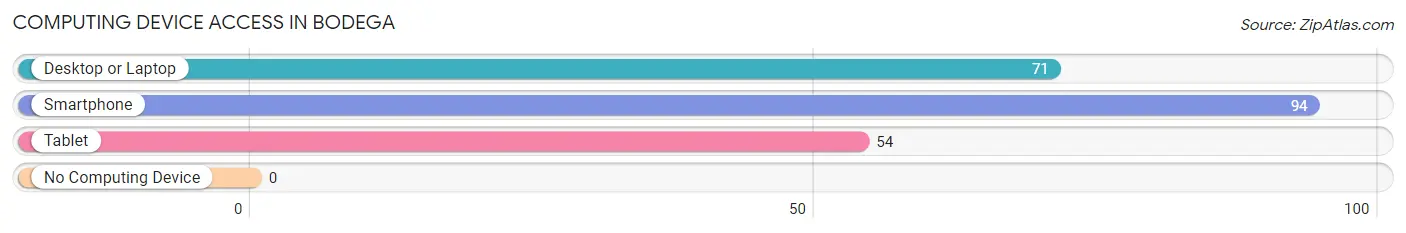
| Device Type | # Households | % Households |
| Desktop or Laptop | 71 | 67.6% |
| Smartphone | 94 | 89.5% |
| Tablet | 54 | 51.4% |
| No Computing Device | 0 | 0.0% |
| Total | 105 | 100.0% |
Internet Access in Bodega
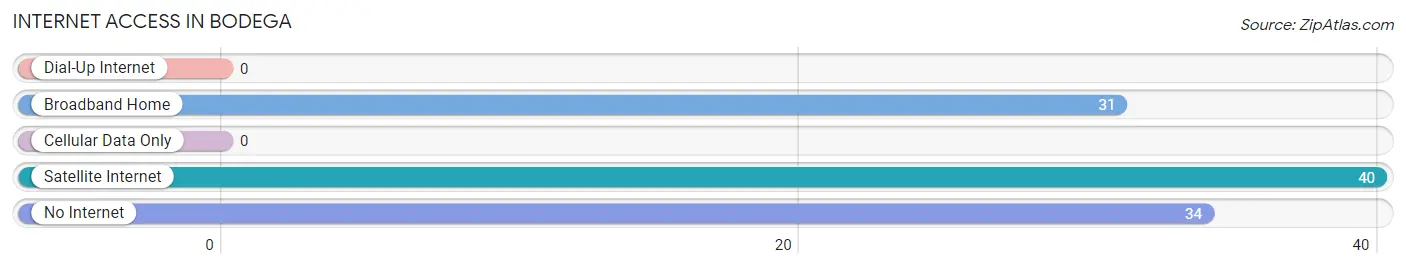
| Internet Type | # Households | % Households |
| Dial-Up Internet | 0 | 0.0% |
| Broadband Home | 31 | 29.5% |
| Cellular Data Only | 0 | 0.0% |
| Satellite Internet | 40 | 38.1% |
| No Internet | 34 | 32.4% |
| Total | 105 | 100.0% |
Bodega Summary
Bodega, California is a small unincorporated community located in Sonoma County, California. It is situated on the Pacific Coast, approximately 50 miles north of San Francisco. The town is located in the heart of the Russian River Valley, a region known for its vineyards and wineries. Bodega is home to a population of approximately 1,000 people, and is a popular tourist destination due to its proximity to the coast and its picturesque scenery.
History
The area that is now Bodega was originally inhabited by the Coast Miwok Native American tribe. The first European settlers arrived in the area in the late 1700s, and the town was officially founded in 1867. The town was named after the nearby Bodega Bay, which was named by Spanish explorer Sebastián Vizcaíno in 1603.
The town was initially a fishing and farming community, but in the late 1800s, it became a popular tourist destination due to its scenic beauty and proximity to the coast. The town was also home to a number of saloons and gambling halls, which attracted visitors from all over the region.
In the early 1900s, the town began to experience a decline in population as many of its residents moved away in search of better economic opportunities. However, in the 1950s, the town experienced a resurgence in popularity as a tourist destination. This trend has continued to the present day, and Bodega is now a popular destination for visitors from all over the world.
Geography
Bodega is located in the Russian River Valley, a region known for its vineyards and wineries. The town is situated on the Pacific Coast, approximately 50 miles north of San Francisco. The town is surrounded by rolling hills and is home to a number of small creeks and streams. The climate in Bodega is mild, with temperatures rarely dropping below freezing in the winter months.
Economy
The economy of Bodega is largely based on tourism. The town is home to a number of bed and breakfasts, restaurants, and shops that cater to visitors from all over the world. The town is also home to a number of wineries and vineyards, which attract visitors from all over the region. Additionally, the town is home to a number of small businesses, including a grocery store, a hardware store, and a post office.
Demographics
As of the 2010 census, the population of Bodega was 1,072. The racial makeup of the town was 87.3% White, 0.7% African American, 0.3% Native American, 0.7% Asian, 0.1% Pacific Islander, 8.2% from other races, and 2.9% from two or more races. The median household income in Bodega was $50,000, and the median age was 44.
Conclusion
Bodega, California is a small unincorporated community located in Sonoma County, California. It is situated on the Pacific Coast, approximately 50 miles north of San Francisco. The town is located in the heart of the Russian River Valley, a region known for its vineyards and wineries. Bodega is home to a population of approximately 1,000 people, and is a popular tourist destination due to its proximity to the coast and its picturesque scenery. The economy of Bodega is largely based on tourism, and the town is home to a number of bed and breakfasts, restaurants, and shops that cater to visitors from all over the world. The racial makeup of the town is predominantly White, with a small percentage of African American, Native American, Asian, and Pacific Islander residents. The median household income in Bodega is $50,000, and the median age is 44.
Common Questions
What is Per Capita Income in Bodega?
Per Capita income in Bodega is $56,724.
What is the Median Family Income in Bodega?
Median Family Income in Bodega is $143,103.
What is the Median Household income in Bodega?
Median Household Income in Bodega is $170,129.
What is Inequality or Gini Index in Bodega?
Inequality or Gini Index in Bodega is 0.44.
What is the Total Population of Bodega?
Total Population of Bodega is 547.
What is the Total Male Population of Bodega?
Total Male Population of Bodega is 278.
What is the Total Female Population of Bodega?
Total Female Population of Bodega is 269.
What is the Ratio of Males per 100 Females in Bodega?
There are 103.35 Males per 100 Females in Bodega.
What is the Ratio of Females per 100 Males in Bodega?
There are 96.76 Females per 100 Males in Bodega.
What is the Median Population Age in Bodega?
Median Population Age in Bodega is 38.6 Years.
What is the Average Family Size in Bodega
Average Family Size in Bodega is 3.3 People.
What is the Average Household Size in Bodega
Average Household Size in Bodega is 5.2 People.
How Large is the Labor Force in Bodega?
There are 244 People in the Labor Forcein in Bodega.
What is the Percentage of People in the Labor Force in Bodega?
57.7% of People are in the Labor Force in Bodega.
What is the Unemployment Rate in Bodega?
Unemployment Rate in Bodega is 30.3%.