Zip Codes with the Highest Percentage of Population Employed in Real Estate, Rental & Leasing in Vermont
RELATED REPORTS & OPTIONS
Real Estate, Rental & Leasing
Vermont
Compare Zip Codes
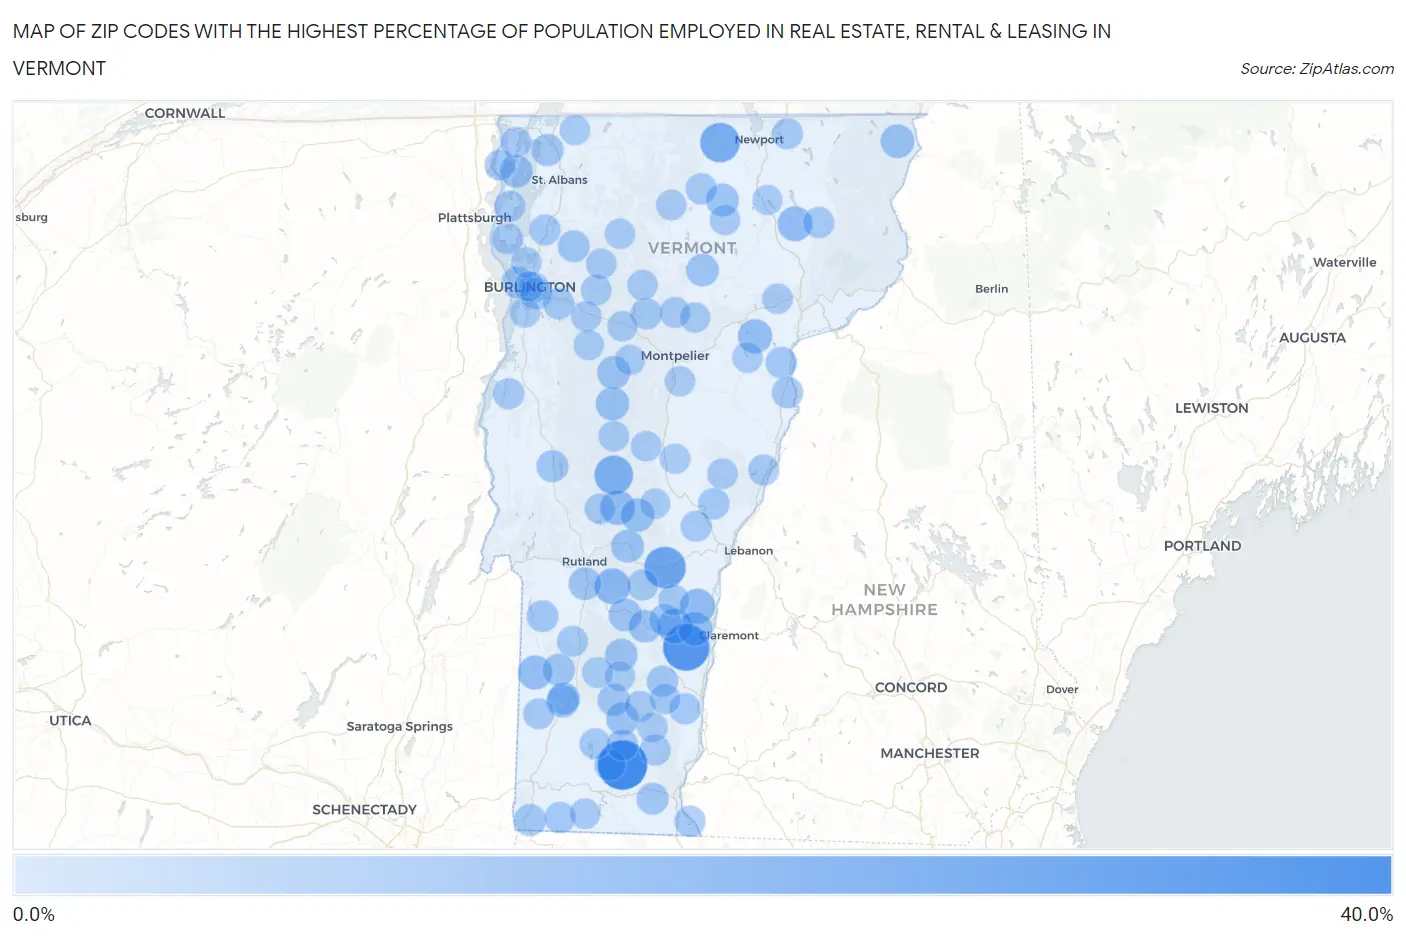
Map of Zip Codes with the Highest Percentage of Population Employed in Real Estate, Rental & Leasing in Vermont
0.0%
40.0%
Zip Codes with the Highest Percentage of Population Employed in Real Estate, Rental & Leasing in Vermont
| Zip Code | % Employed | vs State | vs National | |
| 1. | 05341 | 30.8% | 1.6%(+29.2)#1 | 1.9%(+28.9)#42 |
| 2. | 05150 | 25.7% | 1.6%(+24.1)#2 | 1.9%(+23.8)#67 |
| 3. | 05034 | 18.5% | 1.6%(+16.9)#3 | 1.9%(+16.6)#119 |
| 4. | 05868 | 15.4% | 1.6%(+13.8)#4 | 1.9%(+13.5)#165 |
| 5. | 05767 | 13.9% | 1.6%(+12.3)#5 | 1.9%(+12.0)#203 |
| 6. | 05738 | 9.4% | 1.6%(+7.77)#6 | 1.9%(+7.47)#438 |
| 7. | 05037 | 8.5% | 1.6%(+6.87)#7 | 1.9%(+6.57)#499 |
| 8. | 05762 | 8.1% | 1.6%(+6.46)#8 | 1.9%(+6.16)#548 |
| 9. | 05142 | 8.0% | 1.6%(+6.44)#9 | 1.9%(+6.14)#551 |
| 10. | 05867 | 7.9% | 1.6%(+6.35)#10 | 1.9%(+6.05)#564 |
| 11. | 05862 | 7.3% | 1.6%(+5.68)#11 | 1.9%(+5.38)#677 |
| 12. | 05151 | 7.1% | 1.6%(+5.55)#12 | 1.9%(+5.25)#703 |
| 13. | 05776 | 6.9% | 1.6%(+5.30)#13 | 1.9%(+5.00)#747 |
| 14. | 05903 | 6.2% | 1.6%(+4.64)#14 | 1.9%(+4.34)#912 |
| 15. | 05772 | 6.1% | 1.6%(+4.55)#15 | 1.9%(+4.25)#932 |
| 16. | 05674 | 5.9% | 1.6%(+4.34)#16 | 1.9%(+4.04)#1,003 |
| 17. | 05673 | 5.6% | 1.6%(+4.04)#17 | 1.9%(+3.74)#1,108 |
| 18. | 05820 | 5.1% | 1.6%(+3.51)#18 | 1.9%(+3.21)#1,335 |
| 19. | 05751 | 5.1% | 1.6%(+3.49)#19 | 1.9%(+3.19)#1,344 |
| 20. | 05758 | 5.1% | 1.6%(+3.47)#20 | 1.9%(+3.17)#1,359 |
| 21. | 05474 | 5.0% | 1.6%(+3.37)#21 | 1.9%(+3.07)#1,417 |
| 22. | 05161 | 4.7% | 1.6%(+3.09)#22 | 1.9%(+2.79)#1,577 |
| 23. | 05343 | 4.7% | 1.6%(+3.09)#23 | 1.9%(+2.79)#1,583 |
| 24. | 05254 | 4.7% | 1.6%(+3.07)#24 | 1.9%(+2.77)#1,596 |
| 25. | 05149 | 4.6% | 1.6%(+3.05)#25 | 1.9%(+2.75)#1,609 |
| 26. | 05759 | 4.6% | 1.6%(+3.03)#26 | 1.9%(+2.73)#1,622 |
| 27. | 05680 | 4.6% | 1.6%(+3.00)#27 | 1.9%(+2.70)#1,649 |
| 28. | 05255 | 4.5% | 1.6%(+2.89)#28 | 1.9%(+2.59)#1,736 |
| 29. | 05251 | 4.4% | 1.6%(+2.84)#29 | 1.9%(+2.55)#1,763 |
| 30. | 05155 | 4.3% | 1.6%(+2.72)#30 | 1.9%(+2.42)#1,859 |
| 31. | 05769 | 4.0% | 1.6%(+2.41)#31 | 1.9%(+2.11)#2,162 |
| 32. | 05153 | 4.0% | 1.6%(+2.37)#32 | 1.9%(+2.07)#2,226 |
| 33. | 05488 | 3.9% | 1.6%(+2.29)#33 | 1.9%(+1.99)#2,297 |
| 34. | 05301 | 3.9% | 1.6%(+2.26)#34 | 1.9%(+1.96)#2,323 |
| 35. | 05261 | 3.8% | 1.6%(+2.24)#35 | 1.9%(+1.94)#2,350 |
| 36. | 05408 | 3.7% | 1.6%(+2.10)#36 | 1.9%(+1.80)#2,537 |
| 37. | 05774 | 3.4% | 1.6%(+1.85)#37 | 1.9%(+1.55)#2,948 |
| 38. | 05494 | 3.3% | 1.6%(+1.75)#38 | 1.9%(+1.45)#3,137 |
| 39. | 05403 | 3.1% | 1.6%(+1.49)#39 | 1.9%(+1.19)#3,678 |
| 40. | 05677 | 3.1% | 1.6%(+1.48)#40 | 1.9%(+1.19)#3,683 |
| 41. | 05042 | 3.0% | 1.6%(+1.43)#41 | 1.9%(+1.13)#3,840 |
| 42. | 05065 | 3.0% | 1.6%(+1.37)#42 | 1.9%(+1.07)#4,001 |
| 43. | 05143 | 2.9% | 1.6%(+1.29)#43 | 1.9%(+0.995)#4,206 |
| 44. | 05081 | 2.9% | 1.6%(+1.28)#44 | 1.9%(+0.979)#4,247 |
| 45. | 05356 | 2.9% | 1.6%(+1.26)#45 | 1.9%(+0.965)#4,280 |
| 46. | 05154 | 2.8% | 1.6%(+1.26)#46 | 1.9%(+0.956)#4,303 |
| 47. | 05495 | 2.8% | 1.6%(+1.22)#47 | 1.9%(+0.925)#4,385 |
| 48. | 05355 | 2.8% | 1.6%(+1.21)#48 | 1.9%(+0.914)#4,421 |
| 49. | 05847 | 2.7% | 1.6%(+1.10)#49 | 1.9%(+0.804)#4,755 |
| 50. | 05345 | 2.7% | 1.6%(+1.09)#50 | 1.9%(+0.794)#4,788 |
| 51. | 05352 | 2.7% | 1.6%(+1.06)#51 | 1.9%(+0.763)#4,917 |
| 52. | 05486 | 2.6% | 1.6%(+0.988)#52 | 1.9%(+0.688)#5,162 |
| 53. | 05871 | 2.5% | 1.6%(+0.935)#53 | 1.9%(+0.635)#5,386 |
| 54. | 05354 | 2.5% | 1.6%(+0.883)#54 | 1.9%(+0.583)#5,577 |
| 55. | 05491 | 2.5% | 1.6%(+0.879)#55 | 1.9%(+0.580)#5,588 |
| 56. | 05045 | 2.5% | 1.6%(+0.863)#56 | 1.9%(+0.564)#5,649 |
| 57. | 05053 | 2.5% | 1.6%(+0.862)#57 | 1.9%(+0.562)#5,658 |
| 58. | 05829 | 2.4% | 1.6%(+0.764)#58 | 1.9%(+0.464)#6,076 |
| 59. | 05468 | 2.3% | 1.6%(+0.720)#59 | 1.9%(+0.421)#6,256 |
| 60. | 05360 | 2.3% | 1.6%(+0.689)#60 | 1.9%(+0.390)#6,398 |
| 61. | 05062 | 2.3% | 1.6%(+0.681)#61 | 1.9%(+0.381)#6,451 |
| 62. | 05056 | 2.2% | 1.6%(+0.630)#62 | 1.9%(+0.331)#6,703 |
| 63. | 05739 | 2.2% | 1.6%(+0.582)#63 | 1.9%(+0.282)#6,929 |
| 64. | 05250 | 2.2% | 1.6%(+0.569)#64 | 1.9%(+0.270)#7,009 |
| 65. | 05440 | 2.1% | 1.6%(+0.512)#65 | 1.9%(+0.212)#7,302 |
| 66. | 05152 | 2.1% | 1.6%(+0.498)#66 | 1.9%(+0.199)#7,366 |
| 67. | 05682 | 2.1% | 1.6%(+0.468)#67 | 1.9%(+0.169)#7,537 |
| 68. | 05465 | 2.1% | 1.6%(+0.461)#68 | 1.9%(+0.161)#7,571 |
| 69. | 05458 | 2.0% | 1.6%(+0.417)#69 | 1.9%(+0.117)#7,785 |
| 70. | 05359 | 2.0% | 1.6%(+0.388)#70 | 1.9%(+0.088)#7,950 |
| 71. | 05146 | 1.9% | 1.6%(+0.260)#71 | 1.9%(-0.040)#8,769 |
| 72. | 05747 | 1.8% | 1.6%(+0.226)#72 | 1.9%(-0.074)#8,999 |
| 73. | 05489 | 1.8% | 1.6%(+0.222)#73 | 1.9%(-0.078)#9,020 |
| 74. | 05463 | 1.8% | 1.6%(+0.187)#74 | 1.9%(-0.112)#9,260 |
| 75. | 05072 | 1.7% | 1.6%(+0.122)#75 | 1.9%(-0.177)#9,667 |
| 76. | 05060 | 1.7% | 1.6%(+0.112)#76 | 1.9%(-0.188)#9,727 |
| 77. | 05828 | 1.7% | 1.6%(+0.106)#77 | 1.9%(-0.193)#9,767 |
| 78. | 05477 | 1.7% | 1.6%(+0.104)#78 | 1.9%(-0.196)#9,775 |
| 79. | 05405 | 1.7% | 1.6%(+0.062)#79 | 1.9%(-0.238)#10,083 |
| 80. | 05676 | 1.6% | 1.6%(+0.043)#80 | 1.9%(-0.257)#10,212 |
| 81. | 05737 | 1.6% | 1.6%(+0.036)#81 | 1.9%(-0.263)#10,251 |
| 82. | 05652 | 1.6% | 1.6%(+0.004)#82 | 1.9%(-0.296)#10,465 |
| 83. | 05672 | 1.6% | 1.6%(+0.001)#83 | 1.9%(-0.298)#10,484 |
| 84. | 05350 | 1.6% | 1.6%(-0.016)#84 | 1.9%(-0.315)#10,592 |
| 85. | 05046 | 1.6% | 1.6%(-0.023)#85 | 1.9%(-0.323)#10,644 |
| 86. | 05827 | 1.6% | 1.6%(-0.036)#86 | 1.9%(-0.335)#10,741 |
| 87. | 05032 | 1.5% | 1.6%(-0.070)#87 | 1.9%(-0.370)#10,993 |
| 88. | 05641 | 1.5% | 1.6%(-0.077)#88 | 1.9%(-0.377)#11,045 |
| 89. | 05446 | 1.5% | 1.6%(-0.082)#89 | 1.9%(-0.381)#11,073 |
| 90. | 05482 | 1.5% | 1.6%(-0.125)#90 | 1.9%(-0.425)#11,426 |
| 91. | 05660 | 1.5% | 1.6%(-0.129)#91 | 1.9%(-0.428)#11,453 |
| 92. | 05353 | 1.4% | 1.6%(-0.164)#92 | 1.9%(-0.463)#11,760 |
| 93. | 05462 | 1.4% | 1.6%(-0.172)#93 | 1.9%(-0.472)#11,820 |
| 94. | 05061 | 1.4% | 1.6%(-0.188)#94 | 1.9%(-0.488)#11,946 |
| 95. | 05464 | 1.4% | 1.6%(-0.198)#95 | 1.9%(-0.498)#12,025 |
| 96. | 05648 | 1.4% | 1.6%(-0.203)#96 | 1.9%(-0.503)#12,071 |
| 97. | 05459 | 1.4% | 1.6%(-0.235)#97 | 1.9%(-0.535)#12,294 |
| 98. | 05401 | 1.3% | 1.6%(-0.320)#98 | 1.9%(-0.620)#12,938 |
| 99. | 05148 | 1.2% | 1.6%(-0.356)#99 | 1.9%(-0.656)#13,192 |
| 100. | 05822 | 1.2% | 1.6%(-0.358)#100 | 1.9%(-0.657)#13,204 |
Common Questions
What are the Top 10 Zip Codes with the Highest Percentage of Population Employed in Real Estate, Rental & Leasing in Vermont?
Top 10 Zip Codes with the Highest Percentage of Population Employed in Real Estate, Rental & Leasing in Vermont are:
What zip code has the Highest Percentage of Population Employed in Real Estate, Rental & Leasing in Vermont?
05341 has the Highest Percentage of Population Employed in Real Estate, Rental & Leasing in Vermont with 30.8%.
What is the Percentage of Population Employed in Real Estate, Rental & Leasing in the State of Vermont?
Percentage of Population Employed in Real Estate, Rental & Leasing in Vermont is 1.6%.
What is the Percentage of Population Employed in Real Estate, Rental & Leasing in the United States?
Percentage of Population Employed in Real Estate, Rental & Leasing in the United States is 1.9%.