Zip Codes with the Highest Percentage of Households With Three or more Vehicles in Layton, UT
RELATED REPORTS & OPTIONS
Households with 3 or more Cars
Layton
Compare Zip Codes
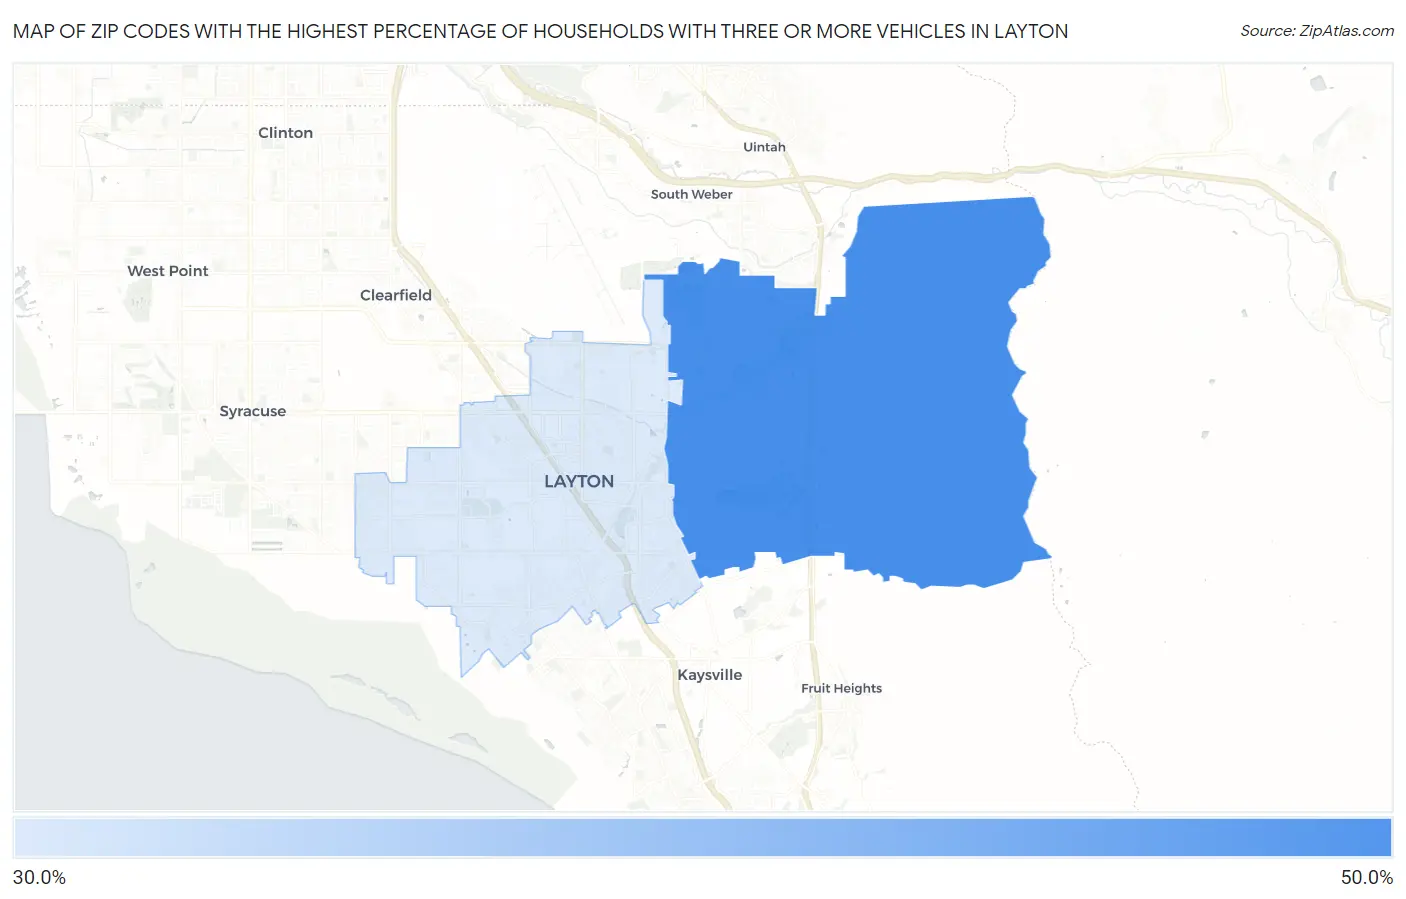
Map of Zip Codes with the Highest Percentage of Households With Three or more Vehicles in Layton
38.8%
41.9%
Zip Codes with the Highest Percentage of Households With Three or more Vehicles in Layton, UT
| Zip Code | Housholds With 3+ Cars | vs State | vs National | |
| 1. | 84040 | 41.9% | 39.8%(+2.10)#160 | 29.0%(+12.9)#7,272 |
| 2. | 84041 | 38.8% | 39.8%(-1.00)#181 | 29.0%(+9.80)#9,447 |
1
Common Questions
What are the Top Zip Codes with the Highest Percentage of Households With Three or more Vehicles in Layton, UT?
Top Zip Codes with the Highest Percentage of Households With Three or more Vehicles in Layton, UT are:
What zip code has the Highest Percentage of Households With Three or more Vehicles in Layton, UT?
84040 has the Highest Percentage of Households With Three or more Vehicles in Layton, UT with 41.9%.
What is the Percentage of Households With Three or more Vehicles in Layton, UT?
Percentage of Households With Three or more Vehicles in Layton is 40.0%.
What is the Percentage of Households With Three or more Vehicles in Utah?
Percentage of Households With Three or more Vehicles in Utah is 39.8%.
What is the Percentage of Households With Three or more Vehicles in the United States?
Percentage of Households With Three or more Vehicles in the United States is 29.0%.