Shamrock, TX Map & Demographics
Shamrock Map
Shamrock Overview
$25,538
PER CAPITA INCOME
$50,208
AVG FAMILY INCOME
$39,333
AVG HOUSEHOLD INCOME
34.5%
WAGE / INCOME GAP [ % ]
65.5¢/ $1
WAGE / INCOME GAP [ $ ]
0.42
INEQUALITY / GINI INDEX
2,000
TOTAL POPULATION
993
MALE POPULATION
1,007
FEMALE POPULATION
98.61
MALES / 100 FEMALES
101.41
FEMALES / 100 MALES
36.6
MEDIAN AGE
2.8
AVG FAMILY SIZE
2.4
AVG HOUSEHOLD SIZE
1,032
LABOR FORCE [ PEOPLE ]
64.4%
PERCENT IN LABOR FORCE
7.4%
UNEMPLOYMENT RATE
Shamrock Zip Codes
Shamrock Area Codes
Income in Shamrock
Income Overview in Shamrock
Per Capita Income in Shamrock is $25,538, while median incomes of families and households are $50,208 and $39,333 respectively.
| Characteristic | Number | Measure |
| Per Capita Income | 2,000 | $25,538 |
| Median Family Income | 619 | $50,208 |
| Mean Family Income | 619 | $61,977 |
| Median Household Income | 850 | $39,333 |
| Mean Household Income | 850 | $57,126 |
| Income Deficit | 619 | $0 |
| Wage / Income Gap (%) | 2,000 | 34.50% |
| Wage / Income Gap ($) | 2,000 | 65.50¢ per $1 |
| Gini / Inequality Index | 2,000 | 0.42 |
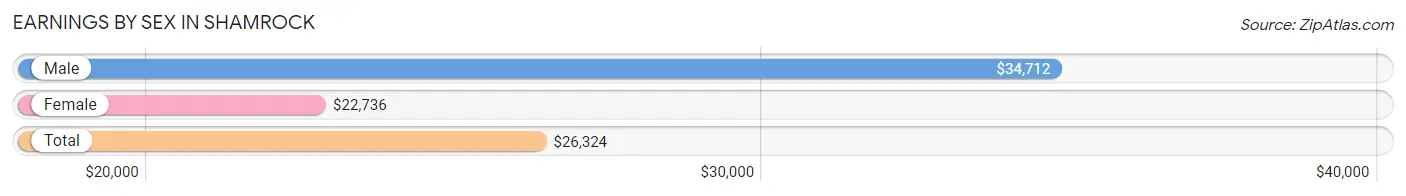
Earnings by Sex in Shamrock
Average Earnings in Shamrock are $26,324, $34,712 for men and $22,736 for women, a difference of 34.5%.
| Sex | Number | Average Earnings |
| Male | 570 (55.7%) | $34,712 |
| Female | 454 (44.3%) | $22,736 |
| Total | 1,024 (100.0%) | $26,324 |
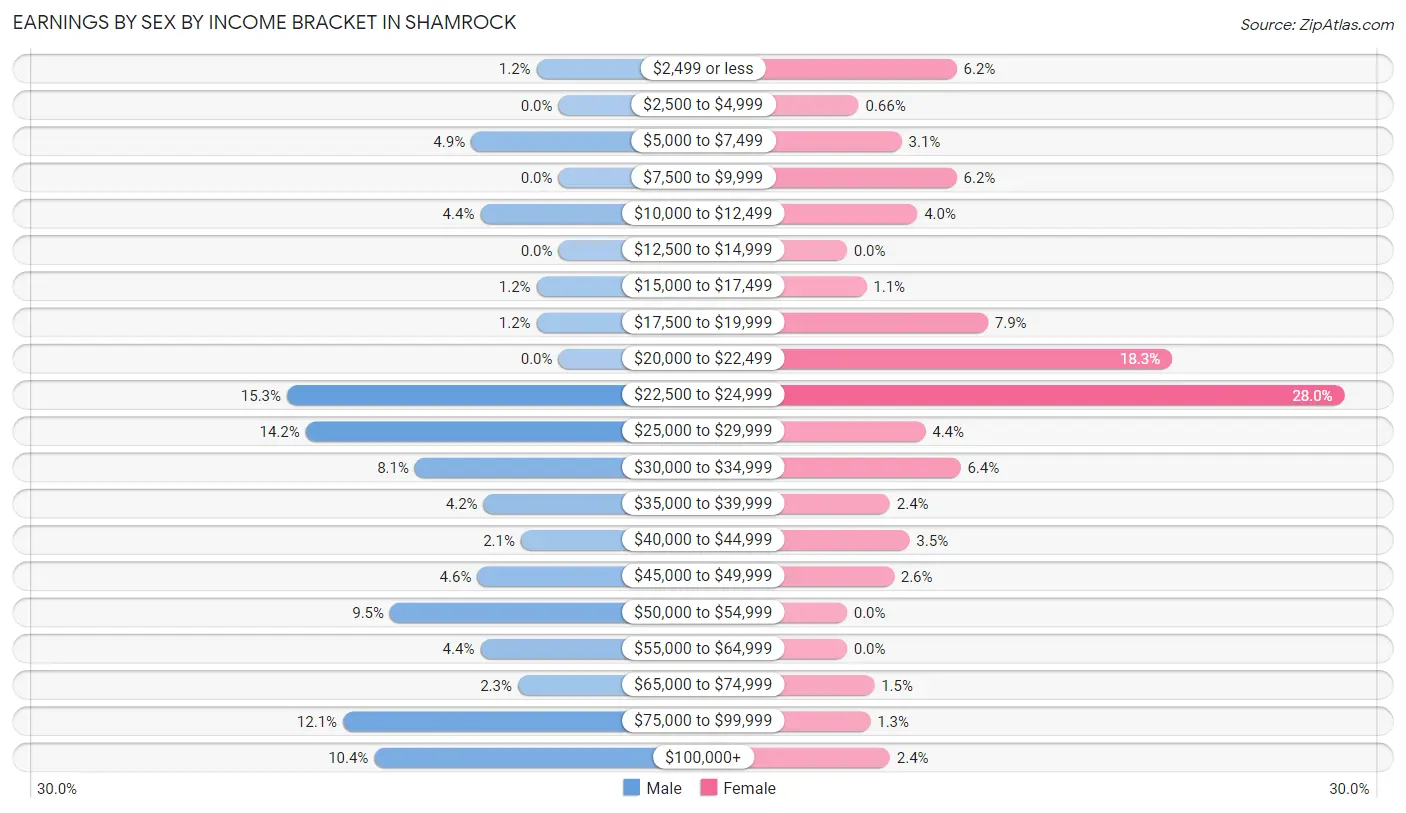
Earnings by Sex by Income Bracket in Shamrock
The most common earnings brackets in Shamrock are $22,500 to $24,999 for men (87 | 15.3%) and $22,500 to $24,999 for women (127 | 28.0%).
| Income | Male | Female |
| $2,499 or less | 7 (1.2%) | 28 (6.2%) |
| $2,500 to $4,999 | 0 (0.0%) | 3 (0.7%) |
| $5,000 to $7,499 | 28 (4.9%) | 14 (3.1%) |
| $7,500 to $9,999 | 0 (0.0%) | 28 (6.2%) |
| $10,000 to $12,499 | 25 (4.4%) | 18 (4.0%) |
| $12,500 to $14,999 | 0 (0.0%) | 0 (0.0%) |
| $15,000 to $17,499 | 7 (1.2%) | 5 (1.1%) |
| $17,500 to $19,999 | 7 (1.2%) | 36 (7.9%) |
| $20,000 to $22,499 | 0 (0.0%) | 83 (18.3%) |
| $22,500 to $24,999 | 87 (15.3%) | 127 (28.0%) |
| $25,000 to $29,999 | 81 (14.2%) | 20 (4.4%) |
| $30,000 to $34,999 | 46 (8.1%) | 29 (6.4%) |
| $35,000 to $39,999 | 24 (4.2%) | 11 (2.4%) |
| $40,000 to $44,999 | 12 (2.1%) | 16 (3.5%) |
| $45,000 to $49,999 | 26 (4.6%) | 12 (2.6%) |
| $50,000 to $54,999 | 54 (9.5%) | 0 (0.0%) |
| $55,000 to $64,999 | 25 (4.4%) | 0 (0.0%) |
| $65,000 to $74,999 | 13 (2.3%) | 7 (1.5%) |
| $75,000 to $99,999 | 69 (12.1%) | 6 (1.3%) |
| $100,000+ | 59 (10.3%) | 11 (2.4%) |
| Total | 570 (100.0%) | 454 (100.0%) |
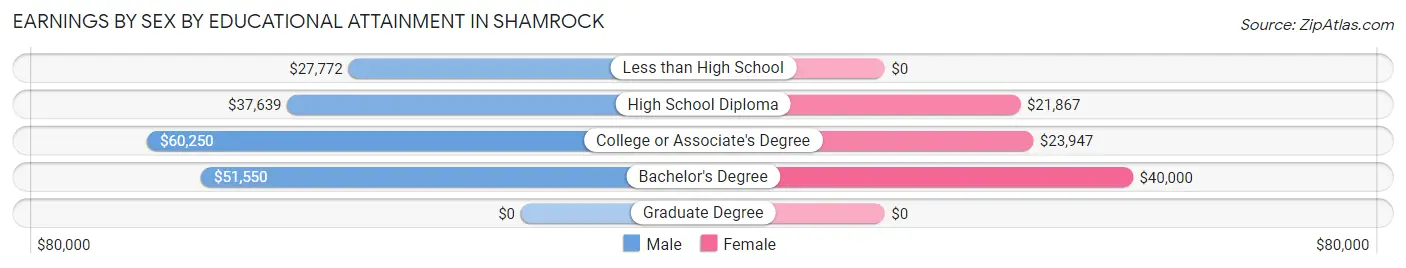
Earnings by Sex by Educational Attainment in Shamrock
Average earnings in Shamrock are $38,611 for men and $23,189 for women, a difference of 39.9%. Men with an educational attainment of college or associate's degree enjoy the highest average annual earnings of $60,250, while those with less than high school education earn the least with $27,772. Women with an educational attainment of bachelor's degree earn the most with the average annual earnings of $40,000, while those with high school diploma education have the smallest earnings of $21,867.
| Educational Attainment | Male Income | Female Income |
| Less than High School | $27,772 | $0 |
| High School Diploma | $37,639 | $21,867 |
| College or Associate's Degree | $60,250 | $23,947 |
| Bachelor's Degree | $51,550 | $40,000 |
| Graduate Degree | - | - |
| Total | $38,611 | $23,189 |
Family Income in Shamrock
Family Income Brackets in Shamrock
According to the Shamrock family income data, there are 136 families falling into the $50,000 to $74,999 income range, which is the most common income bracket and makes up 22.0% of all families. Conversely, the $10,000 to $14,999 income bracket is the least frequent group with only 8 families (1.3%) belonging to this category.
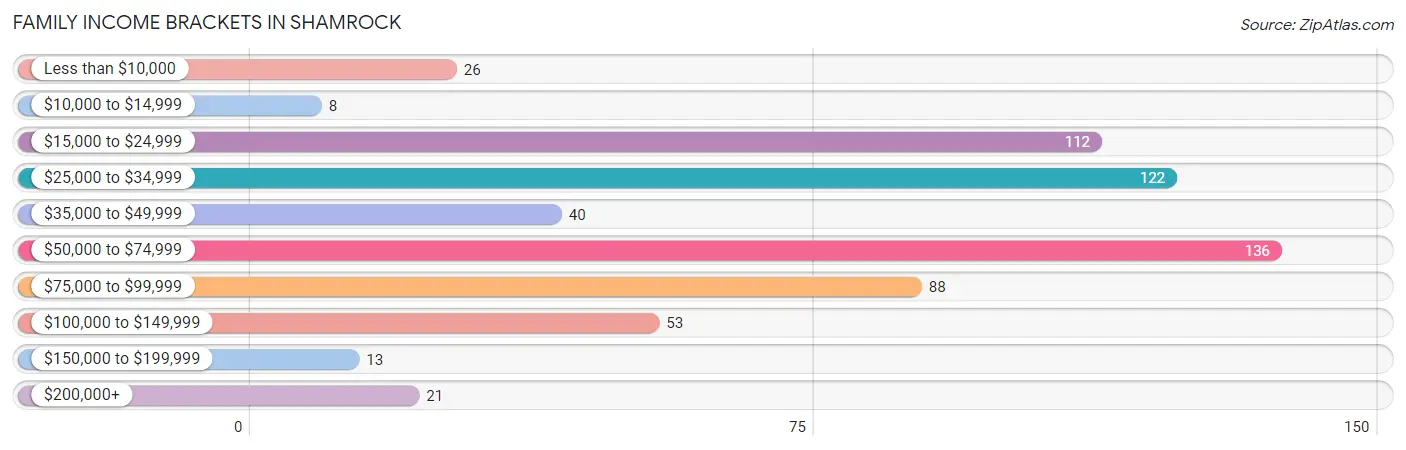
| Income Bracket | # Families | % Families |
| Less than $10,000 | 26 | 4.2% |
| $10,000 to $14,999 | 8 | 1.3% |
| $15,000 to $24,999 | 112 | 18.1% |
| $25,000 to $34,999 | 122 | 19.7% |
| $35,000 to $49,999 | 40 | 6.5% |
| $50,000 to $74,999 | 136 | 22.0% |
| $75,000 to $99,999 | 88 | 14.2% |
| $100,000 to $149,999 | 53 | 8.6% |
| $150,000 to $199,999 | 13 | 2.1% |
| $200,000+ | 21 | 3.4% |
Family Income by Famaliy Size in Shamrock
5-person families (68 | 11.0%) account for the highest median family income in Shamrock with $89,828 per family, while 2-person families (195 | 31.5%) have the highest median income of $33,149 per family member.
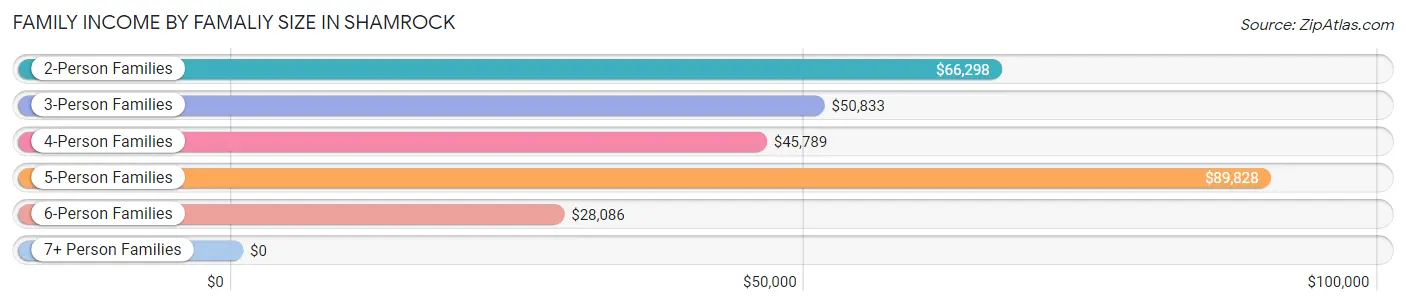
| Income Bracket | # Families | Median Income |
| 2-Person Families | 195 (31.5%) | $66,298 |
| 3-Person Families | 176 (28.4%) | $50,833 |
| 4-Person Families | 74 (11.9%) | $45,789 |
| 5-Person Families | 68 (11.0%) | $89,828 |
| 6-Person Families | 106 (17.1%) | $28,086 |
| 7+ Person Families | 0 (0.0%) | $0 |
| Total | 619 (100.0%) | $50,208 |
Family Income by Number of Earners in Shamrock
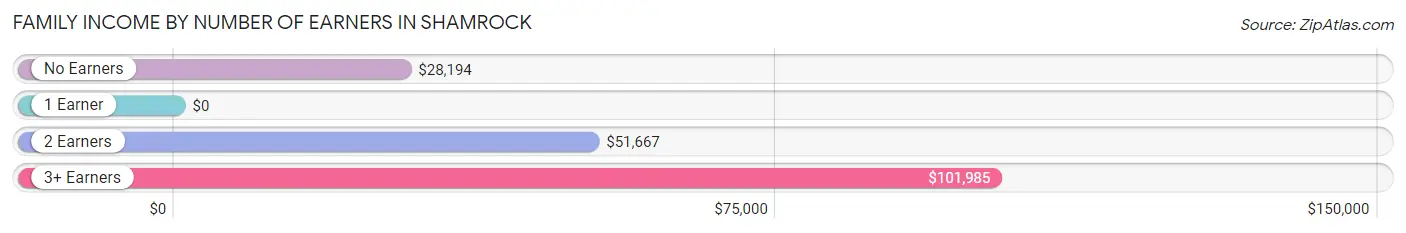
| Number of Earners | # Families | Median Income |
| No Earners | 65 (10.5%) | $28,194 |
| 1 Earner | 257 (41.5%) | $0 |
| 2 Earners | 264 (42.6%) | $51,667 |
| 3+ Earners | 33 (5.3%) | $101,985 |
| Total | 619 (100.0%) | $50,208 |
Household Income in Shamrock
Household Income Brackets in Shamrock
With 188 households falling in the category, the $50,000 to $74,999 income range is the most frequent in Shamrock, accounting for 22.1% of all households. In contrast, only 18 households (2.1%) fall into the $150,000 to $199,999 income bracket, making it the least populous group.
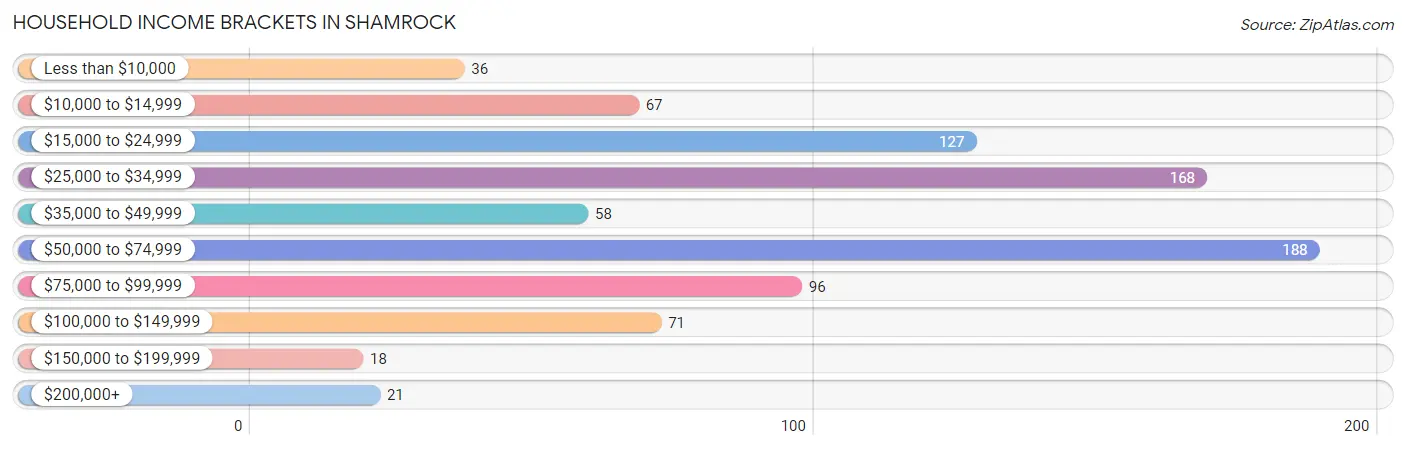
| Income Bracket | # Households | % Households |
| Less than $10,000 | 36 | 4.2% |
| $10,000 to $14,999 | 67 | 7.9% |
| $15,000 to $24,999 | 127 | 14.9% |
| $25,000 to $34,999 | 168 | 19.8% |
| $35,000 to $49,999 | 58 | 6.8% |
| $50,000 to $74,999 | 188 | 22.1% |
| $75,000 to $99,999 | 96 | 11.3% |
| $100,000 to $149,999 | 71 | 8.4% |
| $150,000 to $199,999 | 18 | 2.1% |
| $200,000+ | 21 | 2.5% |
Household Income by Householder Age in Shamrock
The median household income in Shamrock is $39,333, with the highest median household income of $65,389 found in the 45 to 64 years age bracket for the primary householder. A total of 270 households (31.8%) fall into this category. Meanwhile, the 15 to 24 years age bracket for the primary householder has the lowest median household income of $0, with 24 households (2.8%) in this group.
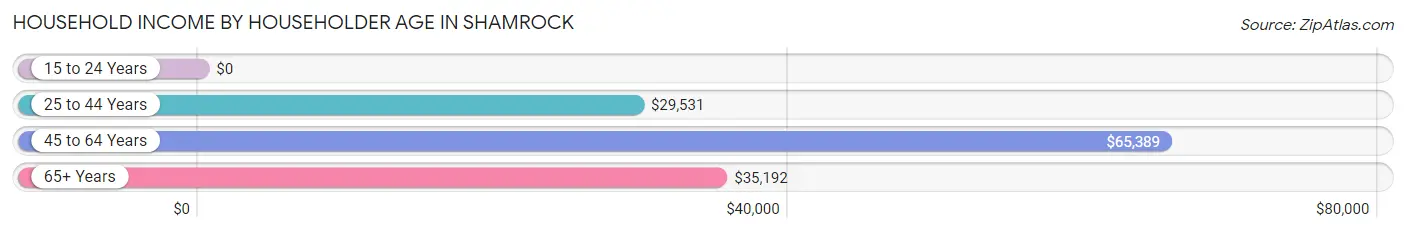
| Income Bracket | # Households | Median Income |
| 15 to 24 Years | 24 (2.8%) | $0 |
| 25 to 44 Years | 362 (42.6%) | $29,531 |
| 45 to 64 Years | 270 (31.8%) | $65,389 |
| 65+ Years | 194 (22.8%) | $35,192 |
| Total | 850 (100.0%) | $39,333 |
Poverty in Shamrock
Income Below Poverty by Sex and Age in Shamrock
With 20.4% poverty level for males and 33.9% for females among the residents of Shamrock, 18 to 24 year old males and 5 year old females are the most vulnerable to poverty, with 19 males (52.8%) and 34 females (87.2%) in their respective age groups living below the poverty level.
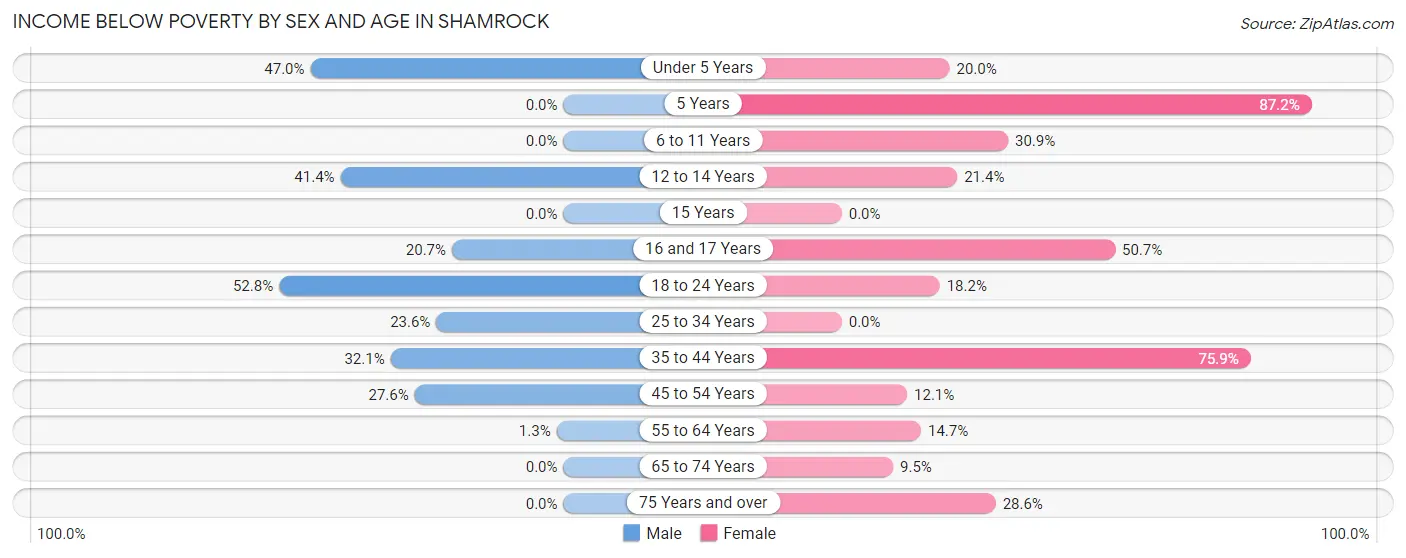
| Age Bracket | Male | Female |
| Under 5 Years | 54 (47.0%) | 7 (20.0%) |
| 5 Years | 0 (0.0%) | 34 (87.2%) |
| 6 to 11 Years | 0 (0.0%) | 25 (30.9%) |
| 12 to 14 Years | 12 (41.4%) | 3 (21.4%) |
| 15 Years | 0 (0.0%) | 0 (0.0%) |
| 16 and 17 Years | 6 (20.7%) | 35 (50.7%) |
| 18 to 24 Years | 19 (52.8%) | 12 (18.2%) |
| 25 to 34 Years | 38 (23.6%) | 0 (0.0%) |
| 35 to 44 Years | 43 (32.1%) | 176 (75.9%) |
| 45 to 54 Years | 29 (27.6%) | 8 (12.1%) |
| 55 to 64 Years | 2 (1.3%) | 15 (14.7%) |
| 65 to 74 Years | 0 (0.0%) | 12 (9.5%) |
| 75 Years and over | 0 (0.0%) | 14 (28.6%) |
| Total | 203 (20.4%) | 341 (33.9%) |
Income Above Poverty by Sex and Age in Shamrock
According to the poverty statistics in Shamrock, males aged 5 years and females aged 25 to 34 years are the age groups that are most secure financially, with 100.0% of males and 100.0% of females in these age groups living above the poverty line.
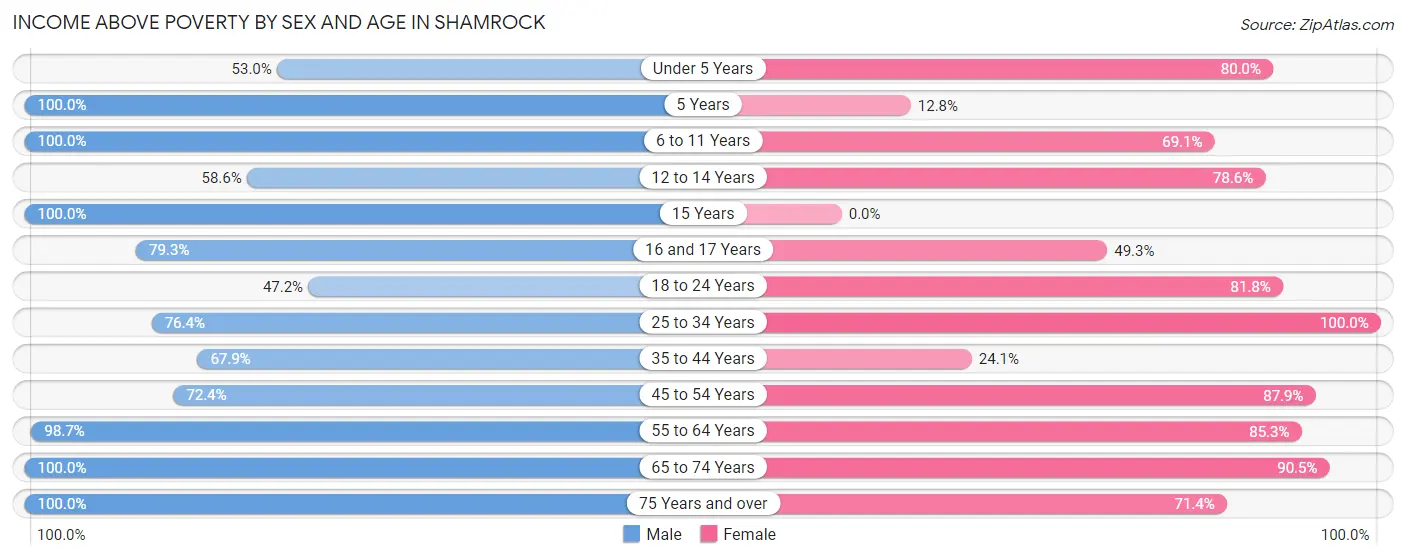
| Age Bracket | Male | Female |
| Under 5 Years | 61 (53.0%) | 28 (80.0%) |
| 5 Years | 10 (100.0%) | 5 (12.8%) |
| 6 to 11 Years | 68 (100.0%) | 56 (69.1%) |
| 12 to 14 Years | 17 (58.6%) | 11 (78.6%) |
| 15 Years | 6 (100.0%) | 0 (0.0%) |
| 16 and 17 Years | 23 (79.3%) | 34 (49.3%) |
| 18 to 24 Years | 17 (47.2%) | 54 (81.8%) |
| 25 to 34 Years | 123 (76.4%) | 127 (100.0%) |
| 35 to 44 Years | 91 (67.9%) | 56 (24.1%) |
| 45 to 54 Years | 76 (72.4%) | 58 (87.9%) |
| 55 to 64 Years | 155 (98.7%) | 87 (85.3%) |
| 65 to 74 Years | 116 (100.0%) | 114 (90.5%) |
| 75 Years and over | 27 (100.0%) | 35 (71.4%) |
| Total | 790 (79.6%) | 665 (66.1%) |
Income Below Poverty Among Married-Couple Families in Shamrock
The poverty statistics for married-couple families in Shamrock show that 15.4% or 64 of the total 415 families live below the poverty line. Families with 3 or 4 children have the highest poverty rate of 50.6%, comprising of 45 families. On the other hand, families with no children have the lowest poverty rate of 0.0%, which includes 0 families.
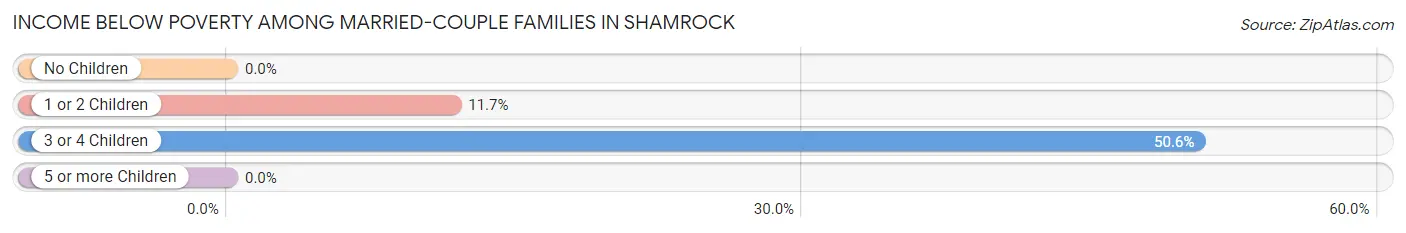
| Children | Above Poverty | Below Poverty |
| No Children | 163 (100.0%) | 0 (0.0%) |
| 1 or 2 Children | 144 (88.3%) | 19 (11.7%) |
| 3 or 4 Children | 44 (49.4%) | 45 (50.6%) |
| 5 or more Children | 0 (0.0%) | 0 (0.0%) |
| Total | 351 (84.6%) | 64 (15.4%) |
Income Below Poverty Among Single-Parent Households in Shamrock
According to the poverty data in Shamrock, 23.1% or 15 single-father households and 85.6% or 119 single-mother households are living below the poverty line. Among single-father households, those with 1 or 2 children have the highest poverty rate, with 15 households (38.5%) experiencing poverty. Likewise, among single-mother households, those with 5 or more children have the highest poverty rate, with 64 households (100.0%) falling below the poverty line.
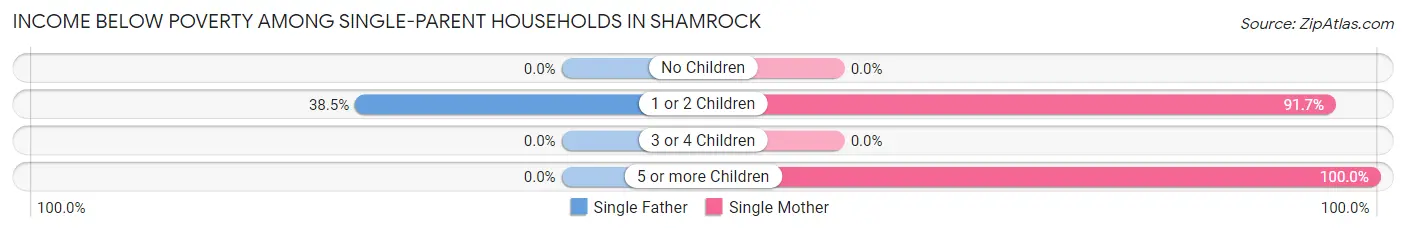
| Children | Single Father | Single Mother |
| No Children | 0 (0.0%) | 0 (0.0%) |
| 1 or 2 Children | 15 (38.5%) | 55 (91.7%) |
| 3 or 4 Children | 0 (0.0%) | 0 (0.0%) |
| 5 or more Children | 0 (0.0%) | 64 (100.0%) |
| Total | 15 (23.1%) | 119 (85.6%) |
Income Below Poverty Among Married-Couple vs Single-Parent Households in Shamrock
The poverty data for Shamrock shows that 64 of the married-couple family households (15.4%) and 134 of the single-parent households (65.7%) are living below the poverty level. Within the married-couple family households, those with 3 or 4 children have the highest poverty rate, with 45 households (50.6%) falling below the poverty line. Among the single-parent households, those with 5 or more children have the highest poverty rate, with 64 household (100.0%) living below poverty.
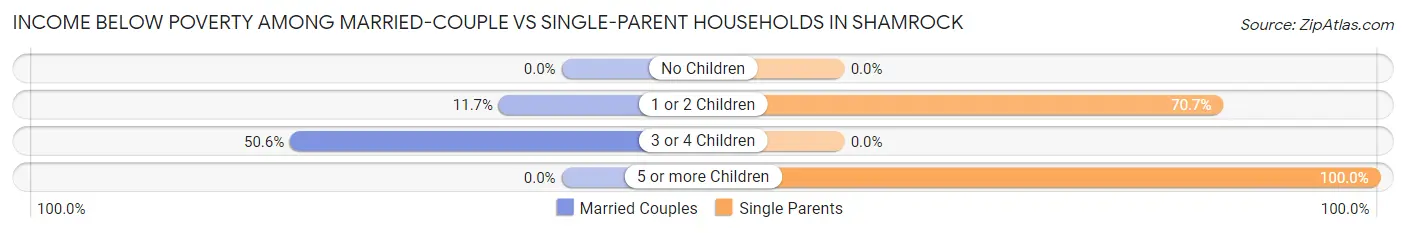
| Children | Married-Couple Families | Single-Parent Households |
| No Children | 0 (0.0%) | 0 (0.0%) |
| 1 or 2 Children | 19 (11.7%) | 70 (70.7%) |
| 3 or 4 Children | 45 (50.6%) | 0 (0.0%) |
| 5 or more Children | 0 (0.0%) | 64 (100.0%) |
| Total | 64 (15.4%) | 134 (65.7%) |
Race in Shamrock
The most populous races in Shamrock are White / Caucasian (1,599 | 79.9%), Hispanic or Latino (652 | 32.6%), and Two or more Races (233 | 11.7%).
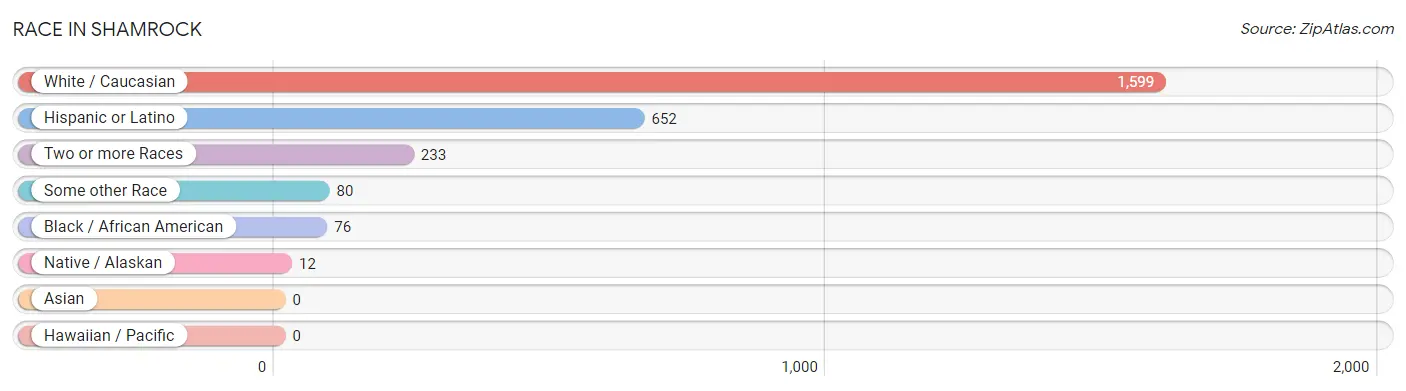
| Race | # Population | % Population |
| Asian | 0 | 0.0% |
| Black / African American | 76 | 3.8% |
| Hawaiian / Pacific | 0 | 0.0% |
| Hispanic or Latino | 652 | 32.6% |
| Native / Alaskan | 12 | 0.6% |
| White / Caucasian | 1,599 | 79.9% |
| Two or more Races | 233 | 11.7% |
| Some other Race | 80 | 4.0% |
| Total | 2,000 | 100.0% |
Ancestry in Shamrock
The most populous ancestries reported in Shamrock are Mexican (581 | 29.0%), Irish (283 | 14.1%), German (202 | 10.1%), English (165 | 8.3%), and Navajo (67 | 3.4%), together accounting for 64.9% of all Shamrock residents.
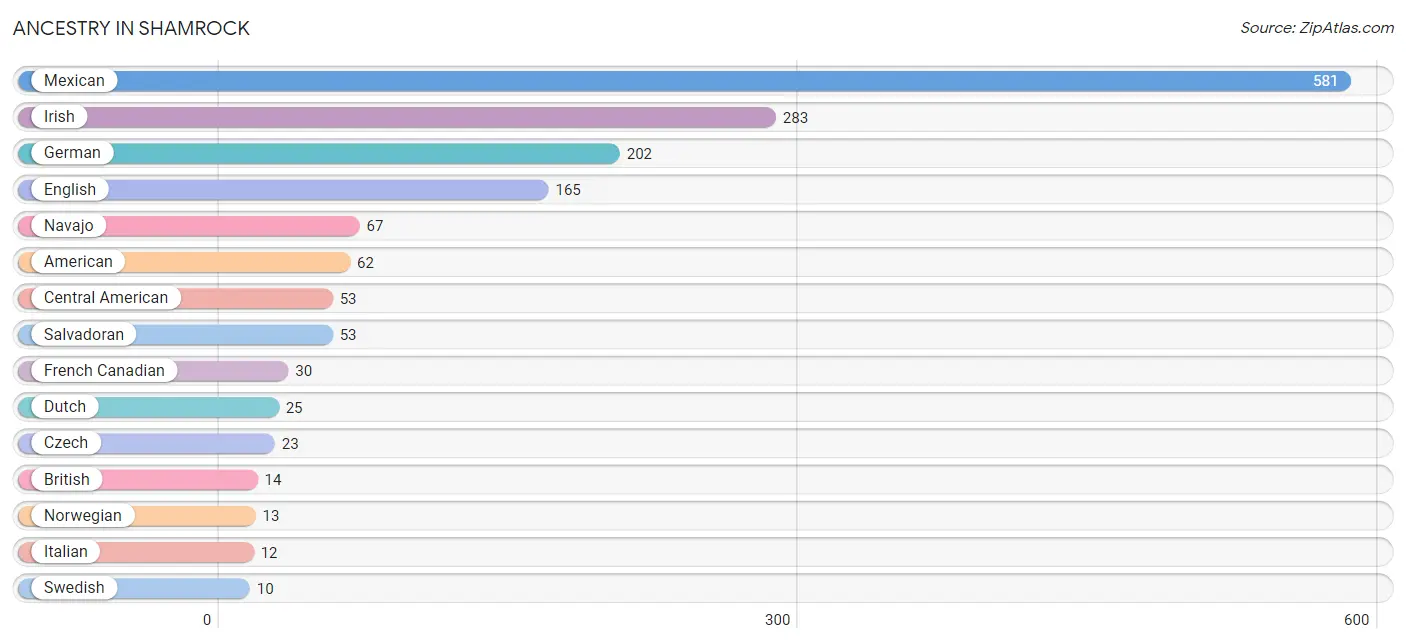
| Ancestry | # Population | % Population |
| American | 62 | 3.1% |
| Apache | 4 | 0.2% |
| British | 14 | 0.7% |
| Central American | 53 | 2.6% |
| Cherokee | 5 | 0.3% |
| Czech | 23 | 1.1% |
| Dutch | 25 | 1.3% |
| Eastern European | 5 | 0.3% |
| English | 165 | 8.3% |
| European | 4 | 0.2% |
| French | 3 | 0.2% |
| French Canadian | 30 | 1.5% |
| German | 202 | 10.1% |
| Indian (Asian) | 9 | 0.4% |
| Irish | 283 | 14.1% |
| Italian | 12 | 0.6% |
| Mexican | 581 | 29.0% |
| Navajo | 67 | 3.4% |
| Northern European | 5 | 0.3% |
| Norwegian | 13 | 0.6% |
| Salvadoran | 53 | 2.6% |
| Scandinavian | 6 | 0.3% |
| Swedish | 10 | 0.5% |
| Welsh | 6 | 0.3% | View All 24 Rows |
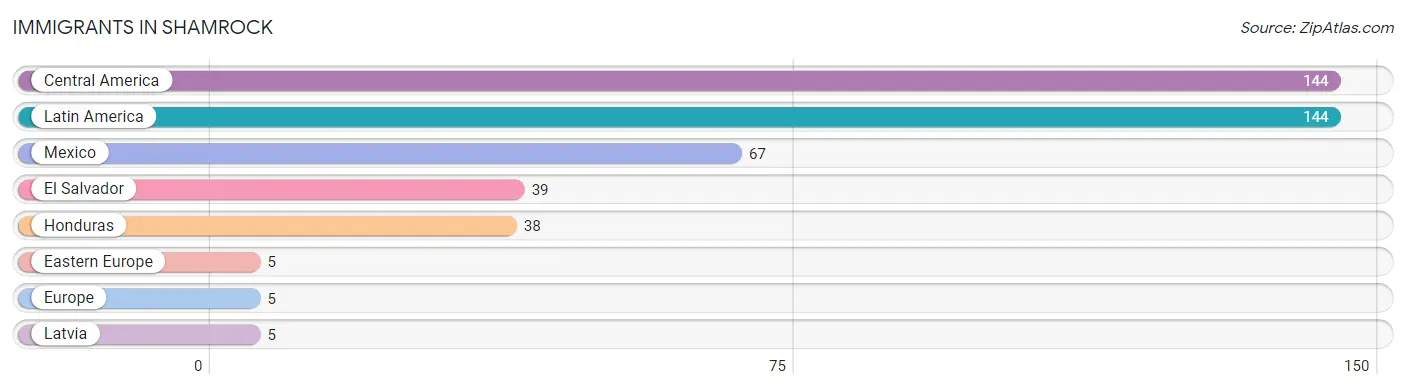
Immigrants in Shamrock
The most numerous immigrant groups reported in Shamrock came from Central America (144 | 7.2%), Latin America (144 | 7.2%), Mexico (67 | 3.4%), El Salvador (39 | 1.9%), and Honduras (38 | 1.9%), together accounting for 21.6% of all Shamrock residents.
| Immigration Origin | # Population | % Population |
| Central America | 144 | 7.2% |
| Eastern Europe | 5 | 0.3% |
| El Salvador | 39 | 1.9% |
| Europe | 5 | 0.3% |
| Honduras | 38 | 1.9% |
| Latin America | 144 | 7.2% |
| Latvia | 5 | 0.3% |
| Mexico | 67 | 3.4% | View All 8 Rows |
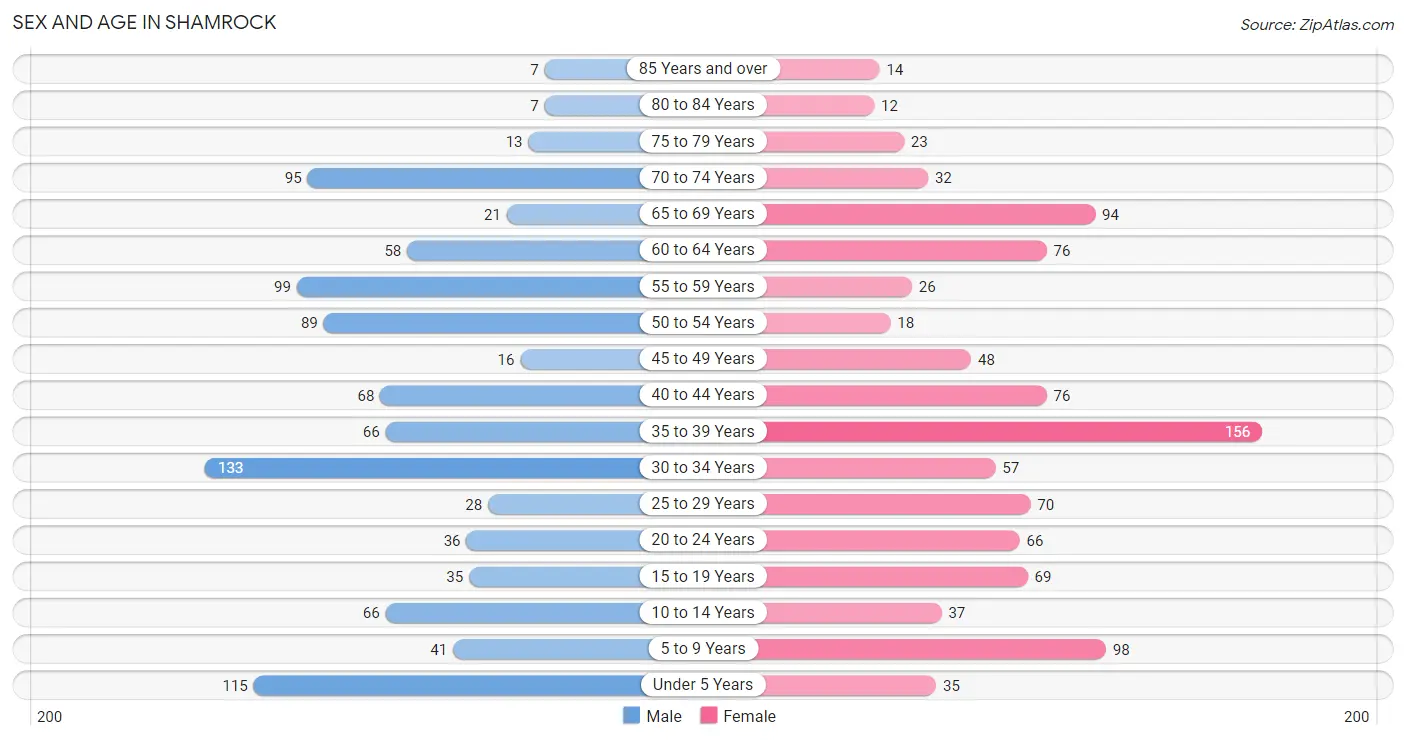
Sex and Age in Shamrock
Sex and Age in Shamrock
The most populous age groups in Shamrock are 30 to 34 Years (133 | 13.4%) for men and 35 to 39 Years (156 | 15.5%) for women.
| Age Bracket | Male | Female |
| Under 5 Years | 115 (11.6%) | 35 (3.5%) |
| 5 to 9 Years | 41 (4.1%) | 98 (9.7%) |
| 10 to 14 Years | 66 (6.7%) | 37 (3.7%) |
| 15 to 19 Years | 35 (3.5%) | 69 (6.9%) |
| 20 to 24 Years | 36 (3.6%) | 66 (6.6%) |
| 25 to 29 Years | 28 (2.8%) | 70 (7.0%) |
| 30 to 34 Years | 133 (13.4%) | 57 (5.7%) |
| 35 to 39 Years | 66 (6.7%) | 156 (15.5%) |
| 40 to 44 Years | 68 (6.9%) | 76 (7.5%) |
| 45 to 49 Years | 16 (1.6%) | 48 (4.8%) |
| 50 to 54 Years | 89 (9.0%) | 18 (1.8%) |
| 55 to 59 Years | 99 (10.0%) | 26 (2.6%) |
| 60 to 64 Years | 58 (5.8%) | 76 (7.5%) |
| 65 to 69 Years | 21 (2.1%) | 94 (9.3%) |
| 70 to 74 Years | 95 (9.6%) | 32 (3.2%) |
| 75 to 79 Years | 13 (1.3%) | 23 (2.3%) |
| 80 to 84 Years | 7 (0.7%) | 12 (1.2%) |
| 85 Years and over | 7 (0.7%) | 14 (1.4%) |
| Total | 993 (100.0%) | 1,007 (100.0%) |
Families and Households in Shamrock
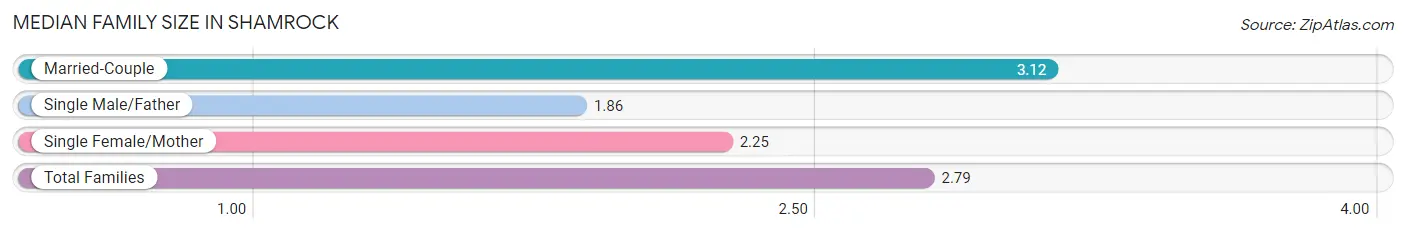
Median Family Size in Shamrock
The median family size in Shamrock is 2.79 persons per family, with married-couple families (415 | 67.0%) accounting for the largest median family size of 3.12 persons per family. On the other hand, single male/father families (65 | 10.5%) represent the smallest median family size with 1.86 persons per family.
| Family Type | # Families | Family Size |
| Married-Couple | 415 (67.0%) | 3.12 |
| Single Male/Father | 65 (10.5%) | 1.86 |
| Single Female/Mother | 139 (22.5%) | 2.25 |
| Total Families | 619 (100.0%) | 2.79 |
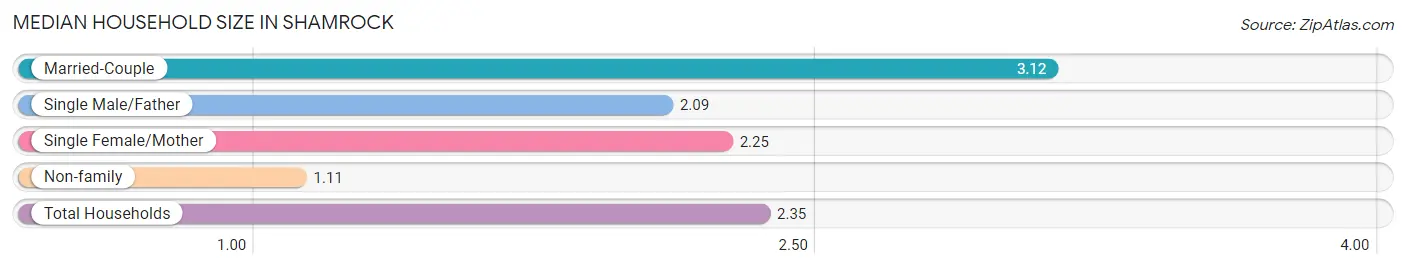
Median Household Size in Shamrock
The median household size in Shamrock is 2.35 persons per household, with married-couple households (415 | 48.8%) accounting for the largest median household size of 3.12 persons per household. non-family households (231 | 27.2%) represent the smallest median household size with 1.11 persons per household.
| Household Type | # Households | Household Size |
| Married-Couple | 415 (48.8%) | 3.12 |
| Single Male/Father | 65 (7.6%) | 2.09 |
| Single Female/Mother | 139 (16.4%) | 2.25 |
| Non-family | 231 (27.2%) | 1.11 |
| Total Households | 850 (100.0%) | 2.35 |
Household Size by Marriage Status in Shamrock
Out of a total of 850 households in Shamrock, 619 (72.8%) are family households, while 231 (27.2%) are nonfamily households. The most numerous type of family households are 2-person households, comprising 183, and the most common type of nonfamily households are 1-person households, comprising 226.
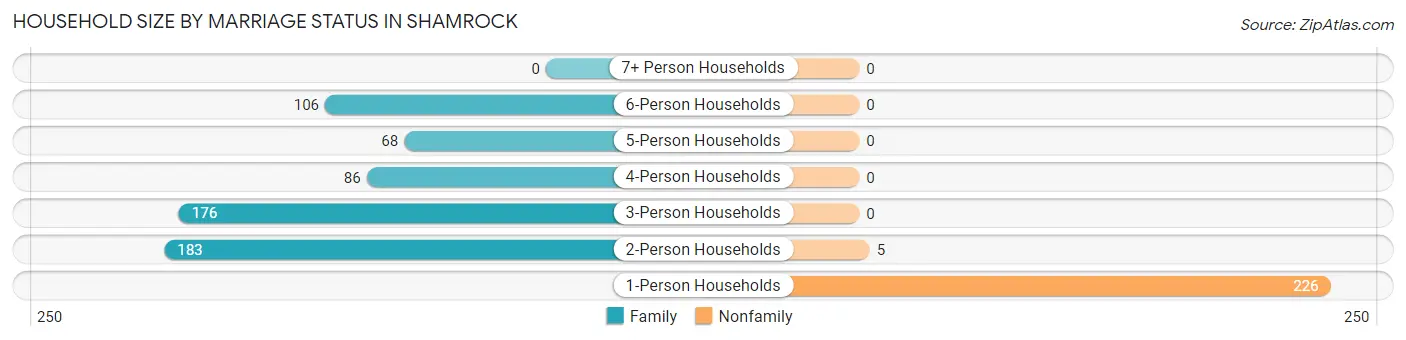
| Household Size | Family Households | Nonfamily Households |
| 1-Person Households | - | 226 (26.6%) |
| 2-Person Households | 183 (21.5%) | 5 (0.6%) |
| 3-Person Households | 176 (20.7%) | 0 (0.0%) |
| 4-Person Households | 86 (10.1%) | 0 (0.0%) |
| 5-Person Households | 68 (8.0%) | 0 (0.0%) |
| 6-Person Households | 106 (12.5%) | 0 (0.0%) |
| 7+ Person Households | 0 (0.0%) | 0 (0.0%) |
| Total | 619 (72.8%) | 231 (27.2%) |
Female Fertility in Shamrock
Fertility by Age in Shamrock
Average fertility rate in Shamrock is 44.0 births per 1,000 women. Women in the age bracket of 20 to 34 years have the highest fertility rate with 124.0 births per 1,000 women. Women in the age bracket of 20 to 34 years acount for 100.0% of all women with births.
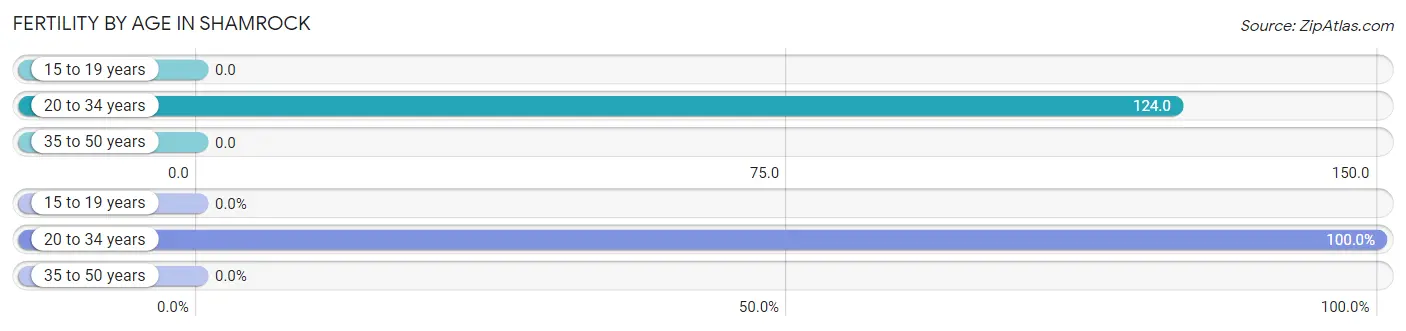
| Age Bracket | Women with Births | Births / 1,000 Women |
| 15 to 19 years | 0 (0.0%) | 0.0 |
| 20 to 34 years | 24 (100.0%) | 124.0 |
| 35 to 50 years | 0 (0.0%) | 0.0 |
| Total | 24 (100.0%) | 44.0 |
Fertility by Age by Marriage Status in Shamrock
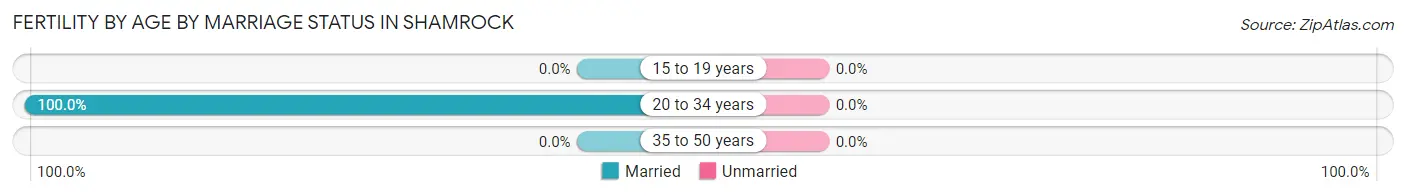
| Age Bracket | Married | Unmarried |
| 15 to 19 years | 0 (0.0%) | 0 (0.0%) |
| 20 to 34 years | 24 (100.0%) | 0 (0.0%) |
| 35 to 50 years | 0 (0.0%) | 0 (0.0%) |
| Total | 24 (100.0%) | 0 (0.0%) |
Fertility by Education in Shamrock
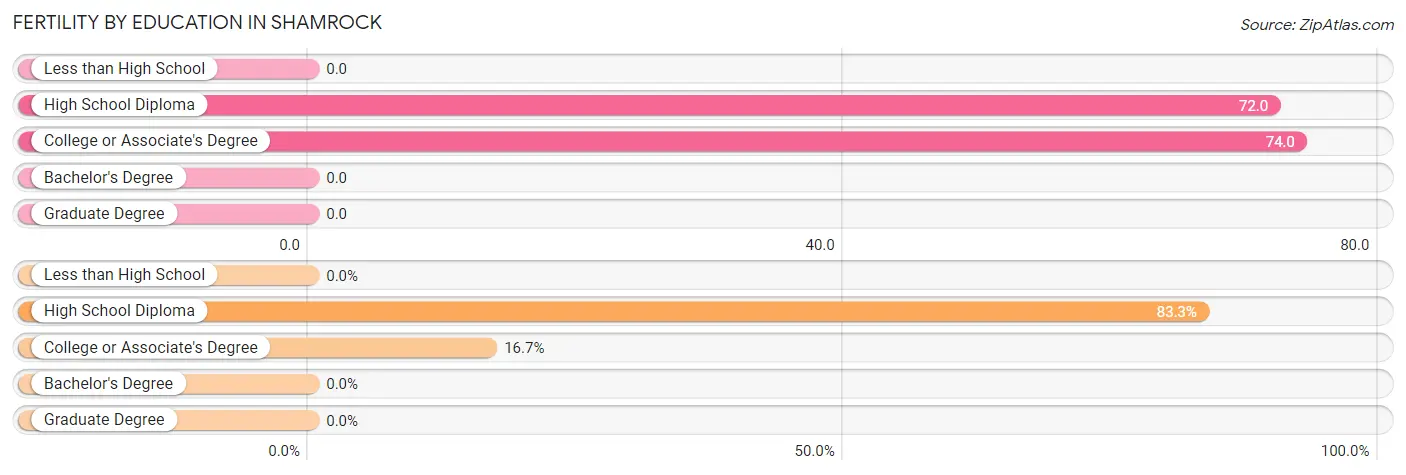
| Educational Attainment | Women with Births | Births / 1,000 Women |
| Less than High School | 0 (0.0%) | 0.0 |
| High School Diploma | 20 (83.3%) | 72.0 |
| College or Associate's Degree | 4 (16.7%) | 74.0 |
| Bachelor's Degree | 0 (0.0%) | 0.0 |
| Graduate Degree | 0 (0.0%) | 0.0 |
| Total | 24 (100.0%) | 44.0 |
Fertility by Education by Marriage Status in Shamrock
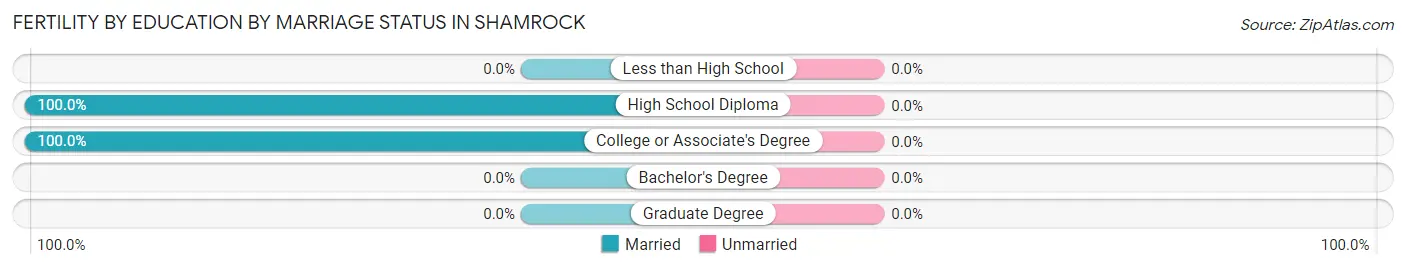
| Educational Attainment | Married | Unmarried |
| Less than High School | 0 (0.0%) | 0 (0.0%) |
| High School Diploma | 20 (100.0%) | 0 (0.0%) |
| College or Associate's Degree | 4 (100.0%) | 0 (0.0%) |
| Bachelor's Degree | 0 (0.0%) | 0 (0.0%) |
| Graduate Degree | 0 (0.0%) | 0 (0.0%) |
| Total | 24 (100.0%) | 0 (0.0%) |
Employment Characteristics in Shamrock
Employment by Class of Employer in Shamrock
Among the 954 employed individuals in Shamrock, private company employees (594 | 62.3%), self-employed (not incorporated) (141 | 14.8%), and local government employees (82 | 8.6%) make up the most common classes of employment.
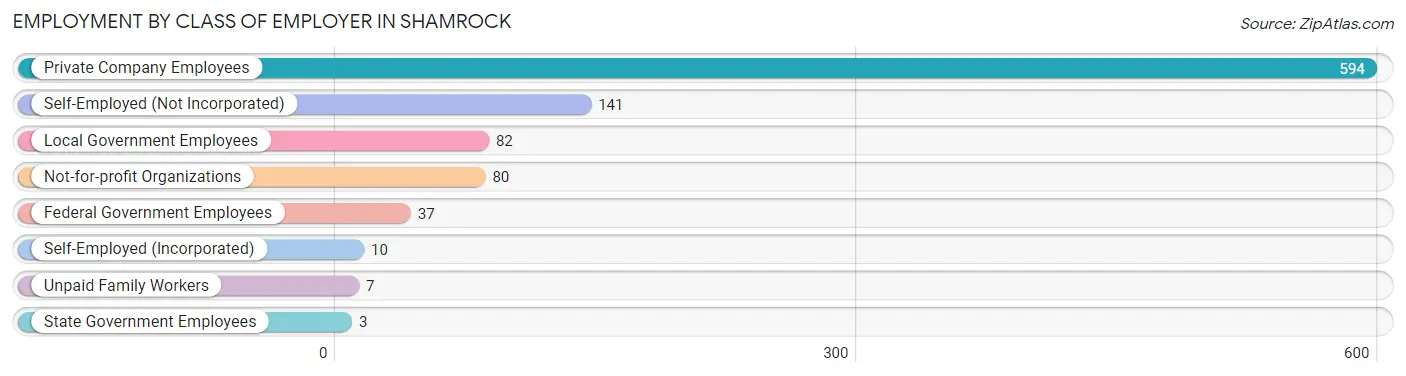
| Employer Class | # Employees | % Employees |
| Private Company Employees | 594 | 62.3% |
| Self-Employed (Incorporated) | 10 | 1.1% |
| Self-Employed (Not Incorporated) | 141 | 14.8% |
| Not-for-profit Organizations | 80 | 8.4% |
| Local Government Employees | 82 | 8.6% |
| State Government Employees | 3 | 0.3% |
| Federal Government Employees | 37 | 3.9% |
| Unpaid Family Workers | 7 | 0.7% |
| Total | 954 | 100.0% |
Employment Status by Age in Shamrock
According to the labor force statistics for Shamrock, out of the total population over 16 years of age (1,602), 64.4% or 1,032 individuals are in the labor force, with 7.4% or 76 of them unemployed. The age group with the highest labor force participation rate is 30 to 34 years, with 95.8% or 182 individuals in the labor force. Within the labor force, the 60 to 64 years age range has the highest percentage of unemployed individuals, with 27.6% or 21 of them being unemployed.
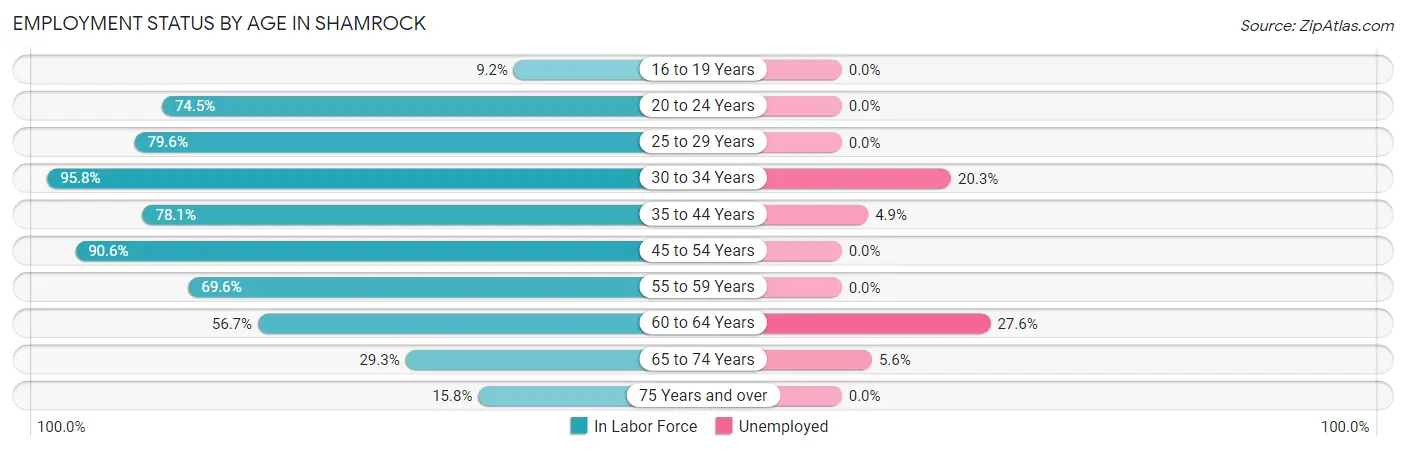
| Age Bracket | In Labor Force | Unemployed |
| 16 to 19 Years | 9 (9.2%) | 0 (0.0%) |
| 20 to 24 Years | 76 (74.5%) | 0 (0.0%) |
| 25 to 29 Years | 78 (79.6%) | 0 (0.0%) |
| 30 to 34 Years | 182 (95.8%) | 37 (20.3%) |
| 35 to 44 Years | 286 (78.1%) | 14 (4.9%) |
| 45 to 54 Years | 155 (90.6%) | 0 (0.0%) |
| 55 to 59 Years | 87 (69.6%) | 0 (0.0%) |
| 60 to 64 Years | 76 (56.7%) | 21 (27.6%) |
| 65 to 74 Years | 71 (29.3%) | 4 (5.6%) |
| 75 Years and over | 12 (15.8%) | 0 (0.0%) |
| Total | 1,032 (64.4%) | 76 (7.4%) |
Employment Status by Educational Attainment in Shamrock
According to labor force statistics for Shamrock, 79.7% of individuals (864) out of the total population between 25 and 64 years of age (1,084) are in the labor force, with 8.3% or 72 of them being unemployed. The group with the highest labor force participation rate are those with the educational attainment of bachelor's degree or higher, with 85.0% or 85 individuals in the labor force. Within the labor force, individuals with high school diploma education have the highest percentage of unemployment, with 17.4% or 72 of them being unemployed.
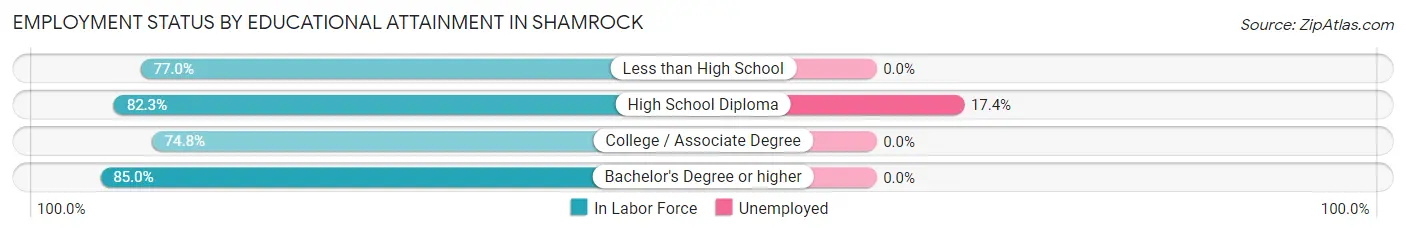
| Educational Attainment | In Labor Force | Unemployed |
| Less than High School | 187 (77.0%) | 0 (0.0%) |
| High School Diploma | 414 (82.3%) | 88 (17.4%) |
| College / Associate Degree | 178 (74.8%) | 0 (0.0%) |
| Bachelor's Degree or higher | 85 (85.0%) | 0 (0.0%) |
| Total | 864 (79.7%) | 90 (8.3%) |
Employment Occupations by Sex in Shamrock
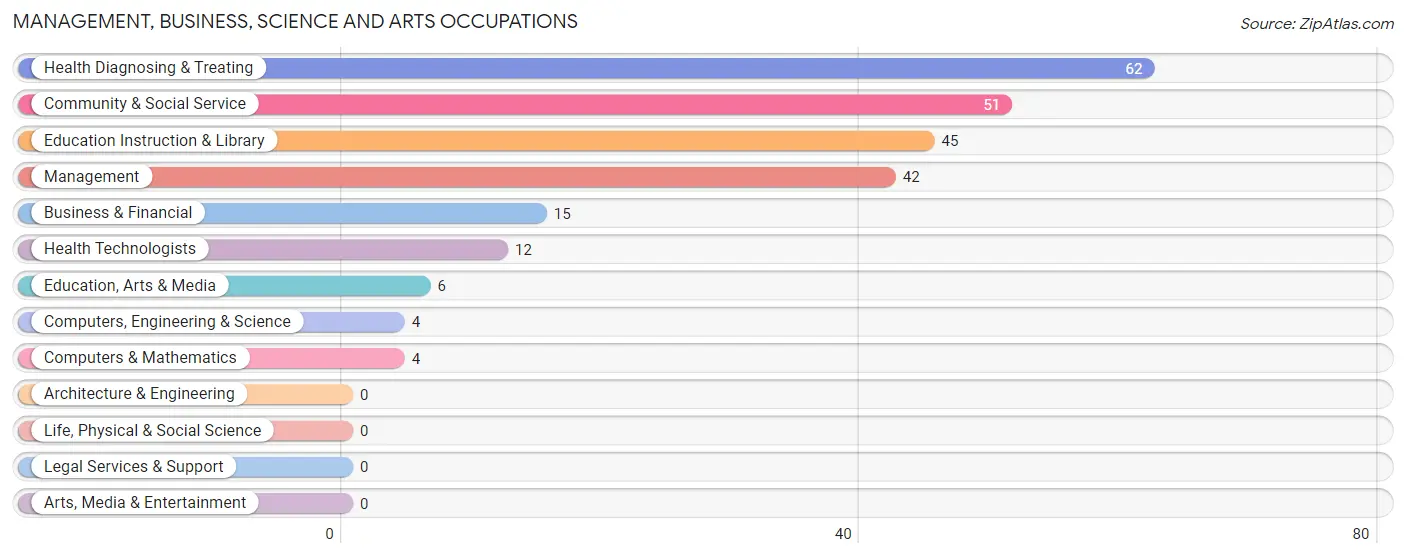
Management, Business, Science and Arts Occupations
The most common Management, Business, Science and Arts occupations in Shamrock are Health Diagnosing & Treating (62 | 6.5%), Community & Social Service (51 | 5.3%), Education Instruction & Library (45 | 4.7%), Management (42 | 4.4%), and Business & Financial (15 | 1.6%).
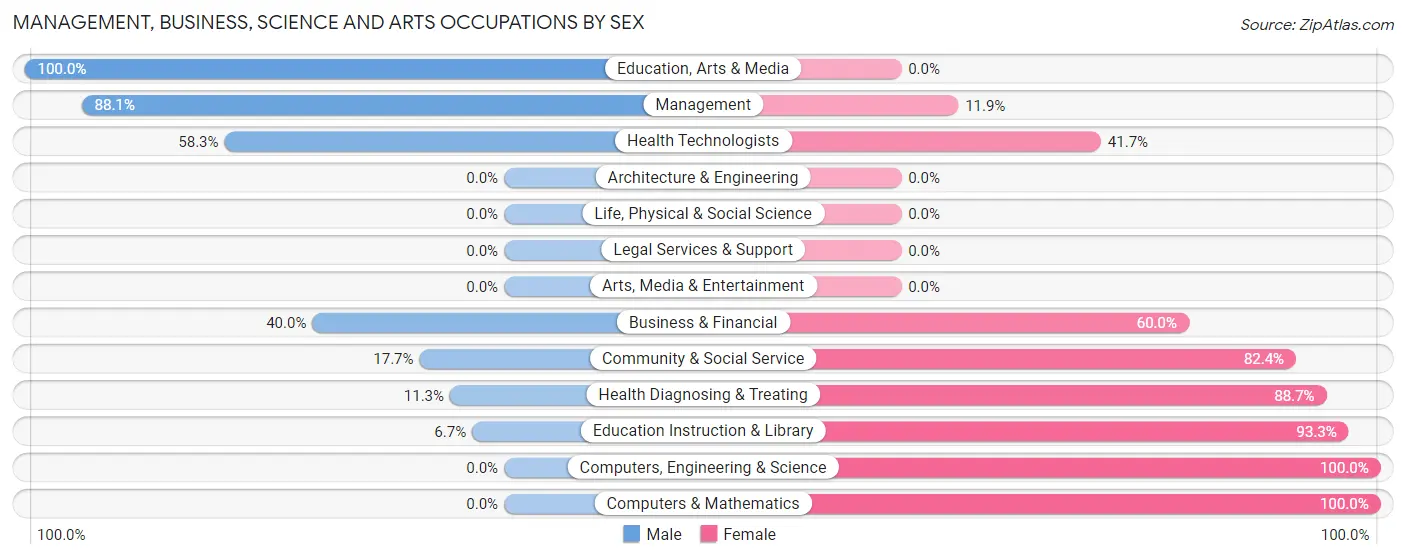
Management, Business, Science and Arts Occupations by Sex
Within the Management, Business, Science and Arts occupations in Shamrock, the most male-oriented occupations are Education, Arts & Media (100.0%), Management (88.1%), and Health Technologists (58.3%), while the most female-oriented occupations are Computers, Engineering & Science (100.0%), Computers & Mathematics (100.0%), and Education Instruction & Library (93.3%).
| Occupation | Male | Female |
| Management | 37 (88.1%) | 5 (11.9%) |
| Business & Financial | 6 (40.0%) | 9 (60.0%) |
| Computers, Engineering & Science | 0 (0.0%) | 4 (100.0%) |
| Computers & Mathematics | 0 (0.0%) | 4 (100.0%) |
| Architecture & Engineering | 0 (0.0%) | 0 (0.0%) |
| Life, Physical & Social Science | 0 (0.0%) | 0 (0.0%) |
| Community & Social Service | 9 (17.6%) | 42 (82.4%) |
| Education, Arts & Media | 6 (100.0%) | 0 (0.0%) |
| Legal Services & Support | 0 (0.0%) | 0 (0.0%) |
| Education Instruction & Library | 3 (6.7%) | 42 (93.3%) |
| Arts, Media & Entertainment | 0 (0.0%) | 0 (0.0%) |
| Health Diagnosing & Treating | 7 (11.3%) | 55 (88.7%) |
| Health Technologists | 7 (58.3%) | 5 (41.7%) |
| Total (Category) | 59 (33.9%) | 115 (66.1%) |
| Total (Overall) | 520 (54.4%) | 436 (45.6%) |
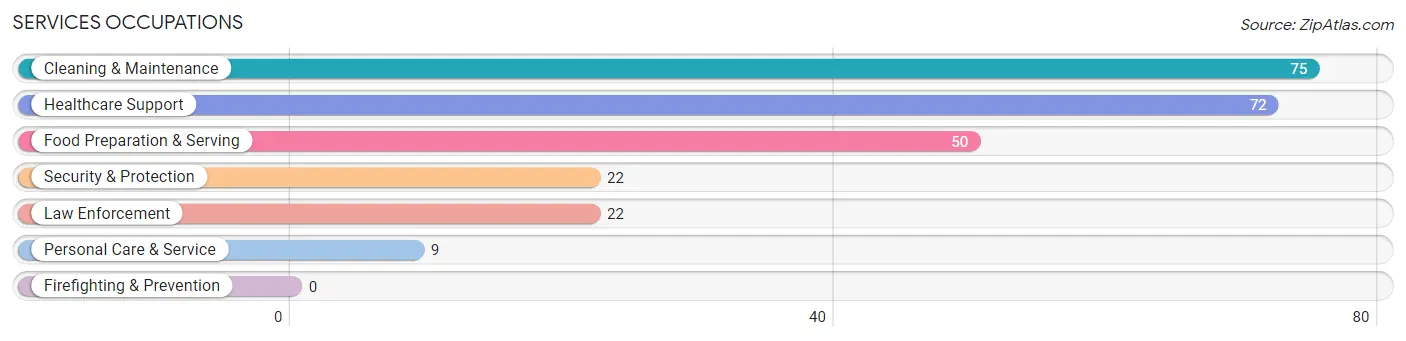
Services Occupations
The most common Services occupations in Shamrock are Cleaning & Maintenance (75 | 7.9%), Healthcare Support (72 | 7.5%), Food Preparation & Serving (50 | 5.2%), Security & Protection (22 | 2.3%), and Law Enforcement (22 | 2.3%).
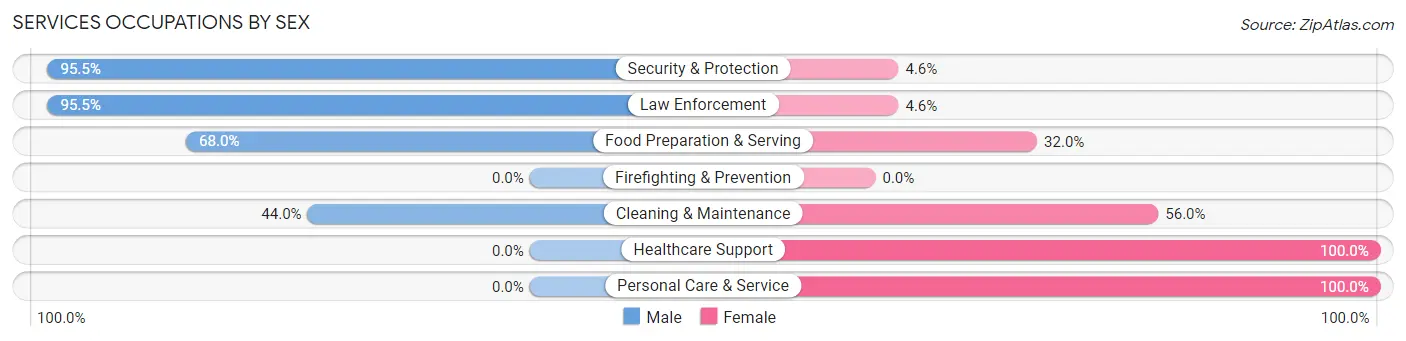
Services Occupations by Sex
Within the Services occupations in Shamrock, the most male-oriented occupations are Security & Protection (95.5%), Law Enforcement (95.5%), and Food Preparation & Serving (68.0%), while the most female-oriented occupations are Healthcare Support (100.0%), Personal Care & Service (100.0%), and Cleaning & Maintenance (56.0%).
| Occupation | Male | Female |
| Healthcare Support | 0 (0.0%) | 72 (100.0%) |
| Security & Protection | 21 (95.5%) | 1 (4.5%) |
| Firefighting & Prevention | 0 (0.0%) | 0 (0.0%) |
| Law Enforcement | 21 (95.5%) | 1 (4.5%) |
| Food Preparation & Serving | 34 (68.0%) | 16 (32.0%) |
| Cleaning & Maintenance | 33 (44.0%) | 42 (56.0%) |
| Personal Care & Service | 0 (0.0%) | 9 (100.0%) |
| Total (Category) | 88 (38.6%) | 140 (61.4%) |
| Total (Overall) | 520 (54.4%) | 436 (45.6%) |
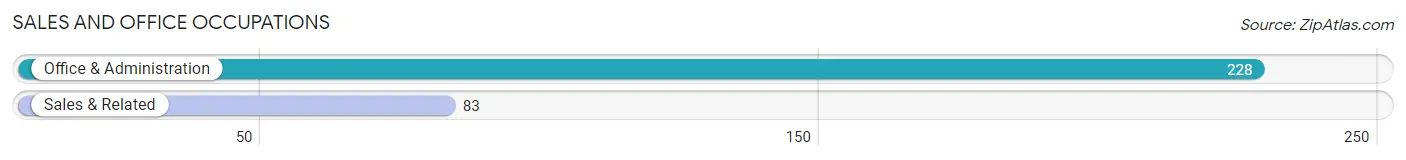
Sales and Office Occupations
The most common Sales and Office occupations in Shamrock are Office & Administration (228 | 23.8%), and Sales & Related (83 | 8.7%).
Sales and Office Occupations by Sex
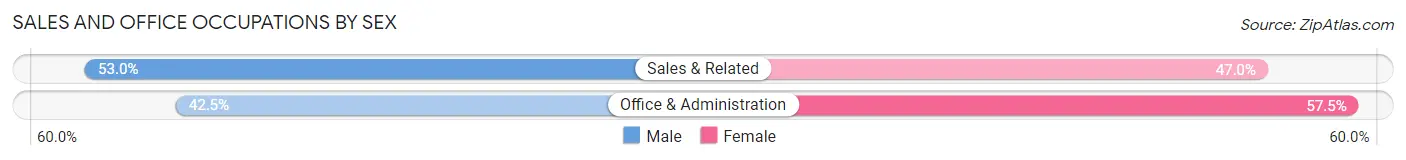
| Occupation | Male | Female |
| Sales & Related | 44 (53.0%) | 39 (47.0%) |
| Office & Administration | 97 (42.5%) | 131 (57.5%) |
| Total (Category) | 141 (45.3%) | 170 (54.7%) |
| Total (Overall) | 520 (54.4%) | 436 (45.6%) |
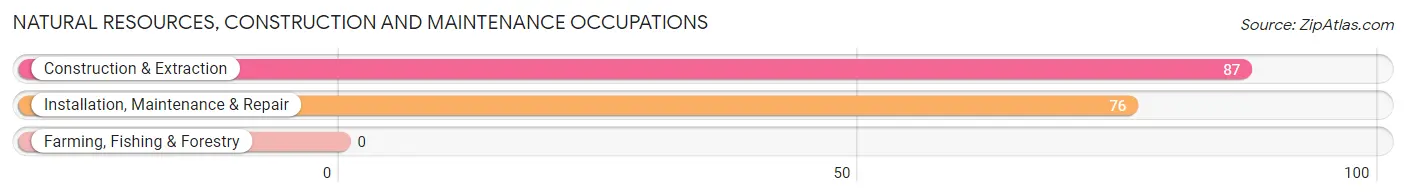
Natural Resources, Construction and Maintenance Occupations
The most common Natural Resources, Construction and Maintenance occupations in Shamrock are Construction & Extraction (87 | 9.1%), and Installation, Maintenance & Repair (76 | 8.0%).
Natural Resources, Construction and Maintenance Occupations by Sex
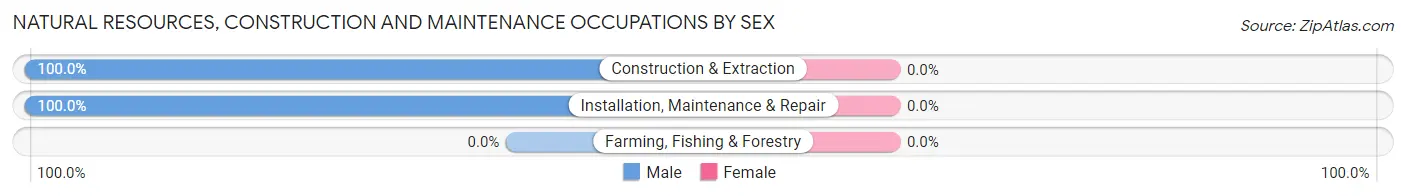
| Occupation | Male | Female |
| Farming, Fishing & Forestry | 0 (0.0%) | 0 (0.0%) |
| Construction & Extraction | 87 (100.0%) | 0 (0.0%) |
| Installation, Maintenance & Repair | 76 (100.0%) | 0 (0.0%) |
| Total (Category) | 163 (100.0%) | 0 (0.0%) |
| Total (Overall) | 520 (54.4%) | 436 (45.6%) |
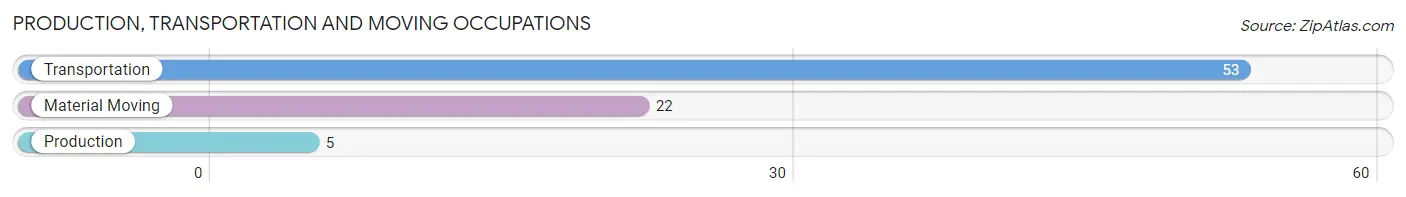
Production, Transportation and Moving Occupations
The most common Production, Transportation and Moving occupations in Shamrock are Transportation (53 | 5.5%), Material Moving (22 | 2.3%), and Production (5 | 0.5%).
Production, Transportation and Moving Occupations by Sex
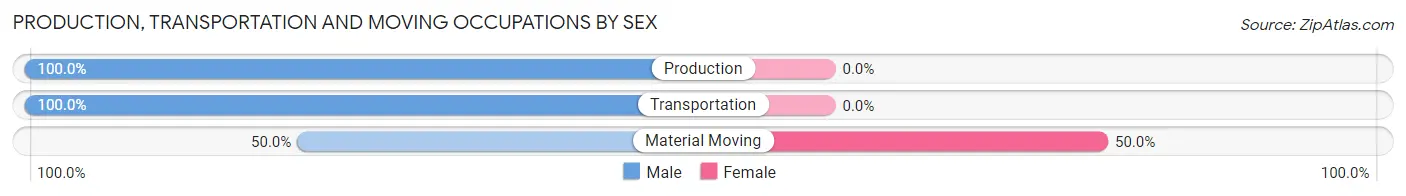
| Occupation | Male | Female |
| Production | 5 (100.0%) | 0 (0.0%) |
| Transportation | 53 (100.0%) | 0 (0.0%) |
| Material Moving | 11 (50.0%) | 11 (50.0%) |
| Total (Category) | 69 (86.3%) | 11 (13.8%) |
| Total (Overall) | 520 (54.4%) | 436 (45.6%) |
Employment Industries by Sex in Shamrock
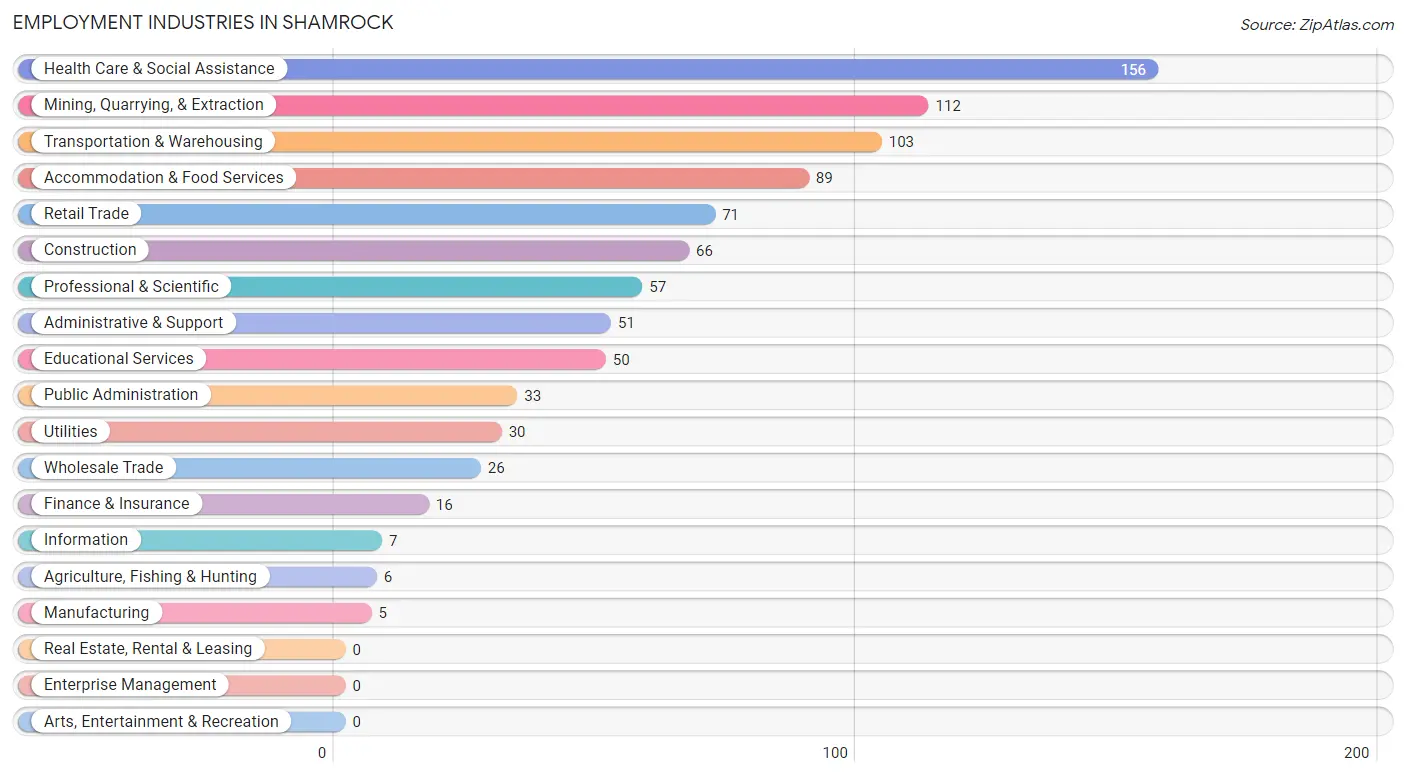
Employment Industries in Shamrock
The major employment industries in Shamrock include Health Care & Social Assistance (156 | 16.3%), Mining, Quarrying, & Extraction (112 | 11.7%), Transportation & Warehousing (103 | 10.8%), Accommodation & Food Services (89 | 9.3%), and Retail Trade (71 | 7.4%).
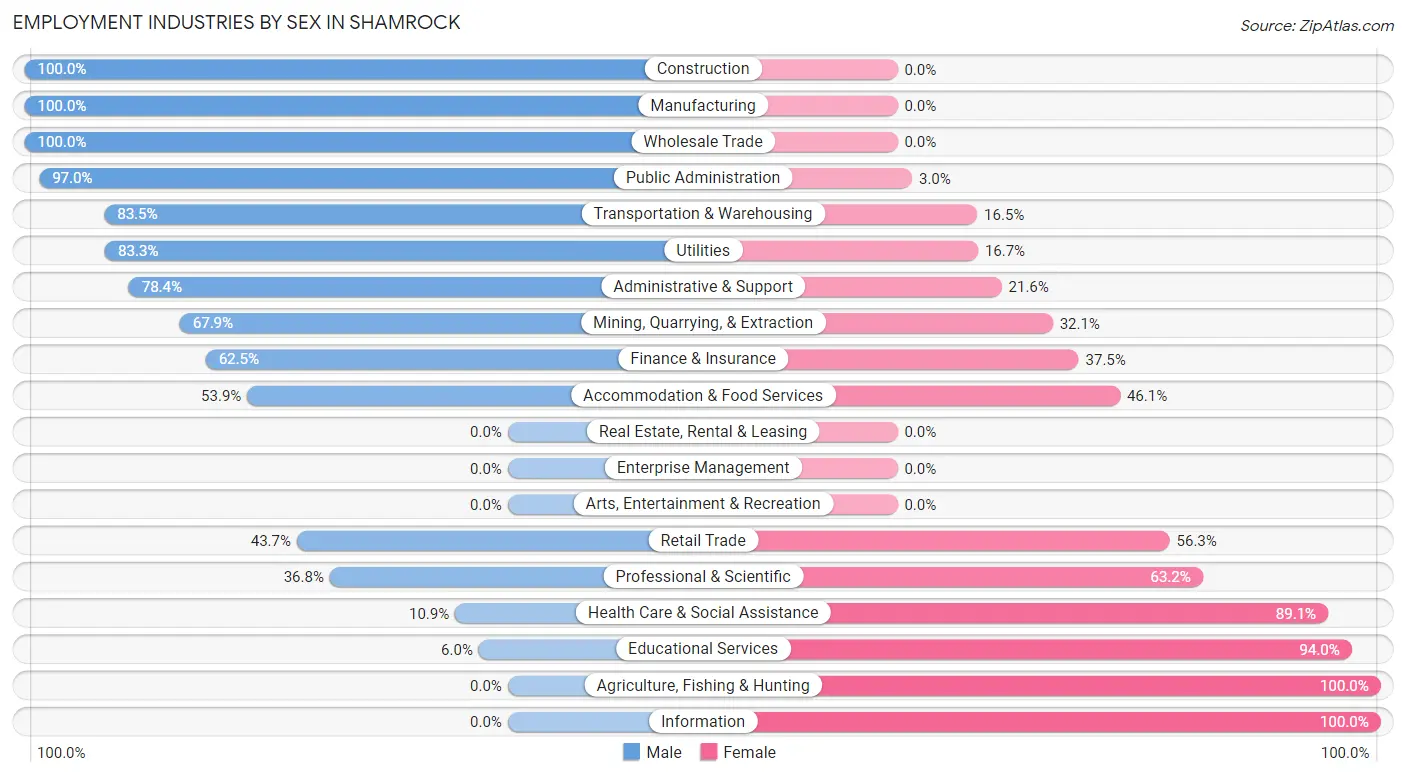
Employment Industries by Sex in Shamrock
The Shamrock industries that see more men than women are Construction (100.0%), Manufacturing (100.0%), and Wholesale Trade (100.0%), whereas the industries that tend to have a higher number of women are Agriculture, Fishing & Hunting (100.0%), Information (100.0%), and Educational Services (94.0%).
| Industry | Male | Female |
| Agriculture, Fishing & Hunting | 0 (0.0%) | 6 (100.0%) |
| Mining, Quarrying, & Extraction | 76 (67.9%) | 36 (32.1%) |
| Construction | 66 (100.0%) | 0 (0.0%) |
| Manufacturing | 5 (100.0%) | 0 (0.0%) |
| Wholesale Trade | 26 (100.0%) | 0 (0.0%) |
| Retail Trade | 31 (43.7%) | 40 (56.3%) |
| Transportation & Warehousing | 86 (83.5%) | 17 (16.5%) |
| Utilities | 25 (83.3%) | 5 (16.7%) |
| Information | 0 (0.0%) | 7 (100.0%) |
| Finance & Insurance | 10 (62.5%) | 6 (37.5%) |
| Real Estate, Rental & Leasing | 0 (0.0%) | 0 (0.0%) |
| Professional & Scientific | 21 (36.8%) | 36 (63.2%) |
| Enterprise Management | 0 (0.0%) | 0 (0.0%) |
| Administrative & Support | 40 (78.4%) | 11 (21.6%) |
| Educational Services | 3 (6.0%) | 47 (94.0%) |
| Health Care & Social Assistance | 17 (10.9%) | 139 (89.1%) |
| Arts, Entertainment & Recreation | 0 (0.0%) | 0 (0.0%) |
| Accommodation & Food Services | 48 (53.9%) | 41 (46.1%) |
| Public Administration | 32 (97.0%) | 1 (3.0%) |
| Total | 520 (54.4%) | 436 (45.6%) |
Education in Shamrock
School Enrollment in Shamrock
The most common levels of schooling among the 403 students in Shamrock are elementary school (133 | 33.0%), high school (121 | 30.0%), and middle school (51 | 12.7%).
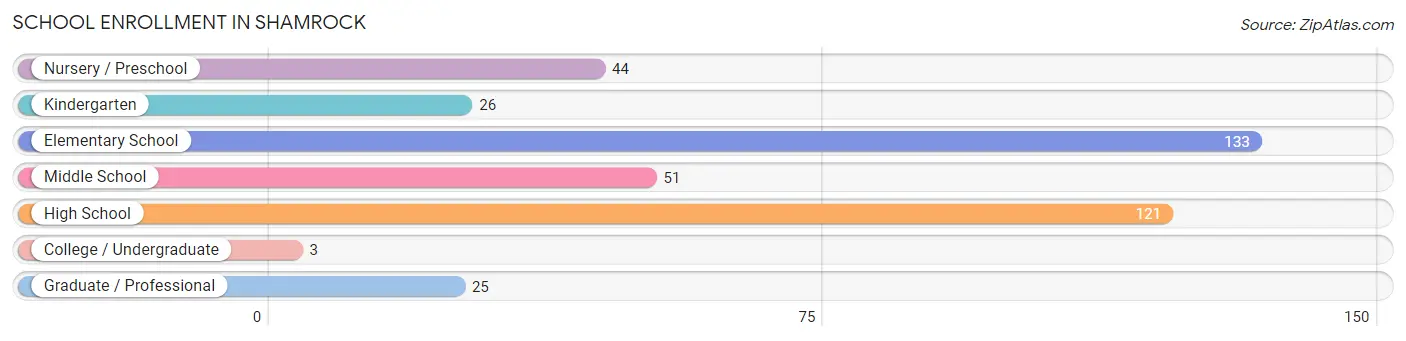
| School Level | # Students | % Students |
| Nursery / Preschool | 44 | 10.9% |
| Kindergarten | 26 | 6.5% |
| Elementary School | 133 | 33.0% |
| Middle School | 51 | 12.7% |
| High School | 121 | 30.0% |
| College / Undergraduate | 3 | 0.7% |
| Graduate / Professional | 25 | 6.2% |
| Total | 403 | 100.0% |
School Enrollment by Age by Funding Source in Shamrock
Out of a total of 403 students who are enrolled in schools in Shamrock, 21 (5.2%) attend a private institution, while the remaining 382 (94.8%) are enrolled in public schools. The age group of 10 to 14 year olds has the highest likelihood of being enrolled in private schools, with 15 (14.6% in the age bracket) enrolled. Conversely, the age group of 3 to 4 year olds has the lowest likelihood of being enrolled in a private school, with 29 (100.0% in the age bracket) attending a public institution.
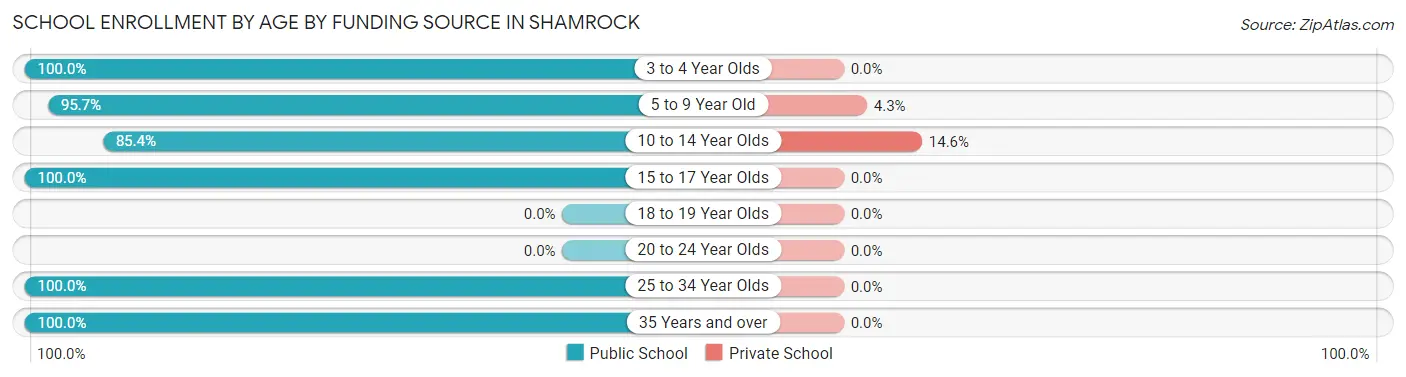
| Age Bracket | Public School | Private School |
| 3 to 4 Year Olds | 29 (100.0%) | 0 (0.0%) |
| 5 to 9 Year Old | 133 (95.7%) | 6 (4.3%) |
| 10 to 14 Year Olds | 88 (85.4%) | 15 (14.6%) |
| 15 to 17 Year Olds | 104 (100.0%) | 0 (0.0%) |
| 18 to 19 Year Olds | 0 (0.0%) | 0 (0.0%) |
| 20 to 24 Year Olds | 0 (0.0%) | 0 (0.0%) |
| 25 to 34 Year Olds | 3 (100.0%) | 0 (0.0%) |
| 35 Years and over | 25 (100.0%) | 0 (0.0%) |
| Total | 382 (94.8%) | 21 (5.2%) |
Educational Attainment by Field of Study in Shamrock
Education (57 | 33.0%), business (31 | 17.9%), liberal arts & history (25 | 14.4%), science & technology (21 | 12.1%), and engineering (13 | 7.5%) are the most common fields of study among 173 individuals in Shamrock who have obtained a bachelor's degree or higher.
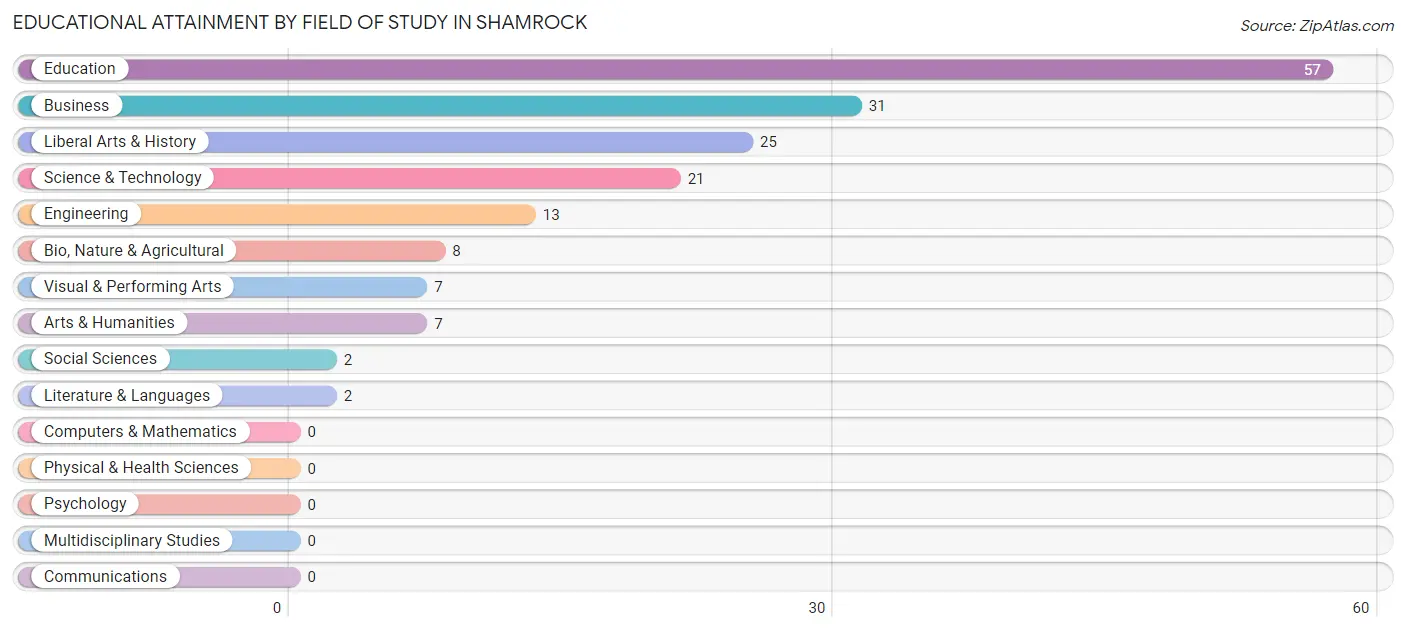
| Field of Study | # Graduates | % Graduates |
| Computers & Mathematics | 0 | 0.0% |
| Bio, Nature & Agricultural | 8 | 4.6% |
| Physical & Health Sciences | 0 | 0.0% |
| Psychology | 0 | 0.0% |
| Social Sciences | 2 | 1.2% |
| Engineering | 13 | 7.5% |
| Multidisciplinary Studies | 0 | 0.0% |
| Science & Technology | 21 | 12.1% |
| Business | 31 | 17.9% |
| Education | 57 | 33.0% |
| Literature & Languages | 2 | 1.2% |
| Liberal Arts & History | 25 | 14.4% |
| Visual & Performing Arts | 7 | 4.1% |
| Communications | 0 | 0.0% |
| Arts & Humanities | 7 | 4.1% |
| Total | 173 | 100.0% |
Transportation & Commute in Shamrock
Vehicle Availability by Sex in Shamrock
The most prevalent vehicle ownership categories in Shamrock are males with 2 vehicles (225, accounting for 43.3%) and females with 2 vehicles (175, making up 51.8%).
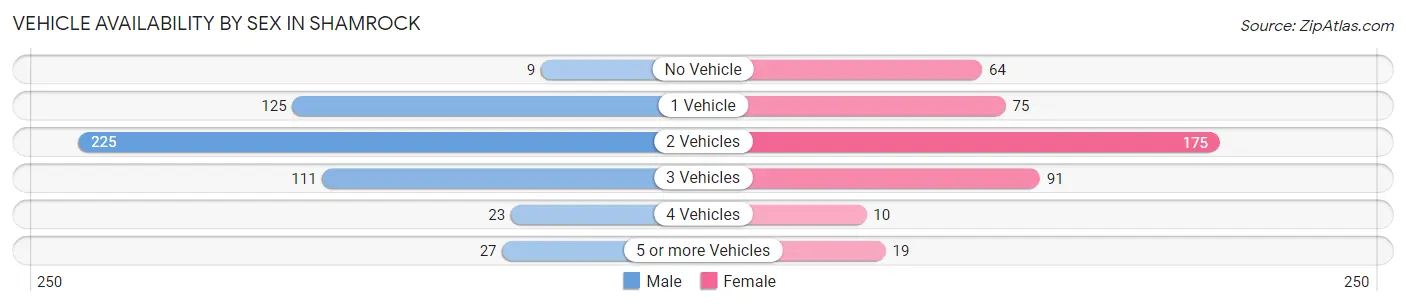
| Vehicles Available | Male | Female |
| No Vehicle | 9 (1.7%) | 64 (14.7%) |
| 1 Vehicle | 125 (24.0%) | 75 (17.3%) |
| 2 Vehicles | 225 (43.3%) | 175 (40.3%) |
| 3 Vehicles | 111 (21.3%) | 91 (21.0%) |
| 4 Vehicles | 23 (4.4%) | 10 (2.3%) |
| 5 or more Vehicles | 27 (5.2%) | 19 (4.4%) |
| Total | 520 (100.0%) | 434 (100.0%) |
Commute Time in Shamrock
The most frequently occuring commute durations in Shamrock are 5 to 9 minutes (241 commuters, 25.4%), less than 5 minutes (142 commuters, 15.0%), and 30 to 34 minutes (122 commuters, 12.9%).
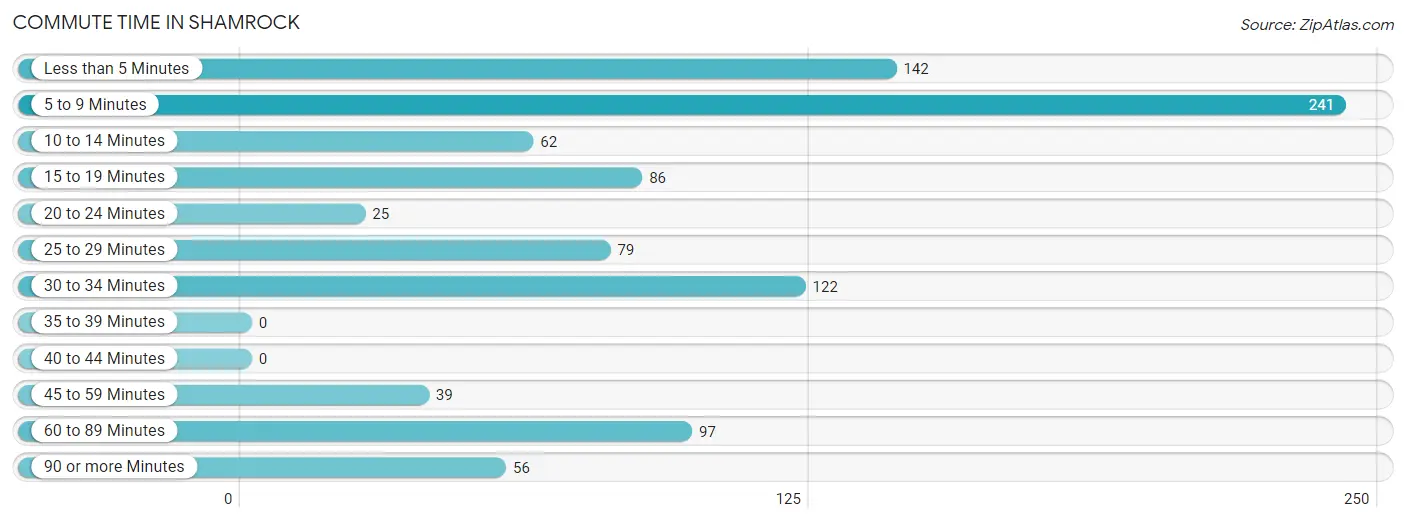
| Commute Time | # Commuters | % Commuters |
| Less than 5 Minutes | 142 | 15.0% |
| 5 to 9 Minutes | 241 | 25.4% |
| 10 to 14 Minutes | 62 | 6.5% |
| 15 to 19 Minutes | 86 | 9.1% |
| 20 to 24 Minutes | 25 | 2.6% |
| 25 to 29 Minutes | 79 | 8.3% |
| 30 to 34 Minutes | 122 | 12.9% |
| 35 to 39 Minutes | 0 | 0.0% |
| 40 to 44 Minutes | 0 | 0.0% |
| 45 to 59 Minutes | 39 | 4.1% |
| 60 to 89 Minutes | 97 | 10.2% |
| 90 or more Minutes | 56 | 5.9% |
Commute Time by Sex in Shamrock
The most common commute times in Shamrock are 5 to 9 minutes (159 commuters, 30.6%) for males and 5 to 9 minutes (82 commuters, 19.1%) for females.
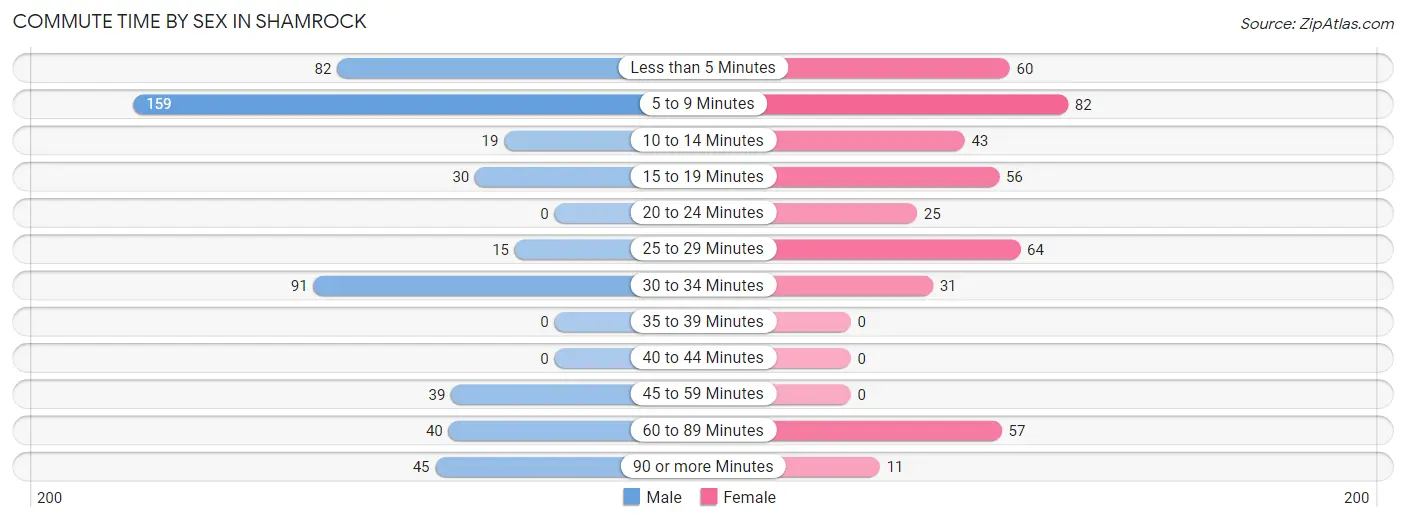
| Commute Time | Male | Female |
| Less than 5 Minutes | 82 (15.8%) | 60 (14.0%) |
| 5 to 9 Minutes | 159 (30.6%) | 82 (19.1%) |
| 10 to 14 Minutes | 19 (3.6%) | 43 (10.0%) |
| 15 to 19 Minutes | 30 (5.8%) | 56 (13.1%) |
| 20 to 24 Minutes | 0 (0.0%) | 25 (5.8%) |
| 25 to 29 Minutes | 15 (2.9%) | 64 (14.9%) |
| 30 to 34 Minutes | 91 (17.5%) | 31 (7.2%) |
| 35 to 39 Minutes | 0 (0.0%) | 0 (0.0%) |
| 40 to 44 Minutes | 0 (0.0%) | 0 (0.0%) |
| 45 to 59 Minutes | 39 (7.5%) | 0 (0.0%) |
| 60 to 89 Minutes | 40 (7.7%) | 57 (13.3%) |
| 90 or more Minutes | 45 (8.6%) | 11 (2.6%) |
Time of Departure to Work by Sex in Shamrock
The most frequent times of departure to work in Shamrock are 7:30 AM to 7:59 AM (121, 23.3%) for males and 7:00 AM to 7:29 AM (101, 23.5%) for females.
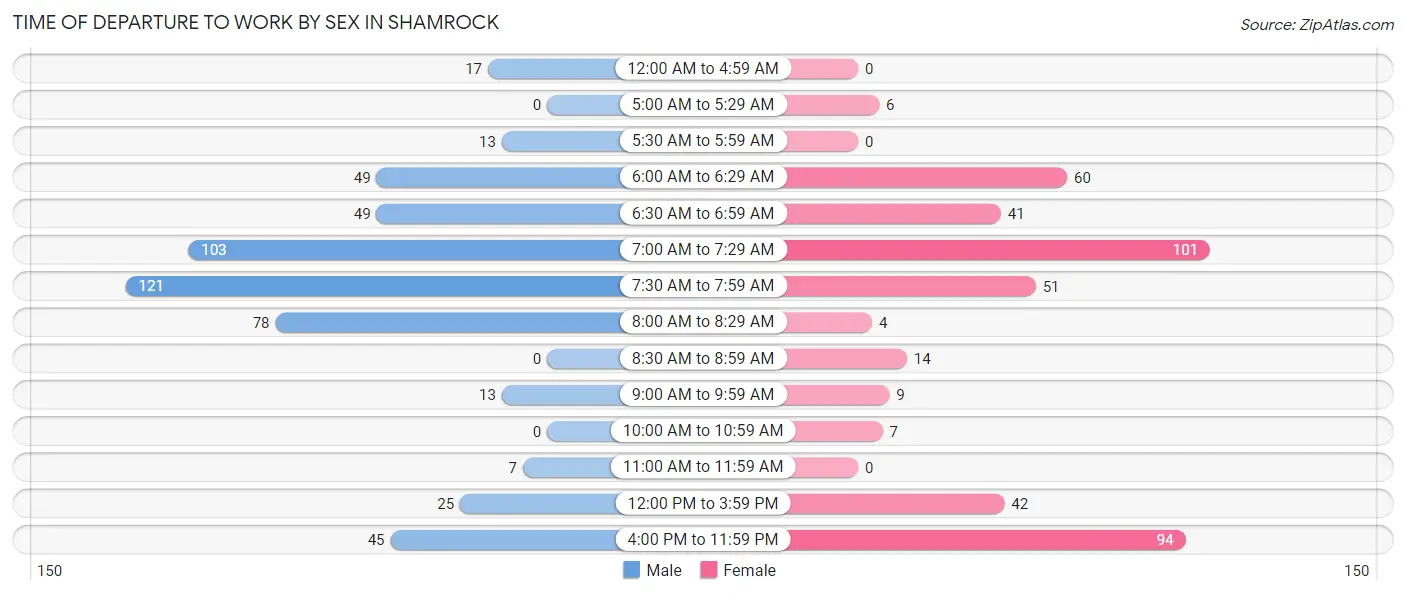
| Time of Departure | Male | Female |
| 12:00 AM to 4:59 AM | 17 (3.3%) | 0 (0.0%) |
| 5:00 AM to 5:29 AM | 0 (0.0%) | 6 (1.4%) |
| 5:30 AM to 5:59 AM | 13 (2.5%) | 0 (0.0%) |
| 6:00 AM to 6:29 AM | 49 (9.4%) | 60 (14.0%) |
| 6:30 AM to 6:59 AM | 49 (9.4%) | 41 (9.6%) |
| 7:00 AM to 7:29 AM | 103 (19.8%) | 101 (23.5%) |
| 7:30 AM to 7:59 AM | 121 (23.3%) | 51 (11.9%) |
| 8:00 AM to 8:29 AM | 78 (15.0%) | 4 (0.9%) |
| 8:30 AM to 8:59 AM | 0 (0.0%) | 14 (3.3%) |
| 9:00 AM to 9:59 AM | 13 (2.5%) | 9 (2.1%) |
| 10:00 AM to 10:59 AM | 0 (0.0%) | 7 (1.6%) |
| 11:00 AM to 11:59 AM | 7 (1.3%) | 0 (0.0%) |
| 12:00 PM to 3:59 PM | 25 (4.8%) | 42 (9.8%) |
| 4:00 PM to 11:59 PM | 45 (8.6%) | 94 (21.9%) |
| Total | 520 (100.0%) | 429 (100.0%) |
Housing Occupancy in Shamrock
Occupancy by Ownership in Shamrock
Of the total 850 dwellings in Shamrock, owner-occupied units account for 614 (72.2%), while renter-occupied units make up 236 (27.8%).
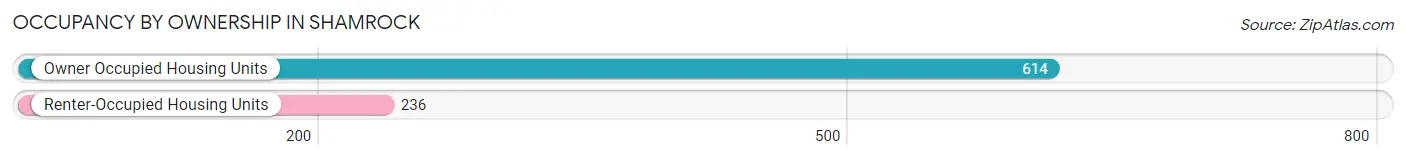
| Occupancy | # Housing Units | % Housing Units |
| Owner Occupied Housing Units | 614 | 72.2% |
| Renter-Occupied Housing Units | 236 | 27.8% |
| Total Occupied Housing Units | 850 | 100.0% |
Occupancy by Household Size in Shamrock
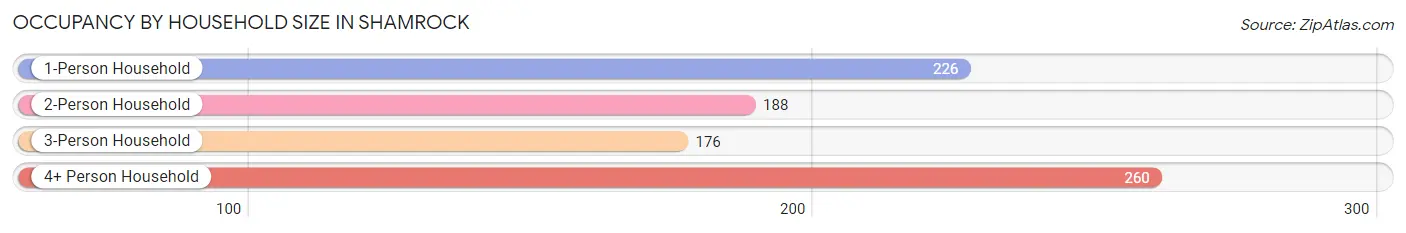
| Household Size | # Housing Units | % Housing Units |
| 1-Person Household | 226 | 26.6% |
| 2-Person Household | 188 | 22.1% |
| 3-Person Household | 176 | 20.7% |
| 4+ Person Household | 260 | 30.6% |
| Total Housing Units | 850 | 100.0% |
Occupancy by Ownership by Household Size in Shamrock
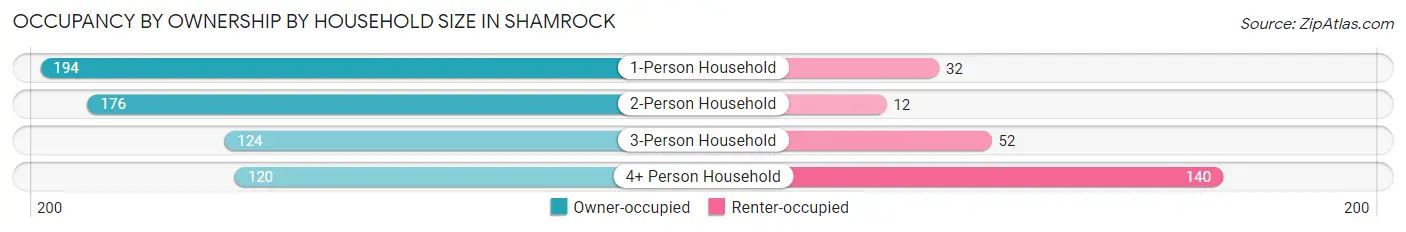
| Household Size | Owner-occupied | Renter-occupied |
| 1-Person Household | 194 (85.8%) | 32 (14.2%) |
| 2-Person Household | 176 (93.6%) | 12 (6.4%) |
| 3-Person Household | 124 (70.5%) | 52 (29.5%) |
| 4+ Person Household | 120 (46.2%) | 140 (53.8%) |
| Total Housing Units | 614 (72.2%) | 236 (27.8%) |
Occupancy by Educational Attainment in Shamrock
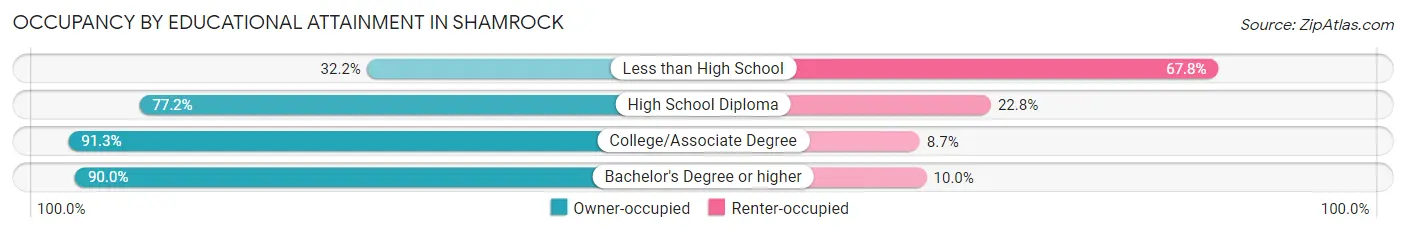
| Household Size | Owner-occupied | Renter-occupied |
| Less than High School | 56 (32.2%) | 118 (67.8%) |
| High School Diploma | 319 (77.2%) | 94 (22.8%) |
| College/Associate Degree | 158 (91.3%) | 15 (8.7%) |
| Bachelor's Degree or higher | 81 (90.0%) | 9 (10.0%) |
Occupancy by Age of Householder in Shamrock
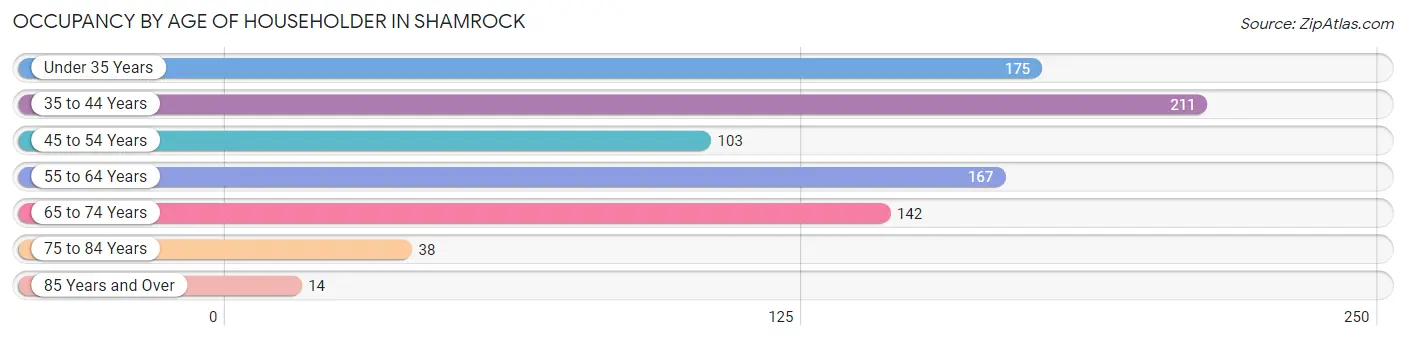
| Age Bracket | # Households | % Households |
| Under 35 Years | 175 | 20.6% |
| 35 to 44 Years | 211 | 24.8% |
| 45 to 54 Years | 103 | 12.1% |
| 55 to 64 Years | 167 | 19.7% |
| 65 to 74 Years | 142 | 16.7% |
| 75 to 84 Years | 38 | 4.5% |
| 85 Years and Over | 14 | 1.7% |
| Total | 850 | 100.0% |
Housing Finances in Shamrock
Median Income by Occupancy in Shamrock
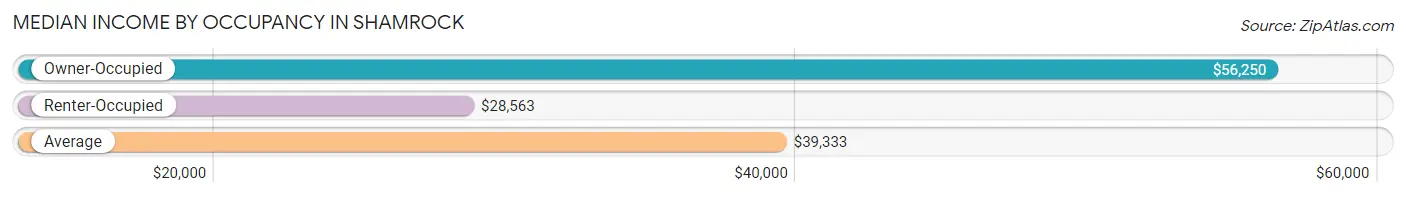
| Occupancy Type | # Households | Median Income |
| Owner-Occupied | 614 (72.2%) | $56,250 |
| Renter-Occupied | 236 (27.8%) | $28,563 |
| Average | 850 (100.0%) | $39,333 |
Occupancy by Householder Income Bracket in Shamrock
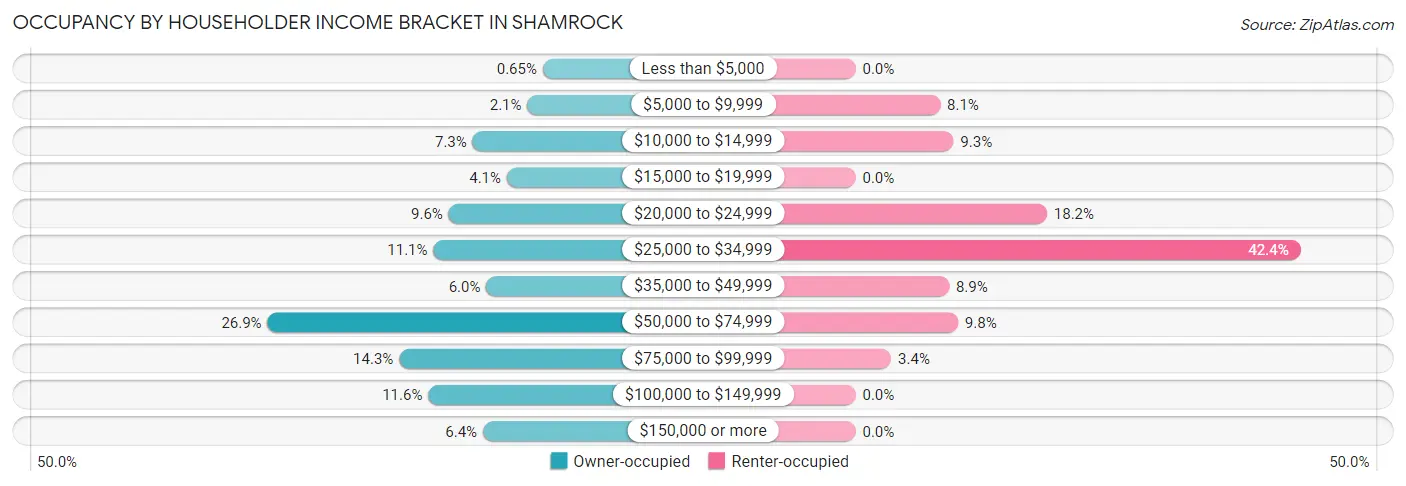
| Income Bracket | Owner-occupied | Renter-occupied |
| Less than $5,000 | 4 (0.6%) | 0 (0.0%) |
| $5,000 to $9,999 | 13 (2.1%) | 19 (8.1%) |
| $10,000 to $14,999 | 45 (7.3%) | 22 (9.3%) |
| $15,000 to $19,999 | 25 (4.1%) | 0 (0.0%) |
| $20,000 to $24,999 | 59 (9.6%) | 43 (18.2%) |
| $25,000 to $34,999 | 68 (11.1%) | 100 (42.4%) |
| $35,000 to $49,999 | 37 (6.0%) | 21 (8.9%) |
| $50,000 to $74,999 | 165 (26.9%) | 23 (9.8%) |
| $75,000 to $99,999 | 88 (14.3%) | 8 (3.4%) |
| $100,000 to $149,999 | 71 (11.6%) | 0 (0.0%) |
| $150,000 or more | 39 (6.4%) | 0 (0.0%) |
| Total | 614 (100.0%) | 236 (100.0%) |
Monthly Housing Cost Tiers in Shamrock
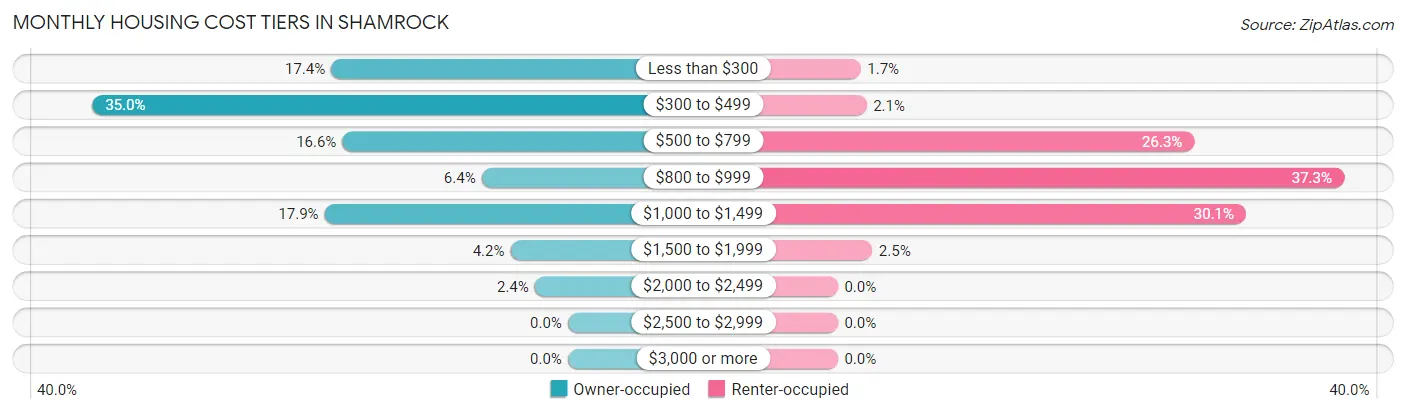
| Monthly Cost | Owner-occupied | Renter-occupied |
| Less than $300 | 107 (17.4%) | 4 (1.7%) |
| $300 to $499 | 215 (35.0%) | 5 (2.1%) |
| $500 to $799 | 102 (16.6%) | 62 (26.3%) |
| $800 to $999 | 39 (6.4%) | 88 (37.3%) |
| $1,000 to $1,499 | 110 (17.9%) | 71 (30.1%) |
| $1,500 to $1,999 | 26 (4.2%) | 6 (2.5%) |
| $2,000 to $2,499 | 15 (2.4%) | 0 (0.0%) |
| $2,500 to $2,999 | 0 (0.0%) | 0 (0.0%) |
| $3,000 or more | 0 (0.0%) | 0 (0.0%) |
| Total | 614 (100.0%) | 236 (100.0%) |
Physical Housing Characteristics in Shamrock
Housing Structures in Shamrock
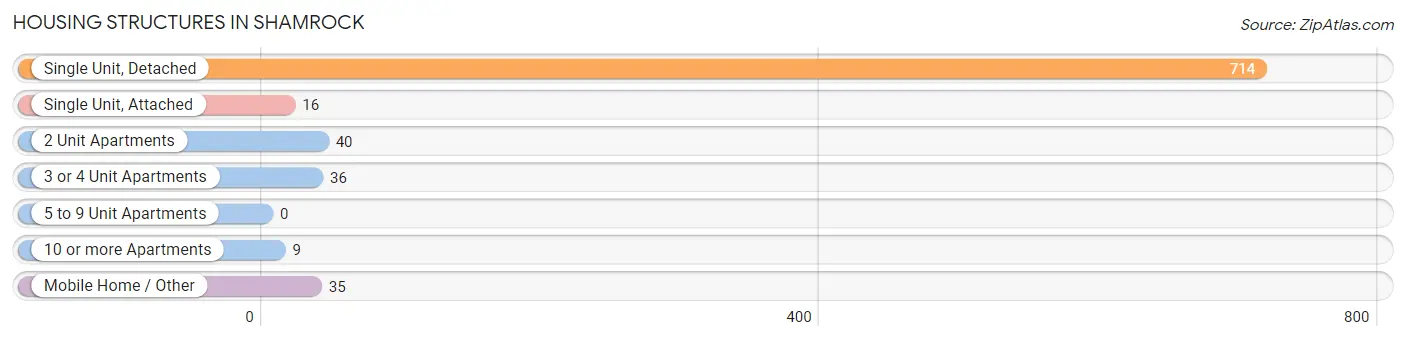
| Structure Type | # Housing Units | % Housing Units |
| Single Unit, Detached | 714 | 84.0% |
| Single Unit, Attached | 16 | 1.9% |
| 2 Unit Apartments | 40 | 4.7% |
| 3 or 4 Unit Apartments | 36 | 4.2% |
| 5 to 9 Unit Apartments | 0 | 0.0% |
| 10 or more Apartments | 9 | 1.1% |
| Mobile Home / Other | 35 | 4.1% |
| Total | 850 | 100.0% |
Housing Structures by Occupancy in Shamrock
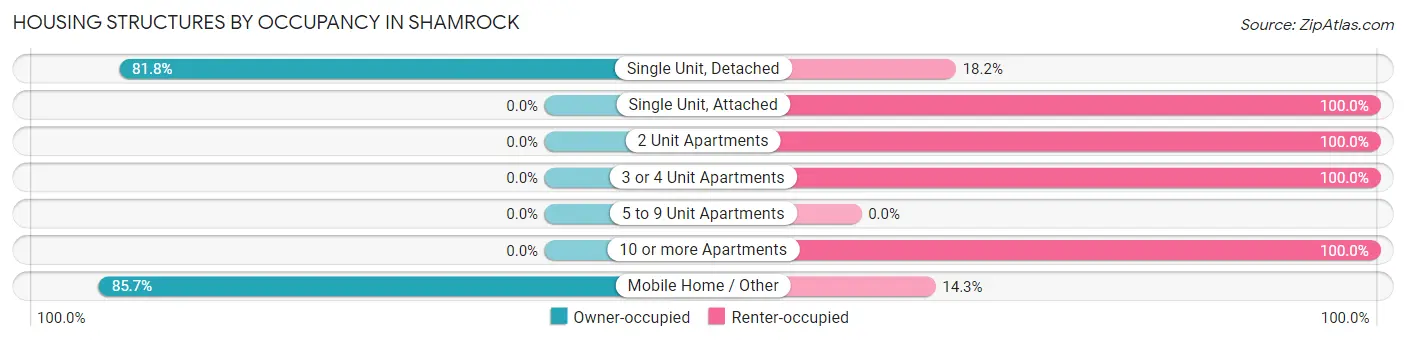
| Structure Type | Owner-occupied | Renter-occupied |
| Single Unit, Detached | 584 (81.8%) | 130 (18.2%) |
| Single Unit, Attached | 0 (0.0%) | 16 (100.0%) |
| 2 Unit Apartments | 0 (0.0%) | 40 (100.0%) |
| 3 or 4 Unit Apartments | 0 (0.0%) | 36 (100.0%) |
| 5 to 9 Unit Apartments | 0 (0.0%) | 0 (0.0%) |
| 10 or more Apartments | 0 (0.0%) | 9 (100.0%) |
| Mobile Home / Other | 30 (85.7%) | 5 (14.3%) |
| Total | 614 (72.2%) | 236 (27.8%) |
Housing Structures by Number of Rooms in Shamrock
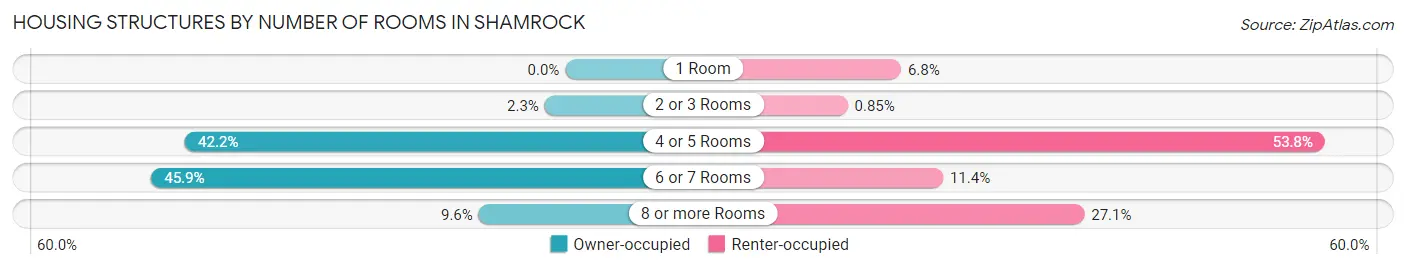
| Number of Rooms | Owner-occupied | Renter-occupied |
| 1 Room | 0 (0.0%) | 16 (6.8%) |
| 2 or 3 Rooms | 14 (2.3%) | 2 (0.9%) |
| 4 or 5 Rooms | 259 (42.2%) | 127 (53.8%) |
| 6 or 7 Rooms | 282 (45.9%) | 27 (11.4%) |
| 8 or more Rooms | 59 (9.6%) | 64 (27.1%) |
| Total | 614 (100.0%) | 236 (100.0%) |
Housing Structure by Heating Type in Shamrock
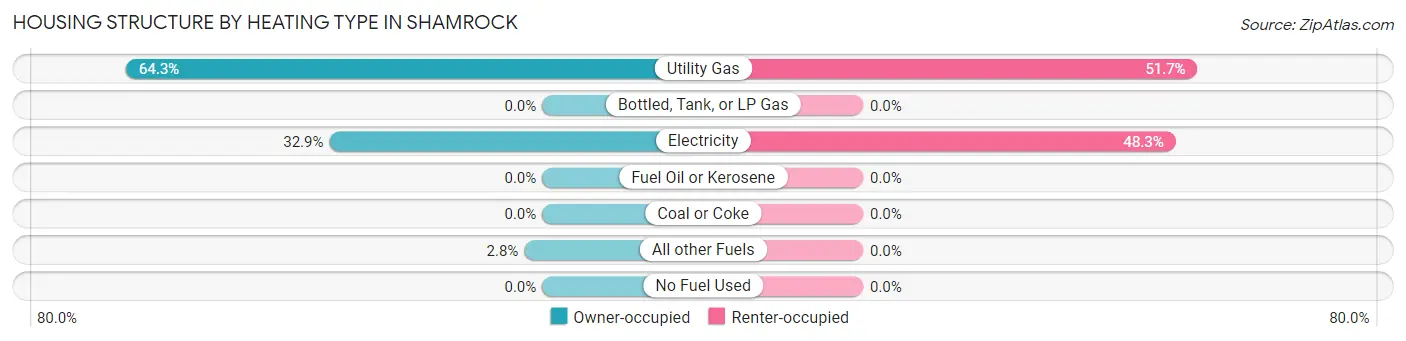
| Heating Type | Owner-occupied | Renter-occupied |
| Utility Gas | 395 (64.3%) | 122 (51.7%) |
| Bottled, Tank, or LP Gas | 0 (0.0%) | 0 (0.0%) |
| Electricity | 202 (32.9%) | 114 (48.3%) |
| Fuel Oil or Kerosene | 0 (0.0%) | 0 (0.0%) |
| Coal or Coke | 0 (0.0%) | 0 (0.0%) |
| All other Fuels | 17 (2.8%) | 0 (0.0%) |
| No Fuel Used | 0 (0.0%) | 0 (0.0%) |
| Total | 614 (100.0%) | 236 (100.0%) |
Household Vehicle Usage in Shamrock
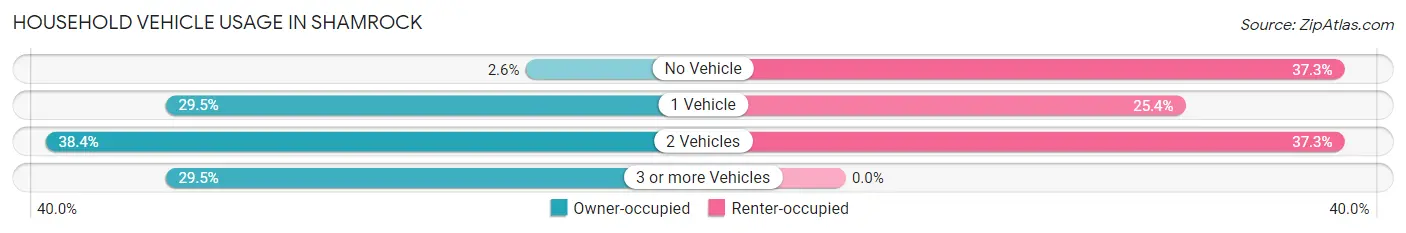
| Vehicles per Household | Owner-occupied | Renter-occupied |
| No Vehicle | 16 (2.6%) | 88 (37.3%) |
| 1 Vehicle | 181 (29.5%) | 60 (25.4%) |
| 2 Vehicles | 236 (38.4%) | 88 (37.3%) |
| 3 or more Vehicles | 181 (29.5%) | 0 (0.0%) |
| Total | 614 (100.0%) | 236 (100.0%) |
Real Estate & Mortgages in Shamrock
Real Estate and Mortgage Overview in Shamrock
| Characteristic | Without Mortgage | With Mortgage |
| Housing Units | 410 | 204 |
| Median Property Value | $67,400 | $88,600 |
| Median Household Income | $59,167 | $19 |
| Monthly Housing Costs | $391 | $0 |
| Real Estate Taxes | $1,157 | $3 |
Property Value by Mortgage Status in Shamrock
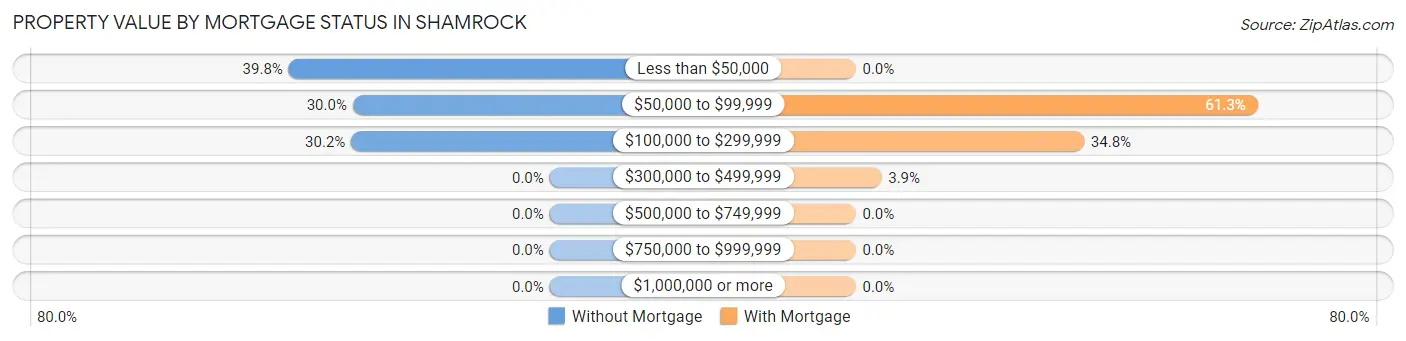
| Property Value | Without Mortgage | With Mortgage |
| Less than $50,000 | 163 (39.8%) | 0 (0.0%) |
| $50,000 to $99,999 | 123 (30.0%) | 125 (61.3%) |
| $100,000 to $299,999 | 124 (30.2%) | 71 (34.8%) |
| $300,000 to $499,999 | 0 (0.0%) | 8 (3.9%) |
| $500,000 to $749,999 | 0 (0.0%) | 0 (0.0%) |
| $750,000 to $999,999 | 0 (0.0%) | 0 (0.0%) |
| $1,000,000 or more | 0 (0.0%) | 0 (0.0%) |
| Total | 410 (100.0%) | 204 (100.0%) |
Household Income by Mortgage Status in Shamrock
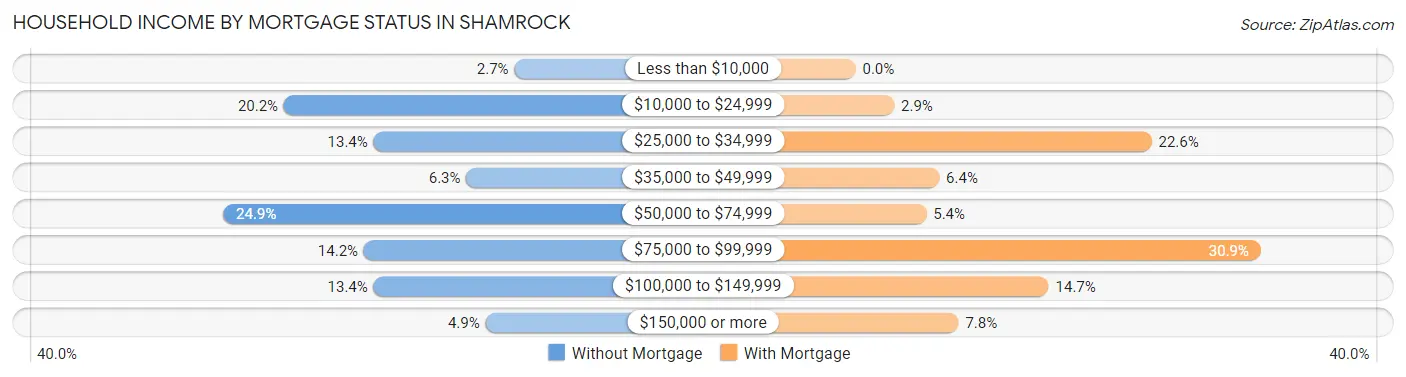
| Household Income | Without Mortgage | With Mortgage |
| Less than $10,000 | 11 (2.7%) | 0 (0.0%) |
| $10,000 to $24,999 | 83 (20.2%) | 6 (2.9%) |
| $25,000 to $34,999 | 55 (13.4%) | 46 (22.6%) |
| $35,000 to $49,999 | 26 (6.3%) | 13 (6.4%) |
| $50,000 to $74,999 | 102 (24.9%) | 11 (5.4%) |
| $75,000 to $99,999 | 58 (14.1%) | 63 (30.9%) |
| $100,000 to $149,999 | 55 (13.4%) | 30 (14.7%) |
| $150,000 or more | 20 (4.9%) | 16 (7.8%) |
| Total | 410 (100.0%) | 204 (100.0%) |
Property Value to Household Income Ratio in Shamrock
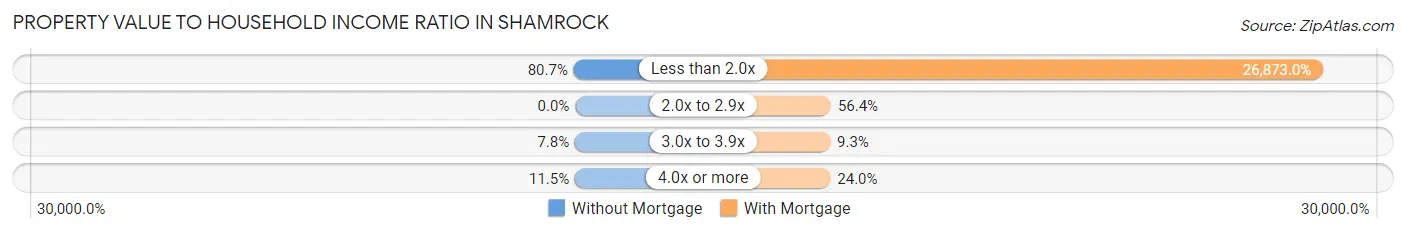
| Value-to-Income Ratio | Without Mortgage | With Mortgage |
| Less than 2.0x | 331 (80.7%) | 54,821 (26,873.0%) |
| 2.0x to 2.9x | 0 (0.0%) | 115 (56.4%) |
| 3.0x to 3.9x | 32 (7.8%) | 19 (9.3%) |
| 4.0x or more | 47 (11.5%) | 49 (24.0%) |
| Total | 410 (100.0%) | 204 (100.0%) |
Real Estate Taxes by Mortgage Status in Shamrock
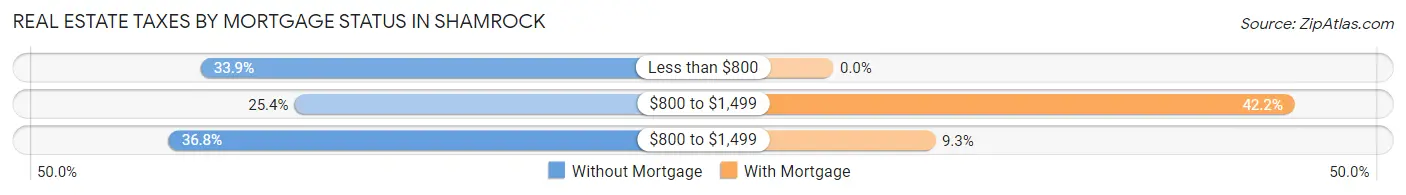
| Property Taxes | Without Mortgage | With Mortgage |
| Less than $800 | 139 (33.9%) | 0 (0.0%) |
| $800 to $1,499 | 104 (25.4%) | 86 (42.2%) |
| $800 to $1,499 | 151 (36.8%) | 19 (9.3%) |
| Total | 410 (100.0%) | 204 (100.0%) |
Health & Disability in Shamrock
Health Insurance Coverage by Age in Shamrock
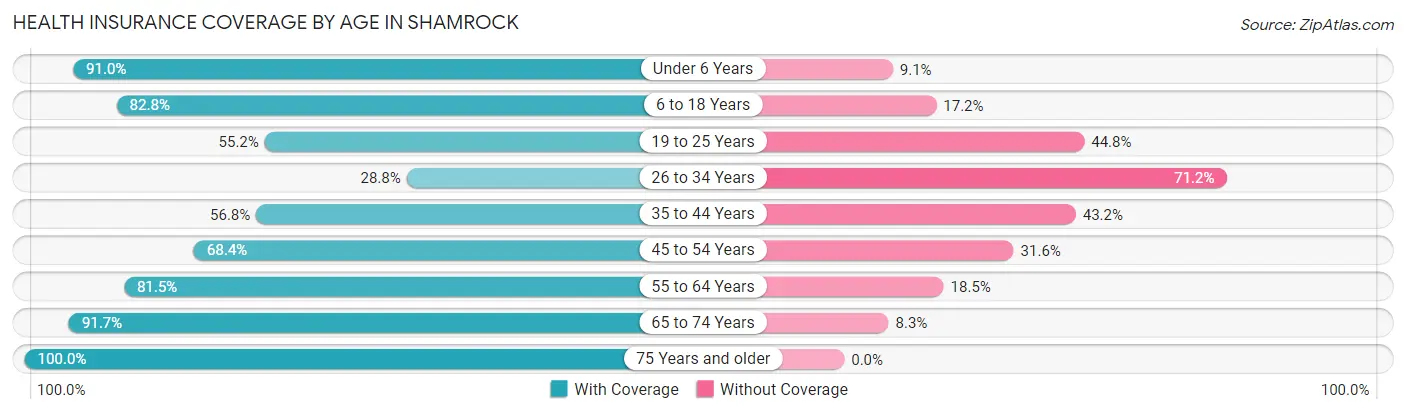
| Age Bracket | With Coverage | Without Coverage |
| Under 6 Years | 181 (90.9%) | 18 (9.0%) |
| 6 to 18 Years | 246 (82.8%) | 51 (17.2%) |
| 19 to 25 Years | 58 (55.2%) | 47 (44.8%) |
| 26 to 34 Years | 82 (28.8%) | 203 (71.2%) |
| 35 to 44 Years | 208 (56.8%) | 158 (43.2%) |
| 45 to 54 Years | 117 (68.4%) | 54 (31.6%) |
| 55 to 64 Years | 211 (81.5%) | 48 (18.5%) |
| 65 to 74 Years | 222 (91.7%) | 20 (8.3%) |
| 75 Years and older | 76 (100.0%) | 0 (0.0%) |
| Total | 1,401 (70.1%) | 599 (29.9%) |
Health Insurance Coverage by Citizenship Status in Shamrock
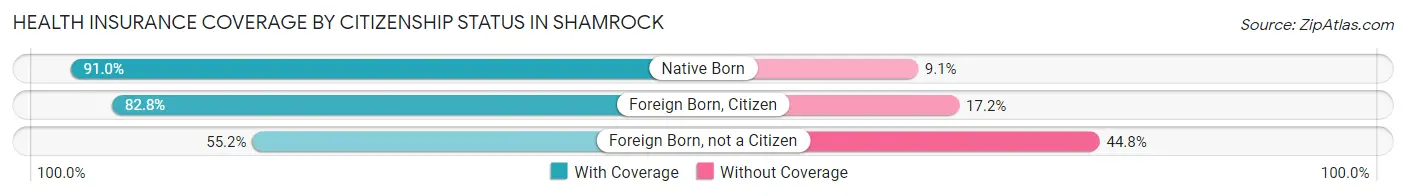
| Citizenship Status | With Coverage | Without Coverage |
| Native Born | 181 (90.9%) | 18 (9.0%) |
| Foreign Born, Citizen | 246 (82.8%) | 51 (17.2%) |
| Foreign Born, not a Citizen | 58 (55.2%) | 47 (44.8%) |
Health Insurance Coverage by Household Income in Shamrock
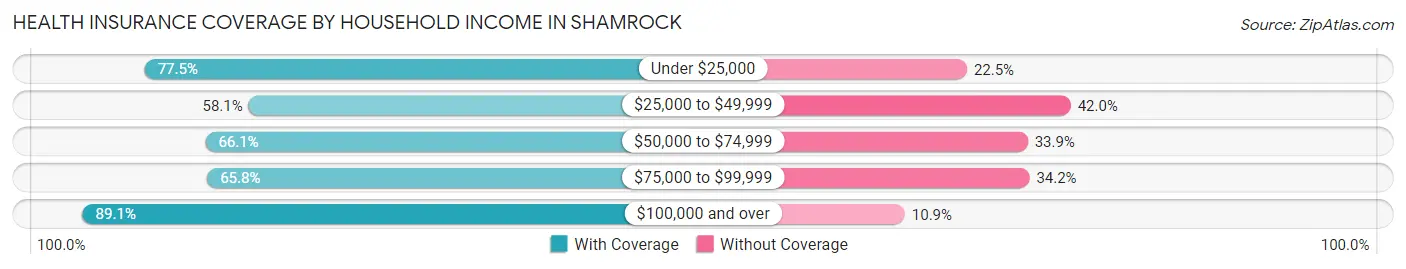
| Household Income | With Coverage | Without Coverage |
| Under $25,000 | 358 (77.5%) | 104 (22.5%) |
| $25,000 to $49,999 | 292 (58.1%) | 211 (41.9%) |
| $50,000 to $74,999 | 316 (66.1%) | 162 (33.9%) |
| $75,000 to $99,999 | 173 (65.8%) | 90 (34.2%) |
| $100,000 and over | 262 (89.1%) | 32 (10.9%) |
Public vs Private Health Insurance Coverage by Age in Shamrock
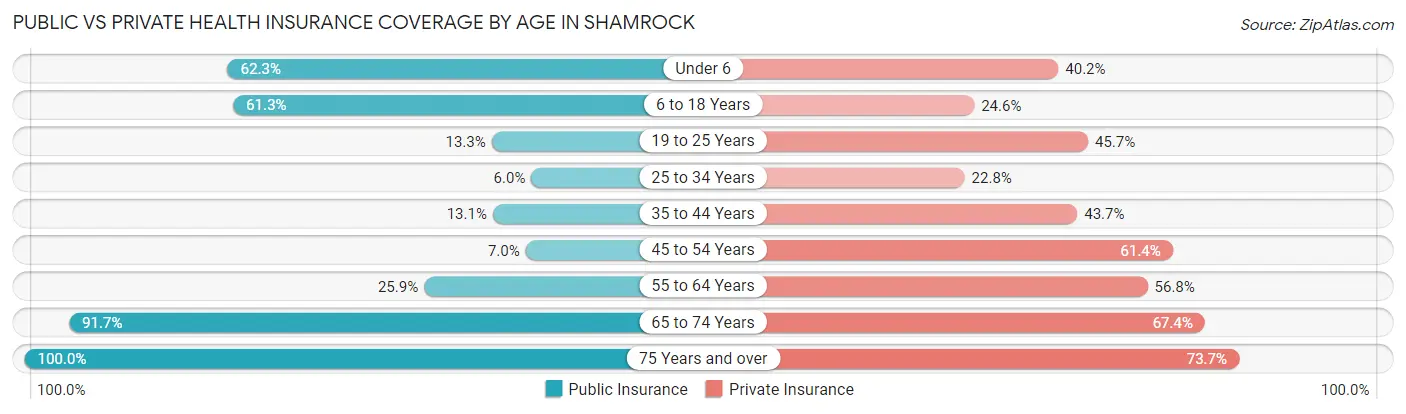
| Age Bracket | Public Insurance | Private Insurance |
| Under 6 | 124 (62.3%) | 80 (40.2%) |
| 6 to 18 Years | 182 (61.3%) | 73 (24.6%) |
| 19 to 25 Years | 14 (13.3%) | 48 (45.7%) |
| 25 to 34 Years | 17 (6.0%) | 65 (22.8%) |
| 35 to 44 Years | 48 (13.1%) | 160 (43.7%) |
| 45 to 54 Years | 12 (7.0%) | 105 (61.4%) |
| 55 to 64 Years | 67 (25.9%) | 147 (56.8%) |
| 65 to 74 Years | 222 (91.7%) | 163 (67.4%) |
| 75 Years and over | 76 (100.0%) | 56 (73.7%) |
| Total | 762 (38.1%) | 897 (44.9%) |
Disability Status by Sex by Age in Shamrock
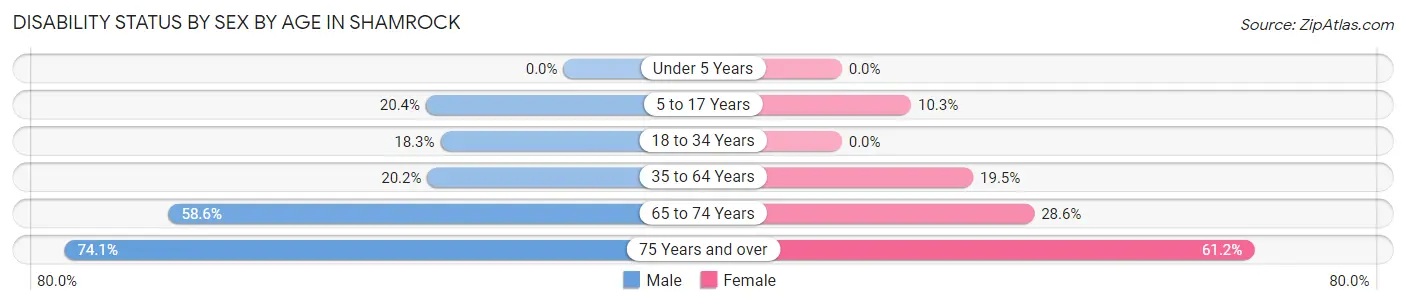
| Age Bracket | Male | Female |
| Under 5 Years | 0 (0.0%) | 0 (0.0%) |
| 5 to 17 Years | 29 (20.4%) | 21 (10.3%) |
| 18 to 34 Years | 36 (18.3%) | 0 (0.0%) |
| 35 to 64 Years | 80 (20.2%) | 78 (19.5%) |
| 65 to 74 Years | 68 (58.6%) | 36 (28.6%) |
| 75 Years and over | 20 (74.1%) | 30 (61.2%) |
Disability Class by Sex by Age in Shamrock
Disability Class: Hearing Difficulty
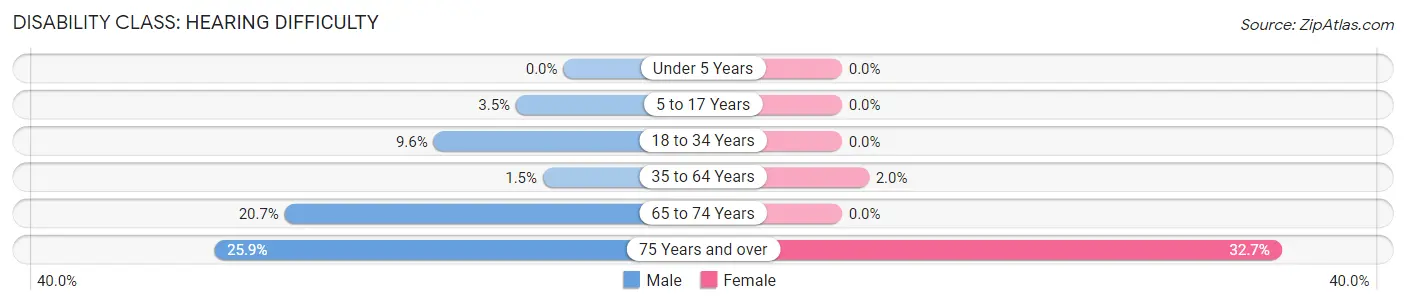
| Age Bracket | Male | Female |
| Under 5 Years | 0 (0.0%) | 0 (0.0%) |
| 5 to 17 Years | 5 (3.5%) | 0 (0.0%) |
| 18 to 34 Years | 19 (9.6%) | 0 (0.0%) |
| 35 to 64 Years | 6 (1.5%) | 8 (2.0%) |
| 65 to 74 Years | 24 (20.7%) | 0 (0.0%) |
| 75 Years and over | 7 (25.9%) | 16 (32.7%) |
Disability Class: Vision Difficulty
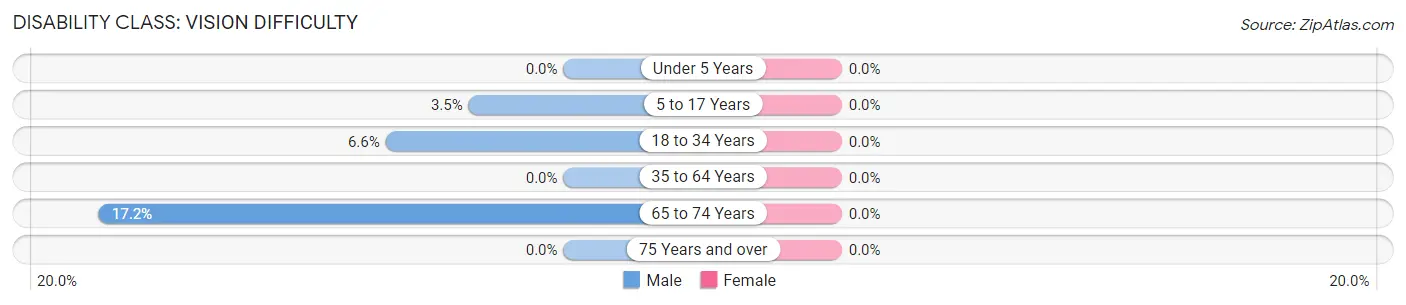
| Age Bracket | Male | Female |
| Under 5 Years | 0 (0.0%) | 0 (0.0%) |
| 5 to 17 Years | 5 (3.5%) | 0 (0.0%) |
| 18 to 34 Years | 13 (6.6%) | 0 (0.0%) |
| 35 to 64 Years | 0 (0.0%) | 0 (0.0%) |
| 65 to 74 Years | 20 (17.2%) | 0 (0.0%) |
| 75 Years and over | 0 (0.0%) | 0 (0.0%) |
Disability Class: Cognitive Difficulty
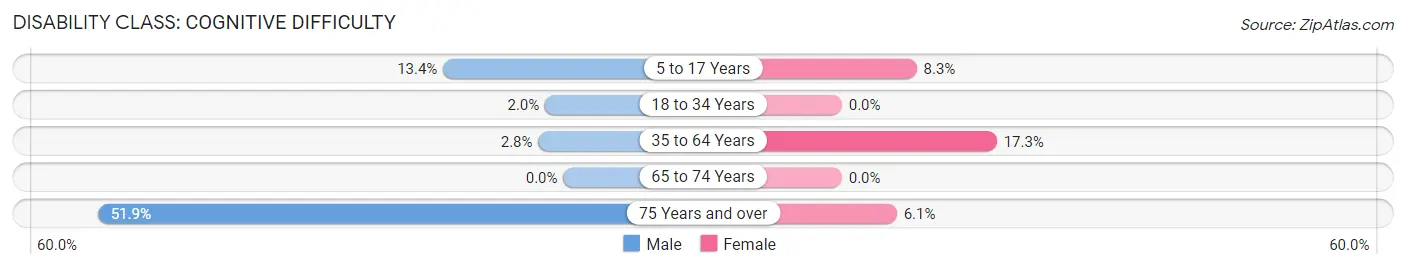
| Age Bracket | Male | Female |
| 5 to 17 Years | 19 (13.4%) | 17 (8.3%) |
| 18 to 34 Years | 4 (2.0%) | 0 (0.0%) |
| 35 to 64 Years | 11 (2.8%) | 69 (17.2%) |
| 65 to 74 Years | 0 (0.0%) | 0 (0.0%) |
| 75 Years and over | 14 (51.8%) | 3 (6.1%) |
Disability Class: Ambulatory Difficulty
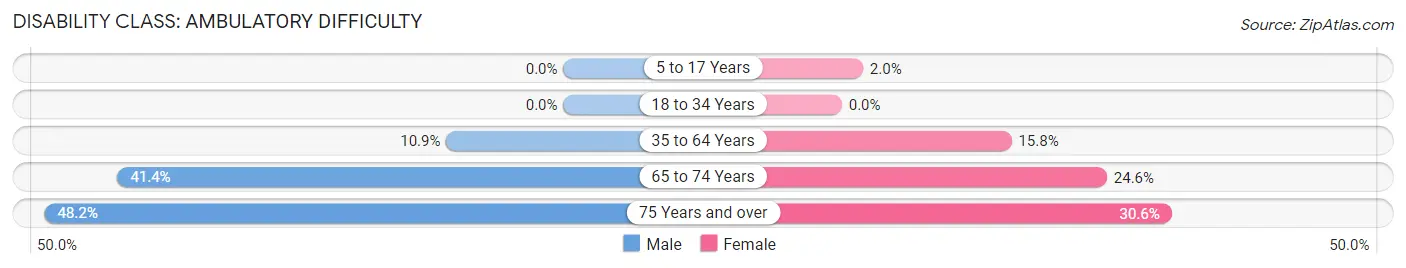
| Age Bracket | Male | Female |
| 5 to 17 Years | 0 (0.0%) | 4 (2.0%) |
| 18 to 34 Years | 0 (0.0%) | 0 (0.0%) |
| 35 to 64 Years | 43 (10.9%) | 63 (15.8%) |
| 65 to 74 Years | 48 (41.4%) | 31 (24.6%) |
| 75 Years and over | 13 (48.1%) | 15 (30.6%) |
Disability Class: Self-Care Difficulty
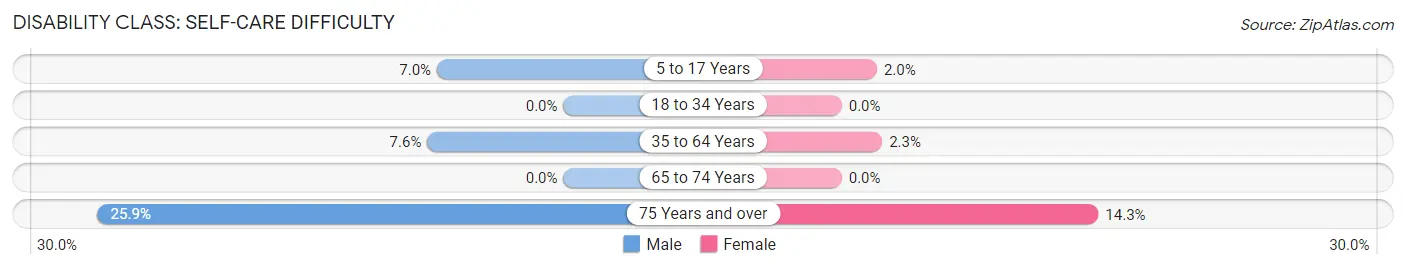
| Age Bracket | Male | Female |
| 5 to 17 Years | 10 (7.0%) | 4 (2.0%) |
| 18 to 34 Years | 0 (0.0%) | 0 (0.0%) |
| 35 to 64 Years | 30 (7.6%) | 9 (2.2%) |
| 65 to 74 Years | 0 (0.0%) | 0 (0.0%) |
| 75 Years and over | 7 (25.9%) | 7 (14.3%) |
Technology Access in Shamrock
Computing Device Access in Shamrock
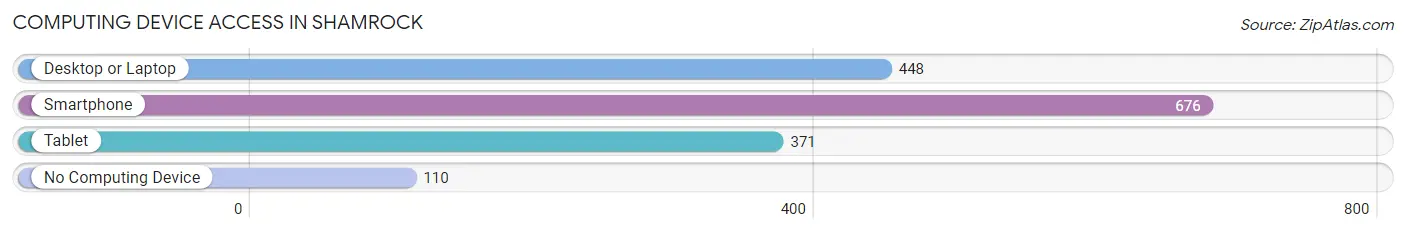
| Device Type | # Households | % Households |
| Desktop or Laptop | 448 | 52.7% |
| Smartphone | 676 | 79.5% |
| Tablet | 371 | 43.6% |
| No Computing Device | 110 | 12.9% |
| Total | 850 | 100.0% |
Internet Access in Shamrock
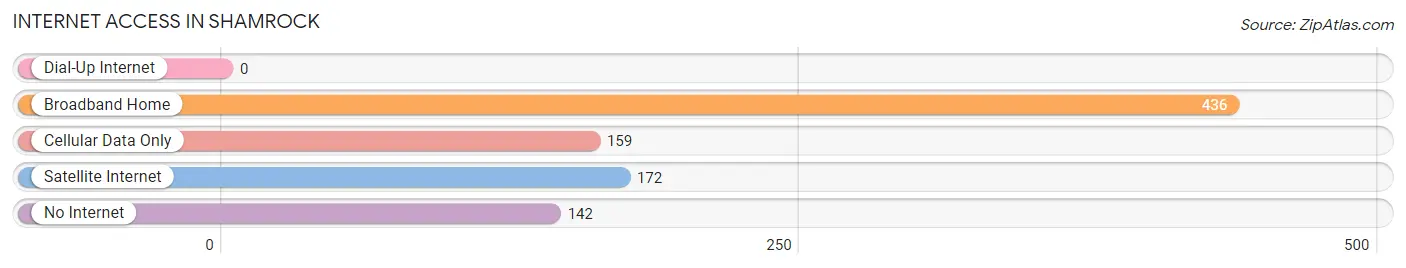
| Internet Type | # Households | % Households |
| Dial-Up Internet | 0 | 0.0% |
| Broadband Home | 436 | 51.3% |
| Cellular Data Only | 159 | 18.7% |
| Satellite Internet | 172 | 20.2% |
| No Internet | 142 | 16.7% |
| Total | 850 | 100.0% |
Shamrock Summary
History
The small town of Shamrock, Texas is located in Wheeler County in the Texas Panhandle. It was founded in 1903 by the Santa Fe Railroad and named after the shamrock, a symbol of luck and good fortune. The town was originally a stop on the railroad line, but it quickly grew into a thriving community.
The first settlers in Shamrock were ranchers and farmers who were attracted to the area by the abundance of grass and water. The town was incorporated in 1909 and soon became a center for the local agricultural industry. The town was also home to several businesses, including a bank, a hotel, a general store, and a post office.
In the early 1900s, Shamrock was a bustling town with a population of over 1,000 people. The town was home to several churches, a school, and a library. The town also had a movie theater, a bowling alley, and a variety of other businesses.
In the 1920s, the town began to decline as the railroad line was rerouted and the local economy shifted away from agriculture. The population dropped to just over 500 people by the 1940s.
In the 1950s, the town began to experience a resurgence as oil and gas were discovered in the area. The population grew to over 1,000 people by the 1960s. The town was also home to several businesses, including a grocery store, a hardware store, and a gas station.
In the 1970s, the town experienced another decline as the oil and gas industry began to decline. The population dropped to just over 500 people by the 1980s.
In the 1990s, the town began to experience a resurgence as the local economy shifted to tourism. The population grew to over 1,000 people by the 2000s. The town is now home to several businesses, including a restaurant, a hotel, and a variety of other businesses.
Geography
Shamrock is located in the Texas Panhandle, in Wheeler County. The town is situated on the banks of the North Fork of the Red River. The town is surrounded by rolling hills and grasslands, and is located about 50 miles east of Amarillo.
The climate in Shamrock is semi-arid, with hot summers and mild winters. The average annual temperature is around 65 degrees Fahrenheit. The average annual precipitation is around 18 inches.
Economy
The economy of Shamrock is largely based on tourism. The town is home to several businesses, including a restaurant, a hotel, and a variety of other businesses. The town is also home to several attractions, including the Shamrock Historical Museum, the Shamrock Golf Course, and the Shamrock Speedway.
The town is also home to several oil and gas companies, as well as several agricultural businesses. The local economy is also supported by the nearby military base, which provides jobs for many of the town’s residents.
Demographics
As of the 2010 census, the population of Shamrock was 1,072. The racial makeup of the town was 94.3% White, 0.7% African American, 0.3% Native American, 0.2% Asian, 0.1% Pacific Islander, 2.7% from other races, and 1.7% from two or more races. Hispanic or Latino of any race were 5.2% of the population.
The median household income in Shamrock was $31,250, and the median family income was $37,500. The per capita income in Shamrock was $17,845. About 16.2% of the population was below the poverty line.
Common Questions
What is Per Capita Income in Shamrock?
Per Capita income in Shamrock is $25,538.
What is the Median Family Income in Shamrock?
Median Family Income in Shamrock is $50,208.
What is the Median Household income in Shamrock?
Median Household Income in Shamrock is $39,333.
What is Income or Wage Gap in Shamrock?
Income or Wage Gap in Shamrock is 34.5%.
Women in Shamrock earn 65.5 cents for every dollar earned by a man.
What is Inequality or Gini Index in Shamrock?
Inequality or Gini Index in Shamrock is 0.42.
What is the Total Population of Shamrock?
Total Population of Shamrock is 2,000.
What is the Total Male Population of Shamrock?
Total Male Population of Shamrock is 993.
What is the Total Female Population of Shamrock?
Total Female Population of Shamrock is 1,007.
What is the Ratio of Males per 100 Females in Shamrock?
There are 98.61 Males per 100 Females in Shamrock.
What is the Ratio of Females per 100 Males in Shamrock?
There are 101.41 Females per 100 Males in Shamrock.
What is the Median Population Age in Shamrock?
Median Population Age in Shamrock is 36.6 Years.
What is the Average Family Size in Shamrock
Average Family Size in Shamrock is 2.8 People.
What is the Average Household Size in Shamrock
Average Household Size in Shamrock is 2.4 People.
How Large is the Labor Force in Shamrock?
There are 1,032 People in the Labor Forcein in Shamrock.
What is the Percentage of People in the Labor Force in Shamrock?
64.4% of People are in the Labor Force in Shamrock.
What is the Unemployment Rate in Shamrock?
Unemployment Rate in Shamrock is 7.4%.