Zip Codes with the Highest Percentage of Population Employed in Office & Administration in Mission, TX
RELATED REPORTS & OPTIONS
Office & Administration
Mission
Compare Zip Codes
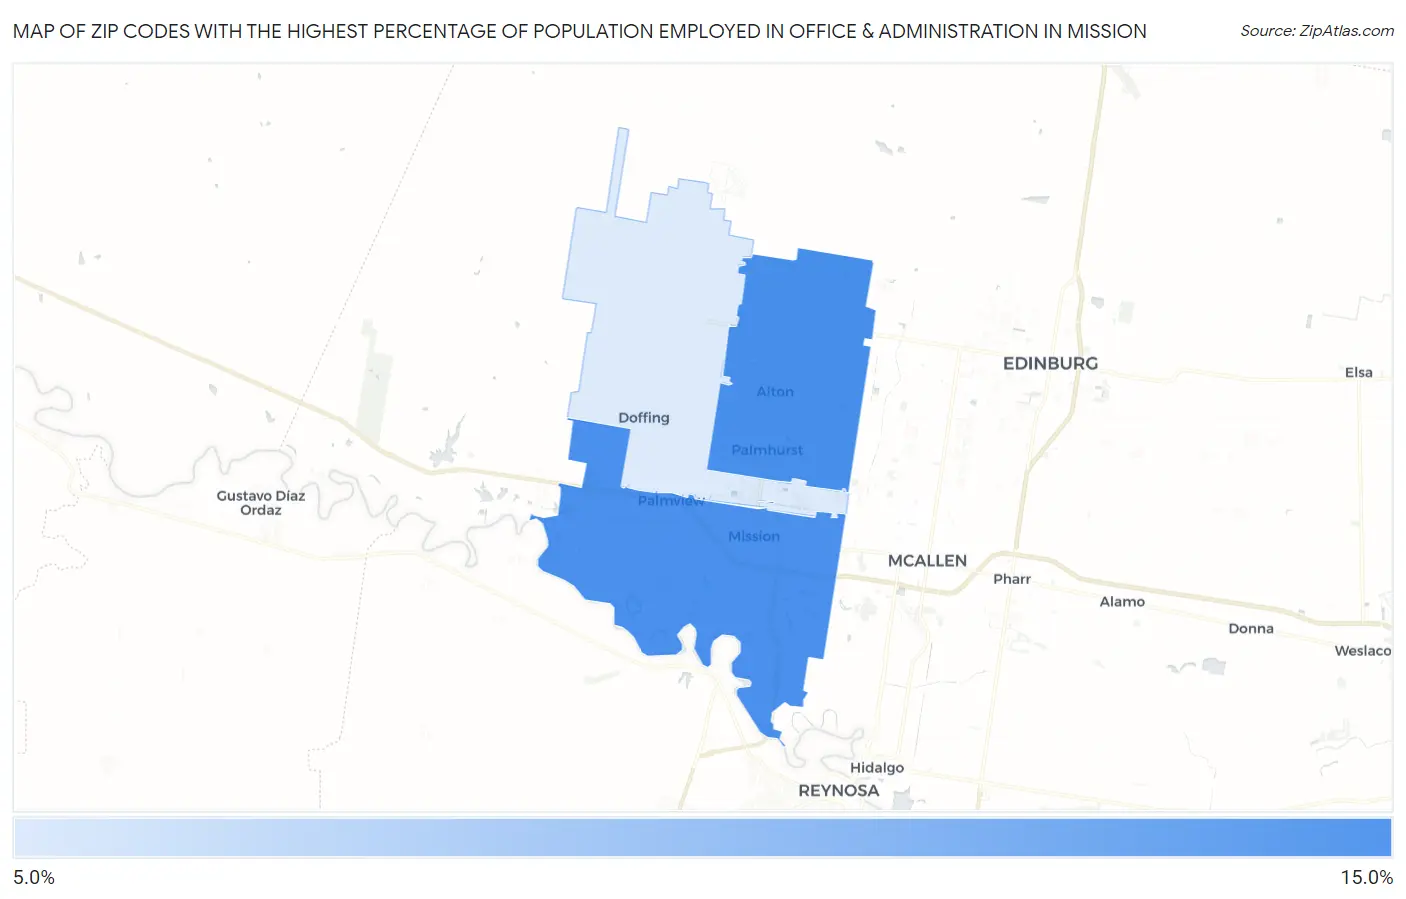
Map of Zip Codes with the Highest Percentage of Population Employed in Office & Administration in Mission
8.9%
10.1%
Zip Codes with the Highest Percentage of Population Employed in Office & Administration in Mission, TX
| Zip Code | % Employed | vs State | vs National | |
| 1. | 78573 | 10.1% | 11.0%(-0.912)#1,025 | 10.9%(-0.797)#16,937 |
| 2. | 78572 | 10.0% | 11.0%(-0.939)#1,033 | 10.9%(-0.824)#17,019 |
| 3. | 78574 | 8.9% | 11.0%(-2.09)#1,242 | 10.9%(-1.98)#20,605 |
1
Common Questions
What are the Top Zip Codes with the Highest Percentage of Population Employed in Office & Administration in Mission, TX?
Top Zip Codes with the Highest Percentage of Population Employed in Office & Administration in Mission, TX are:
What zip code has the Highest Percentage of Population Employed in Office & Administration in Mission, TX?
78573 has the Highest Percentage of Population Employed in Office & Administration in Mission, TX with 10.1%.
What is the Percentage of Population Employed in Office & Administration in Mission, TX?
Percentage of Population Employed in Office & Administration in Mission is 10.5%.
What is the Percentage of Population Employed in Office & Administration in Texas?
Percentage of Population Employed in Office & Administration in Texas is 11.0%.
What is the Percentage of Population Employed in Office & Administration in the United States?
Percentage of Population Employed in Office & Administration in the United States is 10.9%.