Zip Codes with the Highest Percentage of Population Employed in Office & Administration in Magnolia, TX
RELATED REPORTS & OPTIONS
Office & Administration
Magnolia
Compare Zip Codes
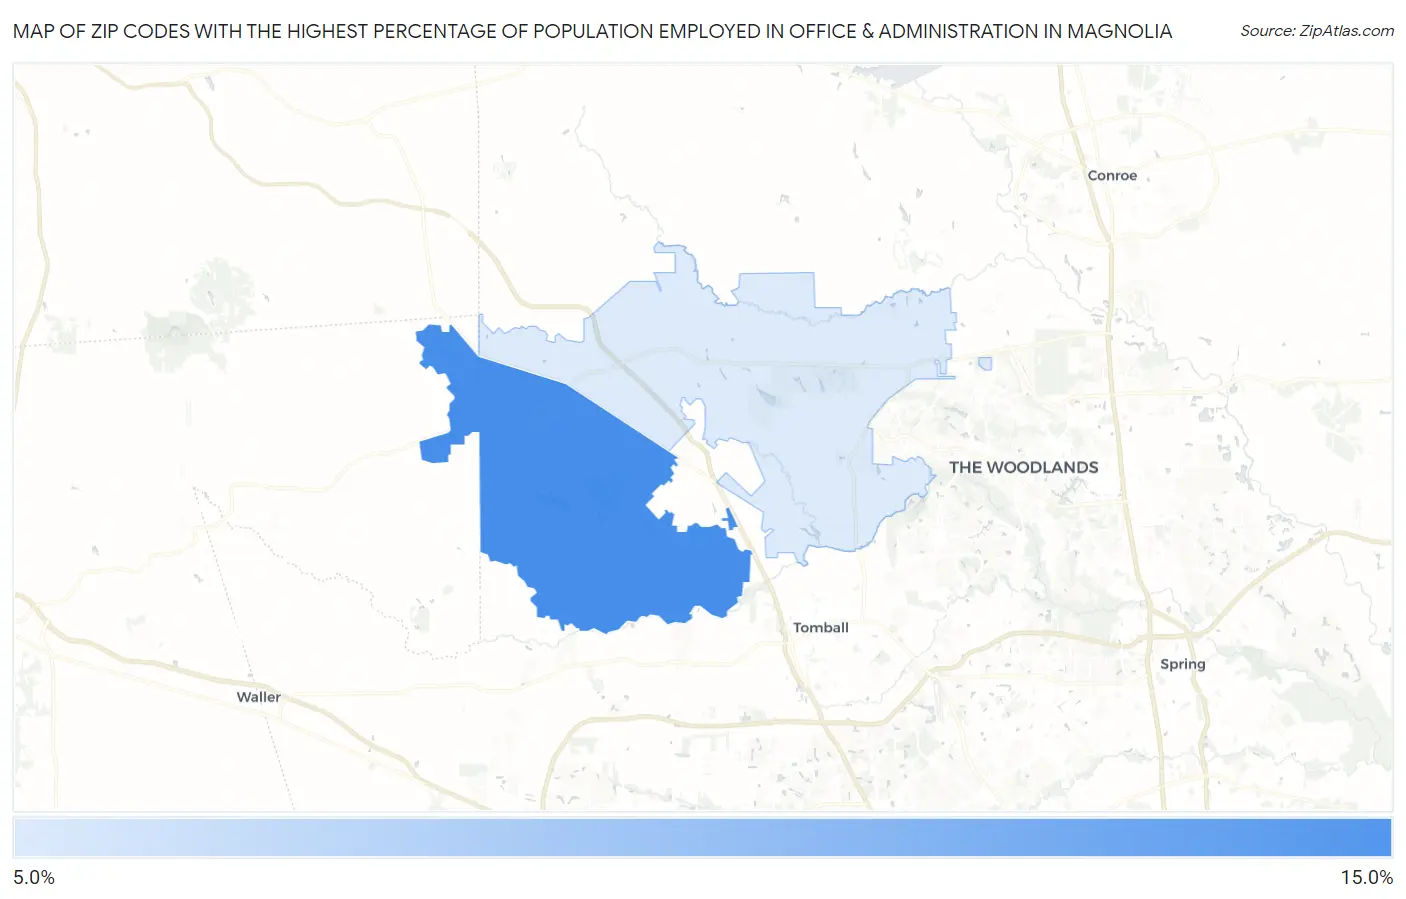
Map of Zip Codes with the Highest Percentage of Population Employed in Office & Administration in Magnolia
9.4%
12.3%
Zip Codes with the Highest Percentage of Population Employed in Office & Administration in Magnolia, TX
| Zip Code | % Employed | vs State | vs National | |
| 1. | 77355 | 12.3% | 11.0%(+1.31)#613 | 10.9%(+1.42)#9,895 |
| 2. | 77354 | 9.4% | 11.0%(-1.54)#1,157 | 10.9%(-1.42)#18,954 |
1
Common Questions
What are the Top Zip Codes with the Highest Percentage of Population Employed in Office & Administration in Magnolia, TX?
Top Zip Codes with the Highest Percentage of Population Employed in Office & Administration in Magnolia, TX are:
What zip code has the Highest Percentage of Population Employed in Office & Administration in Magnolia, TX?
77355 has the Highest Percentage of Population Employed in Office & Administration in Magnolia, TX with 12.3%.
What is the Percentage of Population Employed in Office & Administration in Magnolia, TX?
Percentage of Population Employed in Office & Administration in Magnolia is 8.7%.
What is the Percentage of Population Employed in Office & Administration in Texas?
Percentage of Population Employed in Office & Administration in Texas is 11.0%.
What is the Percentage of Population Employed in Office & Administration in the United States?
Percentage of Population Employed in Office & Administration in the United States is 10.9%.