Zip Codes with the Highest Percentage of Population Employed in Office & Administration in Missouri City, TX
RELATED REPORTS & OPTIONS
Office & Administration
Missouri City
Compare Zip Codes
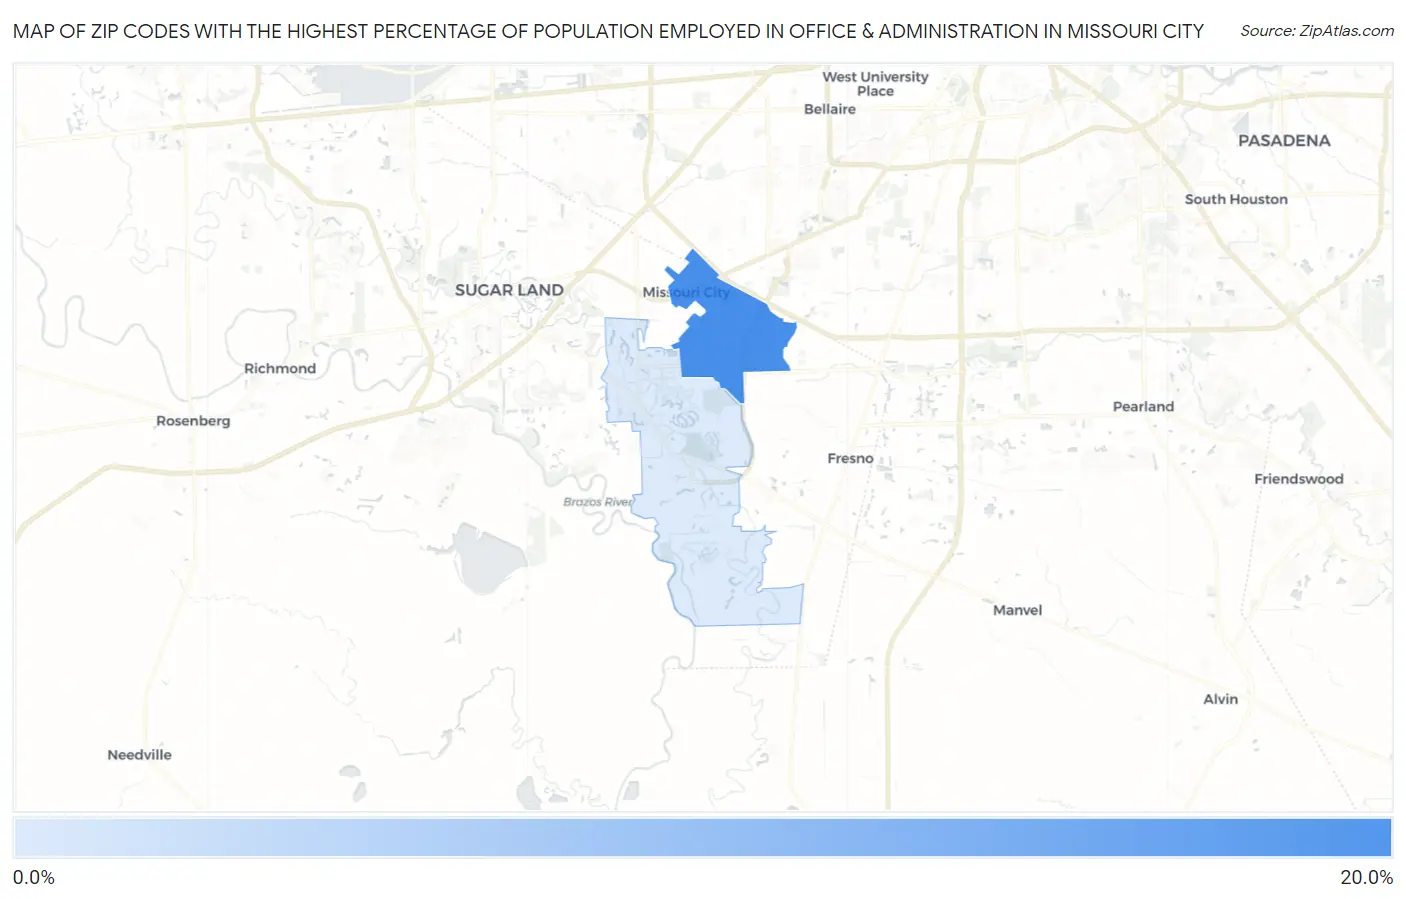
Map of Zip Codes with the Highest Percentage of Population Employed in Office & Administration in Missouri City
7.9%
17.7%
Zip Codes with the Highest Percentage of Population Employed in Office & Administration in Missouri City, TX
| Zip Code | % Employed | vs State | vs National | |
| 1. | 77489 | 17.7% | 11.0%(+6.75)#144 | 10.9%(+6.87)#2,477 |
| 2. | 77459 | 7.9% | 11.0%(-3.06)#1,390 | 10.9%(-2.94)#23,225 |
1
Common Questions
What are the Top Zip Codes with the Highest Percentage of Population Employed in Office & Administration in Missouri City, TX?
Top Zip Codes with the Highest Percentage of Population Employed in Office & Administration in Missouri City, TX are:
What zip code has the Highest Percentage of Population Employed in Office & Administration in Missouri City, TX?
77489 has the Highest Percentage of Population Employed in Office & Administration in Missouri City, TX with 17.7%.
What is the Percentage of Population Employed in Office & Administration in Missouri City, TX?
Percentage of Population Employed in Office & Administration in Missouri City is 12.2%.
What is the Percentage of Population Employed in Office & Administration in Texas?
Percentage of Population Employed in Office & Administration in Texas is 11.0%.
What is the Percentage of Population Employed in Office & Administration in the United States?
Percentage of Population Employed in Office & Administration in the United States is 10.9%.