Whiteface, TX Map & Demographics
Whiteface Map
Whiteface Overview
$23,597
PER CAPITA INCOME
$53,646
AVG FAMILY INCOME
$52,813
AVG HOUSEHOLD INCOME
36.9%
WAGE / INCOME GAP [ % ]
63.1¢/ $1
WAGE / INCOME GAP [ $ ]
0.40
INEQUALITY / GINI INDEX
423
TOTAL POPULATION
176
MALE POPULATION
247
FEMALE POPULATION
71.26
MALES / 100 FEMALES
140.34
FEMALES / 100 MALES
37.5
MEDIAN AGE
2.8
AVG FAMILY SIZE
2.6
AVG HOUSEHOLD SIZE
176
LABOR FORCE [ PEOPLE ]
55.3%
PERCENT IN LABOR FORCE
8.0%
UNEMPLOYMENT RATE
Whiteface Zip Codes
Whiteface Area Codes
Income in Whiteface
Income Overview in Whiteface
Per Capita Income in Whiteface is $23,597, while median incomes of families and households are $53,646 and $52,813 respectively.
| Characteristic | Number | Measure |
| Per Capita Income | 423 | $23,597 |
| Median Family Income | 137 | $53,646 |
| Mean Family Income | 137 | $68,303 |
| Median Household Income | 163 | $52,813 |
| Mean Household Income | 163 | $64,064 |
| Income Deficit | 137 | $0 |
| Wage / Income Gap (%) | 423 | 36.86% |
| Wage / Income Gap ($) | 423 | 63.14¢ per $1 |
| Gini / Inequality Index | 423 | 0.40 |
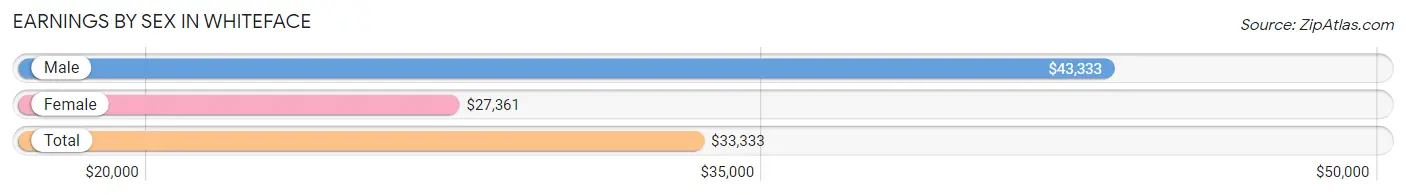
Earnings by Sex in Whiteface
Average Earnings in Whiteface are $33,333, $43,333 for men and $27,361 for women, a difference of 36.9%.
| Sex | Number | Average Earnings |
| Male | 84 (47.7%) | $43,333 |
| Female | 92 (52.3%) | $27,361 |
| Total | 176 (100.0%) | $33,333 |
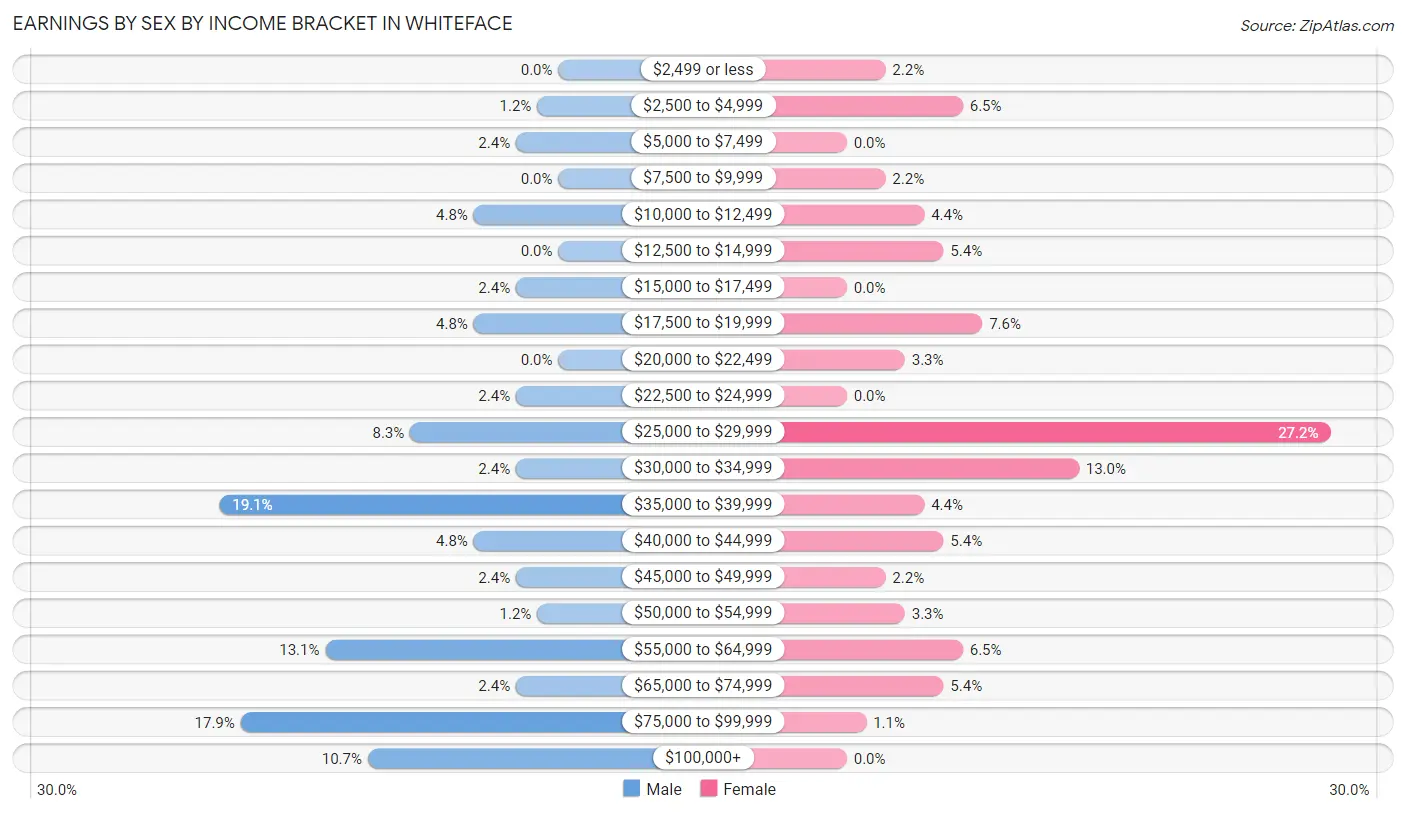
Earnings by Sex by Income Bracket in Whiteface
The most common earnings brackets in Whiteface are $35,000 to $39,999 for men (16 | 19.1%) and $25,000 to $29,999 for women (25 | 27.2%).
| Income | Male | Female |
| $2,499 or less | 0 (0.0%) | 2 (2.2%) |
| $2,500 to $4,999 | 1 (1.2%) | 6 (6.5%) |
| $5,000 to $7,499 | 2 (2.4%) | 0 (0.0%) |
| $7,500 to $9,999 | 0 (0.0%) | 2 (2.2%) |
| $10,000 to $12,499 | 4 (4.8%) | 4 (4.3%) |
| $12,500 to $14,999 | 0 (0.0%) | 5 (5.4%) |
| $15,000 to $17,499 | 2 (2.4%) | 0 (0.0%) |
| $17,500 to $19,999 | 4 (4.8%) | 7 (7.6%) |
| $20,000 to $22,499 | 0 (0.0%) | 3 (3.3%) |
| $22,500 to $24,999 | 2 (2.4%) | 0 (0.0%) |
| $25,000 to $29,999 | 7 (8.3%) | 25 (27.2%) |
| $30,000 to $34,999 | 2 (2.4%) | 12 (13.0%) |
| $35,000 to $39,999 | 16 (19.1%) | 4 (4.3%) |
| $40,000 to $44,999 | 4 (4.8%) | 5 (5.4%) |
| $45,000 to $49,999 | 2 (2.4%) | 2 (2.2%) |
| $50,000 to $54,999 | 1 (1.2%) | 3 (3.3%) |
| $55,000 to $64,999 | 11 (13.1%) | 6 (6.5%) |
| $65,000 to $74,999 | 2 (2.4%) | 5 (5.4%) |
| $75,000 to $99,999 | 15 (17.9%) | 1 (1.1%) |
| $100,000+ | 9 (10.7%) | 0 (0.0%) |
| Total | 84 (100.0%) | 92 (100.0%) |
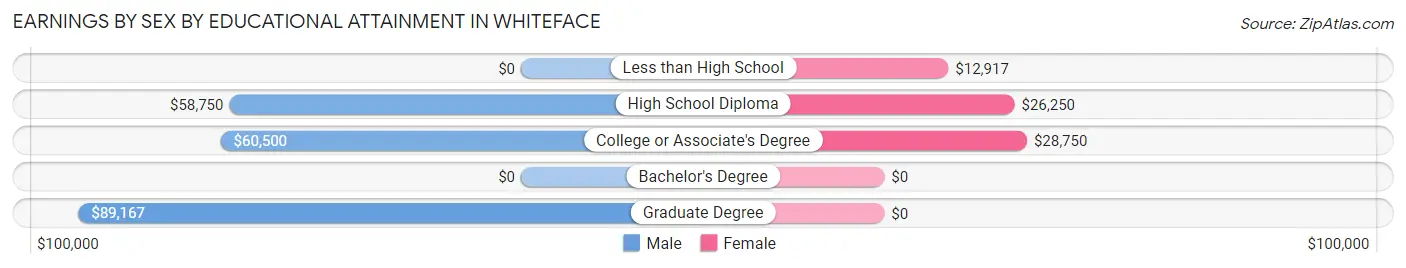
Earnings by Sex by Educational Attainment in Whiteface
Average earnings in Whiteface are $58,750 for men and $27,500 for women, a difference of 53.2%. Men with an educational attainment of graduate degree enjoy the highest average annual earnings of $89,167, while those with high school diploma education earn the least with $58,750. Women with an educational attainment of college or associate's degree earn the most with the average annual earnings of $28,750, while those with less than high school education have the smallest earnings of $12,917.
| Educational Attainment | Male Income | Female Income |
| Less than High School | - | - |
| High School Diploma | $58,750 | $26,250 |
| College or Associate's Degree | $60,500 | $28,750 |
| Bachelor's Degree | - | - |
| Graduate Degree | $89,167 | $0 |
| Total | $58,750 | $27,500 |
Family Income in Whiteface
Family Income Brackets in Whiteface
According to the Whiteface family income data, there are 38 families falling into the $35,000 to $49,999 income range, which is the most common income bracket and makes up 27.7% of all families. Conversely, the $200,000+ income bracket is the least frequent group with only 1 families (0.7%) belonging to this category.
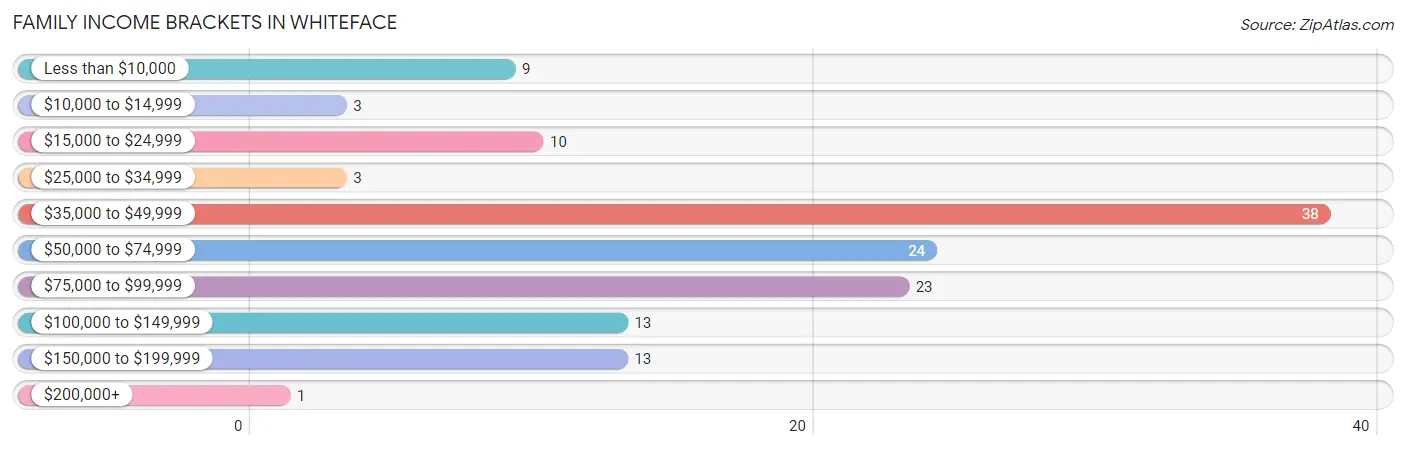
| Income Bracket | # Families | % Families |
| Less than $10,000 | 9 | 6.6% |
| $10,000 to $14,999 | 3 | 2.2% |
| $15,000 to $24,999 | 10 | 7.3% |
| $25,000 to $34,999 | 3 | 2.2% |
| $35,000 to $49,999 | 38 | 27.7% |
| $50,000 to $74,999 | 24 | 17.5% |
| $75,000 to $99,999 | 23 | 16.8% |
| $100,000 to $149,999 | 13 | 9.5% |
| $150,000 to $199,999 | 13 | 9.5% |
| $200,000+ | 1 | 0.7% |
Family Income by Famaliy Size in Whiteface
2-person families (69 | 50.4%) account for the highest median family income in Whiteface with $44,583 per family, while 2-person families (69 | 50.4%) have the highest median income of $22,292 per family member.
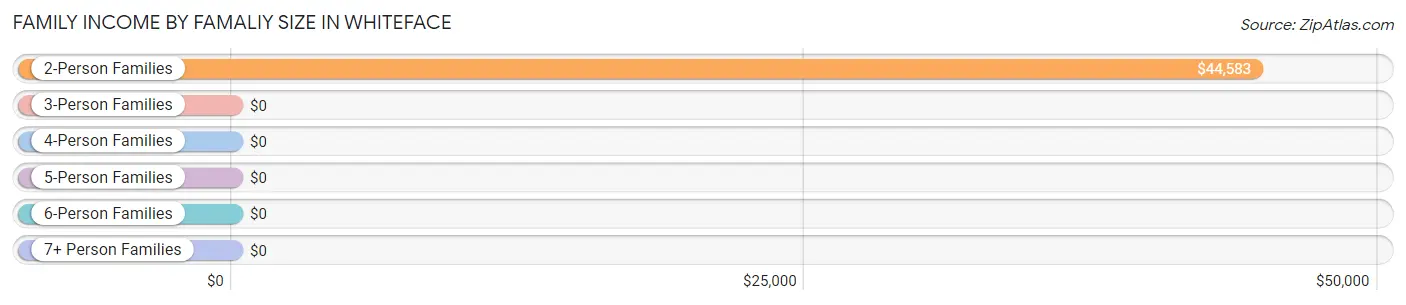
| Income Bracket | # Families | Median Income |
| 2-Person Families | 69 (50.4%) | $44,583 |
| 3-Person Families | 31 (22.6%) | $0 |
| 4-Person Families | 16 (11.7%) | $0 |
| 5-Person Families | 15 (11.0%) | $0 |
| 6-Person Families | 2 (1.5%) | $0 |
| 7+ Person Families | 4 (2.9%) | $0 |
| Total | 137 (100.0%) | $53,646 |
Family Income by Number of Earners in Whiteface
The median family income in Whiteface is $53,646, with families comprising 3+ earners (8) having the highest median family income of $156,250, while families with no earners (39) have the lowest median family income of $36,417, accounting for 5.8% and 28.5% of families, respectively.
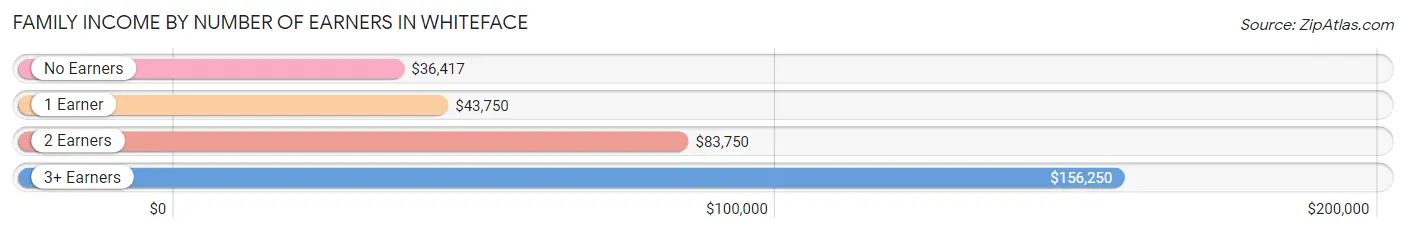
| Number of Earners | # Families | Median Income |
| No Earners | 39 (28.5%) | $36,417 |
| 1 Earner | 52 (38.0%) | $43,750 |
| 2 Earners | 38 (27.7%) | $83,750 |
| 3+ Earners | 8 (5.8%) | $156,250 |
| Total | 137 (100.0%) | $53,646 |
Household Income in Whiteface
Household Income Brackets in Whiteface
With 42 households falling in the category, the $35,000 to $49,999 income range is the most frequent in Whiteface, accounting for 25.8% of all households. In contrast, only 1 households (0.6%) fall into the $200,000+ income bracket, making it the least populous group.
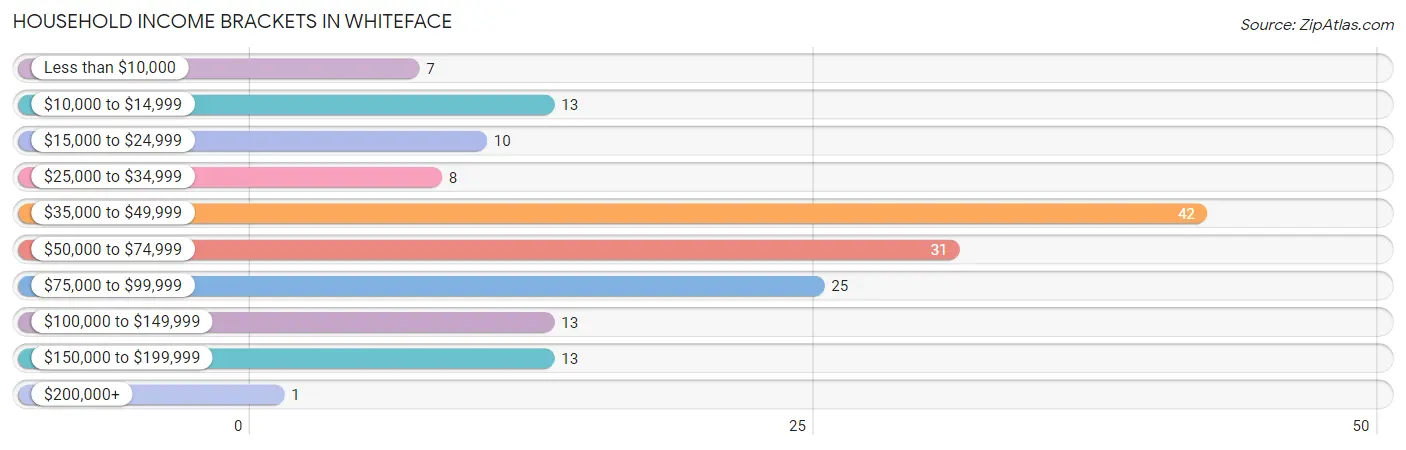
| Income Bracket | # Households | % Households |
| Less than $10,000 | 7 | 4.3% |
| $10,000 to $14,999 | 13 | 8.0% |
| $15,000 to $24,999 | 10 | 6.1% |
| $25,000 to $34,999 | 8 | 4.9% |
| $35,000 to $49,999 | 42 | 25.8% |
| $50,000 to $74,999 | 31 | 19.0% |
| $75,000 to $99,999 | 25 | 15.3% |
| $100,000 to $149,999 | 13 | 8.0% |
| $150,000 to $199,999 | 13 | 8.0% |
| $200,000+ | 1 | 0.6% |
Household Income by Householder Age in Whiteface
The median household income in Whiteface is $52,813, with the highest median household income of $61,250 found in the 45 to 64 years age bracket for the primary householder. A total of 74 households (45.4%) fall into this category. Meanwhile, the 15 to 24 years age bracket for the primary householder has the lowest median household income of $0, with 5 households (3.1%) in this group.
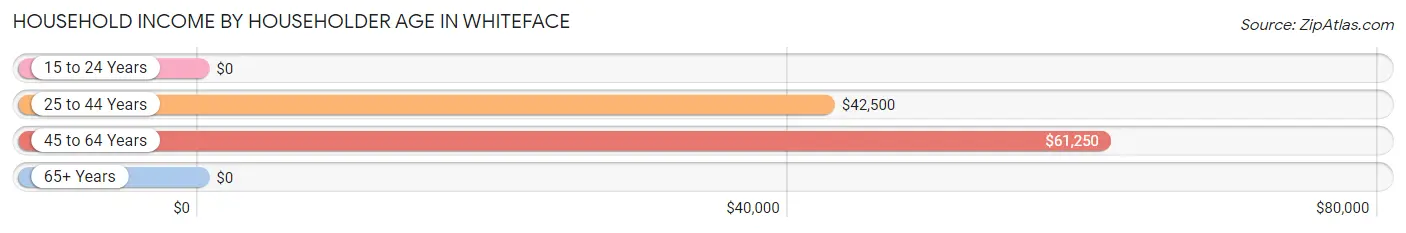
| Income Bracket | # Households | Median Income |
| 15 to 24 Years | 5 (3.1%) | $0 |
| 25 to 44 Years | 48 (29.4%) | $42,500 |
| 45 to 64 Years | 74 (45.4%) | $61,250 |
| 65+ Years | 36 (22.1%) | $0 |
| Total | 163 (100.0%) | $52,813 |
Poverty in Whiteface
Income Below Poverty by Sex and Age in Whiteface
With 6.2% poverty level for males and 22.3% for females among the residents of Whiteface, 16 and 17 year old males and 18 to 24 year old females are the most vulnerable to poverty, with 3 males (50.0%) and 11 females (78.6%) in their respective age groups living below the poverty level.
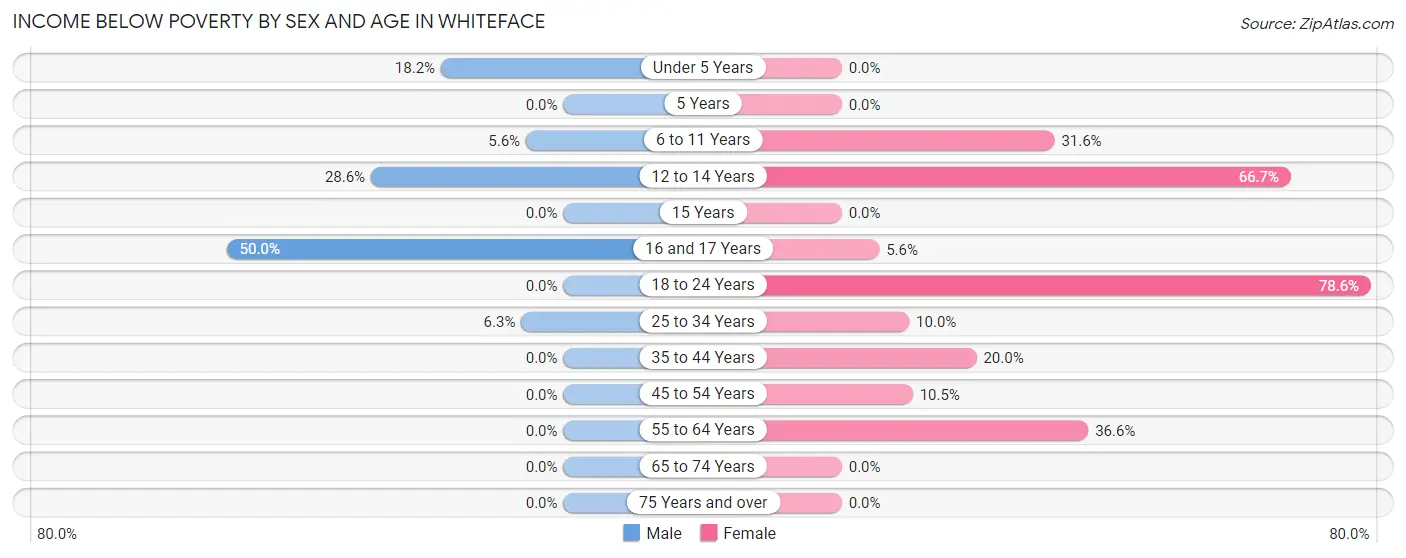
| Age Bracket | Male | Female |
| Under 5 Years | 2 (18.2%) | 0 (0.0%) |
| 5 Years | 0 (0.0%) | 0 (0.0%) |
| 6 to 11 Years | 1 (5.6%) | 6 (31.6%) |
| 12 to 14 Years | 4 (28.6%) | 10 (66.7%) |
| 15 Years | 0 (0.0%) | 0 (0.0%) |
| 16 and 17 Years | 3 (50.0%) | 1 (5.6%) |
| 18 to 24 Years | 0 (0.0%) | 11 (78.6%) |
| 25 to 34 Years | 1 (6.2%) | 2 (10.0%) |
| 35 to 44 Years | 0 (0.0%) | 6 (20.0%) |
| 45 to 54 Years | 0 (0.0%) | 4 (10.5%) |
| 55 to 64 Years | 0 (0.0%) | 15 (36.6%) |
| 65 to 74 Years | 0 (0.0%) | 0 (0.0%) |
| 75 Years and over | 0 (0.0%) | 0 (0.0%) |
| Total | 11 (6.2%) | 55 (22.3%) |
Income Above Poverty by Sex and Age in Whiteface
According to the poverty statistics in Whiteface, males aged 15 years and females aged under 5 years are the age groups that are most secure financially, with 100.0% of males and 100.0% of females in these age groups living above the poverty line.
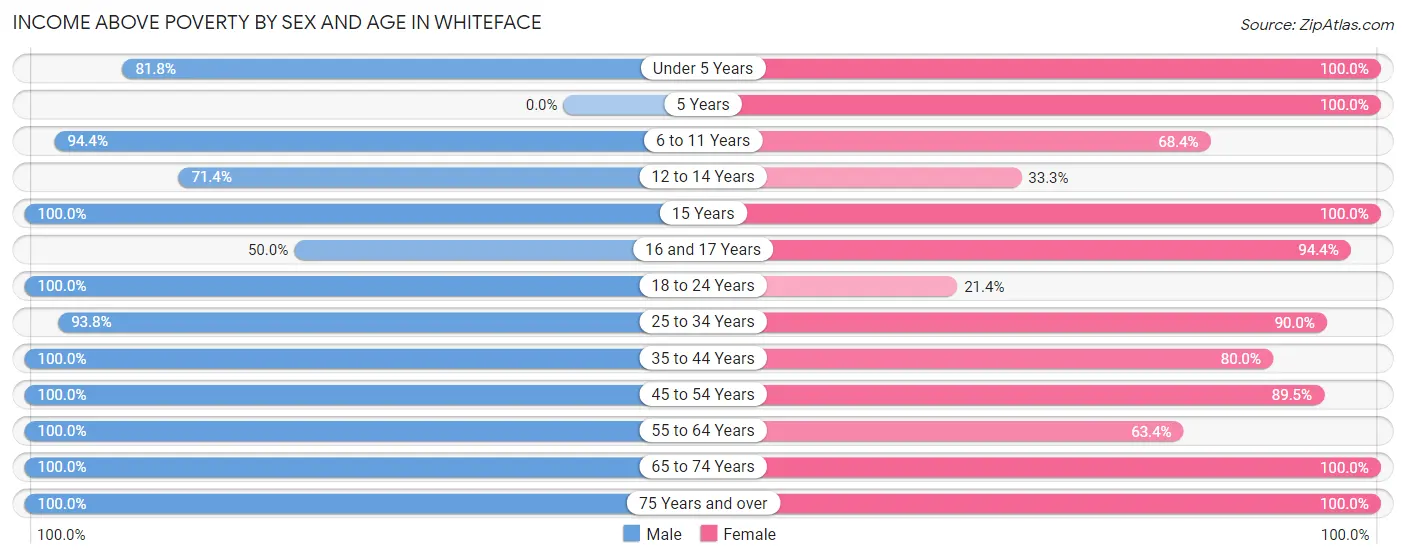
| Age Bracket | Male | Female |
| Under 5 Years | 9 (81.8%) | 13 (100.0%) |
| 5 Years | 0 (0.0%) | 6 (100.0%) |
| 6 to 11 Years | 17 (94.4%) | 13 (68.4%) |
| 12 to 14 Years | 10 (71.4%) | 5 (33.3%) |
| 15 Years | 3 (100.0%) | 6 (100.0%) |
| 16 and 17 Years | 3 (50.0%) | 17 (94.4%) |
| 18 to 24 Years | 19 (100.0%) | 3 (21.4%) |
| 25 to 34 Years | 15 (93.8%) | 18 (90.0%) |
| 35 to 44 Years | 17 (100.0%) | 24 (80.0%) |
| 45 to 54 Years | 17 (100.0%) | 34 (89.5%) |
| 55 to 64 Years | 13 (100.0%) | 26 (63.4%) |
| 65 to 74 Years | 17 (100.0%) | 22 (100.0%) |
| 75 Years and over | 25 (100.0%) | 5 (100.0%) |
| Total | 165 (93.8%) | 192 (77.7%) |
Income Below Poverty Among Married-Couple Families in Whiteface
The poverty statistics for married-couple families in Whiteface show that 1.0% or 1 of the total 102 families live below the poverty line. Families with 3 or 4 children have the highest poverty rate of 9.1%, comprising of 1 families. On the other hand, families with no children have the lowest poverty rate of 0.0%, which includes 0 families.
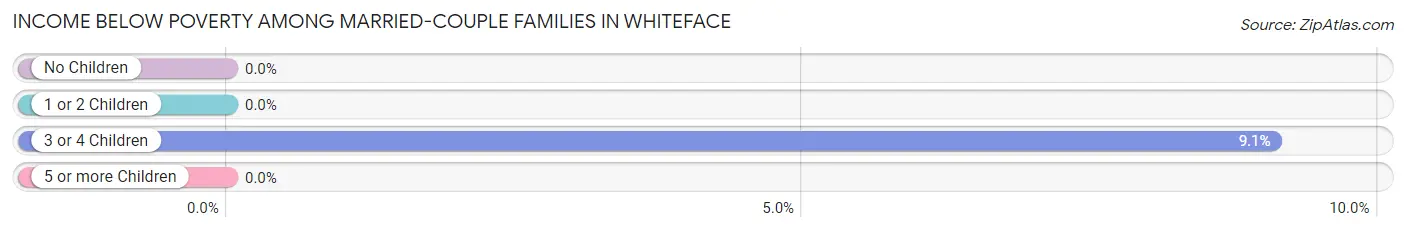
| Children | Above Poverty | Below Poverty |
| No Children | 65 (100.0%) | 0 (0.0%) |
| 1 or 2 Children | 22 (100.0%) | 0 (0.0%) |
| 3 or 4 Children | 10 (90.9%) | 1 (9.1%) |
| 5 or more Children | 4 (100.0%) | 0 (0.0%) |
| Total | 101 (99.0%) | 1 (1.0%) |
Income Below Poverty Among Single-Parent Households in Whiteface
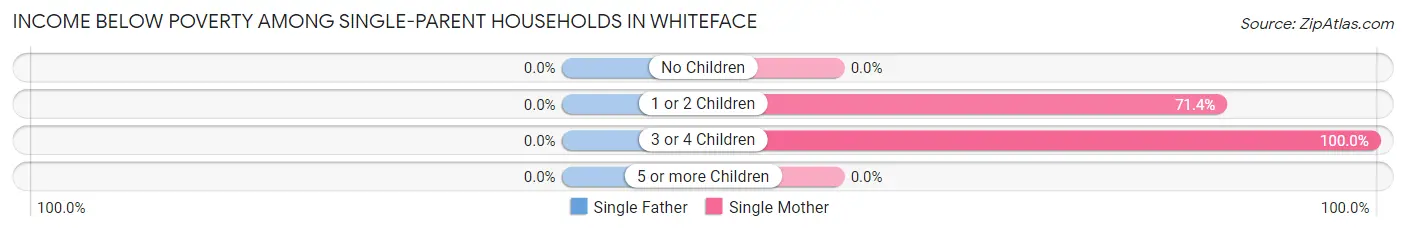
| Children | Single Father | Single Mother |
| No Children | 0 (0.0%) | 0 (0.0%) |
| 1 or 2 Children | 0 (0.0%) | 15 (71.4%) |
| 3 or 4 Children | 0 (0.0%) | 3 (100.0%) |
| 5 or more Children | 0 (0.0%) | 0 (0.0%) |
| Total | 0 (0.0%) | 18 (72.0%) |
Income Below Poverty Among Married-Couple vs Single-Parent Households in Whiteface
The poverty data for Whiteface shows that 1 of the married-couple family households (1.0%) and 18 of the single-parent households (51.4%) are living below the poverty level. Within the married-couple family households, those with 3 or 4 children have the highest poverty rate, with 1 households (9.1%) falling below the poverty line. Among the single-parent households, those with 3 or 4 children have the highest poverty rate, with 3 household (100.0%) living below poverty.
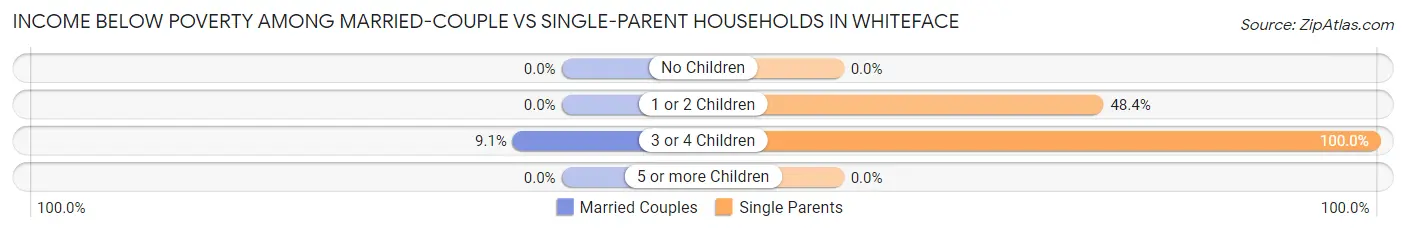
| Children | Married-Couple Families | Single-Parent Households |
| No Children | 0 (0.0%) | 0 (0.0%) |
| 1 or 2 Children | 0 (0.0%) | 15 (48.4%) |
| 3 or 4 Children | 1 (9.1%) | 3 (100.0%) |
| 5 or more Children | 0 (0.0%) | 0 (0.0%) |
| Total | 1 (1.0%) | 18 (51.4%) |
Race in Whiteface
The most populous races in Whiteface are White / Caucasian (248 | 58.6%), Hispanic or Latino (234 | 55.3%), and Two or more Races (130 | 30.7%).
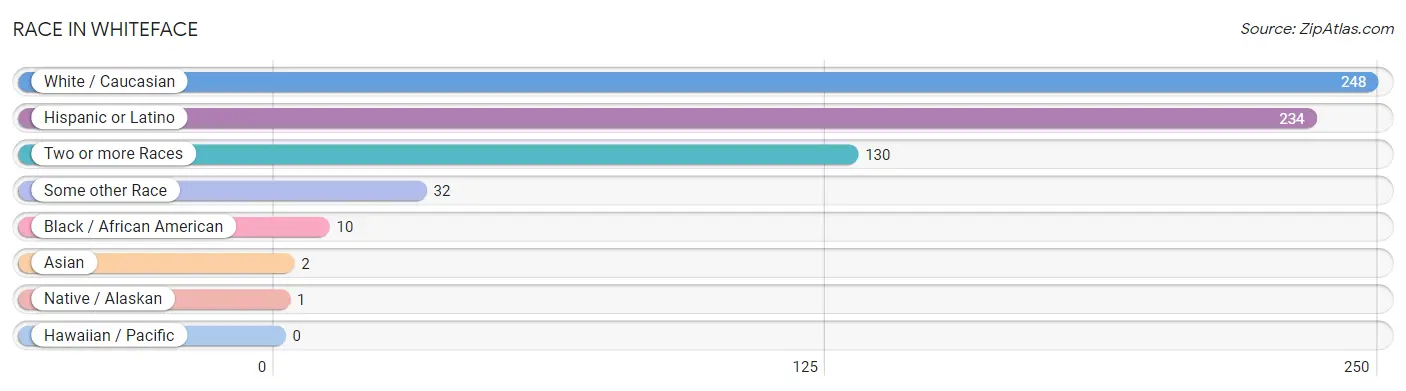
| Race | # Population | % Population |
| Asian | 2 | 0.5% |
| Black / African American | 10 | 2.4% |
| Hawaiian / Pacific | 0 | 0.0% |
| Hispanic or Latino | 234 | 55.3% |
| Native / Alaskan | 1 | 0.2% |
| White / Caucasian | 248 | 58.6% |
| Two or more Races | 130 | 30.7% |
| Some other Race | 32 | 7.6% |
| Total | 423 | 100.0% |
Ancestry in Whiteface
The most populous ancestries reported in Whiteface are Mexican (231 | 54.6%), German (61 | 14.4%), Irish (46 | 10.9%), English (39 | 9.2%), and American (28 | 6.6%), together accounting for 95.7% of all Whiteface residents.
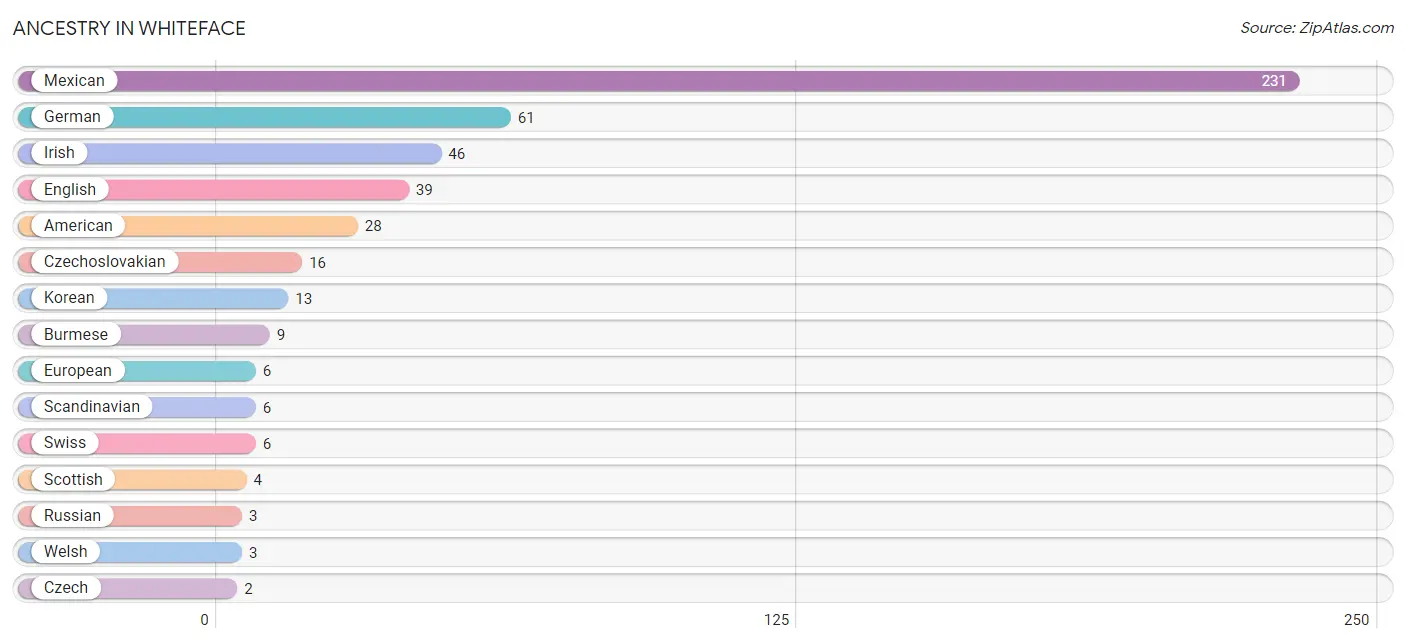
| Ancestry | # Population | % Population |
| American | 28 | 6.6% |
| Burmese | 9 | 2.1% |
| Cherokee | 1 | 0.2% |
| Czech | 2 | 0.5% |
| Czechoslovakian | 16 | 3.8% |
| English | 39 | 9.2% |
| European | 6 | 1.4% |
| German | 61 | 14.4% |
| Irish | 46 | 10.9% |
| Italian | 2 | 0.5% |
| Korean | 13 | 3.1% |
| Mexican | 231 | 54.6% |
| Mexican American Indian | 1 | 0.2% |
| Russian | 3 | 0.7% |
| Scandinavian | 6 | 1.4% |
| Scotch-Irish | 1 | 0.2% |
| Scottish | 4 | 0.9% |
| Swiss | 6 | 1.4% |
| Welsh | 3 | 0.7% | View All 19 Rows |
Immigrants in Whiteface
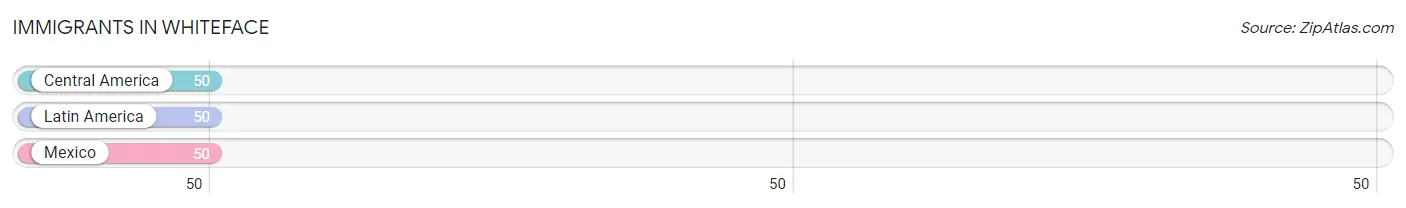
The most numerous immigrant groups reported in Whiteface came from Central America (50 | 11.8%), Latin America (50 | 11.8%), and Mexico (50 | 11.8%), together accounting for 35.5% of all Whiteface residents.
| Immigration Origin | # Population | % Population |
| Central America | 50 | 11.8% |
| Latin America | 50 | 11.8% |
| Mexico | 50 | 11.8% | View All 3 Rows |
Sex and Age in Whiteface
Sex and Age in Whiteface
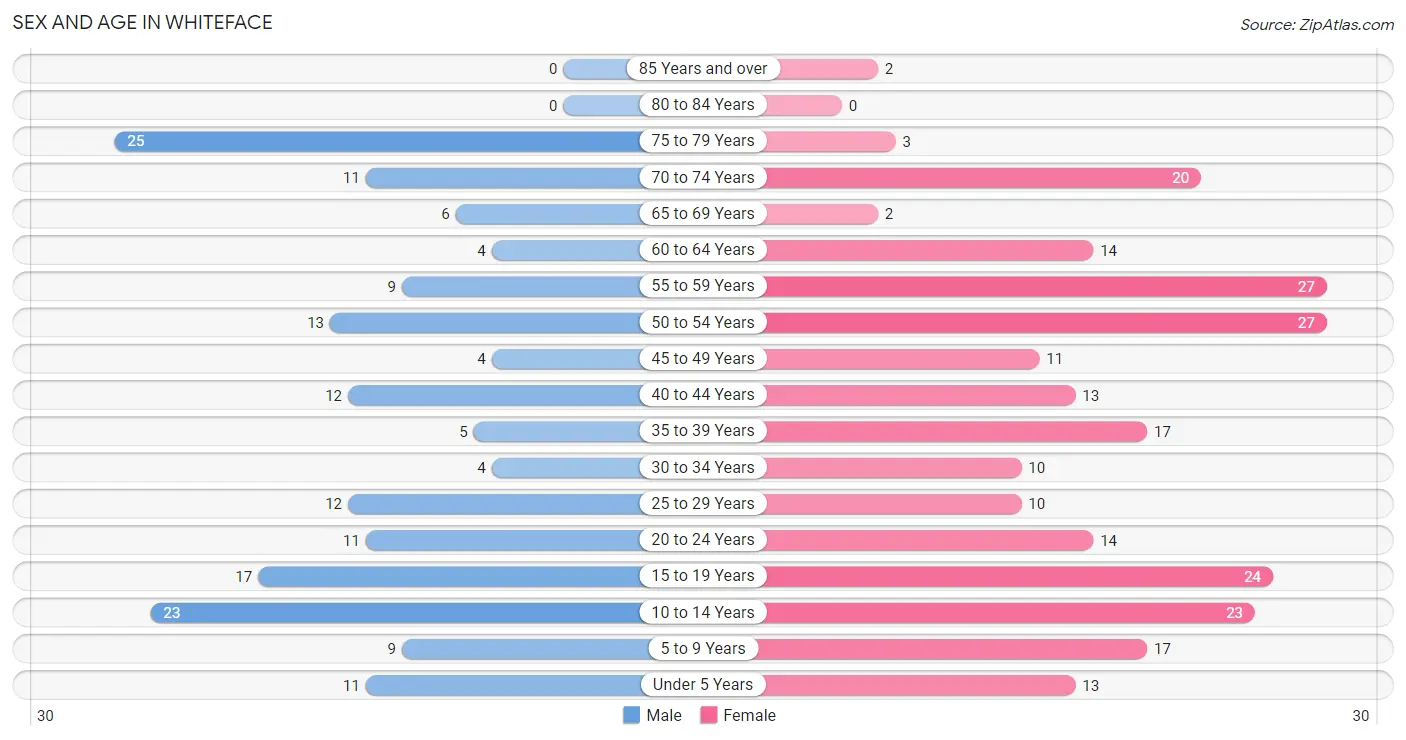
The most populous age groups in Whiteface are 75 to 79 Years (25 | 14.2%) for men and 50 to 54 Years (27 | 10.9%) for women.
| Age Bracket | Male | Female |
| Under 5 Years | 11 (6.2%) | 13 (5.3%) |
| 5 to 9 Years | 9 (5.1%) | 17 (6.9%) |
| 10 to 14 Years | 23 (13.1%) | 23 (9.3%) |
| 15 to 19 Years | 17 (9.7%) | 24 (9.7%) |
| 20 to 24 Years | 11 (6.2%) | 14 (5.7%) |
| 25 to 29 Years | 12 (6.8%) | 10 (4.1%) |
| 30 to 34 Years | 4 (2.3%) | 10 (4.1%) |
| 35 to 39 Years | 5 (2.8%) | 17 (6.9%) |
| 40 to 44 Years | 12 (6.8%) | 13 (5.3%) |
| 45 to 49 Years | 4 (2.3%) | 11 (4.4%) |
| 50 to 54 Years | 13 (7.4%) | 27 (10.9%) |
| 55 to 59 Years | 9 (5.1%) | 27 (10.9%) |
| 60 to 64 Years | 4 (2.3%) | 14 (5.7%) |
| 65 to 69 Years | 6 (3.4%) | 2 (0.8%) |
| 70 to 74 Years | 11 (6.2%) | 20 (8.1%) |
| 75 to 79 Years | 25 (14.2%) | 3 (1.2%) |
| 80 to 84 Years | 0 (0.0%) | 0 (0.0%) |
| 85 Years and over | 0 (0.0%) | 2 (0.8%) |
| Total | 176 (100.0%) | 247 (100.0%) |
Families and Households in Whiteface
Median Family Size in Whiteface
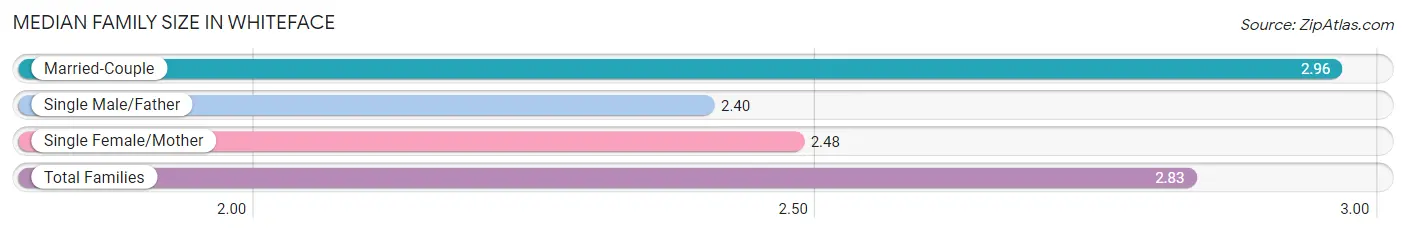
The median family size in Whiteface is 2.83 persons per family, with married-couple families (102 | 74.5%) accounting for the largest median family size of 2.96 persons per family. On the other hand, single male/father families (10 | 7.3%) represent the smallest median family size with 2.40 persons per family.
| Family Type | # Families | Family Size |
| Married-Couple | 102 (74.5%) | 2.96 |
| Single Male/Father | 10 (7.3%) | 2.40 |
| Single Female/Mother | 25 (18.2%) | 2.48 |
| Total Families | 137 (100.0%) | 2.83 |
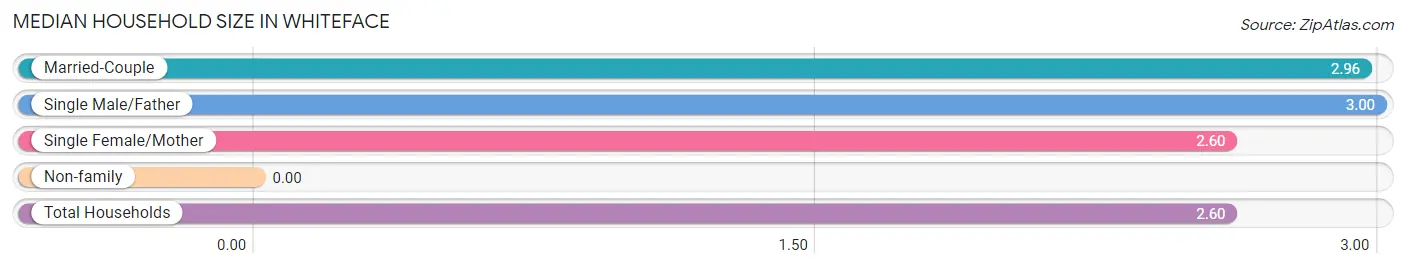
Median Household Size in Whiteface
| Household Type | # Households | Household Size |
| Married-Couple | 102 (62.6%) | 2.96 |
| Single Male/Father | 10 (6.1%) | 3.00 |
| Single Female/Mother | 25 (15.3%) | 2.60 |
| Non-family | 26 (16.0%) | - |
| Total Households | 163 (100.0%) | 2.60 |
Household Size by Marriage Status in Whiteface
Out of a total of 163 households in Whiteface, 137 (84.1%) are family households, while 26 (16.0%) are nonfamily households. The most numerous type of family households are 2-person households, comprising 64, and the most common type of nonfamily households are 1-person households, comprising 26.
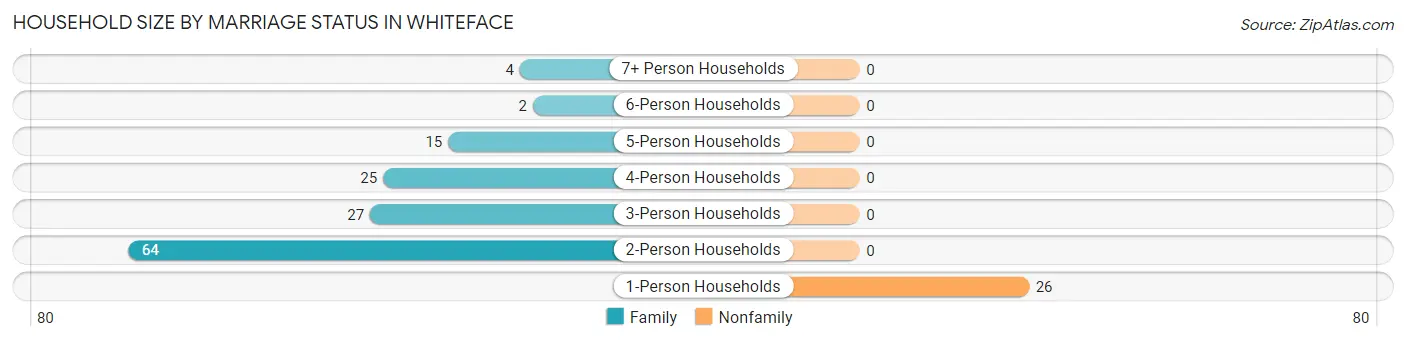
| Household Size | Family Households | Nonfamily Households |
| 1-Person Households | - | 26 (16.0%) |
| 2-Person Households | 64 (39.3%) | 0 (0.0%) |
| 3-Person Households | 27 (16.6%) | 0 (0.0%) |
| 4-Person Households | 25 (15.3%) | 0 (0.0%) |
| 5-Person Households | 15 (9.2%) | 0 (0.0%) |
| 6-Person Households | 2 (1.2%) | 0 (0.0%) |
| 7+ Person Households | 4 (2.5%) | 0 (0.0%) |
| Total | 137 (84.1%) | 26 (16.0%) |
Female Fertility in Whiteface
Fertility by Age in Whiteface
Average fertility rate in Whiteface is 61.0 births per 1,000 women. Women in the age bracket of 20 to 34 years have the highest fertility rate with 176.0 births per 1,000 women. Women in the age bracket of 20 to 34 years acount for 100.0% of all women with births.
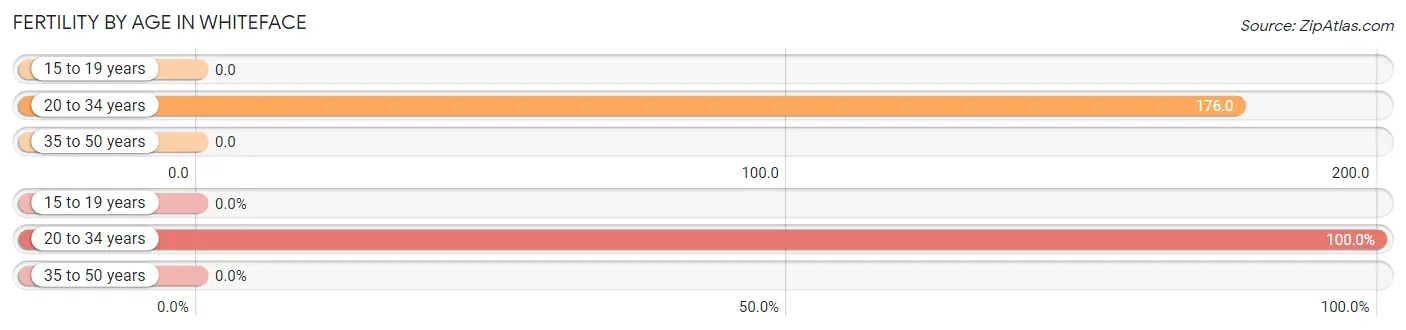
| Age Bracket | Women with Births | Births / 1,000 Women |
| 15 to 19 years | 0 (0.0%) | 0.0 |
| 20 to 34 years | 6 (100.0%) | 176.0 |
| 35 to 50 years | 0 (0.0%) | 0.0 |
| Total | 6 (100.0%) | 61.0 |
Fertility by Age by Marriage Status in Whiteface
16.7% of women with births (6) in Whiteface are married. The highest percentage of unmarried women with births falls into 20 to 34 years age bracket with 83.3% of them unmarried at the time of birth, while the lowest percentage of unmarried women with births belong to 20 to 34 years age bracket with 83.3% of them unmarried.
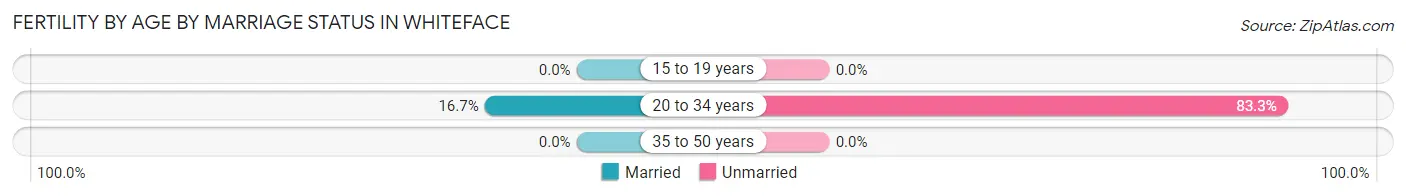
| Age Bracket | Married | Unmarried |
| 15 to 19 years | 0 (0.0%) | 0 (0.0%) |
| 20 to 34 years | 1 (16.7%) | 5 (83.3%) |
| 35 to 50 years | 0 (0.0%) | 0 (0.0%) |
| Total | 1 (16.7%) | 5 (83.3%) |
Fertility by Education in Whiteface
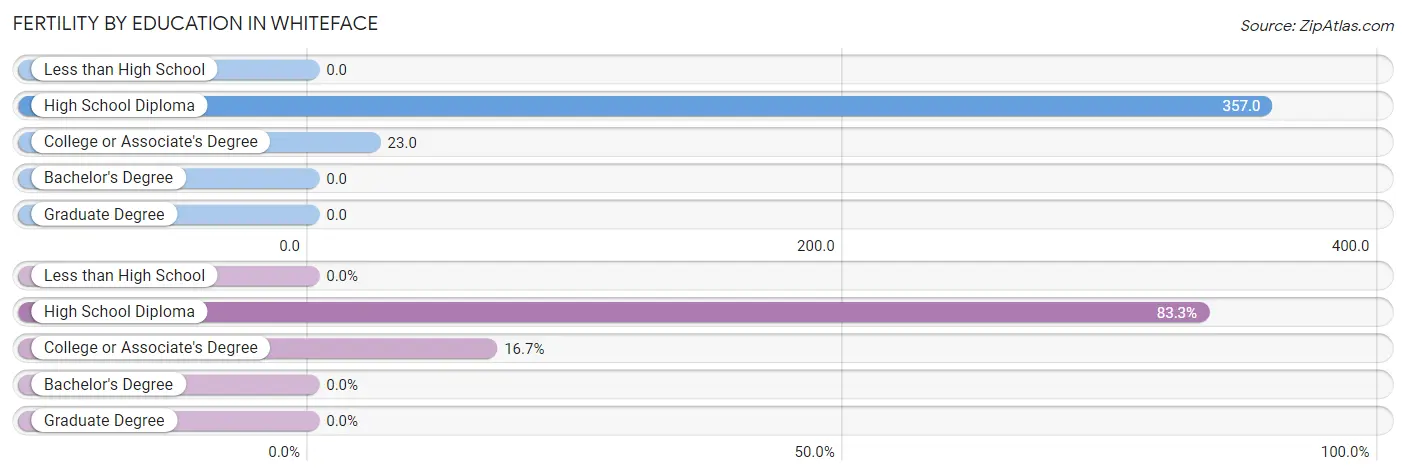
| Educational Attainment | Women with Births | Births / 1,000 Women |
| Less than High School | 0 (0.0%) | 0.0 |
| High School Diploma | 5 (83.3%) | 357.0 |
| College or Associate's Degree | 1 (16.7%) | 23.0 |
| Bachelor's Degree | 0 (0.0%) | 0.0 |
| Graduate Degree | 0 (0.0%) | 0.0 |
| Total | 6 (100.0%) | 61.0 |
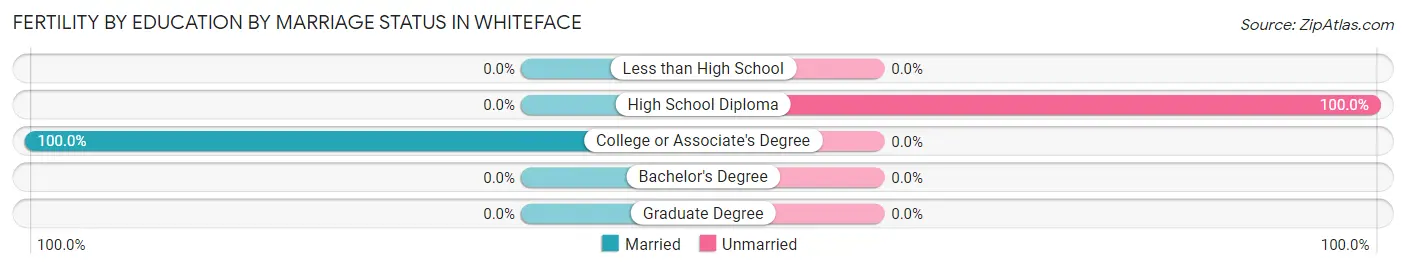
Fertility by Education by Marriage Status in Whiteface
83.3% of women with births in Whiteface are unmarried. Women with the educational attainment of college or associate's degree are most likely to be married with 100.0% of them married at childbirth, while women with the educational attainment of high school diploma are least likely to be married with 100.0% of them unmarried at childbirth.
| Educational Attainment | Married | Unmarried |
| Less than High School | 0 (0.0%) | 0 (0.0%) |
| High School Diploma | 0 (0.0%) | 5 (100.0%) |
| College or Associate's Degree | 1 (100.0%) | 0 (0.0%) |
| Bachelor's Degree | 0 (0.0%) | 0 (0.0%) |
| Graduate Degree | 0 (0.0%) | 0 (0.0%) |
| Total | 1 (16.7%) | 5 (83.3%) |
Employment Characteristics in Whiteface
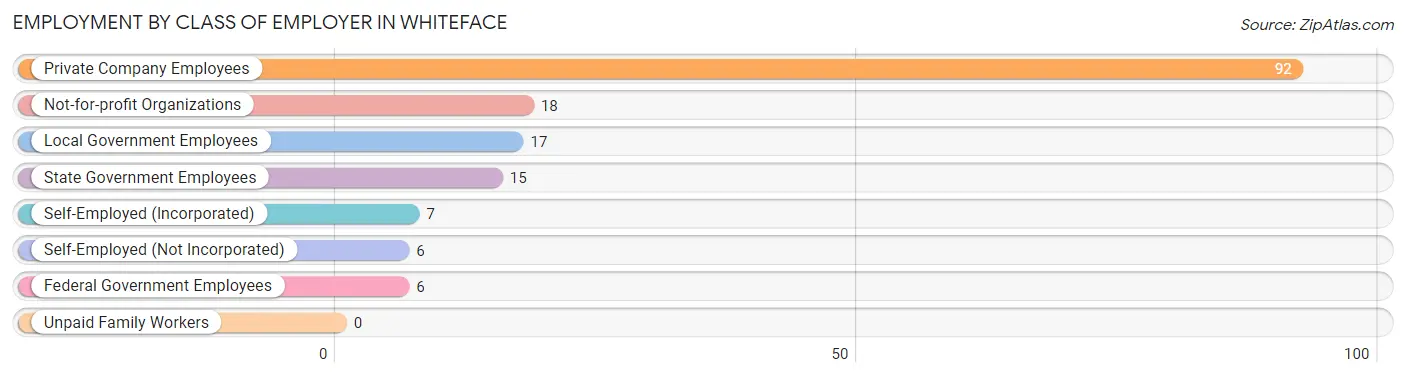
Employment by Class of Employer in Whiteface
Among the 161 employed individuals in Whiteface, private company employees (92 | 57.1%), not-for-profit organizations (18 | 11.2%), and local government employees (17 | 10.6%) make up the most common classes of employment.
| Employer Class | # Employees | % Employees |
| Private Company Employees | 92 | 57.1% |
| Self-Employed (Incorporated) | 7 | 4.3% |
| Self-Employed (Not Incorporated) | 6 | 3.7% |
| Not-for-profit Organizations | 18 | 11.2% |
| Local Government Employees | 17 | 10.6% |
| State Government Employees | 15 | 9.3% |
| Federal Government Employees | 6 | 3.7% |
| Unpaid Family Workers | 0 | 0.0% |
| Total | 161 | 100.0% |
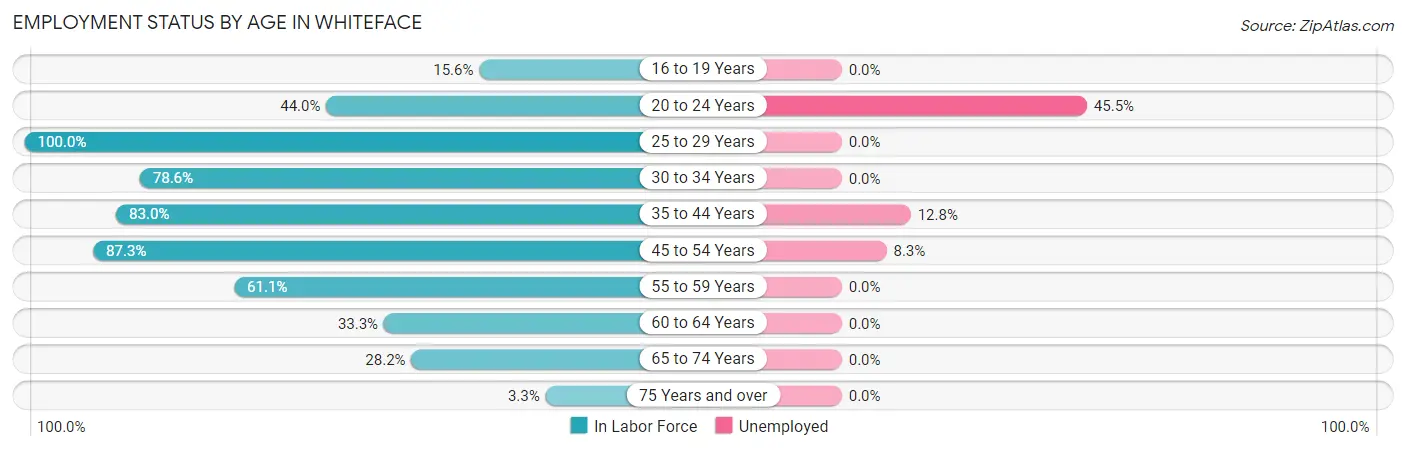
Employment Status by Age in Whiteface
According to the labor force statistics for Whiteface, out of the total population over 16 years of age (318), 55.3% or 176 individuals are in the labor force, with 8.0% or 14 of them unemployed. The age group with the highest labor force participation rate is 25 to 29 years, with 100.0% or 22 individuals in the labor force. Within the labor force, the 20 to 24 years age range has the highest percentage of unemployed individuals, with 45.5% or 5 of them being unemployed.
| Age Bracket | In Labor Force | Unemployed |
| 16 to 19 Years | 5 (15.6%) | 0 (0.0%) |
| 20 to 24 Years | 11 (44.0%) | 5 (45.5%) |
| 25 to 29 Years | 22 (100.0%) | 0 (0.0%) |
| 30 to 34 Years | 11 (78.6%) | 0 (0.0%) |
| 35 to 44 Years | 39 (83.0%) | 5 (12.8%) |
| 45 to 54 Years | 48 (87.3%) | 4 (8.3%) |
| 55 to 59 Years | 22 (61.1%) | 0 (0.0%) |
| 60 to 64 Years | 6 (33.3%) | 0 (0.0%) |
| 65 to 74 Years | 11 (28.2%) | 0 (0.0%) |
| 75 Years and over | 1 (3.3%) | 0 (0.0%) |
| Total | 176 (55.3%) | 14 (8.0%) |
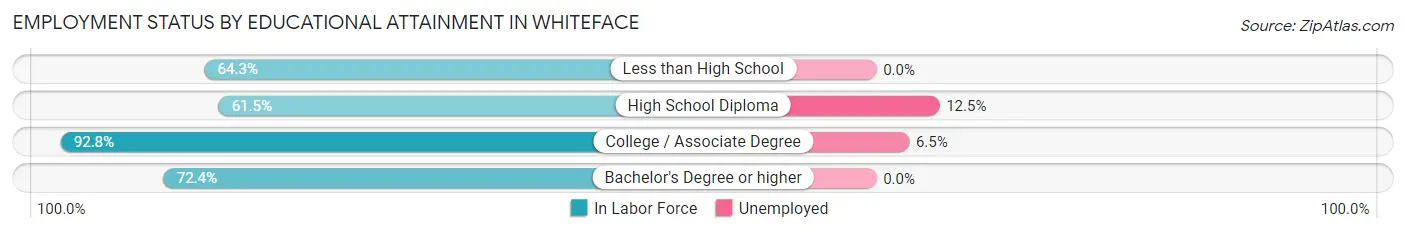
Employment Status by Educational Attainment in Whiteface
According to labor force statistics for Whiteface, 77.1% of individuals (148) out of the total population between 25 and 64 years of age (192) are in the labor force, with 6.1% or 9 of them being unemployed. The group with the highest labor force participation rate are those with the educational attainment of college / associate degree, with 92.8% or 77 individuals in the labor force. Within the labor force, individuals with high school diploma education have the highest percentage of unemployment, with 12.5% or 4 of them being unemployed.
| Educational Attainment | In Labor Force | Unemployed |
| Less than High School | 18 (64.3%) | 0 (0.0%) |
| High School Diploma | 32 (61.5%) | 6 (12.5%) |
| College / Associate Degree | 77 (92.8%) | 5 (6.5%) |
| Bachelor's Degree or higher | 21 (72.4%) | 0 (0.0%) |
| Total | 148 (77.1%) | 12 (6.1%) |
Employment Occupations by Sex in Whiteface
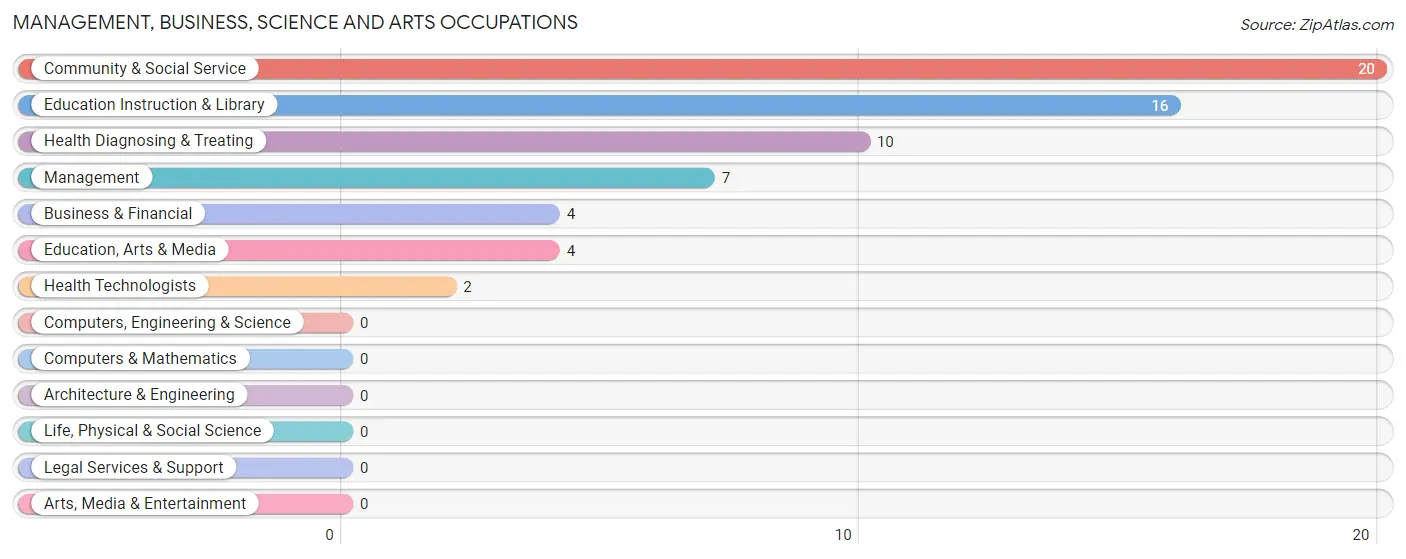
Management, Business, Science and Arts Occupations
The most common Management, Business, Science and Arts occupations in Whiteface are Community & Social Service (20 | 12.3%), Education Instruction & Library (16 | 9.9%), Health Diagnosing & Treating (10 | 6.2%), Management (7 | 4.3%), and Business & Financial (4 | 2.5%).
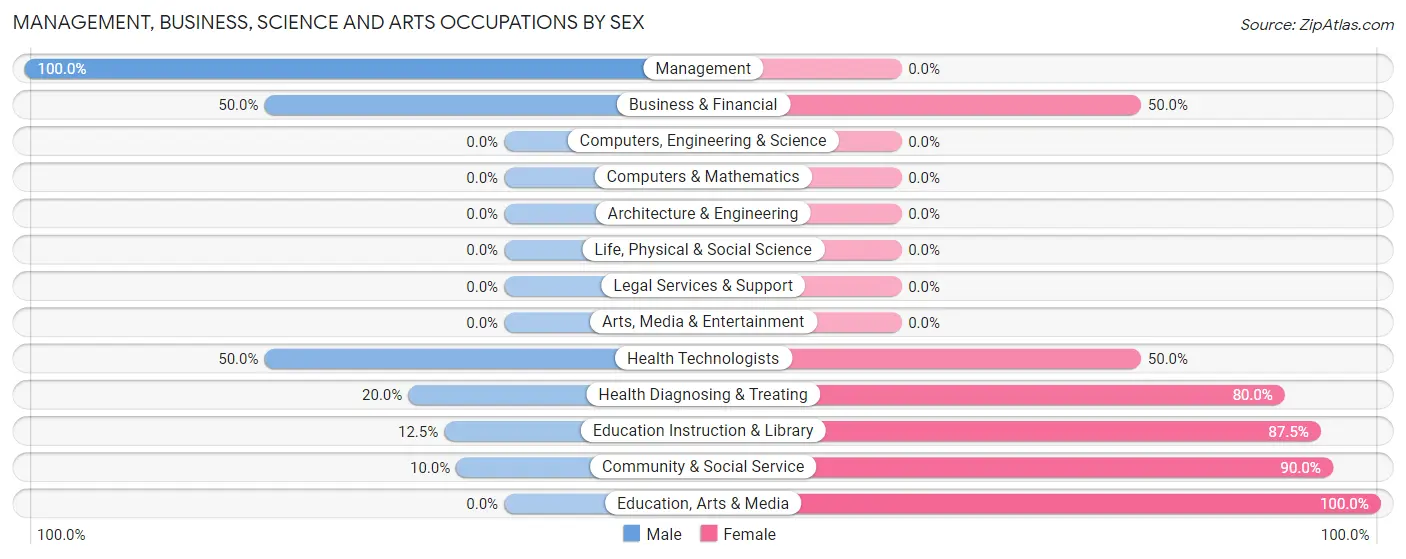
Management, Business, Science and Arts Occupations by Sex
Within the Management, Business, Science and Arts occupations in Whiteface, the most male-oriented occupations are Management (100.0%), Business & Financial (50.0%), and Health Technologists (50.0%), while the most female-oriented occupations are Education, Arts & Media (100.0%), Community & Social Service (90.0%), and Education Instruction & Library (87.5%).
| Occupation | Male | Female |
| Management | 7 (100.0%) | 0 (0.0%) |
| Business & Financial | 2 (50.0%) | 2 (50.0%) |
| Computers, Engineering & Science | 0 (0.0%) | 0 (0.0%) |
| Computers & Mathematics | 0 (0.0%) | 0 (0.0%) |
| Architecture & Engineering | 0 (0.0%) | 0 (0.0%) |
| Life, Physical & Social Science | 0 (0.0%) | 0 (0.0%) |
| Community & Social Service | 2 (10.0%) | 18 (90.0%) |
| Education, Arts & Media | 0 (0.0%) | 4 (100.0%) |
| Legal Services & Support | 0 (0.0%) | 0 (0.0%) |
| Education Instruction & Library | 2 (12.5%) | 14 (87.5%) |
| Arts, Media & Entertainment | 0 (0.0%) | 0 (0.0%) |
| Health Diagnosing & Treating | 2 (20.0%) | 8 (80.0%) |
| Health Technologists | 1 (50.0%) | 1 (50.0%) |
| Total (Category) | 13 (31.7%) | 28 (68.3%) |
| Total (Overall) | 76 (46.9%) | 86 (53.1%) |
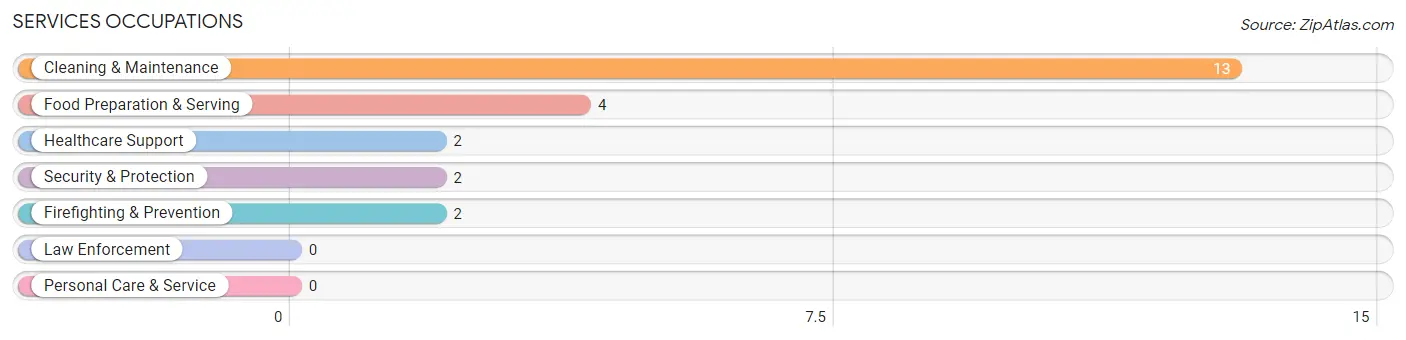
Services Occupations
The most common Services occupations in Whiteface are Cleaning & Maintenance (13 | 8.0%), Food Preparation & Serving (4 | 2.5%), Healthcare Support (2 | 1.2%), Security & Protection (2 | 1.2%), and Firefighting & Prevention (2 | 1.2%).
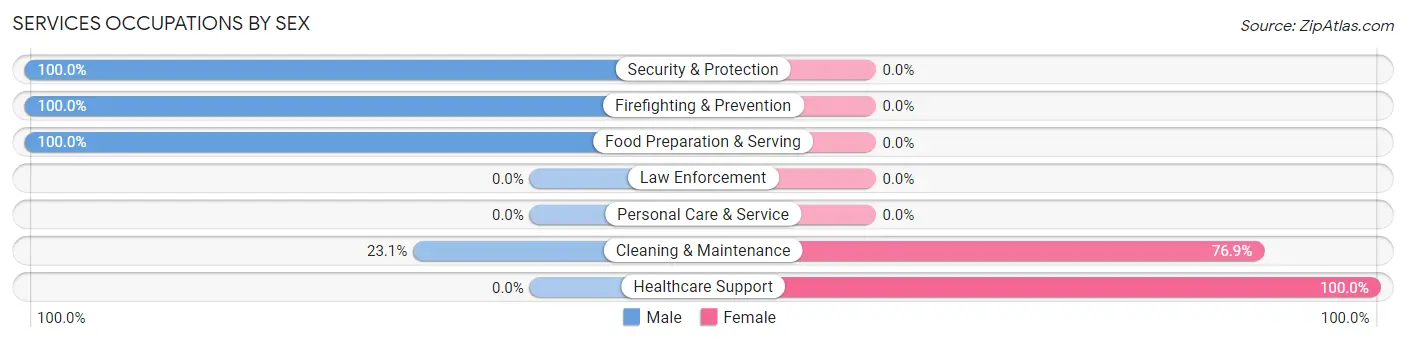
Services Occupations by Sex
Within the Services occupations in Whiteface, the most male-oriented occupations are Security & Protection (100.0%), Firefighting & Prevention (100.0%), and Food Preparation & Serving (100.0%), while the most female-oriented occupations are Healthcare Support (100.0%), and Cleaning & Maintenance (76.9%).
| Occupation | Male | Female |
| Healthcare Support | 0 (0.0%) | 2 (100.0%) |
| Security & Protection | 2 (100.0%) | 0 (0.0%) |
| Firefighting & Prevention | 2 (100.0%) | 0 (0.0%) |
| Law Enforcement | 0 (0.0%) | 0 (0.0%) |
| Food Preparation & Serving | 4 (100.0%) | 0 (0.0%) |
| Cleaning & Maintenance | 3 (23.1%) | 10 (76.9%) |
| Personal Care & Service | 0 (0.0%) | 0 (0.0%) |
| Total (Category) | 9 (42.9%) | 12 (57.1%) |
| Total (Overall) | 76 (46.9%) | 86 (53.1%) |
Sales and Office Occupations
The most common Sales and Office occupations in Whiteface are Office & Administration (40 | 24.7%), and Sales & Related (14 | 8.6%).
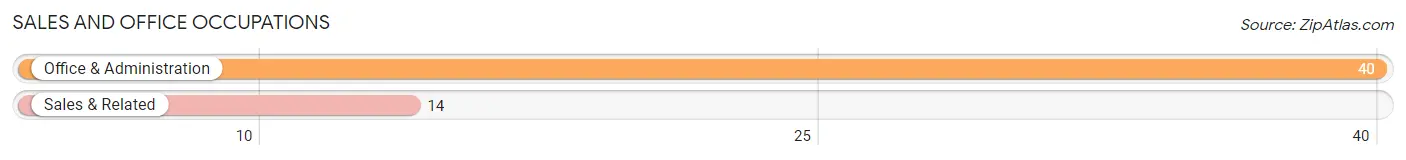
Sales and Office Occupations by Sex

| Occupation | Male | Female |
| Sales & Related | 8 (57.1%) | 6 (42.9%) |
| Office & Administration | 0 (0.0%) | 40 (100.0%) |
| Total (Category) | 8 (14.8%) | 46 (85.2%) |
| Total (Overall) | 76 (46.9%) | 86 (53.1%) |
Natural Resources, Construction and Maintenance Occupations
The most common Natural Resources, Construction and Maintenance occupations in Whiteface are Construction & Extraction (20 | 12.3%), and Installation, Maintenance & Repair (1 | 0.6%).
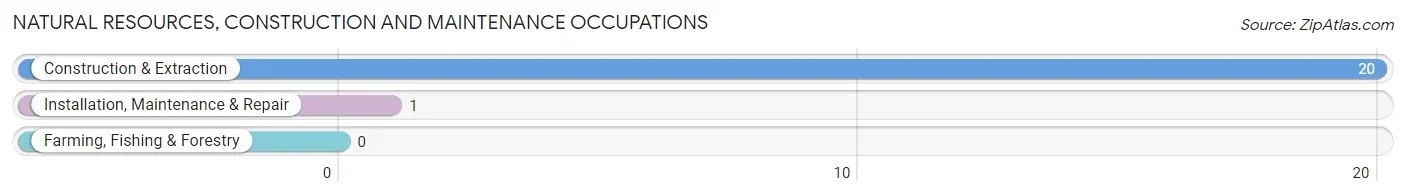
Natural Resources, Construction and Maintenance Occupations by Sex
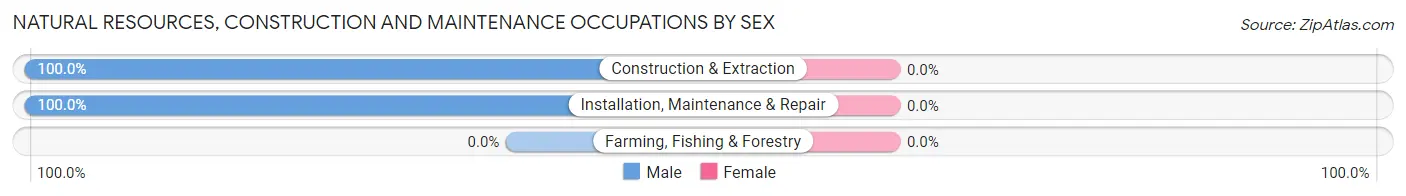
| Occupation | Male | Female |
| Farming, Fishing & Forestry | 0 (0.0%) | 0 (0.0%) |
| Construction & Extraction | 20 (100.0%) | 0 (0.0%) |
| Installation, Maintenance & Repair | 1 (100.0%) | 0 (0.0%) |
| Total (Category) | 21 (100.0%) | 0 (0.0%) |
| Total (Overall) | 76 (46.9%) | 86 (53.1%) |
Production, Transportation and Moving Occupations
The most common Production, Transportation and Moving occupations in Whiteface are Transportation (18 | 11.1%), Material Moving (6 | 3.7%), and Production (1 | 0.6%).
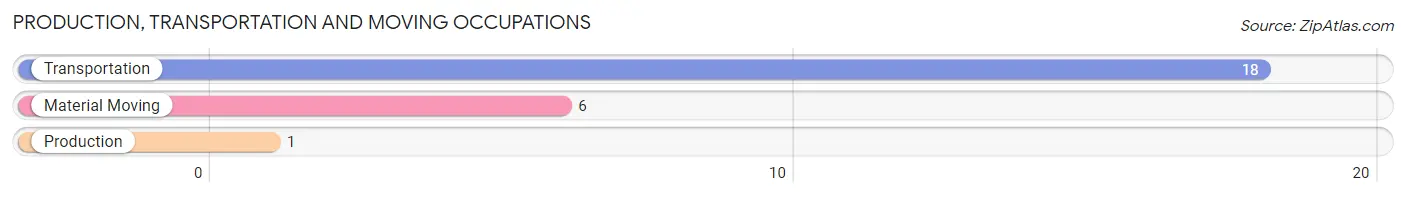
Production, Transportation and Moving Occupations by Sex
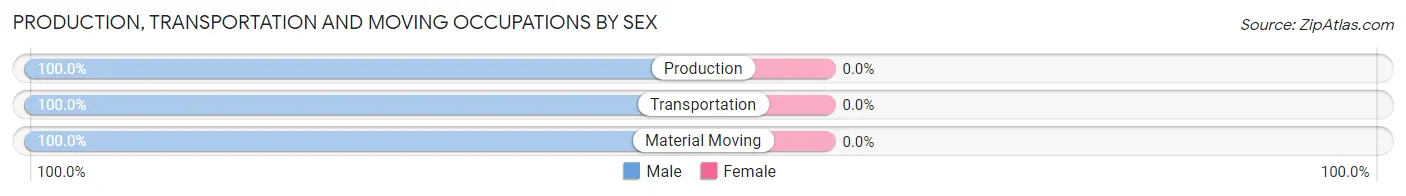
| Occupation | Male | Female |
| Production | 1 (100.0%) | 0 (0.0%) |
| Transportation | 18 (100.0%) | 0 (0.0%) |
| Material Moving | 6 (100.0%) | 0 (0.0%) |
| Total (Category) | 25 (100.0%) | 0 (0.0%) |
| Total (Overall) | 76 (46.9%) | 86 (53.1%) |
Employment Industries by Sex in Whiteface
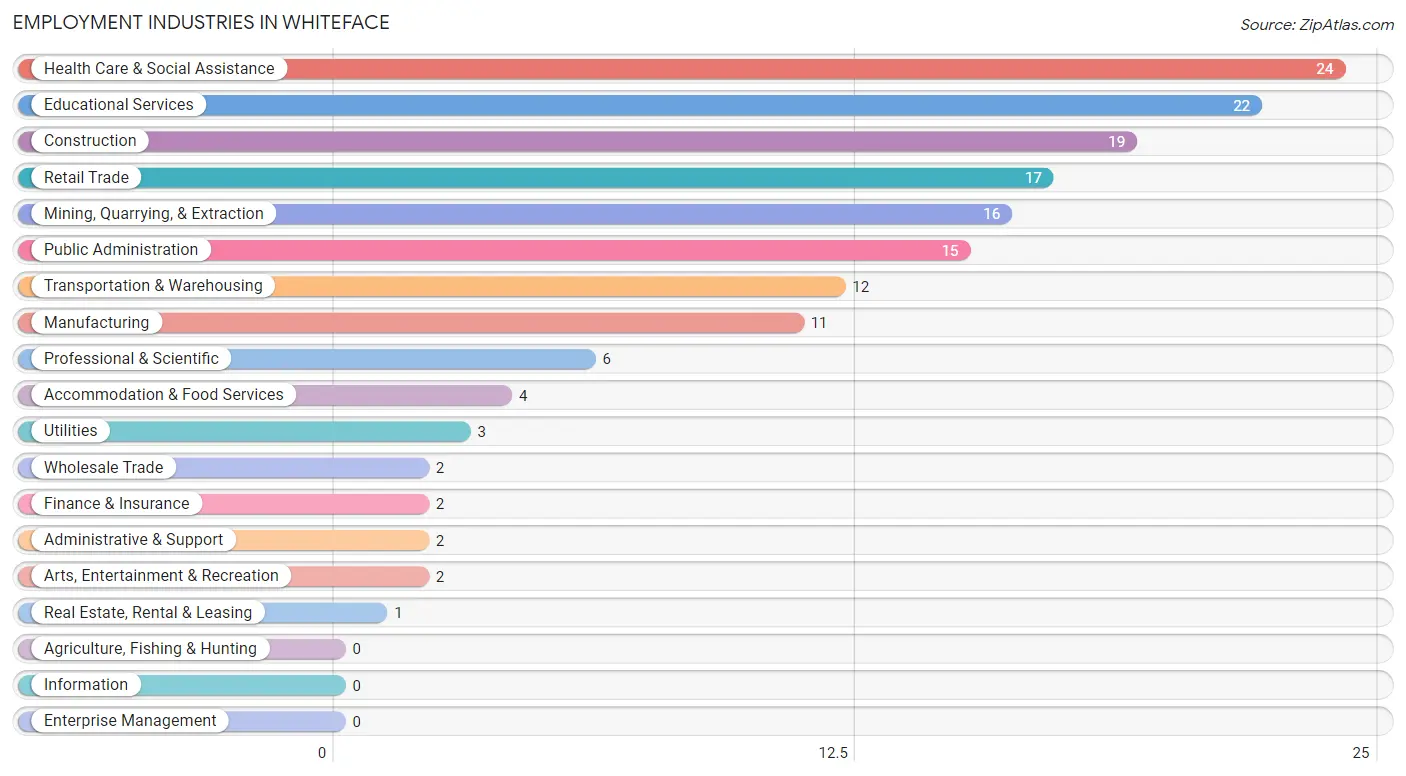
Employment Industries in Whiteface
The major employment industries in Whiteface include Health Care & Social Assistance (24 | 14.8%), Educational Services (22 | 13.6%), Construction (19 | 11.7%), Retail Trade (17 | 10.5%), and Mining, Quarrying, & Extraction (16 | 9.9%).
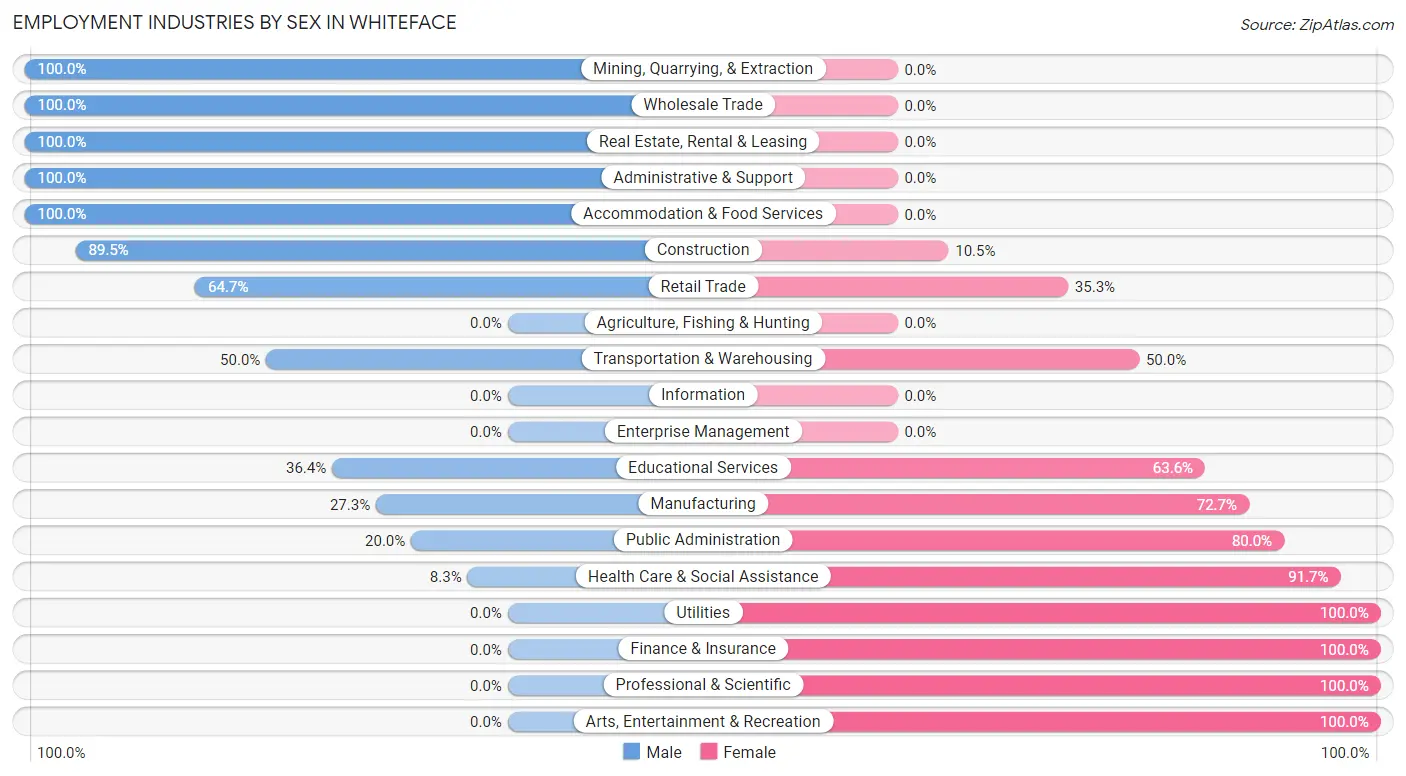
Employment Industries by Sex in Whiteface
The Whiteface industries that see more men than women are Mining, Quarrying, & Extraction (100.0%), Wholesale Trade (100.0%), and Real Estate, Rental & Leasing (100.0%), whereas the industries that tend to have a higher number of women are Utilities (100.0%), Finance & Insurance (100.0%), and Professional & Scientific (100.0%).
| Industry | Male | Female |
| Agriculture, Fishing & Hunting | 0 (0.0%) | 0 (0.0%) |
| Mining, Quarrying, & Extraction | 16 (100.0%) | 0 (0.0%) |
| Construction | 17 (89.5%) | 2 (10.5%) |
| Manufacturing | 3 (27.3%) | 8 (72.7%) |
| Wholesale Trade | 2 (100.0%) | 0 (0.0%) |
| Retail Trade | 11 (64.7%) | 6 (35.3%) |
| Transportation & Warehousing | 6 (50.0%) | 6 (50.0%) |
| Utilities | 0 (0.0%) | 3 (100.0%) |
| Information | 0 (0.0%) | 0 (0.0%) |
| Finance & Insurance | 0 (0.0%) | 2 (100.0%) |
| Real Estate, Rental & Leasing | 1 (100.0%) | 0 (0.0%) |
| Professional & Scientific | 0 (0.0%) | 6 (100.0%) |
| Enterprise Management | 0 (0.0%) | 0 (0.0%) |
| Administrative & Support | 2 (100.0%) | 0 (0.0%) |
| Educational Services | 8 (36.4%) | 14 (63.6%) |
| Health Care & Social Assistance | 2 (8.3%) | 22 (91.7%) |
| Arts, Entertainment & Recreation | 0 (0.0%) | 2 (100.0%) |
| Accommodation & Food Services | 4 (100.0%) | 0 (0.0%) |
| Public Administration | 3 (20.0%) | 12 (80.0%) |
| Total | 76 (46.9%) | 86 (53.1%) |
Education in Whiteface
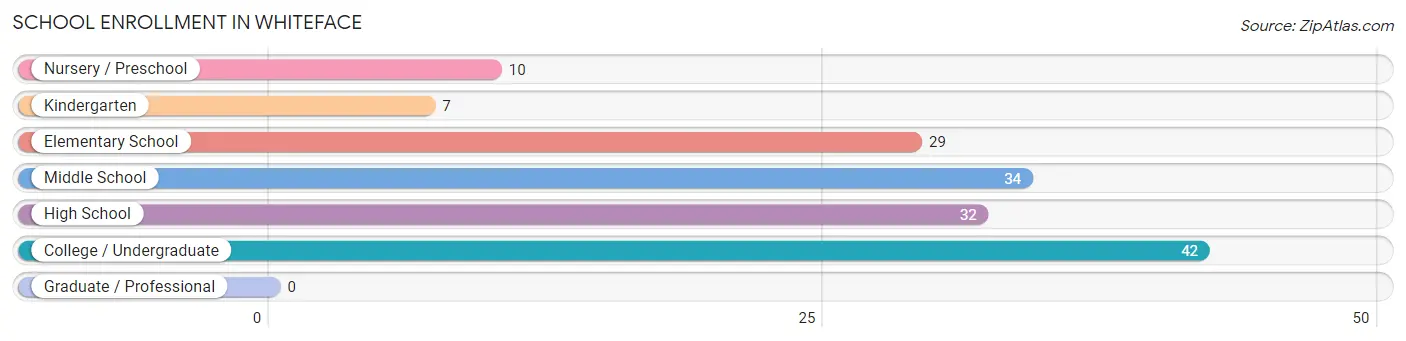
School Enrollment in Whiteface
The most common levels of schooling among the 154 students in Whiteface are college / undergraduate (42 | 27.3%), middle school (34 | 22.1%), and high school (32 | 20.8%).
| School Level | # Students | % Students |
| Nursery / Preschool | 10 | 6.5% |
| Kindergarten | 7 | 4.5% |
| Elementary School | 29 | 18.8% |
| Middle School | 34 | 22.1% |
| High School | 32 | 20.8% |
| College / Undergraduate | 42 | 27.3% |
| Graduate / Professional | 0 | 0.0% |
| Total | 154 | 100.0% |
School Enrollment by Age by Funding Source in Whiteface
Out of a total of 154 students who are enrolled in schools in Whiteface, 17 (11.0%) attend a private institution, while the remaining 137 (89.0%) are enrolled in public schools. The age group of 35 years and over has the highest likelihood of being enrolled in private schools, with 17 (94.4% in the age bracket) enrolled. Conversely, the age group of 3 to 4 year olds has the lowest likelihood of being enrolled in a private school, with 7 (100.0% in the age bracket) attending a public institution.
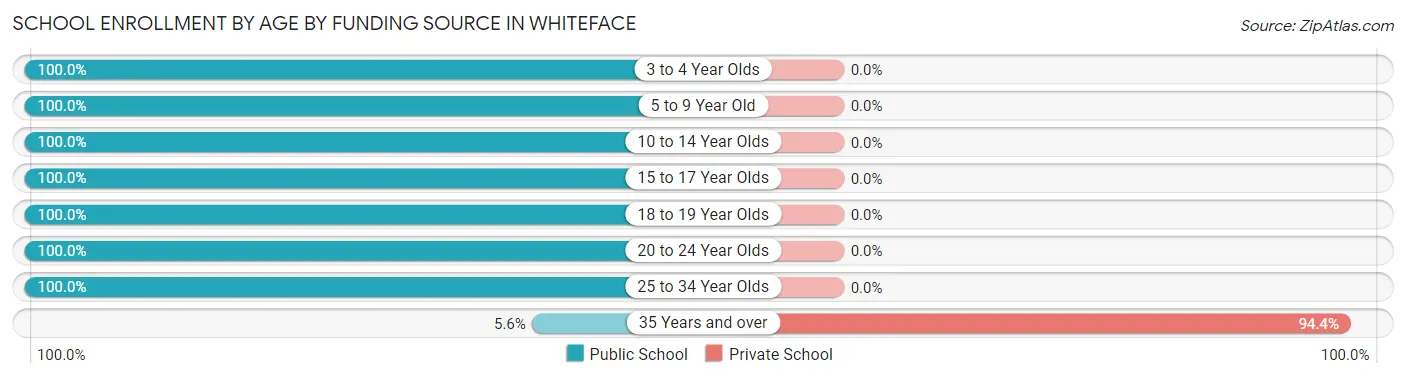
| Age Bracket | Public School | Private School |
| 3 to 4 Year Olds | 7 (100.0%) | 0 (0.0%) |
| 5 to 9 Year Old | 26 (100.0%) | 0 (0.0%) |
| 10 to 14 Year Olds | 46 (100.0%) | 0 (0.0%) |
| 15 to 17 Year Olds | 33 (100.0%) | 0 (0.0%) |
| 18 to 19 Year Olds | 8 (100.0%) | 0 (0.0%) |
| 20 to 24 Year Olds | 5 (100.0%) | 0 (0.0%) |
| 25 to 34 Year Olds | 11 (100.0%) | 0 (0.0%) |
| 35 Years and over | 1 (5.6%) | 17 (94.4%) |
| Total | 137 (89.0%) | 17 (11.0%) |
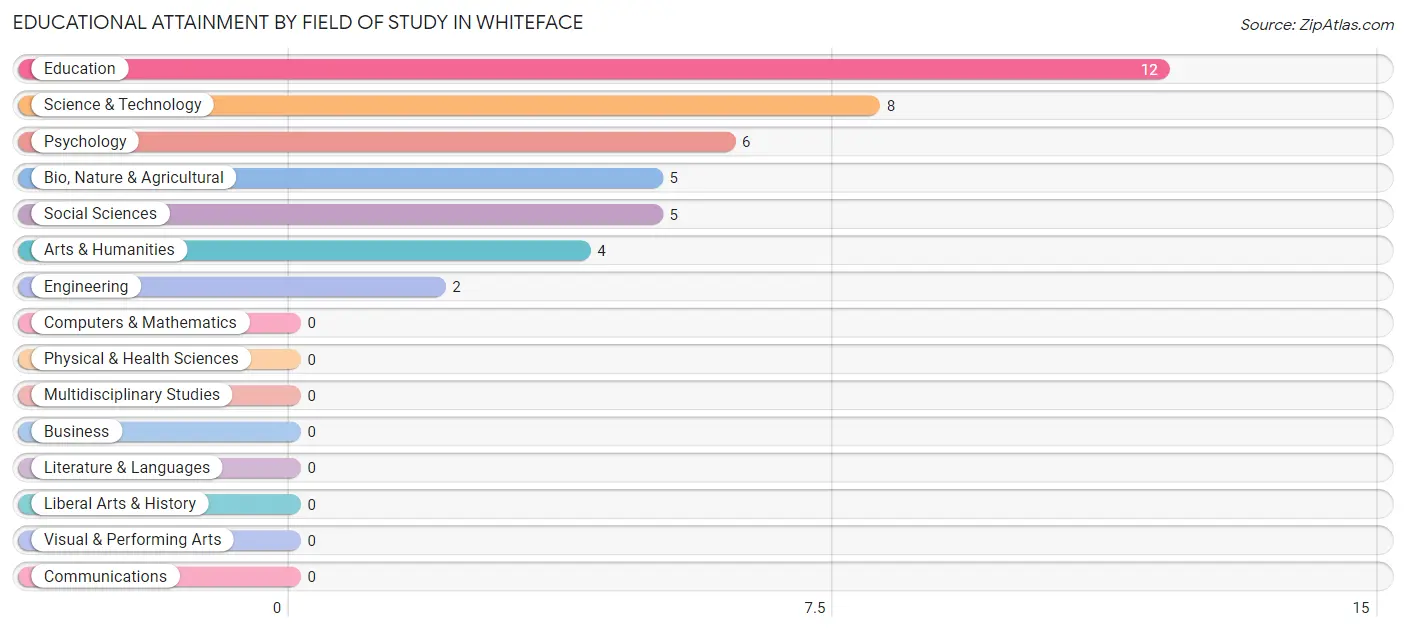
Educational Attainment by Field of Study in Whiteface
Education (12 | 28.6%), science & technology (8 | 19.1%), psychology (6 | 14.3%), bio, nature & agricultural (5 | 11.9%), and social sciences (5 | 11.9%) are the most common fields of study among 42 individuals in Whiteface who have obtained a bachelor's degree or higher.
| Field of Study | # Graduates | % Graduates |
| Computers & Mathematics | 0 | 0.0% |
| Bio, Nature & Agricultural | 5 | 11.9% |
| Physical & Health Sciences | 0 | 0.0% |
| Psychology | 6 | 14.3% |
| Social Sciences | 5 | 11.9% |
| Engineering | 2 | 4.8% |
| Multidisciplinary Studies | 0 | 0.0% |
| Science & Technology | 8 | 19.1% |
| Business | 0 | 0.0% |
| Education | 12 | 28.6% |
| Literature & Languages | 0 | 0.0% |
| Liberal Arts & History | 0 | 0.0% |
| Visual & Performing Arts | 0 | 0.0% |
| Communications | 0 | 0.0% |
| Arts & Humanities | 4 | 9.5% |
| Total | 42 | 100.0% |
Transportation & Commute in Whiteface
Vehicle Availability by Sex in Whiteface
The most prevalent vehicle ownership categories in Whiteface are males with 2 vehicles (34, accounting for 45.3%) and females with 2 vehicles (20, making up 39.5%).
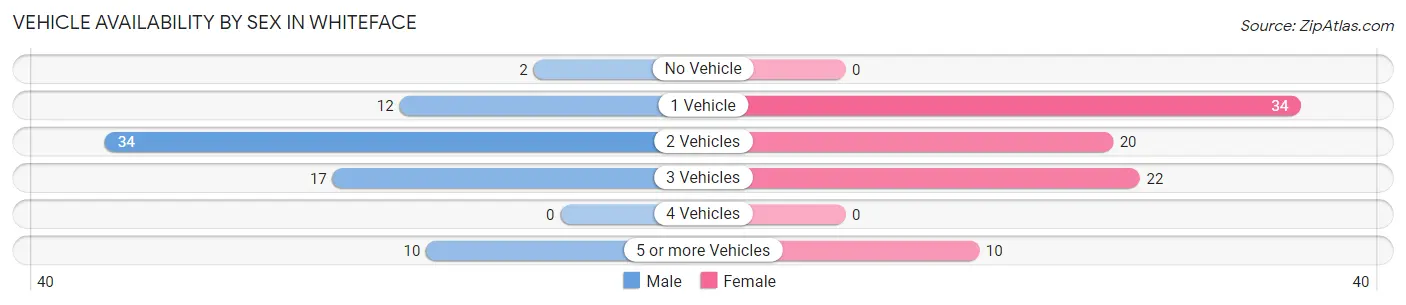
| Vehicles Available | Male | Female |
| No Vehicle | 2 (2.7%) | 0 (0.0%) |
| 1 Vehicle | 12 (16.0%) | 34 (39.5%) |
| 2 Vehicles | 34 (45.3%) | 20 (23.3%) |
| 3 Vehicles | 17 (22.7%) | 22 (25.6%) |
| 4 Vehicles | 0 (0.0%) | 0 (0.0%) |
| 5 or more Vehicles | 10 (13.3%) | 10 (11.6%) |
| Total | 75 (100.0%) | 86 (100.0%) |
Commute Time in Whiteface
The most frequently occuring commute durations in Whiteface are 15 to 19 minutes (33 commuters, 20.7%), 10 to 14 minutes (26 commuters, 16.4%), and less than 5 minutes (25 commuters, 15.7%).
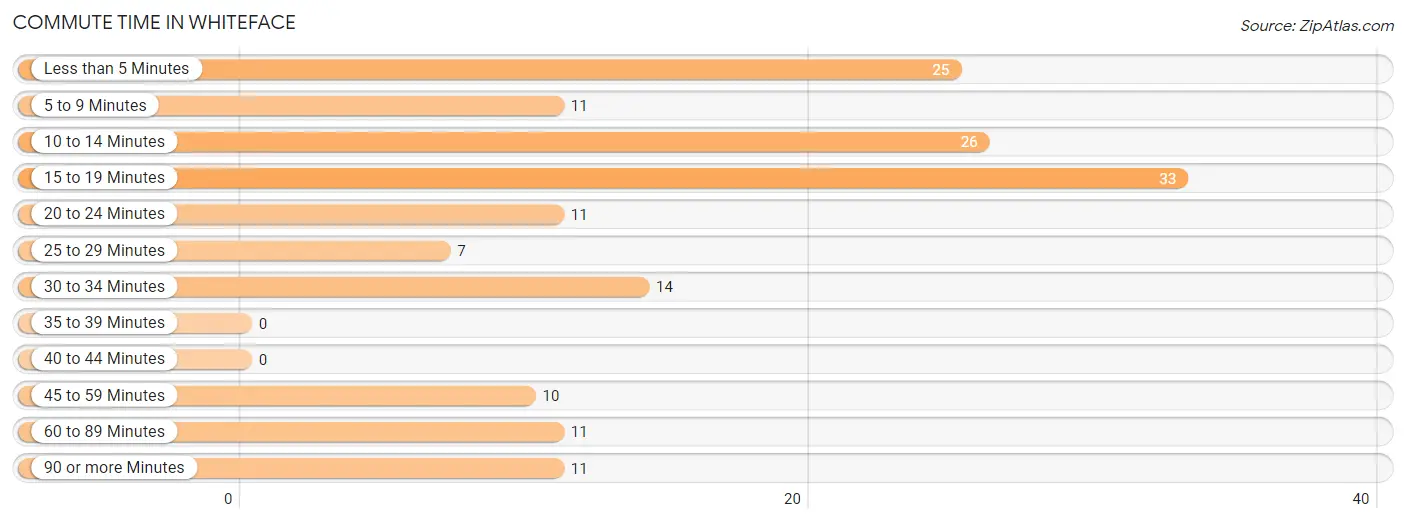
| Commute Time | # Commuters | % Commuters |
| Less than 5 Minutes | 25 | 15.7% |
| 5 to 9 Minutes | 11 | 6.9% |
| 10 to 14 Minutes | 26 | 16.4% |
| 15 to 19 Minutes | 33 | 20.7% |
| 20 to 24 Minutes | 11 | 6.9% |
| 25 to 29 Minutes | 7 | 4.4% |
| 30 to 34 Minutes | 14 | 8.8% |
| 35 to 39 Minutes | 0 | 0.0% |
| 40 to 44 Minutes | 0 | 0.0% |
| 45 to 59 Minutes | 10 | 6.3% |
| 60 to 89 Minutes | 11 | 6.9% |
| 90 or more Minutes | 11 | 6.9% |
Commute Time by Sex in Whiteface
The most common commute times in Whiteface are 15 to 19 minutes (12 commuters, 16.4%) for males and less than 5 minutes (21 commuters, 24.4%) for females.
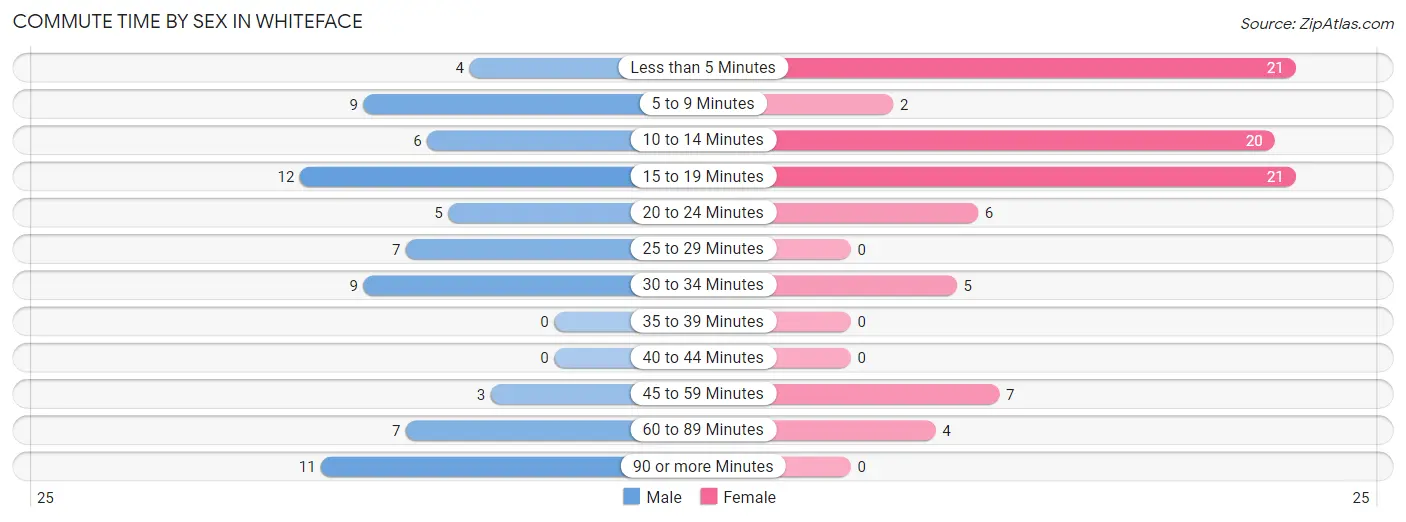
| Commute Time | Male | Female |
| Less than 5 Minutes | 4 (5.5%) | 21 (24.4%) |
| 5 to 9 Minutes | 9 (12.3%) | 2 (2.3%) |
| 10 to 14 Minutes | 6 (8.2%) | 20 (23.3%) |
| 15 to 19 Minutes | 12 (16.4%) | 21 (24.4%) |
| 20 to 24 Minutes | 5 (6.9%) | 6 (7.0%) |
| 25 to 29 Minutes | 7 (9.6%) | 0 (0.0%) |
| 30 to 34 Minutes | 9 (12.3%) | 5 (5.8%) |
| 35 to 39 Minutes | 0 (0.0%) | 0 (0.0%) |
| 40 to 44 Minutes | 0 (0.0%) | 0 (0.0%) |
| 45 to 59 Minutes | 3 (4.1%) | 7 (8.1%) |
| 60 to 89 Minutes | 7 (9.6%) | 4 (4.6%) |
| 90 or more Minutes | 11 (15.1%) | 0 (0.0%) |
Time of Departure to Work by Sex in Whiteface
The most frequent times of departure to work in Whiteface are 7:30 AM to 7:59 AM (21, 28.8%) for males and 7:30 AM to 7:59 AM (38, 44.2%) for females.
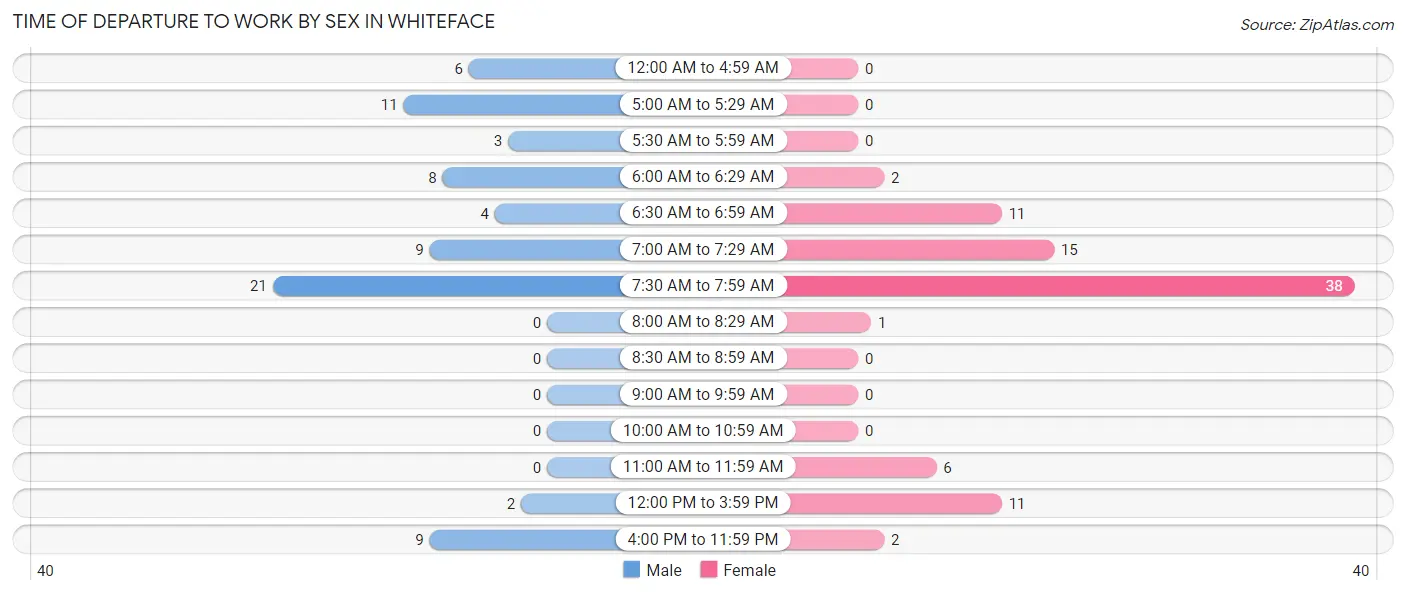
| Time of Departure | Male | Female |
| 12:00 AM to 4:59 AM | 6 (8.2%) | 0 (0.0%) |
| 5:00 AM to 5:29 AM | 11 (15.1%) | 0 (0.0%) |
| 5:30 AM to 5:59 AM | 3 (4.1%) | 0 (0.0%) |
| 6:00 AM to 6:29 AM | 8 (11.0%) | 2 (2.3%) |
| 6:30 AM to 6:59 AM | 4 (5.5%) | 11 (12.8%) |
| 7:00 AM to 7:29 AM | 9 (12.3%) | 15 (17.4%) |
| 7:30 AM to 7:59 AM | 21 (28.8%) | 38 (44.2%) |
| 8:00 AM to 8:29 AM | 0 (0.0%) | 1 (1.2%) |
| 8:30 AM to 8:59 AM | 0 (0.0%) | 0 (0.0%) |
| 9:00 AM to 9:59 AM | 0 (0.0%) | 0 (0.0%) |
| 10:00 AM to 10:59 AM | 0 (0.0%) | 0 (0.0%) |
| 11:00 AM to 11:59 AM | 0 (0.0%) | 6 (7.0%) |
| 12:00 PM to 3:59 PM | 2 (2.7%) | 11 (12.8%) |
| 4:00 PM to 11:59 PM | 9 (12.3%) | 2 (2.3%) |
| Total | 73 (100.0%) | 86 (100.0%) |
Housing Occupancy in Whiteface
Occupancy by Ownership in Whiteface
Of the total 163 dwellings in Whiteface, owner-occupied units account for 131 (80.4%), while renter-occupied units make up 32 (19.6%).
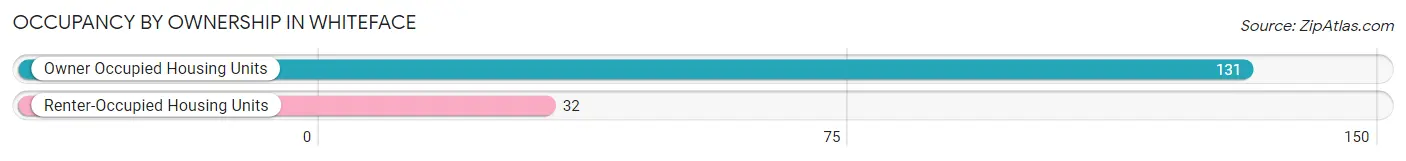
| Occupancy | # Housing Units | % Housing Units |
| Owner Occupied Housing Units | 131 | 80.4% |
| Renter-Occupied Housing Units | 32 | 19.6% |
| Total Occupied Housing Units | 163 | 100.0% |
Occupancy by Household Size in Whiteface
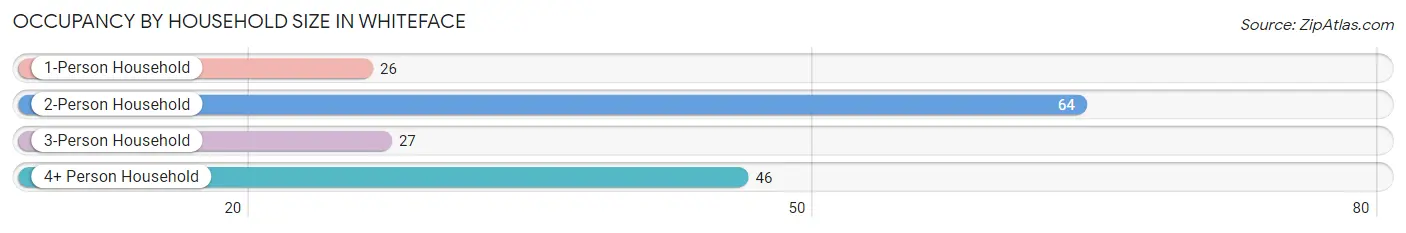
| Household Size | # Housing Units | % Housing Units |
| 1-Person Household | 26 | 16.0% |
| 2-Person Household | 64 | 39.3% |
| 3-Person Household | 27 | 16.6% |
| 4+ Person Household | 46 | 28.2% |
| Total Housing Units | 163 | 100.0% |
Occupancy by Ownership by Household Size in Whiteface
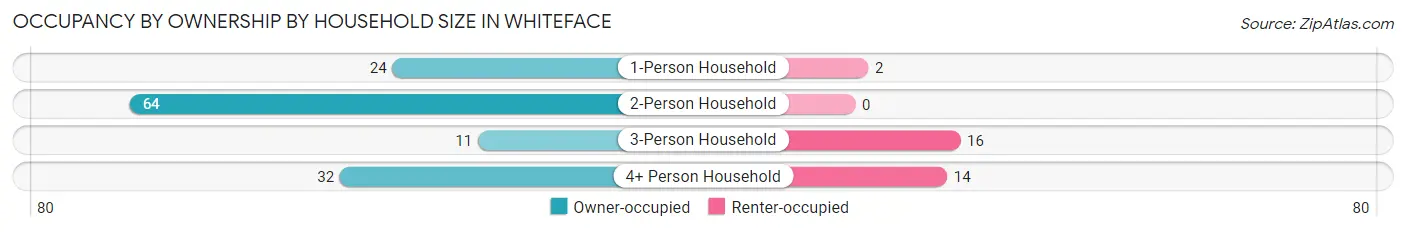
| Household Size | Owner-occupied | Renter-occupied |
| 1-Person Household | 24 (92.3%) | 2 (7.7%) |
| 2-Person Household | 64 (100.0%) | 0 (0.0%) |
| 3-Person Household | 11 (40.7%) | 16 (59.3%) |
| 4+ Person Household | 32 (69.6%) | 14 (30.4%) |
| Total Housing Units | 131 (80.4%) | 32 (19.6%) |
Occupancy by Educational Attainment in Whiteface
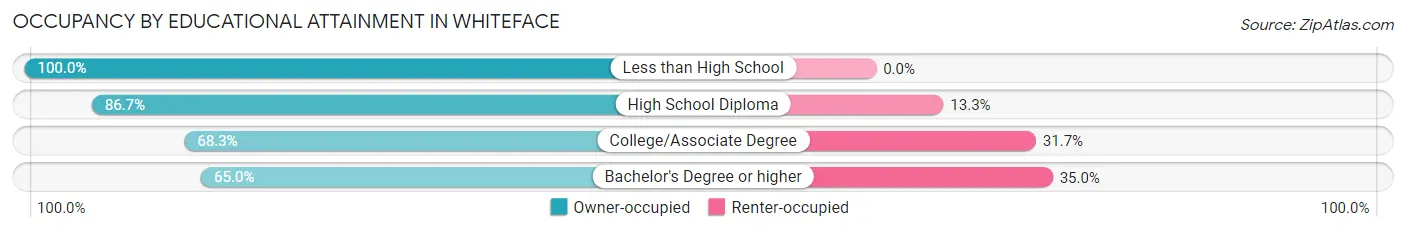
| Household Size | Owner-occupied | Renter-occupied |
| Less than High School | 38 (100.0%) | 0 (0.0%) |
| High School Diploma | 39 (86.7%) | 6 (13.3%) |
| College/Associate Degree | 41 (68.3%) | 19 (31.7%) |
| Bachelor's Degree or higher | 13 (65.0%) | 7 (35.0%) |
Occupancy by Age of Householder in Whiteface
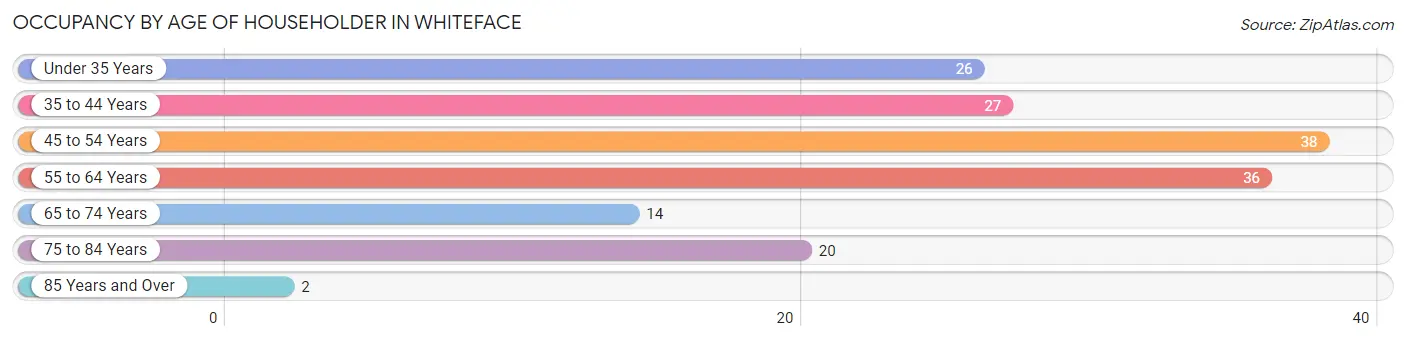
| Age Bracket | # Households | % Households |
| Under 35 Years | 26 | 16.0% |
| 35 to 44 Years | 27 | 16.6% |
| 45 to 54 Years | 38 | 23.3% |
| 55 to 64 Years | 36 | 22.1% |
| 65 to 74 Years | 14 | 8.6% |
| 75 to 84 Years | 20 | 12.3% |
| 85 Years and Over | 2 | 1.2% |
| Total | 163 | 100.0% |
Housing Finances in Whiteface
Median Income by Occupancy in Whiteface
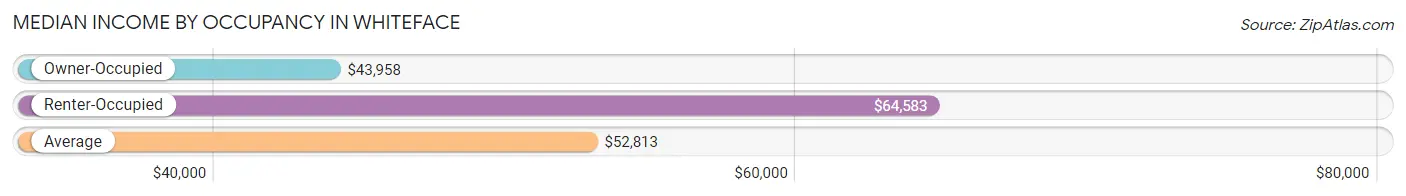
| Occupancy Type | # Households | Median Income |
| Owner-Occupied | 131 (80.4%) | $43,958 |
| Renter-Occupied | 32 (19.6%) | $64,583 |
| Average | 163 (100.0%) | $52,813 |
Occupancy by Householder Income Bracket in Whiteface
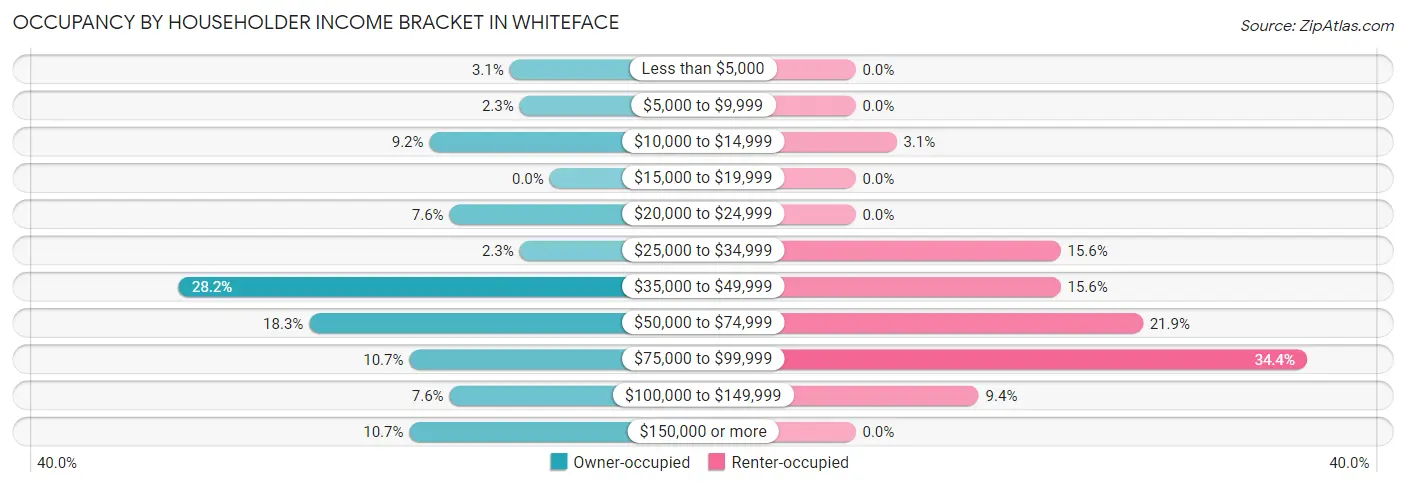
| Income Bracket | Owner-occupied | Renter-occupied |
| Less than $5,000 | 4 (3.0%) | 0 (0.0%) |
| $5,000 to $9,999 | 3 (2.3%) | 0 (0.0%) |
| $10,000 to $14,999 | 12 (9.2%) | 1 (3.1%) |
| $15,000 to $19,999 | 0 (0.0%) | 0 (0.0%) |
| $20,000 to $24,999 | 10 (7.6%) | 0 (0.0%) |
| $25,000 to $34,999 | 3 (2.3%) | 5 (15.6%) |
| $35,000 to $49,999 | 37 (28.2%) | 5 (15.6%) |
| $50,000 to $74,999 | 24 (18.3%) | 7 (21.9%) |
| $75,000 to $99,999 | 14 (10.7%) | 11 (34.4%) |
| $100,000 to $149,999 | 10 (7.6%) | 3 (9.4%) |
| $150,000 or more | 14 (10.7%) | 0 (0.0%) |
| Total | 131 (100.0%) | 32 (100.0%) |
Monthly Housing Cost Tiers in Whiteface
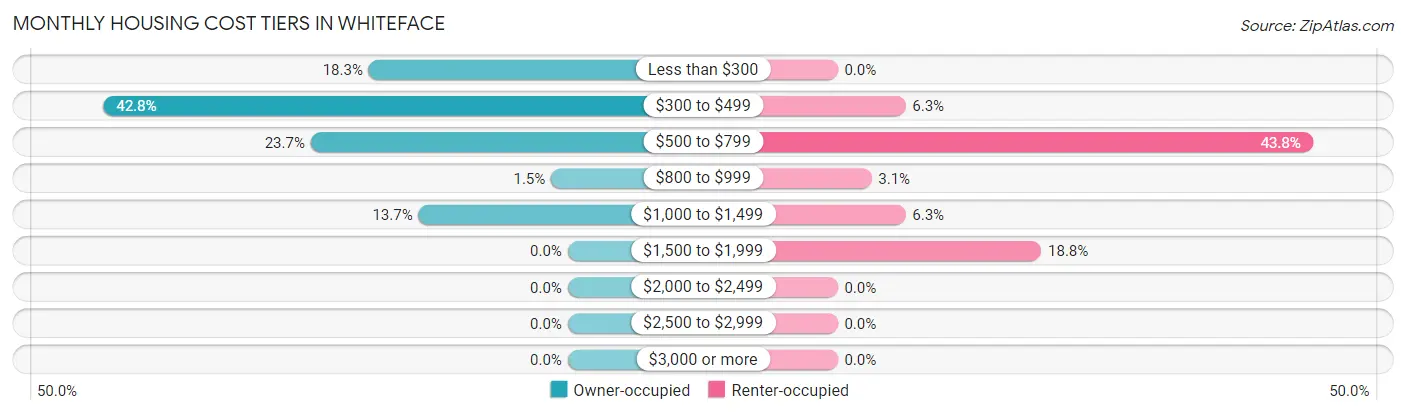
| Monthly Cost | Owner-occupied | Renter-occupied |
| Less than $300 | 24 (18.3%) | 0 (0.0%) |
| $300 to $499 | 56 (42.7%) | 2 (6.2%) |
| $500 to $799 | 31 (23.7%) | 14 (43.8%) |
| $800 to $999 | 2 (1.5%) | 1 (3.1%) |
| $1,000 to $1,499 | 18 (13.7%) | 2 (6.2%) |
| $1,500 to $1,999 | 0 (0.0%) | 6 (18.8%) |
| $2,000 to $2,499 | 0 (0.0%) | 0 (0.0%) |
| $2,500 to $2,999 | 0 (0.0%) | 0 (0.0%) |
| $3,000 or more | 0 (0.0%) | 0 (0.0%) |
| Total | 131 (100.0%) | 32 (100.0%) |
Physical Housing Characteristics in Whiteface
Housing Structures in Whiteface
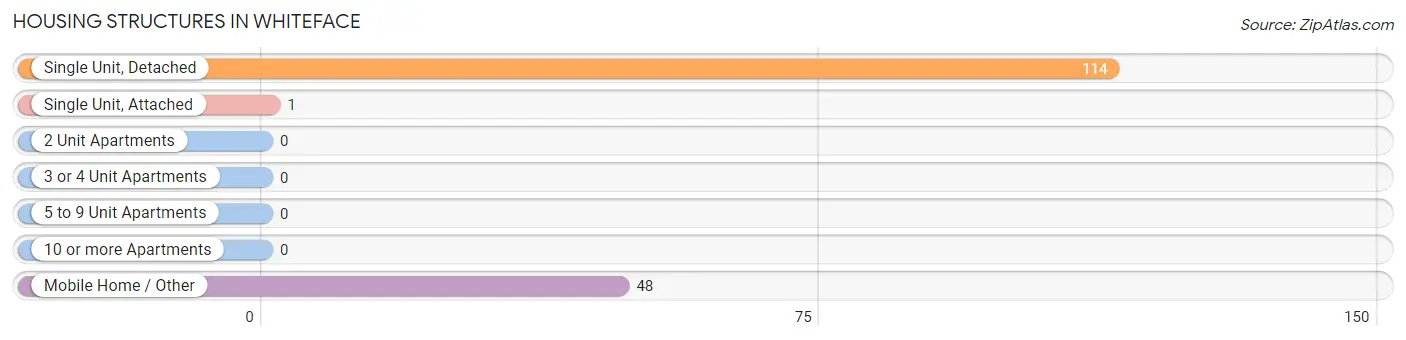
| Structure Type | # Housing Units | % Housing Units |
| Single Unit, Detached | 114 | 69.9% |
| Single Unit, Attached | 1 | 0.6% |
| 2 Unit Apartments | 0 | 0.0% |
| 3 or 4 Unit Apartments | 0 | 0.0% |
| 5 to 9 Unit Apartments | 0 | 0.0% |
| 10 or more Apartments | 0 | 0.0% |
| Mobile Home / Other | 48 | 29.4% |
| Total | 163 | 100.0% |
Housing Structures by Occupancy in Whiteface
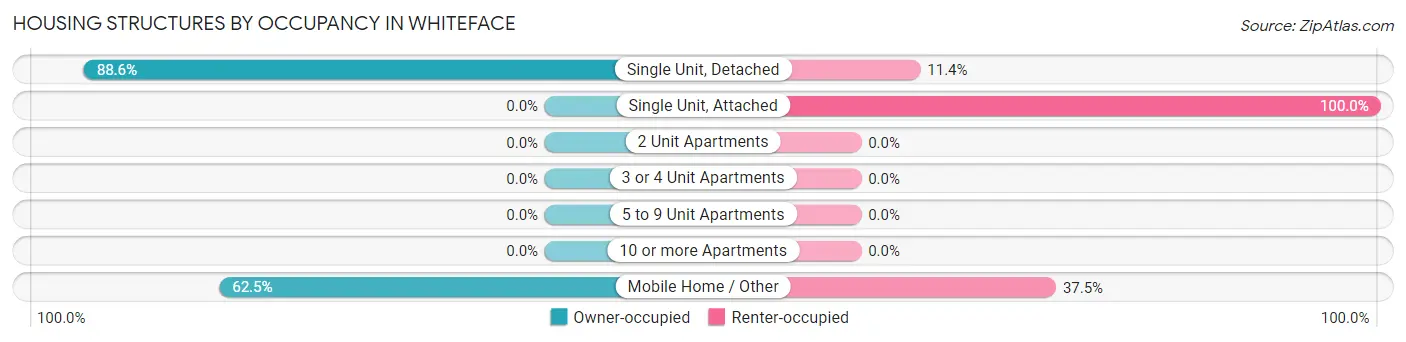
| Structure Type | Owner-occupied | Renter-occupied |
| Single Unit, Detached | 101 (88.6%) | 13 (11.4%) |
| Single Unit, Attached | 0 (0.0%) | 1 (100.0%) |
| 2 Unit Apartments | 0 (0.0%) | 0 (0.0%) |
| 3 or 4 Unit Apartments | 0 (0.0%) | 0 (0.0%) |
| 5 to 9 Unit Apartments | 0 (0.0%) | 0 (0.0%) |
| 10 or more Apartments | 0 (0.0%) | 0 (0.0%) |
| Mobile Home / Other | 30 (62.5%) | 18 (37.5%) |
| Total | 131 (80.4%) | 32 (19.6%) |
Housing Structures by Number of Rooms in Whiteface
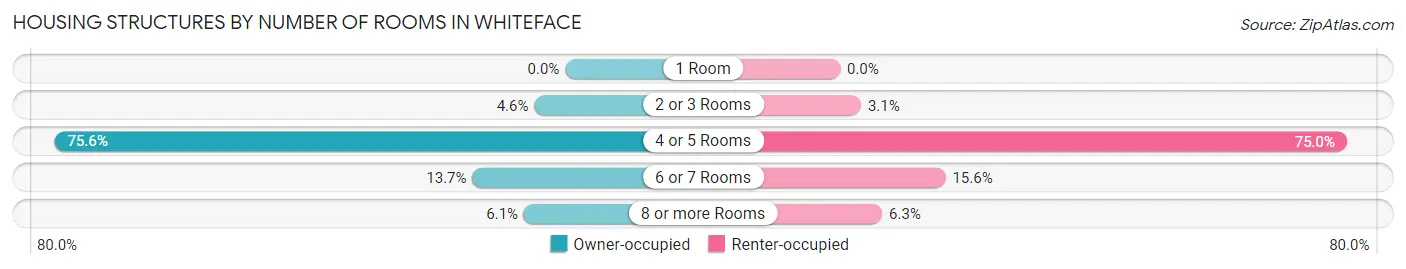
| Number of Rooms | Owner-occupied | Renter-occupied |
| 1 Room | 0 (0.0%) | 0 (0.0%) |
| 2 or 3 Rooms | 6 (4.6%) | 1 (3.1%) |
| 4 or 5 Rooms | 99 (75.6%) | 24 (75.0%) |
| 6 or 7 Rooms | 18 (13.7%) | 5 (15.6%) |
| 8 or more Rooms | 8 (6.1%) | 2 (6.2%) |
| Total | 131 (100.0%) | 32 (100.0%) |
Housing Structure by Heating Type in Whiteface
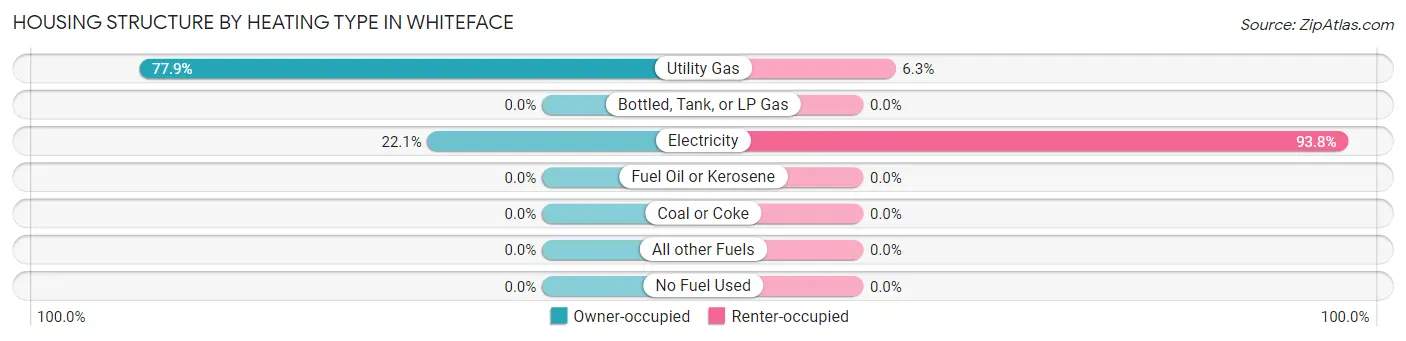
| Heating Type | Owner-occupied | Renter-occupied |
| Utility Gas | 102 (77.9%) | 2 (6.2%) |
| Bottled, Tank, or LP Gas | 0 (0.0%) | 0 (0.0%) |
| Electricity | 29 (22.1%) | 30 (93.8%) |
| Fuel Oil or Kerosene | 0 (0.0%) | 0 (0.0%) |
| Coal or Coke | 0 (0.0%) | 0 (0.0%) |
| All other Fuels | 0 (0.0%) | 0 (0.0%) |
| No Fuel Used | 0 (0.0%) | 0 (0.0%) |
| Total | 131 (100.0%) | 32 (100.0%) |
Household Vehicle Usage in Whiteface
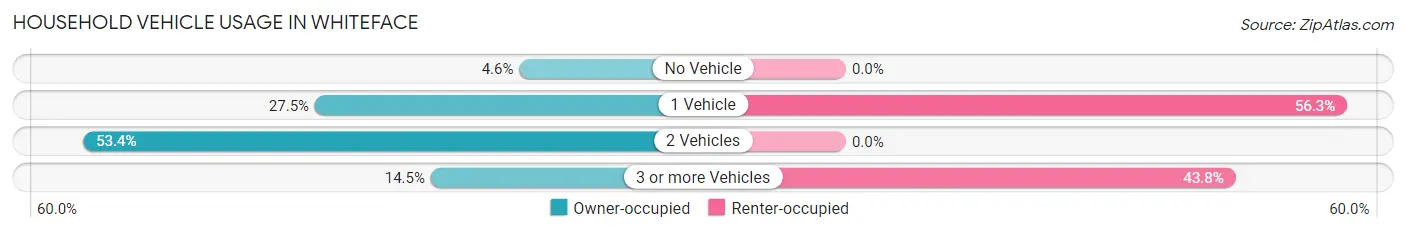
| Vehicles per Household | Owner-occupied | Renter-occupied |
| No Vehicle | 6 (4.6%) | 0 (0.0%) |
| 1 Vehicle | 36 (27.5%) | 18 (56.2%) |
| 2 Vehicles | 70 (53.4%) | 0 (0.0%) |
| 3 or more Vehicles | 19 (14.5%) | 14 (43.8%) |
| Total | 131 (100.0%) | 32 (100.0%) |
Real Estate & Mortgages in Whiteface
Real Estate and Mortgage Overview in Whiteface
| Characteristic | Without Mortgage | With Mortgage |
| Housing Units | 110 | 21 |
| Median Property Value | - | - |
| Median Household Income | $37,069 | $9 |
| Monthly Housing Costs | $440 | $0 |
| Real Estate Taxes | $738 | $3 |
Property Value by Mortgage Status in Whiteface
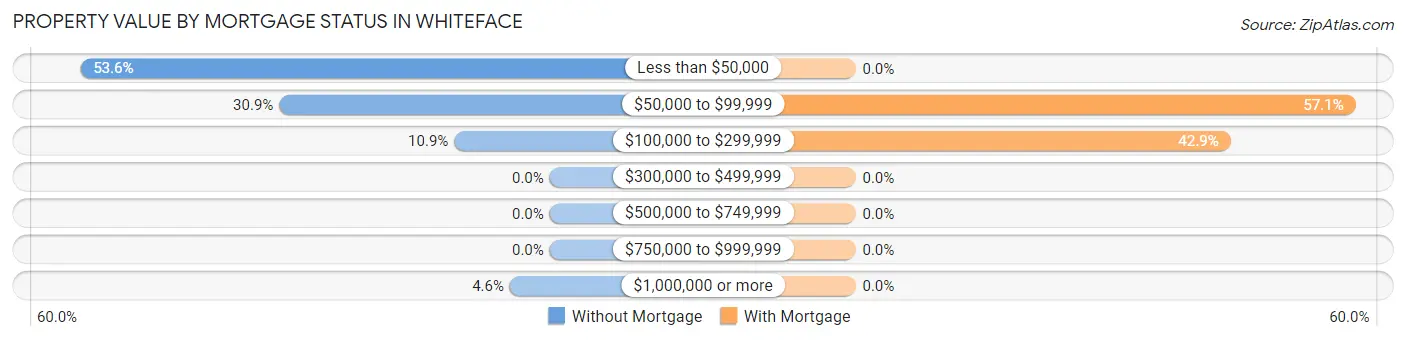
| Property Value | Without Mortgage | With Mortgage |
| Less than $50,000 | 59 (53.6%) | 0 (0.0%) |
| $50,000 to $99,999 | 34 (30.9%) | 12 (57.1%) |
| $100,000 to $299,999 | 12 (10.9%) | 9 (42.9%) |
| $300,000 to $499,999 | 0 (0.0%) | 0 (0.0%) |
| $500,000 to $749,999 | 0 (0.0%) | 0 (0.0%) |
| $750,000 to $999,999 | 0 (0.0%) | 0 (0.0%) |
| $1,000,000 or more | 5 (4.5%) | 0 (0.0%) |
| Total | 110 (100.0%) | 21 (100.0%) |
Household Income by Mortgage Status in Whiteface
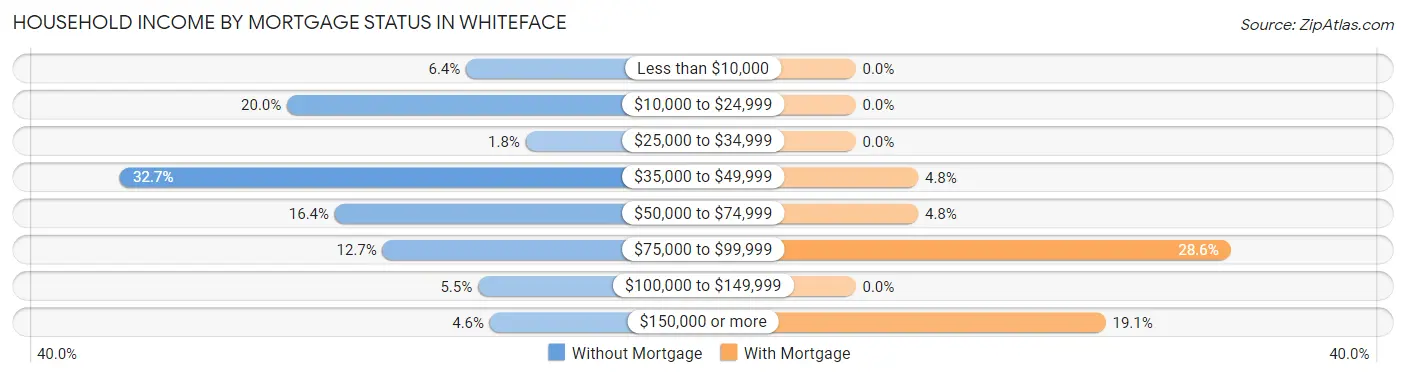
| Household Income | Without Mortgage | With Mortgage |
| Less than $10,000 | 7 (6.4%) | 0 (0.0%) |
| $10,000 to $24,999 | 22 (20.0%) | 0 (0.0%) |
| $25,000 to $34,999 | 2 (1.8%) | 0 (0.0%) |
| $35,000 to $49,999 | 36 (32.7%) | 1 (4.8%) |
| $50,000 to $74,999 | 18 (16.4%) | 1 (4.8%) |
| $75,000 to $99,999 | 14 (12.7%) | 6 (28.6%) |
| $100,000 to $149,999 | 6 (5.4%) | 0 (0.0%) |
| $150,000 or more | 5 (4.5%) | 4 (19.1%) |
| Total | 110 (100.0%) | 21 (100.0%) |
Property Value to Household Income Ratio in Whiteface
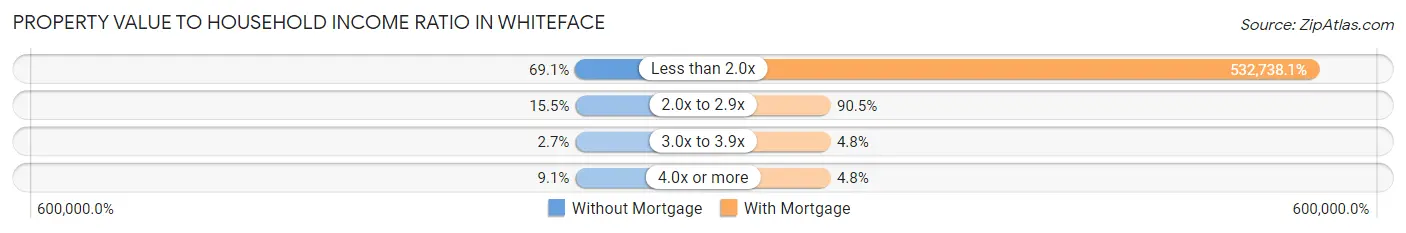
| Value-to-Income Ratio | Without Mortgage | With Mortgage |
| Less than 2.0x | 76 (69.1%) | 111,875 (532,738.1%) |
| 2.0x to 2.9x | 17 (15.4%) | 19 (90.5%) |
| 3.0x to 3.9x | 3 (2.7%) | 1 (4.8%) |
| 4.0x or more | 10 (9.1%) | 1 (4.8%) |
| Total | 110 (100.0%) | 21 (100.0%) |
Real Estate Taxes by Mortgage Status in Whiteface
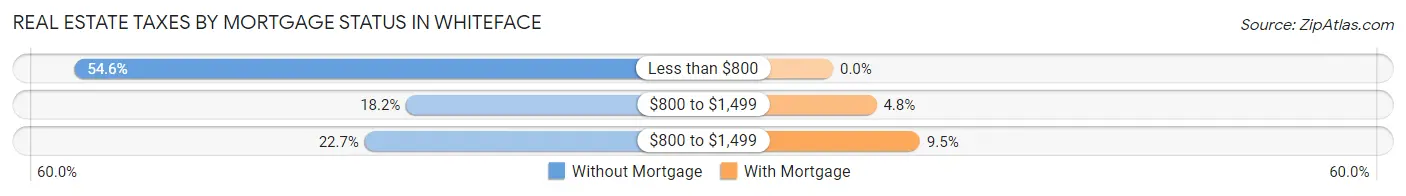
| Property Taxes | Without Mortgage | With Mortgage |
| Less than $800 | 60 (54.5%) | 0 (0.0%) |
| $800 to $1,499 | 20 (18.2%) | 1 (4.8%) |
| $800 to $1,499 | 25 (22.7%) | 2 (9.5%) |
| Total | 110 (100.0%) | 21 (100.0%) |
Health & Disability in Whiteface
Health Insurance Coverage by Age in Whiteface
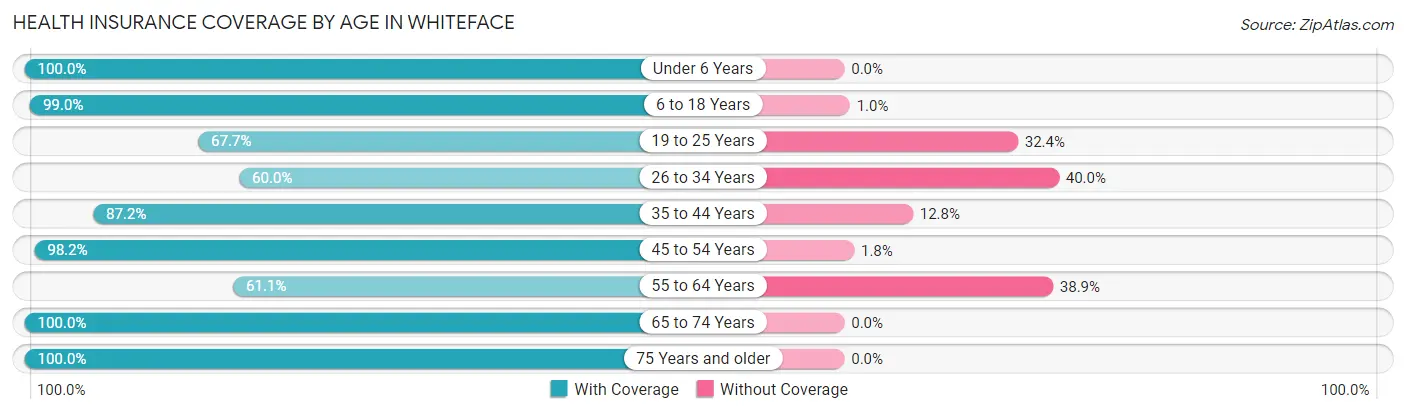
| Age Bracket | With Coverage | Without Coverage |
| Under 6 Years | 30 (100.0%) | 0 (0.0%) |
| 6 to 18 Years | 98 (99.0%) | 1 (1.0%) |
| 19 to 25 Years | 23 (67.6%) | 11 (32.4%) |
| 26 to 34 Years | 21 (60.0%) | 14 (40.0%) |
| 35 to 44 Years | 41 (87.2%) | 6 (12.8%) |
| 45 to 54 Years | 54 (98.2%) | 1 (1.8%) |
| 55 to 64 Years | 33 (61.1%) | 21 (38.9%) |
| 65 to 74 Years | 39 (100.0%) | 0 (0.0%) |
| 75 Years and older | 30 (100.0%) | 0 (0.0%) |
| Total | 369 (87.2%) | 54 (12.8%) |
Health Insurance Coverage by Citizenship Status in Whiteface
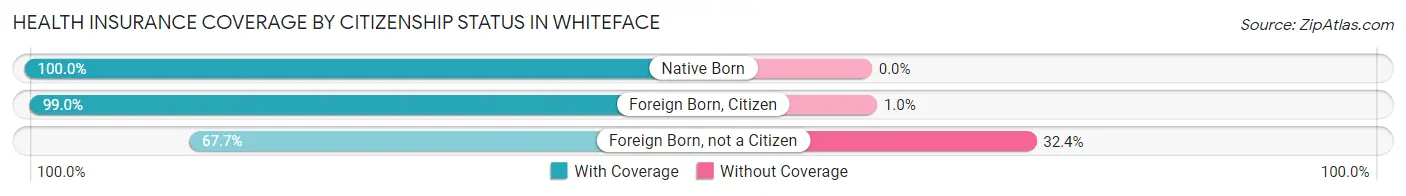
| Citizenship Status | With Coverage | Without Coverage |
| Native Born | 30 (100.0%) | 0 (0.0%) |
| Foreign Born, Citizen | 98 (99.0%) | 1 (1.0%) |
| Foreign Born, not a Citizen | 23 (67.6%) | 11 (32.4%) |
Health Insurance Coverage by Household Income in Whiteface
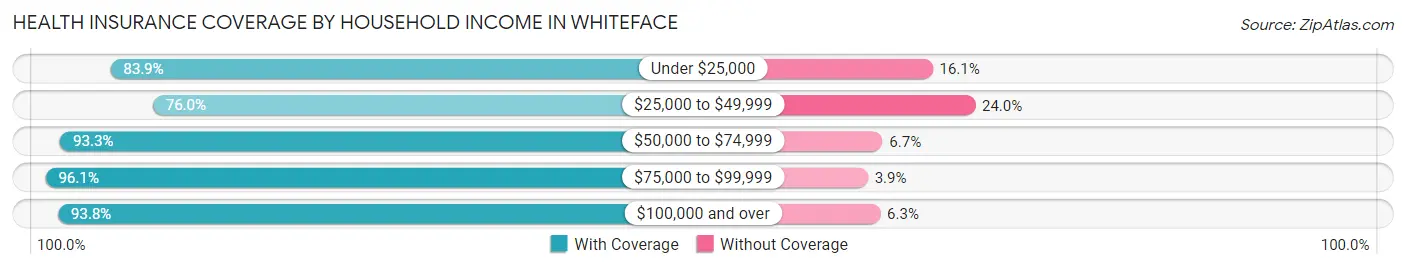
| Household Income | With Coverage | Without Coverage |
| Under $25,000 | 47 (83.9%) | 9 (16.1%) |
| $25,000 to $49,999 | 98 (76.0%) | 31 (24.0%) |
| $50,000 to $74,999 | 70 (93.3%) | 5 (6.7%) |
| $75,000 to $99,999 | 49 (96.1%) | 2 (3.9%) |
| $100,000 and over | 105 (93.8%) | 7 (6.2%) |
Public vs Private Health Insurance Coverage by Age in Whiteface
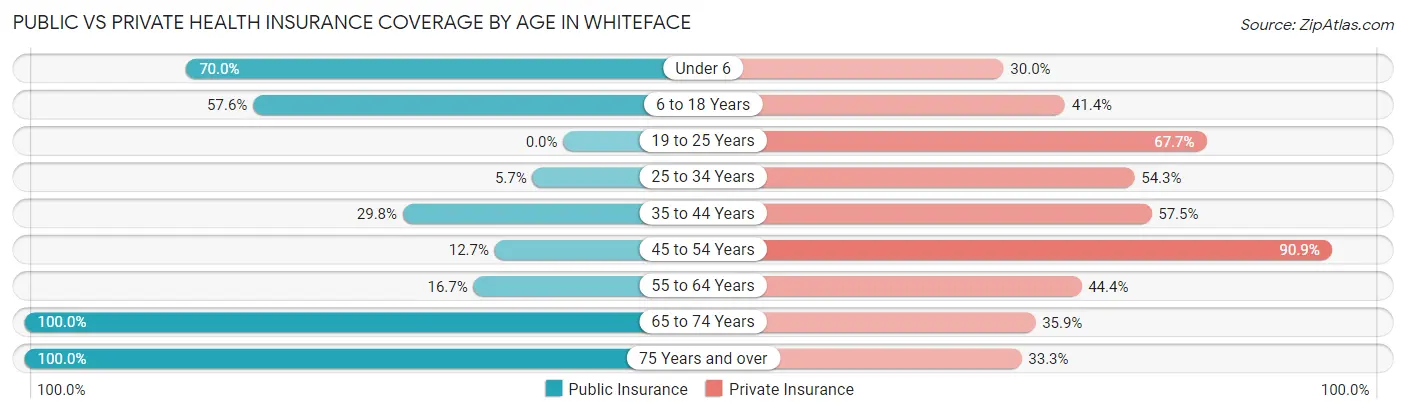
| Age Bracket | Public Insurance | Private Insurance |
| Under 6 | 21 (70.0%) | 9 (30.0%) |
| 6 to 18 Years | 57 (57.6%) | 41 (41.4%) |
| 19 to 25 Years | 0 (0.0%) | 23 (67.6%) |
| 25 to 34 Years | 2 (5.7%) | 19 (54.3%) |
| 35 to 44 Years | 14 (29.8%) | 27 (57.5%) |
| 45 to 54 Years | 7 (12.7%) | 50 (90.9%) |
| 55 to 64 Years | 9 (16.7%) | 24 (44.4%) |
| 65 to 74 Years | 39 (100.0%) | 14 (35.9%) |
| 75 Years and over | 30 (100.0%) | 10 (33.3%) |
| Total | 179 (42.3%) | 217 (51.3%) |
Disability Status by Sex by Age in Whiteface
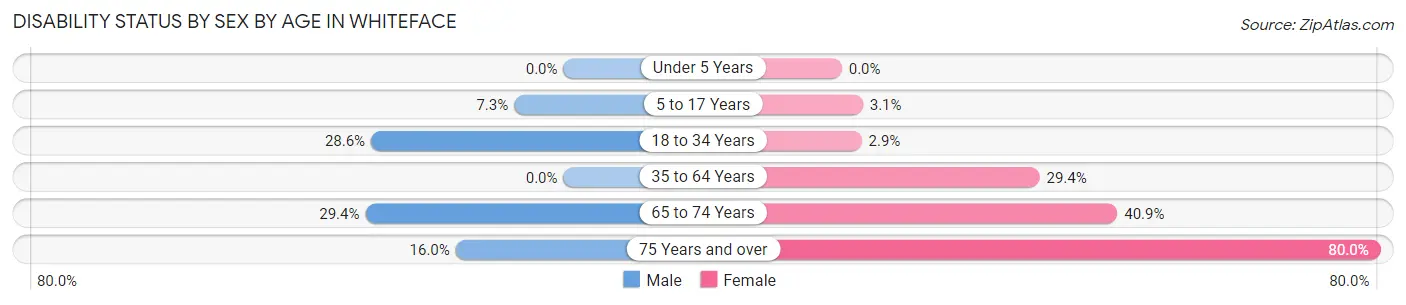
| Age Bracket | Male | Female |
| Under 5 Years | 0 (0.0%) | 0 (0.0%) |
| 5 to 17 Years | 3 (7.3%) | 2 (3.1%) |
| 18 to 34 Years | 10 (28.6%) | 1 (2.9%) |
| 35 to 64 Years | 0 (0.0%) | 32 (29.4%) |
| 65 to 74 Years | 5 (29.4%) | 9 (40.9%) |
| 75 Years and over | 4 (16.0%) | 4 (80.0%) |
Disability Class by Sex by Age in Whiteface
Disability Class: Hearing Difficulty
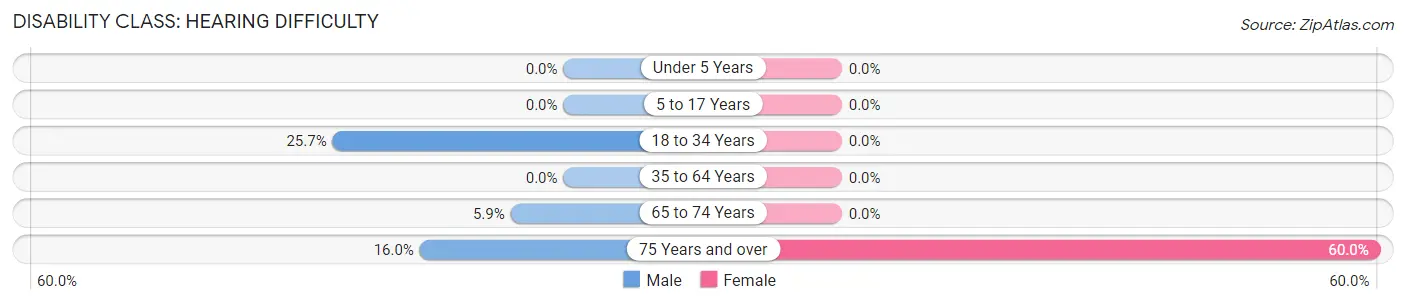
| Age Bracket | Male | Female |
| Under 5 Years | 0 (0.0%) | 0 (0.0%) |
| 5 to 17 Years | 0 (0.0%) | 0 (0.0%) |
| 18 to 34 Years | 9 (25.7%) | 0 (0.0%) |
| 35 to 64 Years | 0 (0.0%) | 0 (0.0%) |
| 65 to 74 Years | 1 (5.9%) | 0 (0.0%) |
| 75 Years and over | 4 (16.0%) | 3 (60.0%) |
Disability Class: Vision Difficulty
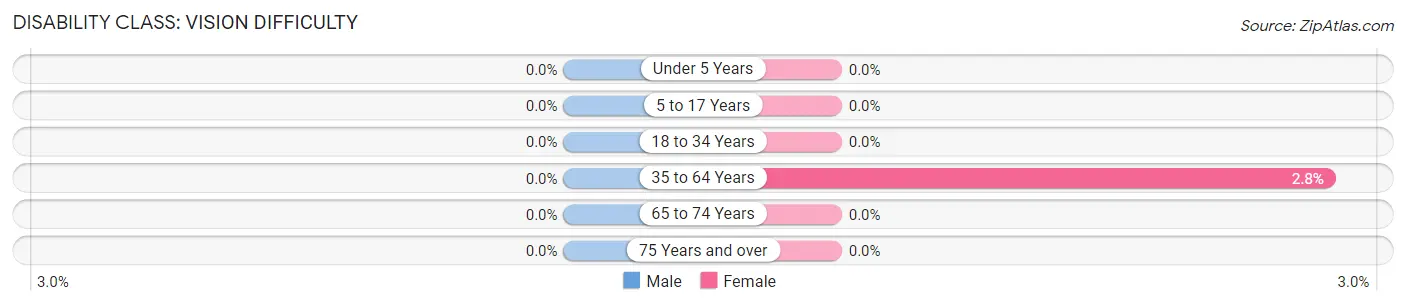
| Age Bracket | Male | Female |
| Under 5 Years | 0 (0.0%) | 0 (0.0%) |
| 5 to 17 Years | 0 (0.0%) | 0 (0.0%) |
| 18 to 34 Years | 0 (0.0%) | 0 (0.0%) |
| 35 to 64 Years | 0 (0.0%) | 3 (2.8%) |
| 65 to 74 Years | 0 (0.0%) | 0 (0.0%) |
| 75 Years and over | 0 (0.0%) | 0 (0.0%) |
Disability Class: Cognitive Difficulty
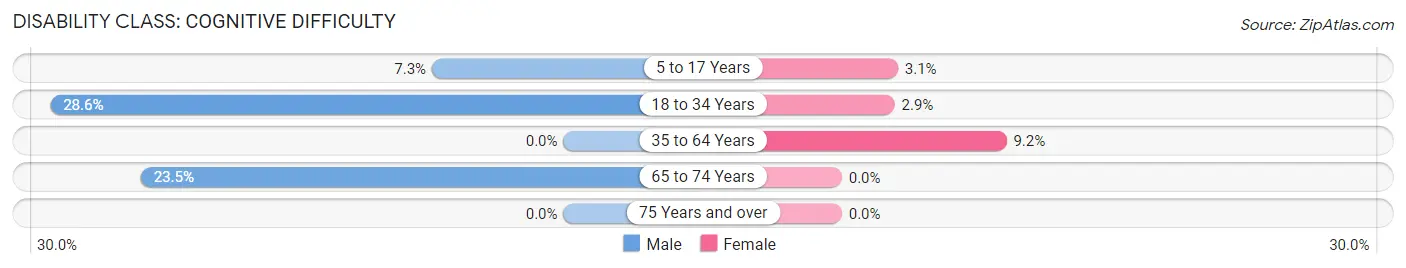
| Age Bracket | Male | Female |
| 5 to 17 Years | 3 (7.3%) | 2 (3.1%) |
| 18 to 34 Years | 10 (28.6%) | 1 (2.9%) |
| 35 to 64 Years | 0 (0.0%) | 10 (9.2%) |
| 65 to 74 Years | 4 (23.5%) | 0 (0.0%) |
| 75 Years and over | 0 (0.0%) | 0 (0.0%) |
Disability Class: Ambulatory Difficulty
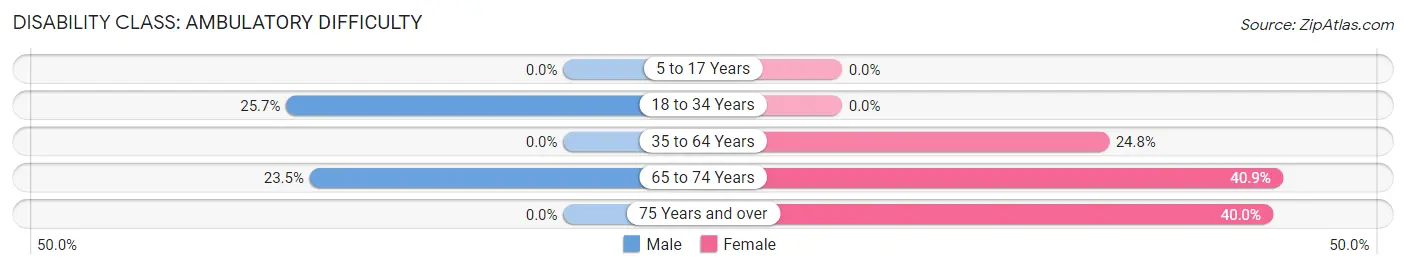
| Age Bracket | Male | Female |
| 5 to 17 Years | 0 (0.0%) | 0 (0.0%) |
| 18 to 34 Years | 9 (25.7%) | 0 (0.0%) |
| 35 to 64 Years | 0 (0.0%) | 27 (24.8%) |
| 65 to 74 Years | 4 (23.5%) | 9 (40.9%) |
| 75 Years and over | 0 (0.0%) | 2 (40.0%) |
Disability Class: Self-Care Difficulty
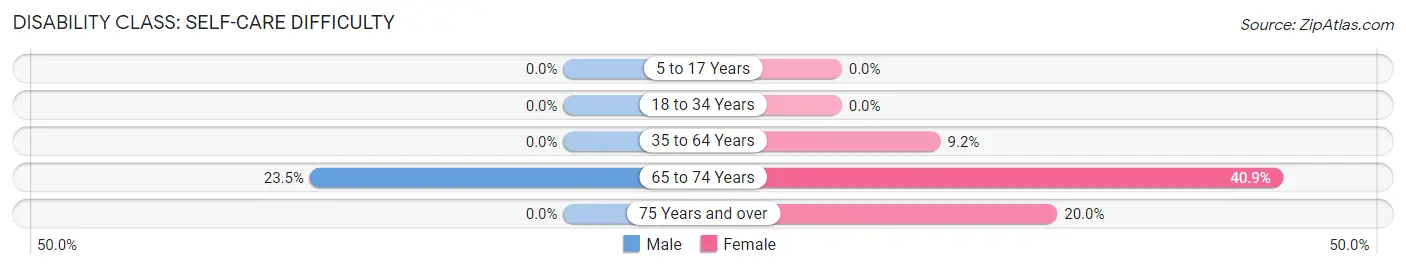
| Age Bracket | Male | Female |
| 5 to 17 Years | 0 (0.0%) | 0 (0.0%) |
| 18 to 34 Years | 0 (0.0%) | 0 (0.0%) |
| 35 to 64 Years | 0 (0.0%) | 10 (9.2%) |
| 65 to 74 Years | 4 (23.5%) | 9 (40.9%) |
| 75 Years and over | 0 (0.0%) | 1 (20.0%) |
Technology Access in Whiteface
Computing Device Access in Whiteface
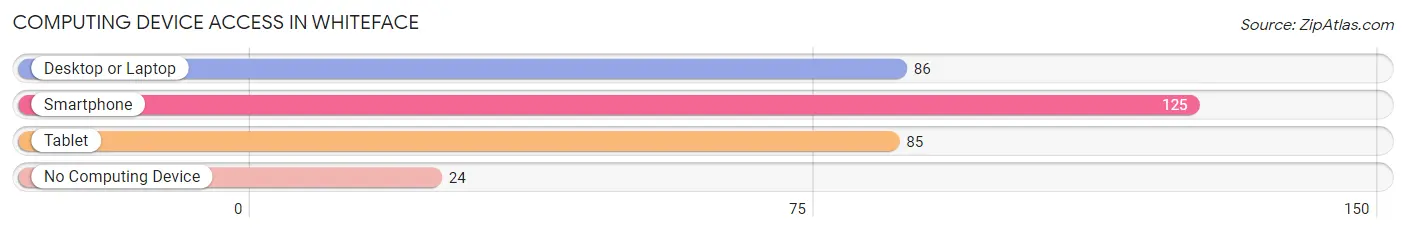
| Device Type | # Households | % Households |
| Desktop or Laptop | 86 | 52.8% |
| Smartphone | 125 | 76.7% |
| Tablet | 85 | 52.1% |
| No Computing Device | 24 | 14.7% |
| Total | 163 | 100.0% |
Internet Access in Whiteface
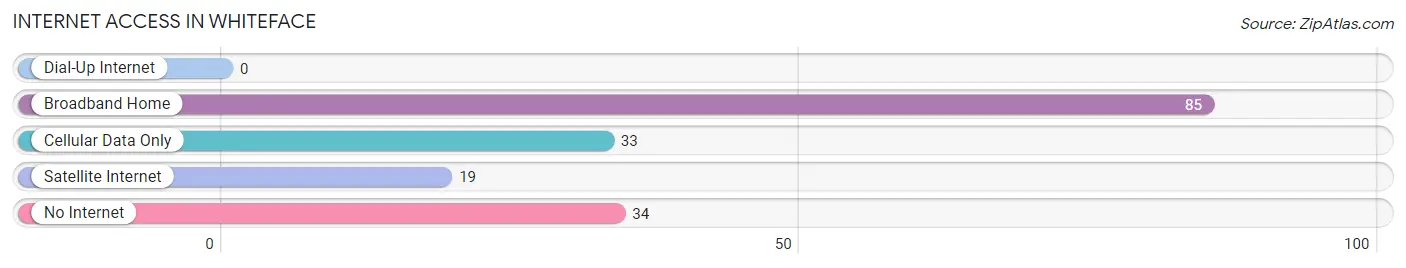
| Internet Type | # Households | % Households |
| Dial-Up Internet | 0 | 0.0% |
| Broadband Home | 85 | 52.1% |
| Cellular Data Only | 33 | 20.3% |
| Satellite Internet | 19 | 11.7% |
| No Internet | 34 | 20.9% |
| Total | 163 | 100.0% |
Whiteface Summary
Whiteface, Texas is a small town located in Cochran County, Texas. It is situated in the South Plains region of the state, approximately 25 miles east of Lubbock. The town was founded in the early 1900s and has a population of approximately 1,000 people.
History
Whiteface, Texas was founded in the early 1900s by a group of settlers from the nearby town of Morton. The settlers were looking for a place to settle and start a new life. The town was named after the white face of a nearby mountain. The town was originally a farming community, but it soon became a center for the oil and gas industry. In the 1920s, the town was home to several oil and gas companies, including the Whiteface Oil Company.
In the 1930s, the town experienced a period of growth and prosperity. The population increased from 500 to 1,000 people. The town was home to several businesses, including a bank, a hotel, a movie theater, and a grocery store.
In the 1940s, the town experienced a decline in population due to the Great Depression and World War II. The population decreased to 500 people. The town was also affected by the Dust Bowl, which caused many of the farmers to leave the area.
In the 1950s, the town experienced a period of growth and prosperity again. The population increased to 1,000 people. The town was home to several businesses, including a bank, a hotel, a movie theater, and a grocery store.
In the 1960s, the town experienced a period of decline. The population decreased to 500 people. The town was also affected by the Dust Bowl, which caused many of the farmers to leave the area.
In the 1970s, the town experienced a period of growth and prosperity again. The population increased to 1,000 people. The town was home to several businesses, including a bank, a hotel, a movie theater, and a grocery store.
In the 1980s, the town experienced a period of decline. The population decreased to 500 people. The town was also affected by the Dust Bowl, which caused many of the farmers to leave the area.
In the 1990s, the town experienced a period of growth and prosperity again. The population increased to 1,000 people. The town was home to several businesses, including a bank, a hotel, a movie theater, and a grocery store.
Geography
Whiteface, Texas is located in the South Plains region of the state, approximately 25 miles east of Lubbock. The town is situated on the Whiteface Mountain, which is a part of the Caprock Escarpment. The town is surrounded by flat plains and rolling hills. The climate in Whiteface is semi-arid, with hot summers and mild winters.
Economy
Whiteface, Texas is a small town with a population of approximately 1,000 people. The town is home to several businesses, including a bank, a hotel, a movie theater, and a grocery store. The town is also home to several oil and gas companies, including the Whiteface Oil Company. The town is also home to several farms, which produce cotton, wheat, and other crops.
Demographics
As of the 2010 census, the population of Whiteface, Texas was 1,000 people. The racial makeup of the town was 97.2% White, 0.7% African American, 0.3% Native American, 0.3% Asian, 0.1% Pacific Islander, 0.7% from other races, and 0.9% from two or more races. Hispanic or Latino of any race were 2.3% of the population.
The median income for a household in Whiteface, Texas was $31,250, and the median income for a family was $37,500. The per capita income for the town was $15,945. About 15.2% of families and 18.2% of the population were below the poverty line, including 25.0% of those under age 18 and 10.0% of those age 65 or over.
Common Questions
What is Per Capita Income in Whiteface?
Per Capita income in Whiteface is $23,597.
What is the Median Family Income in Whiteface?
Median Family Income in Whiteface is $53,646.
What is the Median Household income in Whiteface?
Median Household Income in Whiteface is $52,813.
What is Income or Wage Gap in Whiteface?
Income or Wage Gap in Whiteface is 36.9%.
Women in Whiteface earn 63.1 cents for every dollar earned by a man.
What is Inequality or Gini Index in Whiteface?
Inequality or Gini Index in Whiteface is 0.40.
What is the Total Population of Whiteface?
Total Population of Whiteface is 423.
What is the Total Male Population of Whiteface?
Total Male Population of Whiteface is 176.
What is the Total Female Population of Whiteface?
Total Female Population of Whiteface is 247.
What is the Ratio of Males per 100 Females in Whiteface?
There are 71.26 Males per 100 Females in Whiteface.
What is the Ratio of Females per 100 Males in Whiteface?
There are 140.34 Females per 100 Males in Whiteface.
What is the Median Population Age in Whiteface?
Median Population Age in Whiteface is 37.5 Years.
What is the Average Family Size in Whiteface
Average Family Size in Whiteface is 2.8 People.
What is the Average Household Size in Whiteface
Average Household Size in Whiteface is 2.6 People.
How Large is the Labor Force in Whiteface?
There are 176 People in the Labor Forcein in Whiteface.
What is the Percentage of People in the Labor Force in Whiteface?
55.3% of People are in the Labor Force in Whiteface.
What is the Unemployment Rate in Whiteface?
Unemployment Rate in Whiteface is 8.0%.