Zip Codes with the Highest Percentage of Population Employed in Office & Administration in San Antonio, TX
RELATED REPORTS & OPTIONS
Office & Administration
San Antonio
Compare Zip Codes
Map of Zip Codes with the Highest Percentage of Population Employed in Office & Administration in San Antonio
2.2%
24.3%
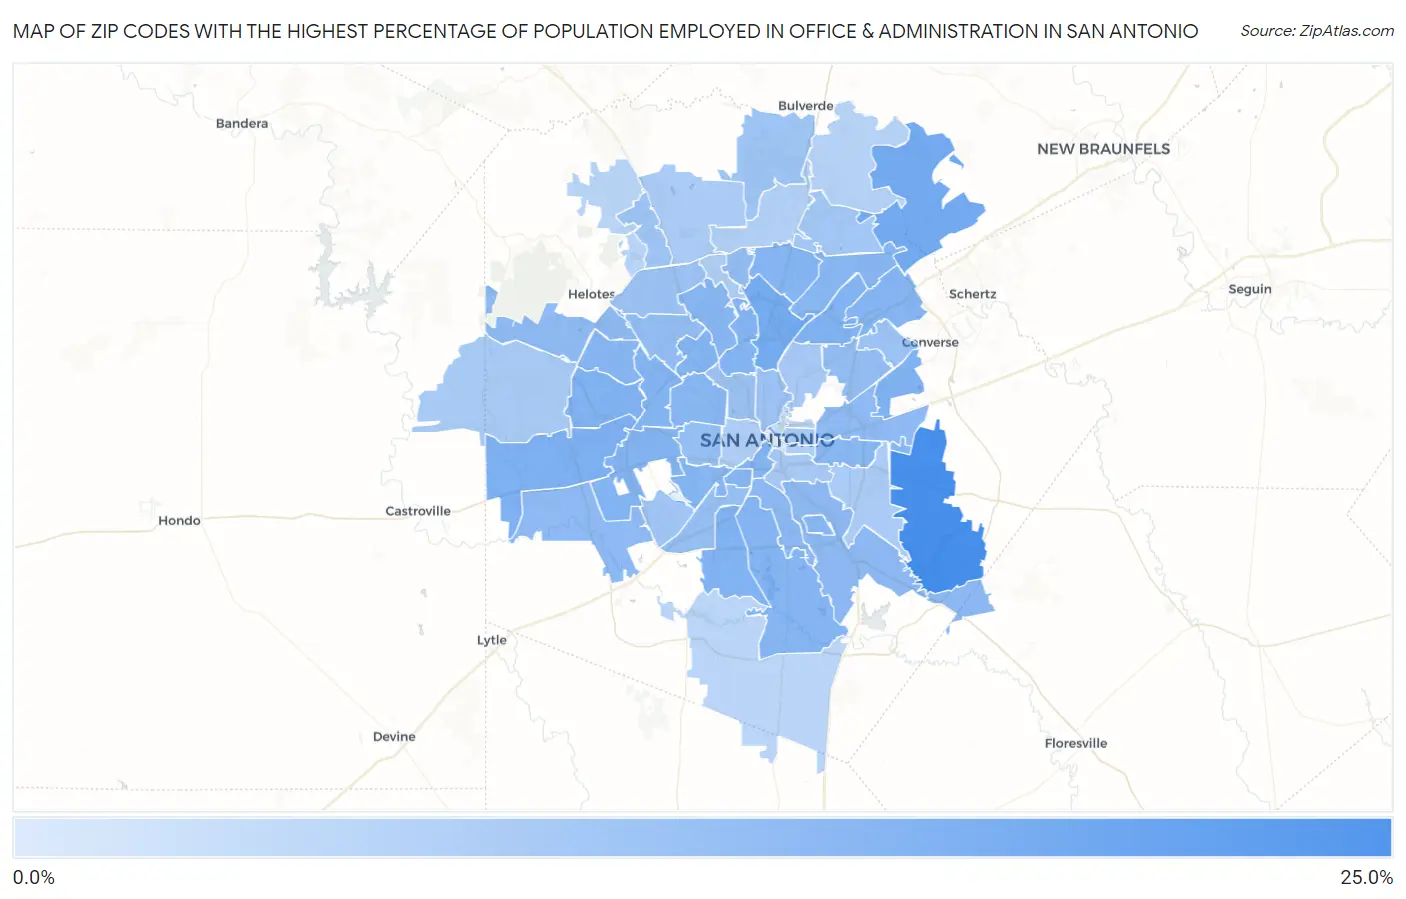
Zip Codes with the Highest Percentage of Population Employed in Office & Administration in San Antonio, TX
| Zip Code | % Employed | vs State | vs National | |
| 1. | 78263 | 24.3% | 11.0%(+13.3)#59 | 10.9%(+13.4)#991 |
| 2. | 78266 | 17.5% | 11.0%(+6.52)#150 | 10.9%(+6.64)#2,596 |
| 3. | 78216 | 16.9% | 11.0%(+5.88)#168 | 10.9%(+6.00)#2,931 |
| 4. | 78245 | 15.6% | 11.0%(+4.65)#222 | 10.9%(+4.77)#3,892 |
| 5. | 78217 | 15.4% | 11.0%(+4.42)#238 | 10.9%(+4.53)#4,104 |
| 6. | 78251 | 15.3% | 11.0%(+4.30)#248 | 10.9%(+4.42)#4,236 |
| 7. | 78244 | 15.2% | 11.0%(+4.27)#251 | 10.9%(+4.38)#4,276 |
| 8. | 78224 | 15.1% | 11.0%(+4.13)#263 | 10.9%(+4.24)#4,443 |
| 9. | 78204 | 15.1% | 11.0%(+4.11)#264 | 10.9%(+4.22)#4,460 |
| 10. | 78229 | 15.1% | 11.0%(+4.08)#266 | 10.9%(+4.20)#4,496 |
| 11. | 78213 | 15.0% | 11.0%(+4.06)#270 | 10.9%(+4.17)#4,526 |
| 12. | 78227 | 15.0% | 11.0%(+4.03)#272 | 10.9%(+4.15)#4,552 |
| 13. | 78238 | 14.9% | 11.0%(+3.94)#279 | 10.9%(+4.05)#4,676 |
| 14. | 78221 | 14.7% | 11.0%(+3.73)#301 | 10.9%(+3.85)#4,970 |
| 15. | 78232 | 14.6% | 11.0%(+3.64)#311 | 10.9%(+3.76)#5,094 |
| 16. | 78225 | 14.6% | 11.0%(+3.64)#312 | 10.9%(+3.76)#5,095 |
| 17. | 78233 | 14.6% | 11.0%(+3.60)#315 | 10.9%(+3.71)#5,165 |
| 18. | 78228 | 14.3% | 11.0%(+3.28)#343 | 10.9%(+3.40)#5,630 |
| 19. | 78226 | 14.2% | 11.0%(+3.26)#347 | 10.9%(+3.38)#5,660 |
| 20. | 78230 | 14.2% | 11.0%(+3.24)#350 | 10.9%(+3.35)#5,690 |
| 21. | 78250 | 14.1% | 11.0%(+3.10)#362 | 10.9%(+3.22)#5,889 |
| 22. | 78220 | 14.1% | 11.0%(+3.10)#363 | 10.9%(+3.21)#5,894 |
| 23. | 78247 | 14.1% | 11.0%(+3.10)#365 | 10.9%(+3.21)#5,898 |
| 24. | 78235 | 14.1% | 11.0%(+3.08)#368 | 10.9%(+3.20)#5,931 |
| 25. | 78214 | 13.6% | 11.0%(+2.61)#416 | 10.9%(+2.73)#6,753 |
| 26. | 78223 | 13.4% | 11.0%(+2.40)#449 | 10.9%(+2.51)#7,221 |
| 27. | 78252 | 13.1% | 11.0%(+2.17)#481 | 10.9%(+2.28)#7,725 |
| 28. | 78219 | 13.1% | 11.0%(+2.11)#493 | 10.9%(+2.23)#7,868 |
| 29. | 78254 | 13.1% | 11.0%(+2.10)#498 | 10.9%(+2.21)#7,903 |
| 30. | 78240 | 12.6% | 11.0%(+1.66)#565 | 10.9%(+1.77)#8,966 |
| 31. | 78248 | 12.6% | 11.0%(+1.61)#572 | 10.9%(+1.72)#9,093 |
| 32. | 78218 | 12.4% | 11.0%(+1.40)#605 | 10.9%(+1.51)#9,666 |
| 33. | 78211 | 12.1% | 11.0%(+1.08)#642 | 10.9%(+1.20)#10,552 |
| 34. | 78237 | 12.0% | 11.0%(+1.07)#646 | 10.9%(+1.19)#10,579 |
| 35. | 78201 | 11.6% | 11.0%(+0.656)#709 | 10.9%(+0.772)#11,851 |
| 36. | 78239 | 11.4% | 11.0%(+0.382)#757 | 10.9%(+0.497)#12,710 |
| 37. | 78212 | 11.2% | 11.0%(+0.195)#791 | 10.9%(+0.310)#13,311 |
| 38. | 78249 | 11.1% | 11.0%(+0.103)#811 | 10.9%(+0.218)#13,615 |
| 39. | 78260 | 10.9% | 11.0%(-0.086)#852 | 10.9%(+0.029)#14,236 |
| 40. | 78256 | 10.5% | 11.0%(-0.483)#924 | 10.9%(-0.368)#15,530 |
| 41. | 78242 | 10.4% | 11.0%(-0.541)#943 | 10.9%(-0.426)#15,716 |
| 42. | 78259 | 10.1% | 11.0%(-0.888)#1,019 | 10.9%(-0.773)#16,857 |
| 43. | 78210 | 9.9% | 11.0%(-1.03)#1,051 | 10.9%(-0.919)#17,320 |
| 44. | 78209 | 9.8% | 11.0%(-1.22)#1,095 | 10.9%(-1.10)#17,896 |
| 45. | 78202 | 9.4% | 11.0%(-1.54)#1,159 | 10.9%(-1.43)#18,974 |
| 46. | 78253 | 9.4% | 11.0%(-1.56)#1,160 | 10.9%(-1.44)#19,029 |
| 47. | 78222 | 9.3% | 11.0%(-1.69)#1,179 | 10.9%(-1.57)#19,418 |
| 48. | 78257 | 9.3% | 11.0%(-1.70)#1,182 | 10.9%(-1.58)#19,458 |
| 49. | 78207 | 8.6% | 11.0%(-2.34)#1,276 | 10.9%(-2.23)#21,340 |
| 50. | 78203 | 8.5% | 11.0%(-2.43)#1,290 | 10.9%(-2.32)#21,588 |
| 51. | 78231 | 8.1% | 11.0%(-2.91)#1,375 | 10.9%(-2.79)#22,870 |
| 52. | 78258 | 7.7% | 11.0%(-3.25)#1,414 | 10.9%(-3.13)#23,645 |
| 53. | 78261 | 7.4% | 11.0%(-3.54)#1,447 | 10.9%(-3.43)#24,331 |
| 54. | 78255 | 7.0% | 11.0%(-3.94)#1,488 | 10.9%(-3.82)#25,157 |
| 55. | 78208 | 6.9% | 11.0%(-4.09)#1,508 | 10.9%(-3.98)#25,444 |
| 56. | 78264 | 6.8% | 11.0%(-4.17)#1,515 | 10.9%(-4.06)#25,576 |
| 57. | 78215 | 4.6% | 11.0%(-6.35)#1,655 | 10.9%(-6.24)#28,444 |
| 58. | 78205 | 2.2% | 11.0%(-8.82)#1,742 | 10.9%(-8.70)#30,039 |
1
Common Questions
What are the Top 10 Zip Codes with the Highest Percentage of Population Employed in Office & Administration in San Antonio, TX?
Top 10 Zip Codes with the Highest Percentage of Population Employed in Office & Administration in San Antonio, TX are:
What zip code has the Highest Percentage of Population Employed in Office & Administration in San Antonio, TX?
78263 has the Highest Percentage of Population Employed in Office & Administration in San Antonio, TX with 24.3%.
What is the Percentage of Population Employed in Office & Administration in San Antonio, TX?
Percentage of Population Employed in Office & Administration in San Antonio is 13.1%.
What is the Percentage of Population Employed in Office & Administration in Texas?
Percentage of Population Employed in Office & Administration in Texas is 11.0%.
What is the Percentage of Population Employed in Office & Administration in the United States?
Percentage of Population Employed in Office & Administration in the United States is 10.9%.