Zip Codes with the Highest Percentage of Population Employed in Office & Administration in Abilene, TX
RELATED REPORTS & OPTIONS
Office & Administration
Abilene
Compare Zip Codes
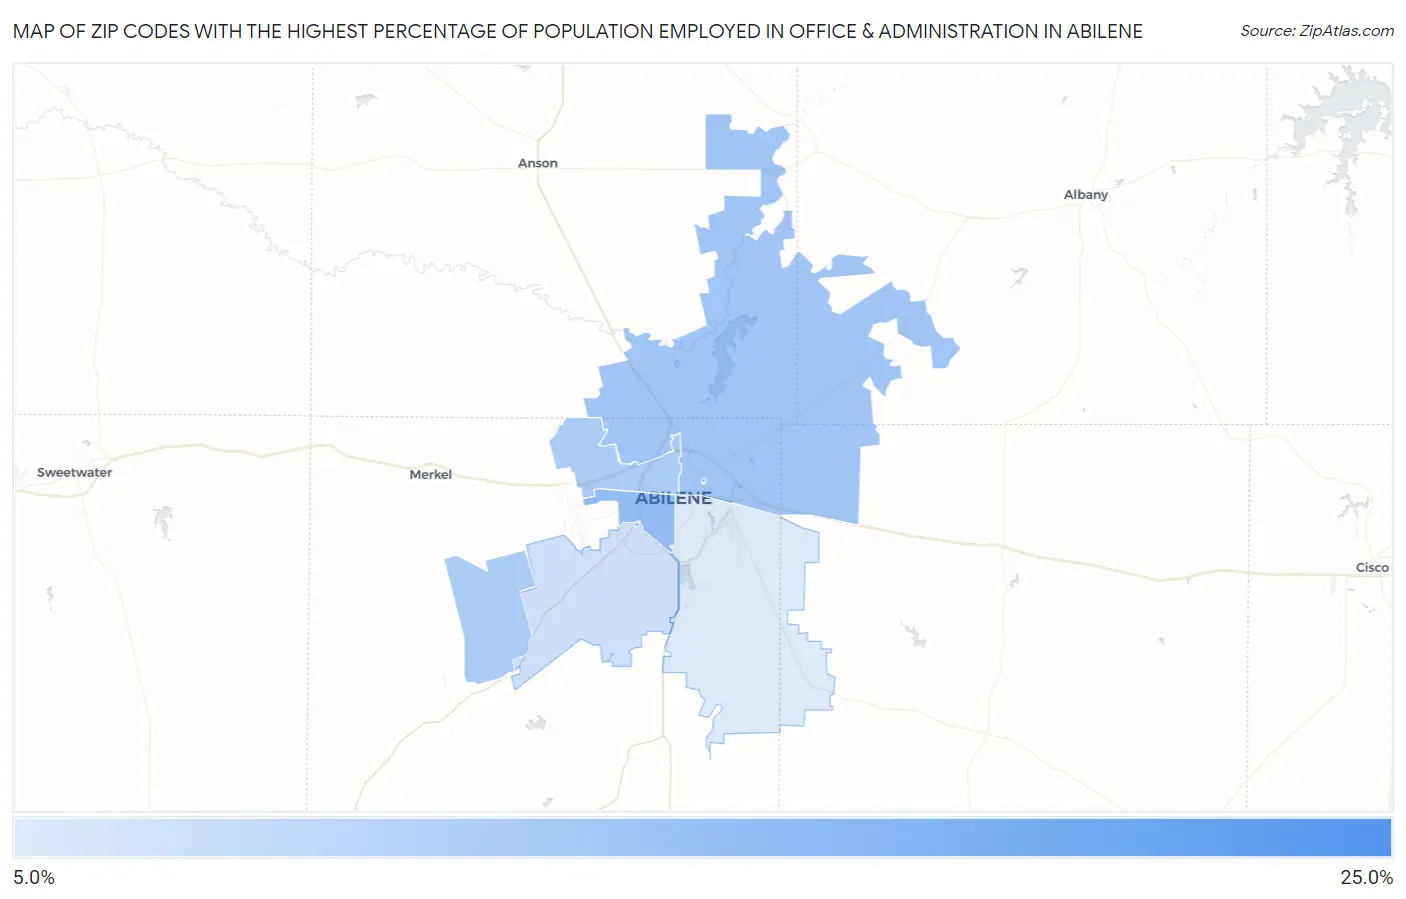
Map of Zip Codes with the Highest Percentage of Population Employed in Office & Administration in Abilene
8.5%
21.8%
Zip Codes with the Highest Percentage of Population Employed in Office & Administration in Abilene, TX
| Zip Code | % Employed | vs State | vs National | |
| 1. | 79699 | 21.8% | 11.0%(+10.8)#84 | 10.9%(+10.9)#1,347 |
| 2. | 79605 | 14.8% | 11.0%(+3.88)#288 | 10.9%(+3.99)#4,772 |
| 3. | 79601 | 13.5% | 11.0%(+2.56)#423 | 10.9%(+2.68)#6,859 |
| 4. | 79603 | 12.8% | 11.0%(+1.86)#528 | 10.9%(+1.97)#8,469 |
| 5. | 79606 | 9.7% | 11.0%(-1.24)#1,101 | 10.9%(-1.12)#17,958 |
| 6. | 79602 | 8.5% | 11.0%(-2.50)#1,309 | 10.9%(-2.39)#21,780 |
1
Common Questions
What are the Top 5 Zip Codes with the Highest Percentage of Population Employed in Office & Administration in Abilene, TX?
Top 5 Zip Codes with the Highest Percentage of Population Employed in Office & Administration in Abilene, TX are:
What zip code has the Highest Percentage of Population Employed in Office & Administration in Abilene, TX?
79699 has the Highest Percentage of Population Employed in Office & Administration in Abilene, TX with 21.8%.
What is the Percentage of Population Employed in Office & Administration in Abilene, TX?
Percentage of Population Employed in Office & Administration in Abilene is 11.9%.
What is the Percentage of Population Employed in Office & Administration in Texas?
Percentage of Population Employed in Office & Administration in Texas is 11.0%.
What is the Percentage of Population Employed in Office & Administration in the United States?
Percentage of Population Employed in Office & Administration in the United States is 10.9%.