Zip Codes with the Highest Percentage of Population Employed in Office & Administration in Richmond, TX
RELATED REPORTS & OPTIONS
Office & Administration
Richmond
Compare Zip Codes
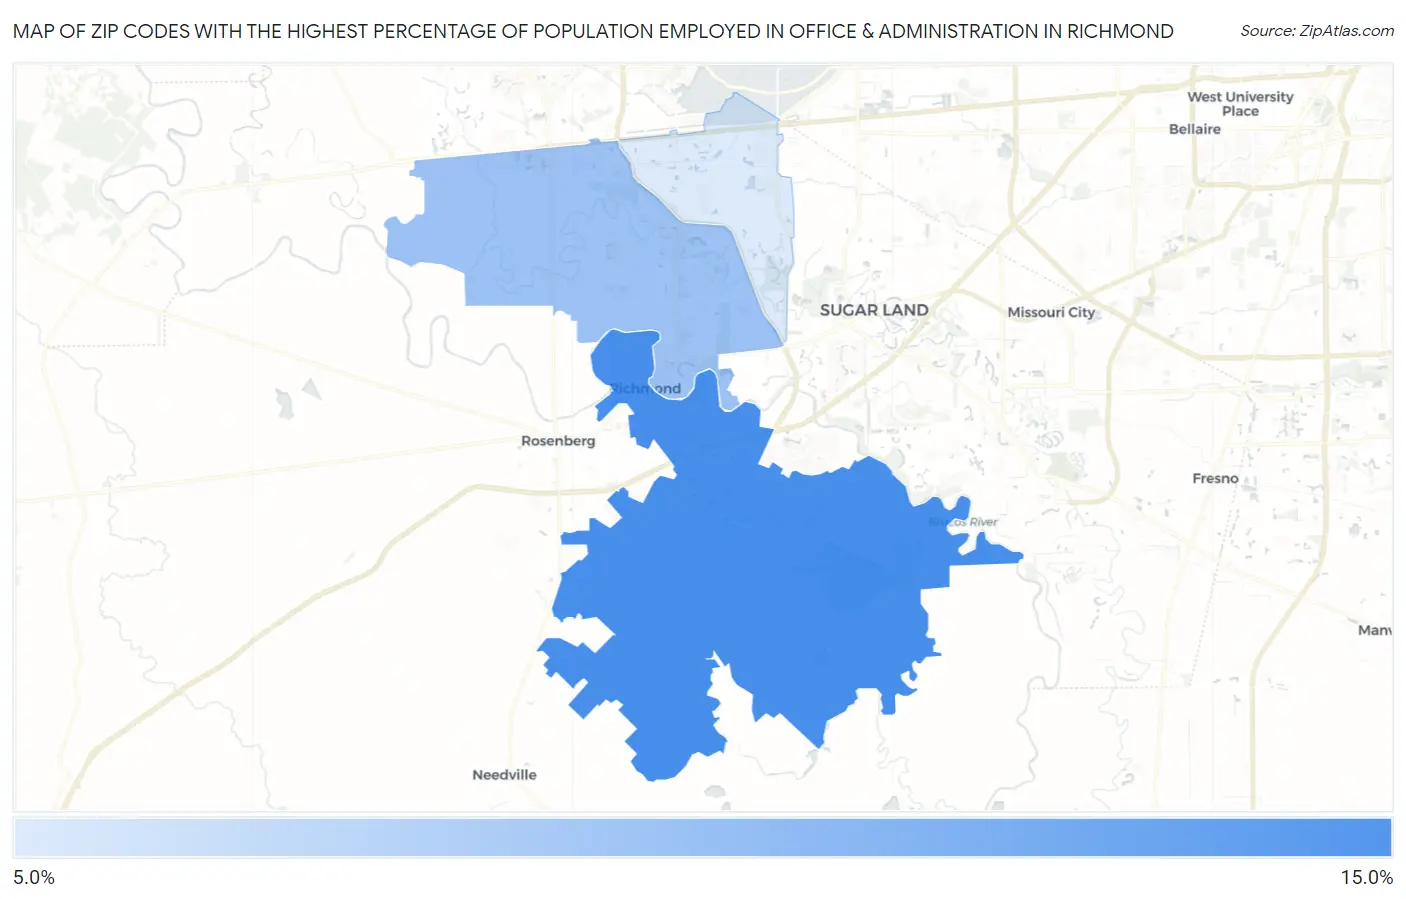
Map of Zip Codes with the Highest Percentage of Population Employed in Office & Administration in Richmond
8.1%
11.0%
Zip Codes with the Highest Percentage of Population Employed in Office & Administration in Richmond, TX
| Zip Code | % Employed | vs State | vs National | |
| 1. | 77469 | 11.0% | 11.0%(+0.051)#826 | 10.9%(+0.166)#13,761 |
| 2. | 77406 | 9.4% | 11.0%(-1.59)#1,167 | 10.9%(-1.48)#19,152 |
| 3. | 77407 | 8.1% | 11.0%(-2.85)#1,360 | 10.9%(-2.73)#22,723 |
1
Common Questions
What are the Top Zip Codes with the Highest Percentage of Population Employed in Office & Administration in Richmond, TX?
Top Zip Codes with the Highest Percentage of Population Employed in Office & Administration in Richmond, TX are:
What zip code has the Highest Percentage of Population Employed in Office & Administration in Richmond, TX?
77469 has the Highest Percentage of Population Employed in Office & Administration in Richmond, TX with 11.0%.
What is the Percentage of Population Employed in Office & Administration in Richmond, TX?
Percentage of Population Employed in Office & Administration in Richmond is 15.6%.
What is the Percentage of Population Employed in Office & Administration in Texas?
Percentage of Population Employed in Office & Administration in Texas is 11.0%.
What is the Percentage of Population Employed in Office & Administration in the United States?
Percentage of Population Employed in Office & Administration in the United States is 10.9%.