Sadler, TX Map & Demographics
Sadler Map
Sadler Overview
$23,362
PER CAPITA INCOME
$48,375
AVG FAMILY INCOME
$48,625
AVG HOUSEHOLD INCOME
15.9%
WAGE / INCOME GAP [ % ]
84.1¢/ $1
WAGE / INCOME GAP [ $ ]
0.33
INEQUALITY / GINI INDEX
330
TOTAL POPULATION
169
MALE POPULATION
161
FEMALE POPULATION
104.97
MALES / 100 FEMALES
95.27
FEMALES / 100 MALES
43.7
MEDIAN AGE
3.0
AVG FAMILY SIZE
2.2
AVG HOUSEHOLD SIZE
176
LABOR FORCE [ PEOPLE ]
61.5%
PERCENT IN LABOR FORCE
Sadler Zip Codes
Income in Sadler
Income Overview in Sadler
Per Capita Income in Sadler is $23,362, while median incomes of families and households are $48,375 and $48,625 respectively.
| Characteristic | Number | Measure |
| Per Capita Income | 330 | $23,362 |
| Median Family Income | 61 | $48,375 |
| Mean Family Income | 61 | $61,848 |
| Median Household Income | 151 | $48,625 |
| Mean Household Income | 151 | $49,743 |
| Income Deficit | 61 | $0 |
| Wage / Income Gap (%) | 330 | 15.90% |
| Wage / Income Gap ($) | 330 | 84.10¢ per $1 |
| Gini / Inequality Index | 330 | 0.33 |
Earnings by Sex in Sadler
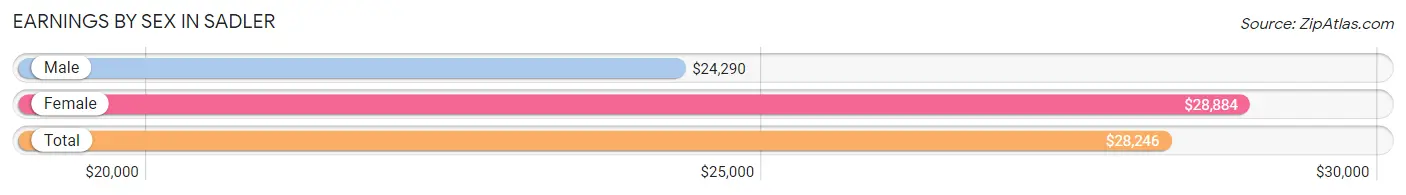
Average Earnings in Sadler are $28,246, $24,290 for men and $28,884 for women, a difference of 15.9%.
| Sex | Number | Average Earnings |
| Male | 95 (51.3%) | $24,290 |
| Female | 90 (48.6%) | $28,884 |
| Total | 185 (100.0%) | $28,246 |
Earnings by Sex by Income Bracket in Sadler
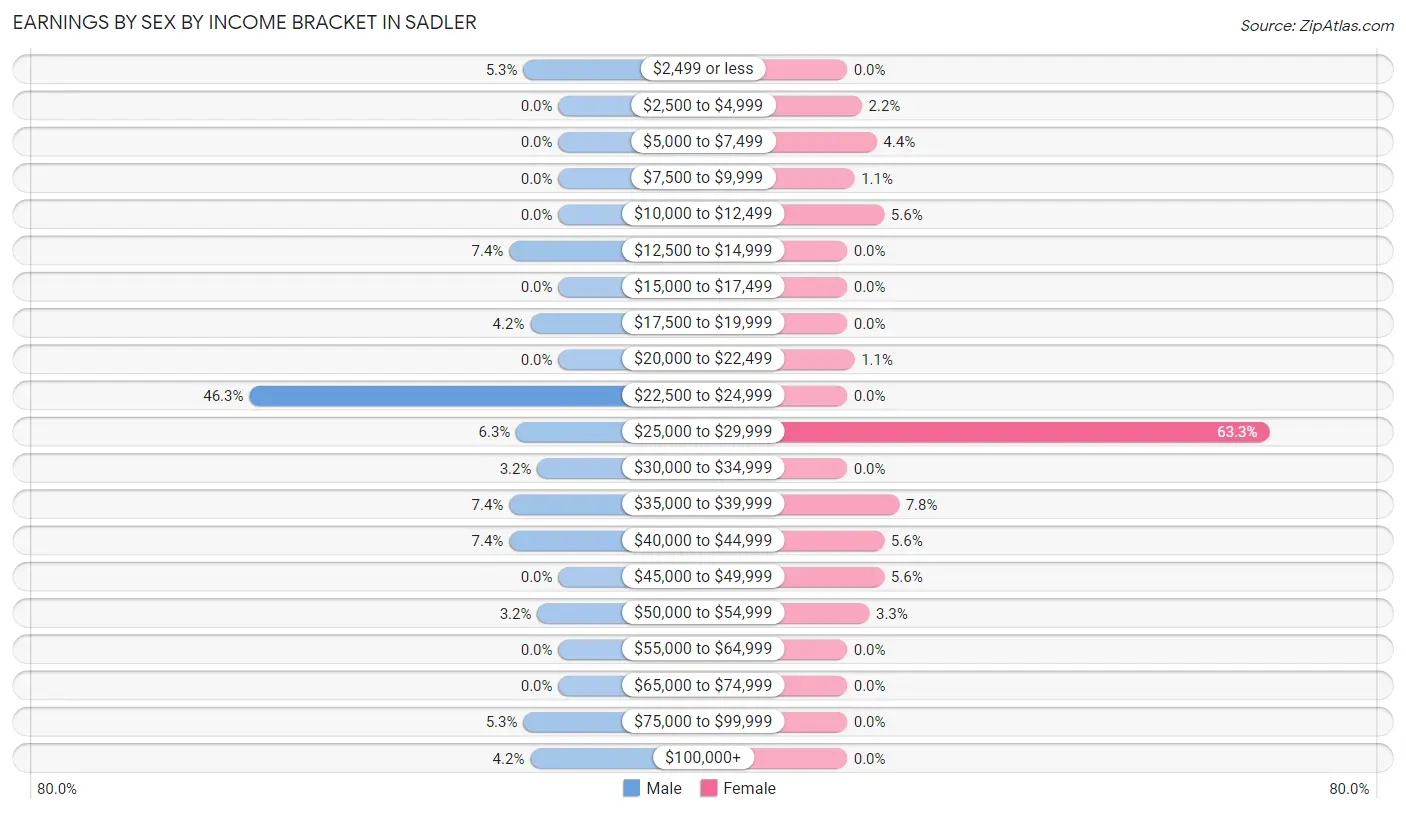
The most common earnings brackets in Sadler are $22,500 to $24,999 for men (44 | 46.3%) and $25,000 to $29,999 for women (57 | 63.3%).
| Income | Male | Female |
| $2,499 or less | 5 (5.3%) | 0 (0.0%) |
| $2,500 to $4,999 | 0 (0.0%) | 2 (2.2%) |
| $5,000 to $7,499 | 0 (0.0%) | 4 (4.4%) |
| $7,500 to $9,999 | 0 (0.0%) | 1 (1.1%) |
| $10,000 to $12,499 | 0 (0.0%) | 5 (5.6%) |
| $12,500 to $14,999 | 7 (7.4%) | 0 (0.0%) |
| $15,000 to $17,499 | 0 (0.0%) | 0 (0.0%) |
| $17,500 to $19,999 | 4 (4.2%) | 0 (0.0%) |
| $20,000 to $22,499 | 0 (0.0%) | 1 (1.1%) |
| $22,500 to $24,999 | 44 (46.3%) | 0 (0.0%) |
| $25,000 to $29,999 | 6 (6.3%) | 57 (63.3%) |
| $30,000 to $34,999 | 3 (3.2%) | 0 (0.0%) |
| $35,000 to $39,999 | 7 (7.4%) | 7 (7.8%) |
| $40,000 to $44,999 | 7 (7.4%) | 5 (5.6%) |
| $45,000 to $49,999 | 0 (0.0%) | 5 (5.6%) |
| $50,000 to $54,999 | 3 (3.2%) | 3 (3.3%) |
| $55,000 to $64,999 | 0 (0.0%) | 0 (0.0%) |
| $65,000 to $74,999 | 0 (0.0%) | 0 (0.0%) |
| $75,000 to $99,999 | 5 (5.3%) | 0 (0.0%) |
| $100,000+ | 4 (4.2%) | 0 (0.0%) |
| Total | 95 (100.0%) | 90 (100.0%) |
Earnings by Sex by Educational Attainment in Sadler
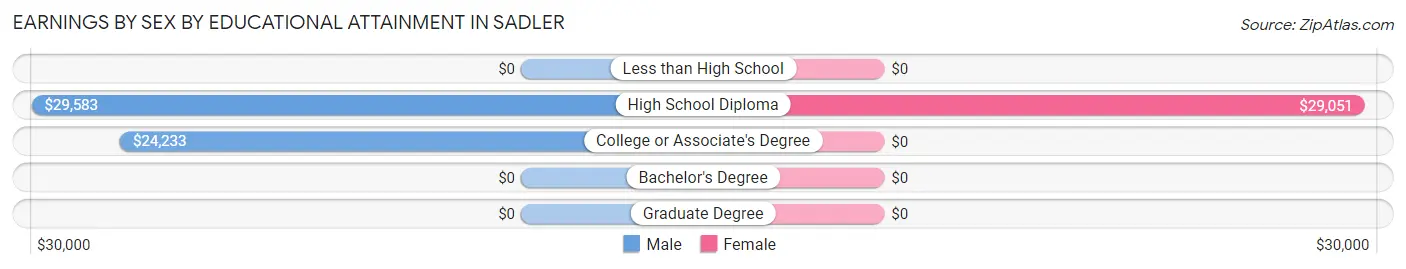
Average earnings in Sadler are $24,517 for men and $29,174 for women, a difference of 16.0%. Men with an educational attainment of high school diploma enjoy the highest average annual earnings of $29,583, while those with college or associate's degree education earn the least with $24,233. Women with an educational attainment of high school diploma earn the most with the average annual earnings of $29,051, while those with high school diploma education have the smallest earnings of $29,051.
| Educational Attainment | Male Income | Female Income |
| Less than High School | - | - |
| High School Diploma | $29,583 | $29,051 |
| College or Associate's Degree | $24,233 | $0 |
| Bachelor's Degree | - | - |
| Graduate Degree | - | - |
| Total | $24,517 | $29,174 |
Family Income in Sadler
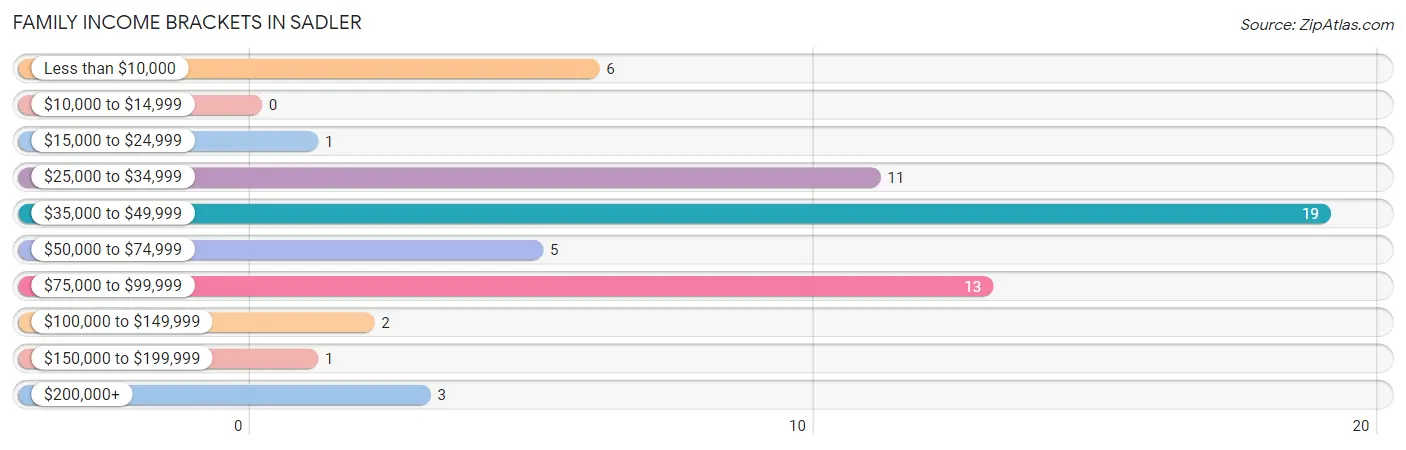
Family Income Brackets in Sadler
According to the Sadler family income data, there are 19 families falling into the $35,000 to $49,999 income range, which is the most common income bracket and makes up 31.1% of all families.
| Income Bracket | # Families | % Families |
| Less than $10,000 | 6 | 9.8% |
| $10,000 to $14,999 | 0 | 0.0% |
| $15,000 to $24,999 | 1 | 1.6% |
| $25,000 to $34,999 | 11 | 18.0% |
| $35,000 to $49,999 | 19 | 31.1% |
| $50,000 to $74,999 | 5 | 8.2% |
| $75,000 to $99,999 | 13 | 21.3% |
| $100,000 to $149,999 | 2 | 3.3% |
| $150,000 to $199,999 | 1 | 1.6% |
| $200,000+ | 3 | 4.9% |
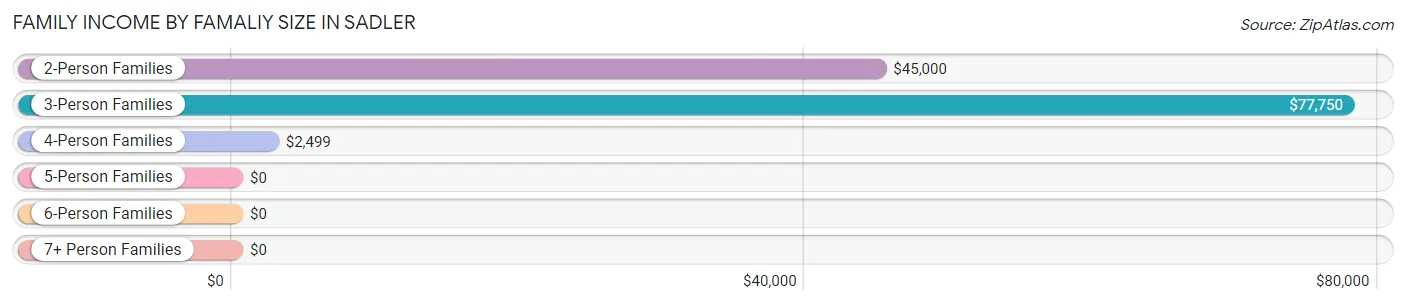
Family Income by Famaliy Size in Sadler
3-person families (13 | 21.3%) account for the highest median family income in Sadler with $77,750 per family, while 3-person families (13 | 21.3%) have the highest median income of $25,917 per family member.
| Income Bracket | # Families | Median Income |
| 2-Person Families | 38 (62.3%) | $45,000 |
| 3-Person Families | 13 (21.3%) | $77,750 |
| 4-Person Families | 4 (6.6%) | $2,499 |
| 5-Person Families | 6 (9.8%) | $0 |
| 6-Person Families | 0 (0.0%) | $0 |
| 7+ Person Families | 0 (0.0%) | $0 |
| Total | 61 (100.0%) | $48,375 |
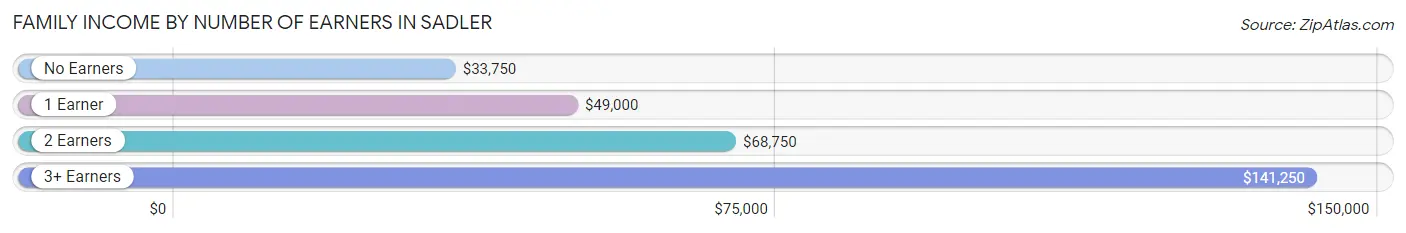
Family Income by Number of Earners in Sadler
The median family income in Sadler is $48,375, with families comprising 3+ earners (4) having the highest median family income of $141,250, while families with no earners (18) have the lowest median family income of $33,750, accounting for 6.6% and 29.5% of families, respectively.
| Number of Earners | # Families | Median Income |
| No Earners | 18 (29.5%) | $33,750 |
| 1 Earner | 26 (42.6%) | $49,000 |
| 2 Earners | 13 (21.3%) | $68,750 |
| 3+ Earners | 4 (6.6%) | $141,250 |
| Total | 61 (100.0%) | $48,375 |
Household Income in Sadler
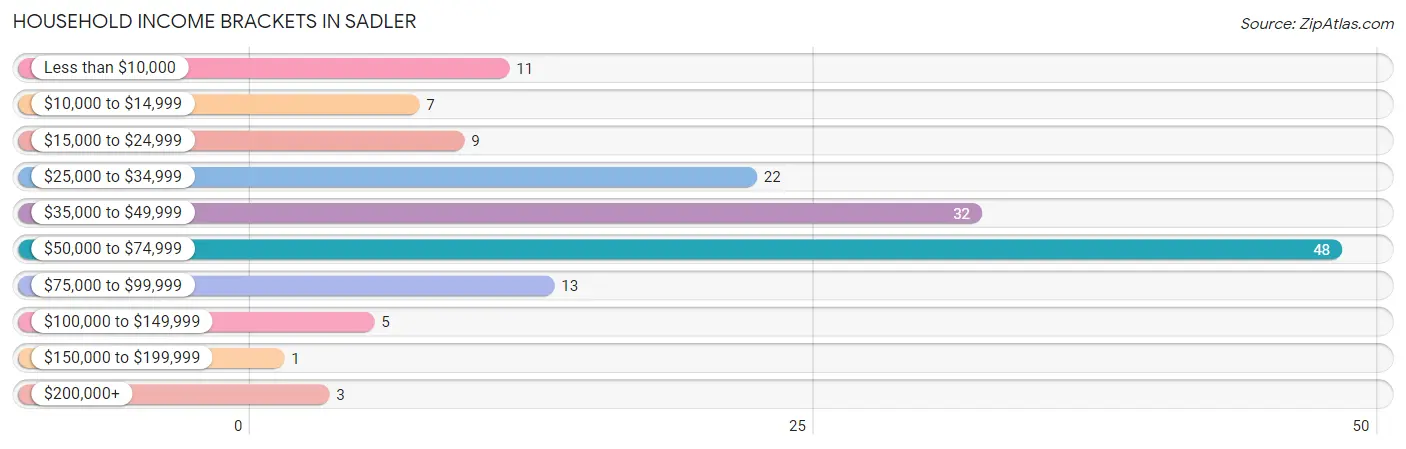
Household Income Brackets in Sadler
With 48 households falling in the category, the $50,000 to $74,999 income range is the most frequent in Sadler, accounting for 31.8% of all households. In contrast, only 1 households (0.7%) fall into the $150,000 to $199,999 income bracket, making it the least populous group.
| Income Bracket | # Households | % Households |
| Less than $10,000 | 11 | 7.3% |
| $10,000 to $14,999 | 7 | 4.6% |
| $15,000 to $24,999 | 9 | 6.0% |
| $25,000 to $34,999 | 22 | 14.6% |
| $35,000 to $49,999 | 32 | 21.2% |
| $50,000 to $74,999 | 48 | 31.8% |
| $75,000 to $99,999 | 13 | 8.6% |
| $100,000 to $149,999 | 5 | 3.3% |
| $150,000 to $199,999 | 1 | 0.7% |
| $200,000+ | 3 | 2.0% |
Household Income by Householder Age in Sadler
The median household income in Sadler is $48,625, with the highest median household income of $52,841 found in the 45 to 64 years age bracket for the primary householder. A total of 98 households (64.9%) fall into this category. Meanwhile, the 15 to 24 years age bracket for the primary householder has the lowest median household income of $0, with 3 households (2.0%) in this group.
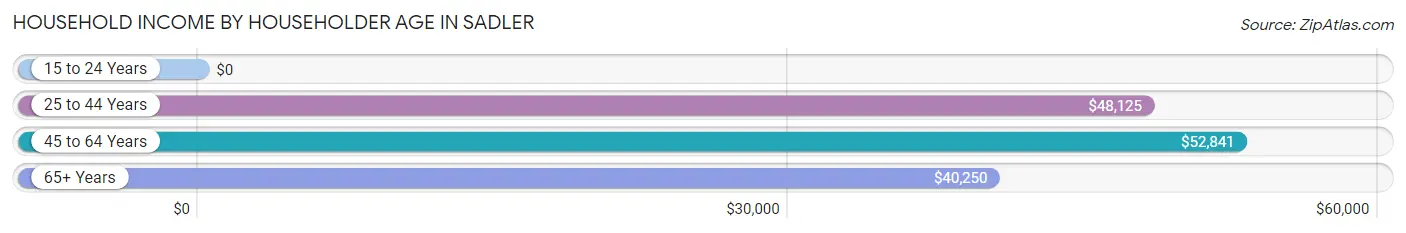
| Income Bracket | # Households | Median Income |
| 15 to 24 Years | 3 (2.0%) | $0 |
| 25 to 44 Years | 31 (20.5%) | $48,125 |
| 45 to 64 Years | 98 (64.9%) | $52,841 |
| 65+ Years | 19 (12.6%) | $40,250 |
| Total | 151 (100.0%) | $48,625 |
Poverty in Sadler
Income Below Poverty by Sex and Age in Sadler
With 14.8% poverty level for males and 11.8% for females among the residents of Sadler, under 5 year old males and 75 year old and over females are the most vulnerable to poverty, with 4 males (100.0%) and 1 females (33.3%) in their respective age groups living below the poverty level.
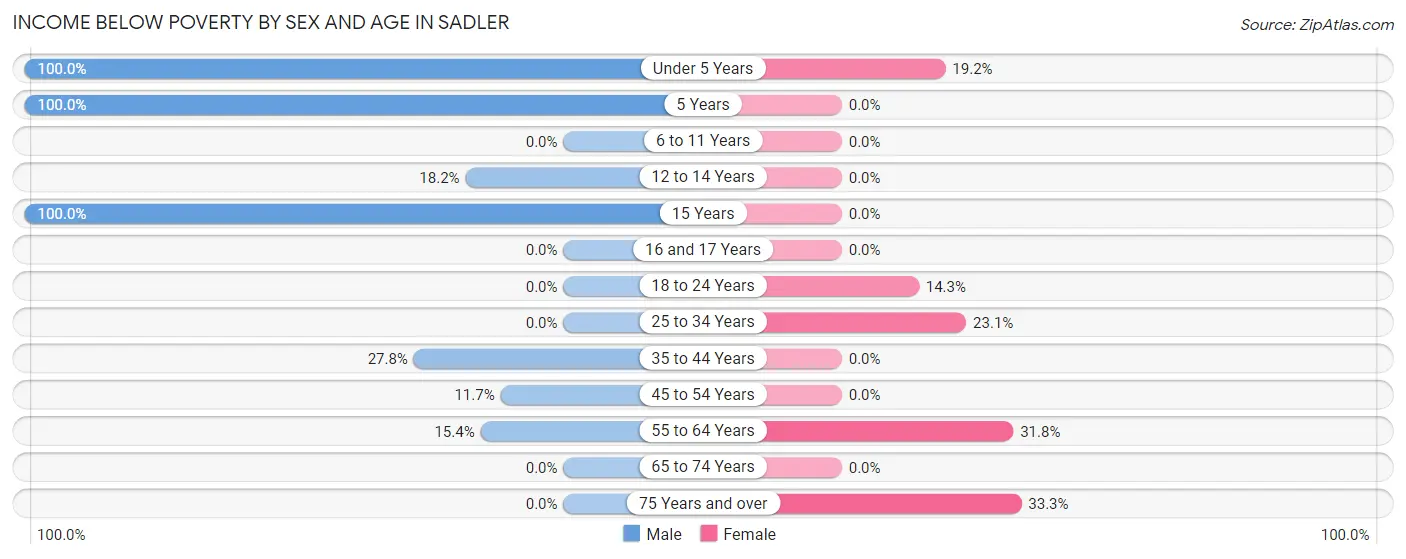
| Age Bracket | Male | Female |
| Under 5 Years | 4 (100.0%) | 5 (19.2%) |
| 5 Years | 2 (100.0%) | 0 (0.0%) |
| 6 to 11 Years | 0 (0.0%) | 0 (0.0%) |
| 12 to 14 Years | 2 (18.2%) | 0 (0.0%) |
| 15 Years | 1 (100.0%) | 0 (0.0%) |
| 16 and 17 Years | 0 (0.0%) | 0 (0.0%) |
| 18 to 24 Years | 0 (0.0%) | 3 (14.3%) |
| 25 to 34 Years | 0 (0.0%) | 3 (23.1%) |
| 35 to 44 Years | 5 (27.8%) | 0 (0.0%) |
| 45 to 54 Years | 7 (11.7%) | 0 (0.0%) |
| 55 to 64 Years | 4 (15.4%) | 7 (31.8%) |
| 65 to 74 Years | 0 (0.0%) | 0 (0.0%) |
| 75 Years and over | 0 (0.0%) | 1 (33.3%) |
| Total | 25 (14.8%) | 19 (11.8%) |
Income Above Poverty by Sex and Age in Sadler
According to the poverty statistics in Sadler, males aged 16 and 17 years and females aged 35 to 44 years are the age groups that are most secure financially, with 100.0% of males and 100.0% of females in these age groups living above the poverty line.
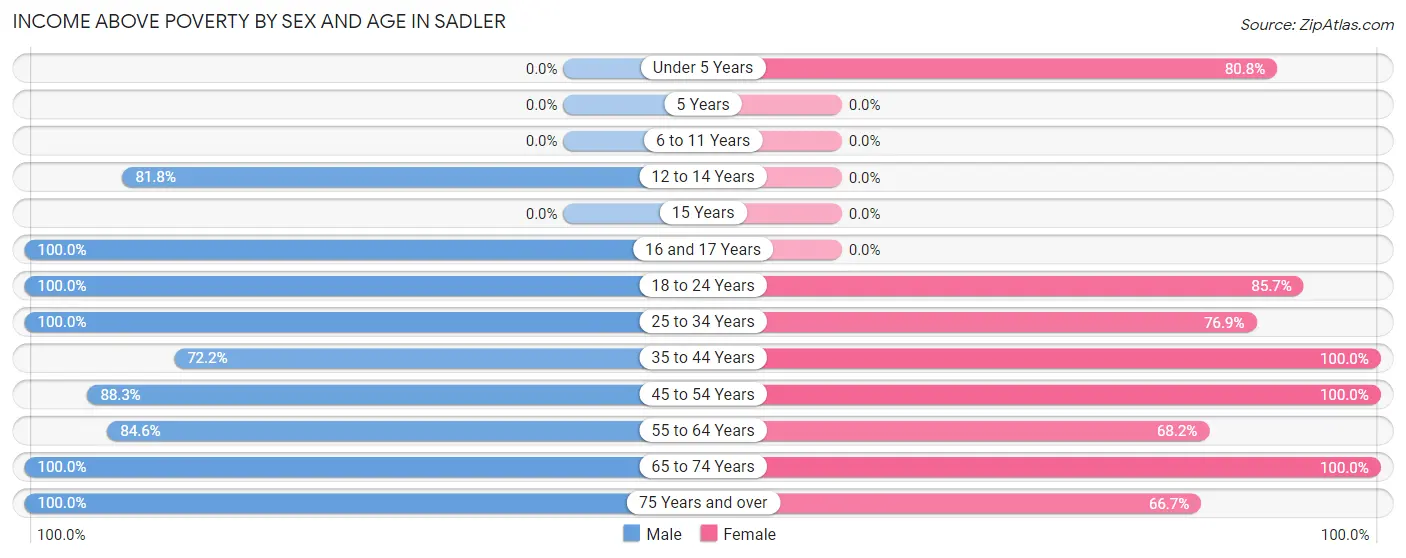
| Age Bracket | Male | Female |
| Under 5 Years | 0 (0.0%) | 21 (80.8%) |
| 5 Years | 0 (0.0%) | 0 (0.0%) |
| 6 to 11 Years | 0 (0.0%) | 0 (0.0%) |
| 12 to 14 Years | 9 (81.8%) | 0 (0.0%) |
| 15 Years | 0 (0.0%) | 0 (0.0%) |
| 16 and 17 Years | 6 (100.0%) | 0 (0.0%) |
| 18 to 24 Years | 6 (100.0%) | 18 (85.7%) |
| 25 to 34 Years | 13 (100.0%) | 10 (76.9%) |
| 35 to 44 Years | 13 (72.2%) | 57 (100.0%) |
| 45 to 54 Years | 53 (88.3%) | 14 (100.0%) |
| 55 to 64 Years | 22 (84.6%) | 15 (68.2%) |
| 65 to 74 Years | 10 (100.0%) | 5 (100.0%) |
| 75 Years and over | 12 (100.0%) | 2 (66.7%) |
| Total | 144 (85.2%) | 142 (88.2%) |
Income Below Poverty Among Married-Couple Families in Sadler
The poverty statistics for married-couple families in Sadler show that 6.2% or 2 of the total 32 families live below the poverty line. Families with no children have the highest poverty rate of 7.7%, comprising of 2 families. On the other hand, families with 1 or 2 children have the lowest poverty rate of 0.0%, which includes 0 families.
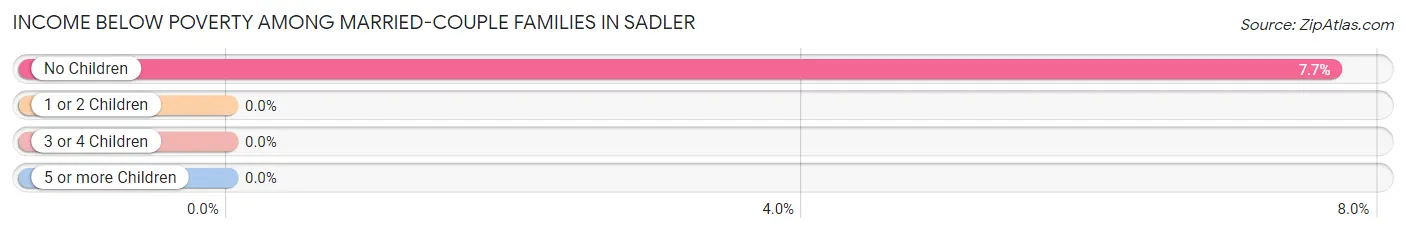
| Children | Above Poverty | Below Poverty |
| No Children | 24 (92.3%) | 2 (7.7%) |
| 1 or 2 Children | 2 (100.0%) | 0 (0.0%) |
| 3 or 4 Children | 4 (100.0%) | 0 (0.0%) |
| 5 or more Children | 0 (0.0%) | 0 (0.0%) |
| Total | 30 (93.8%) | 2 (6.2%) |
Income Below Poverty Among Single-Parent Households in Sadler
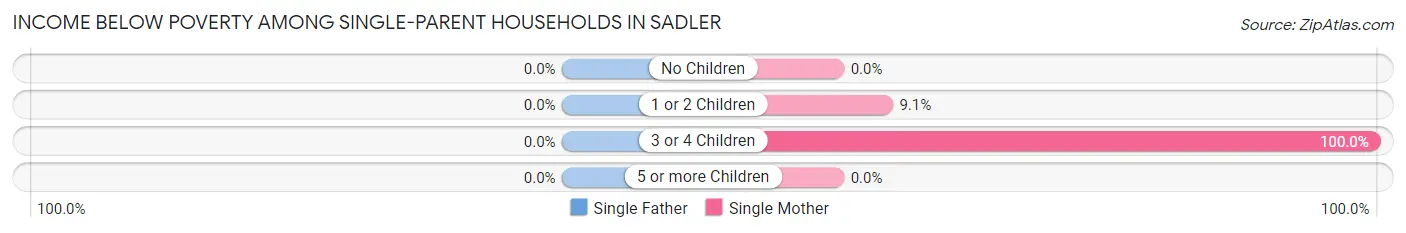
| Children | Single Father | Single Mother |
| No Children | 0 (0.0%) | 0 (0.0%) |
| 1 or 2 Children | 0 (0.0%) | 1 (9.1%) |
| 3 or 4 Children | 0 (0.0%) | 3 (100.0%) |
| 5 or more Children | 0 (0.0%) | 0 (0.0%) |
| Total | 0 (0.0%) | 4 (18.2%) |
Income Below Poverty Among Married-Couple vs Single-Parent Households in Sadler
The poverty data for Sadler shows that 2 of the married-couple family households (6.2%) and 4 of the single-parent households (13.8%) are living below the poverty level. Within the married-couple family households, those with no children have the highest poverty rate, with 2 households (7.7%) falling below the poverty line. Among the single-parent households, those with 3 or 4 children have the highest poverty rate, with 3 household (100.0%) living below poverty.
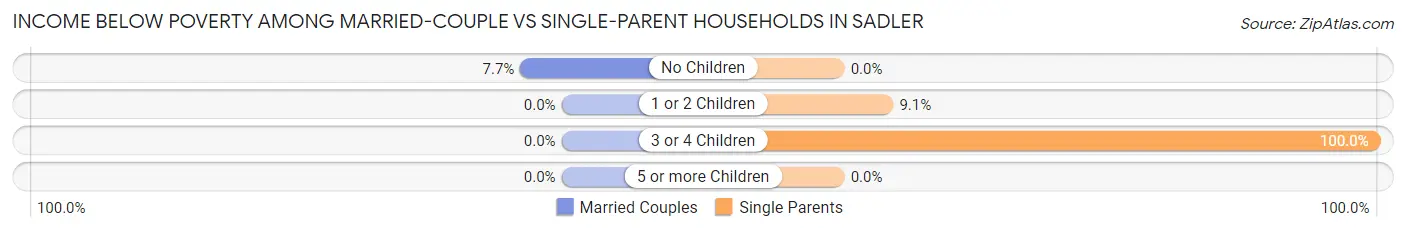
| Children | Married-Couple Families | Single-Parent Households |
| No Children | 2 (7.7%) | 0 (0.0%) |
| 1 or 2 Children | 0 (0.0%) | 1 (9.1%) |
| 3 or 4 Children | 0 (0.0%) | 3 (100.0%) |
| 5 or more Children | 0 (0.0%) | 0 (0.0%) |
| Total | 2 (6.2%) | 4 (13.8%) |
Race in Sadler
The most populous races in Sadler are White / Caucasian (296 | 89.7%), Two or more Races (34 | 10.3%), and Hispanic or Latino (9 | 2.7%).
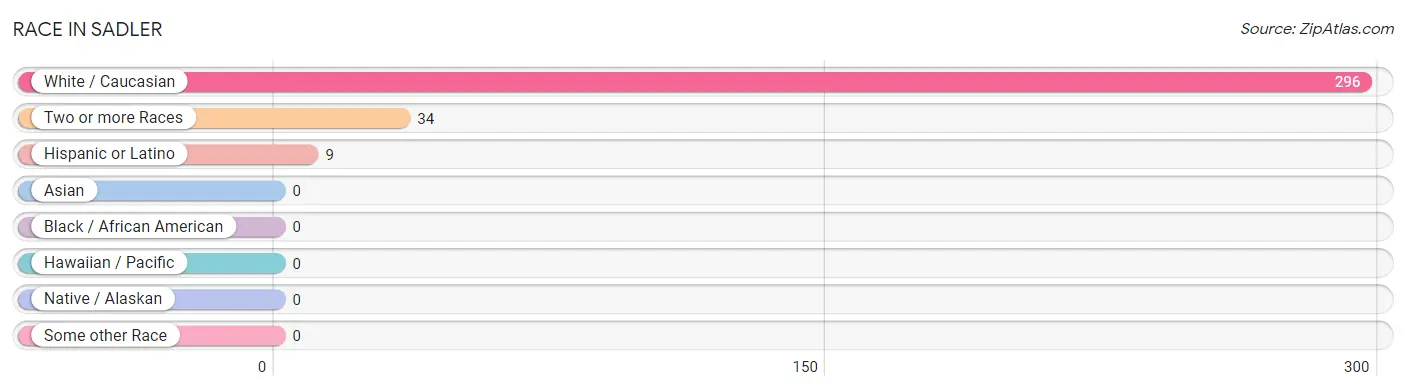
| Race | # Population | % Population |
| Asian | 0 | 0.0% |
| Black / African American | 0 | 0.0% |
| Hawaiian / Pacific | 0 | 0.0% |
| Hispanic or Latino | 9 | 2.7% |
| Native / Alaskan | 0 | 0.0% |
| White / Caucasian | 296 | 89.7% |
| Two or more Races | 34 | 10.3% |
| Some other Race | 0 | 0.0% |
| Total | 330 | 100.0% |
Ancestry in Sadler
The most populous ancestries reported in Sadler are German (40 | 12.1%), Irish (22 | 6.7%), American (14 | 4.2%), French (13 | 3.9%), and English (9 | 2.7%), together accounting for 29.7% of all Sadler residents.
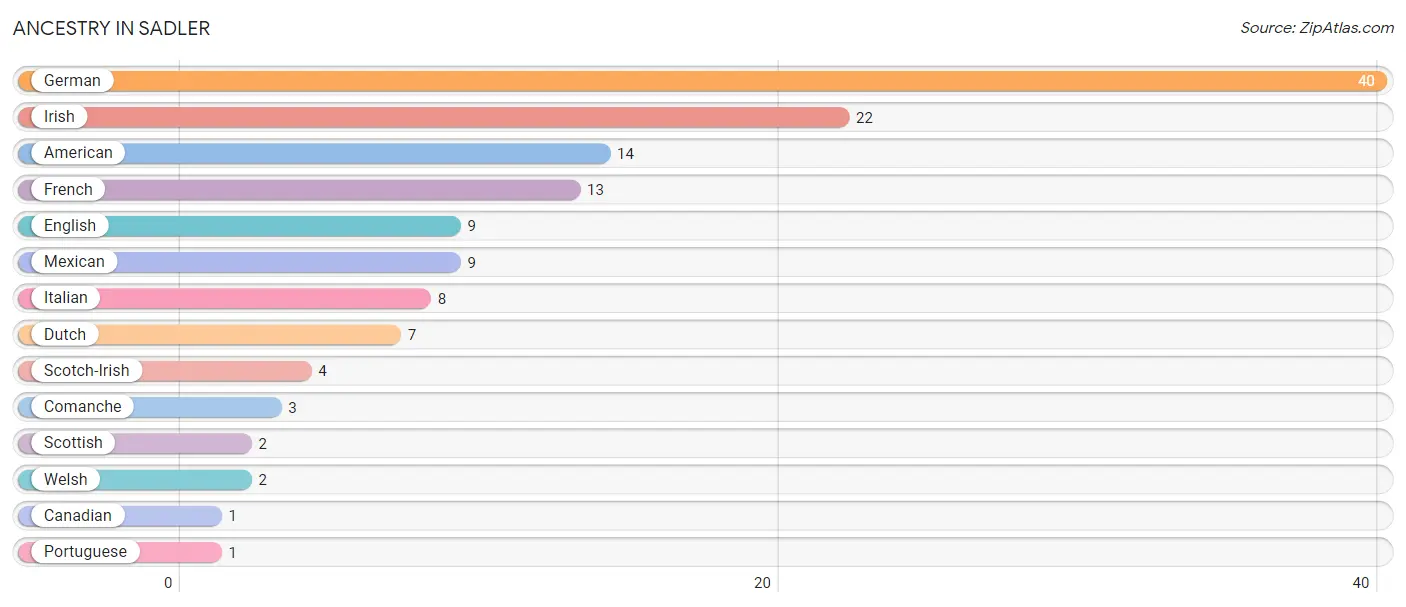
| Ancestry | # Population | % Population |
| American | 14 | 4.2% |
| Canadian | 1 | 0.3% |
| Comanche | 3 | 0.9% |
| Dutch | 7 | 2.1% |
| English | 9 | 2.7% |
| French | 13 | 3.9% |
| German | 40 | 12.1% |
| Irish | 22 | 6.7% |
| Italian | 8 | 2.4% |
| Mexican | 9 | 2.7% |
| Portuguese | 1 | 0.3% |
| Scotch-Irish | 4 | 1.2% |
| Scottish | 2 | 0.6% |
| Welsh | 2 | 0.6% | View All 14 Rows |
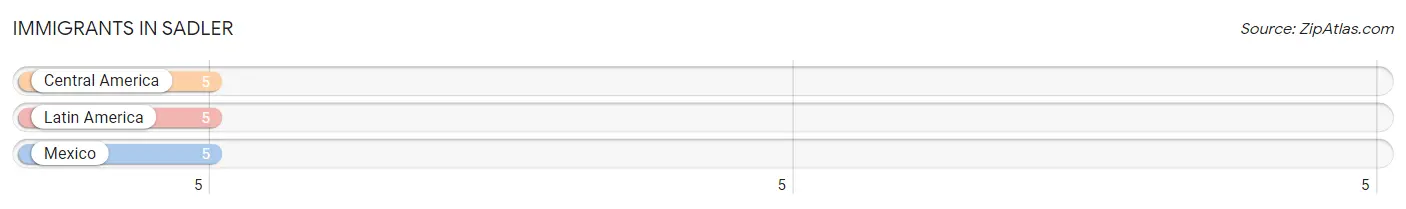
Immigrants in Sadler
The most numerous immigrant groups reported in Sadler came from Central America (5 | 1.5%), Latin America (5 | 1.5%), and Mexico (5 | 1.5%), together accounting for 4.6% of all Sadler residents.
| Immigration Origin | # Population | % Population |
| Central America | 5 | 1.5% |
| Latin America | 5 | 1.5% |
| Mexico | 5 | 1.5% | View All 3 Rows |
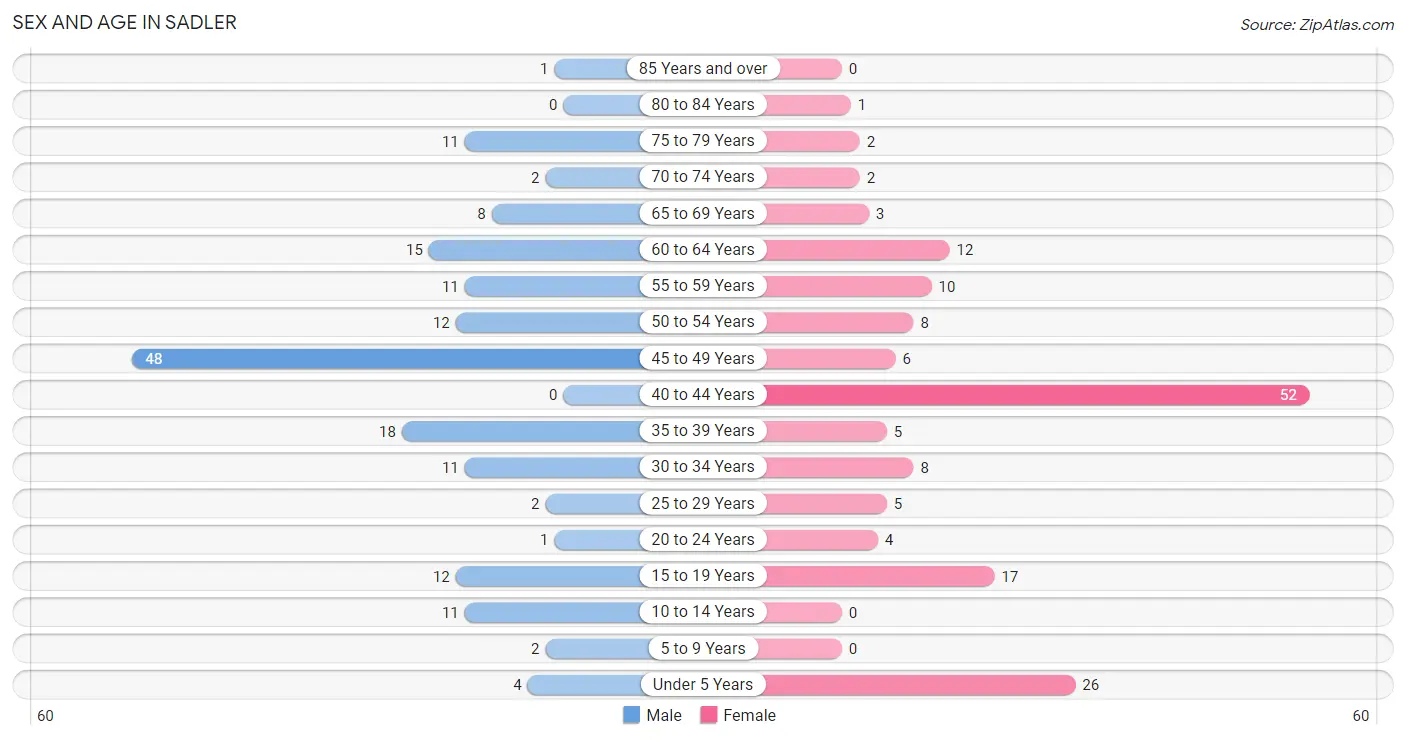
Sex and Age in Sadler
Sex and Age in Sadler
The most populous age groups in Sadler are 45 to 49 Years (48 | 28.4%) for men and 40 to 44 Years (52 | 32.3%) for women.
| Age Bracket | Male | Female |
| Under 5 Years | 4 (2.4%) | 26 (16.2%) |
| 5 to 9 Years | 2 (1.2%) | 0 (0.0%) |
| 10 to 14 Years | 11 (6.5%) | 0 (0.0%) |
| 15 to 19 Years | 12 (7.1%) | 17 (10.6%) |
| 20 to 24 Years | 1 (0.6%) | 4 (2.5%) |
| 25 to 29 Years | 2 (1.2%) | 5 (3.1%) |
| 30 to 34 Years | 11 (6.5%) | 8 (5.0%) |
| 35 to 39 Years | 18 (10.6%) | 5 (3.1%) |
| 40 to 44 Years | 0 (0.0%) | 52 (32.3%) |
| 45 to 49 Years | 48 (28.4%) | 6 (3.7%) |
| 50 to 54 Years | 12 (7.1%) | 8 (5.0%) |
| 55 to 59 Years | 11 (6.5%) | 10 (6.2%) |
| 60 to 64 Years | 15 (8.9%) | 12 (7.4%) |
| 65 to 69 Years | 8 (4.7%) | 3 (1.9%) |
| 70 to 74 Years | 2 (1.2%) | 2 (1.2%) |
| 75 to 79 Years | 11 (6.5%) | 2 (1.2%) |
| 80 to 84 Years | 0 (0.0%) | 1 (0.6%) |
| 85 Years and over | 1 (0.6%) | 0 (0.0%) |
| Total | 169 (100.0%) | 161 (100.0%) |
Families and Households in Sadler
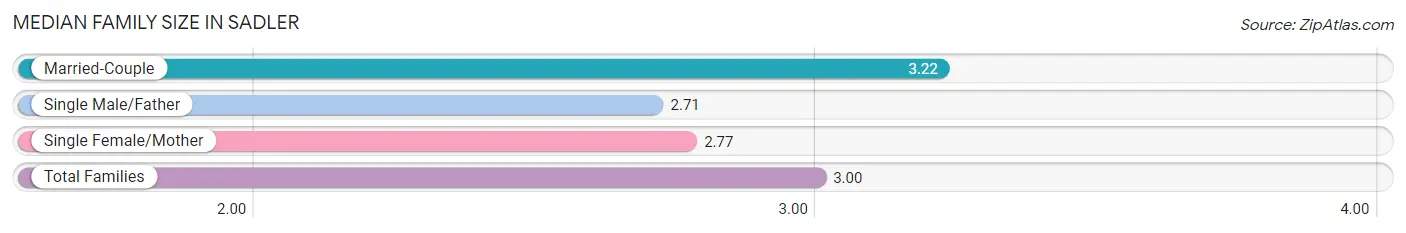
Median Family Size in Sadler
The median family size in Sadler is 3.00 persons per family, with married-couple families (32 | 52.5%) accounting for the largest median family size of 3.22 persons per family. On the other hand, single male/father families (7 | 11.5%) represent the smallest median family size with 2.71 persons per family.
| Family Type | # Families | Family Size |
| Married-Couple | 32 (52.5%) | 3.22 |
| Single Male/Father | 7 (11.5%) | 2.71 |
| Single Female/Mother | 22 (36.1%) | 2.77 |
| Total Families | 61 (100.0%) | 3.00 |
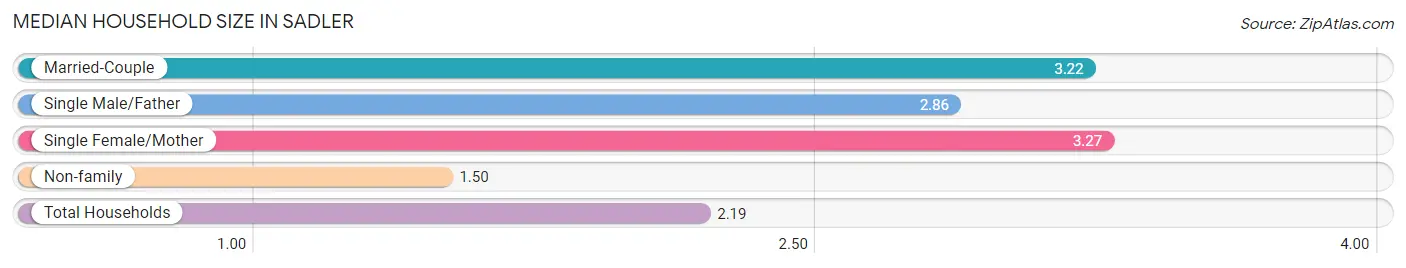
Median Household Size in Sadler
The median household size in Sadler is 2.19 persons per household, with single female/mother households (22 | 14.6%) accounting for the largest median household size of 3.27 persons per household. non-family households (90 | 59.6%) represent the smallest median household size with 1.50 persons per household.
| Household Type | # Households | Household Size |
| Married-Couple | 32 (21.2%) | 3.22 |
| Single Male/Father | 7 (4.6%) | 2.86 |
| Single Female/Mother | 22 (14.6%) | 3.27 |
| Non-family | 90 (59.6%) | 1.50 |
| Total Households | 151 (100.0%) | 2.19 |
Household Size by Marriage Status in Sadler
Out of a total of 151 households in Sadler, 61 (40.4%) are family households, while 90 (59.6%) are nonfamily households. The most numerous type of family households are 2-person households, comprising 34, and the most common type of nonfamily households are 2-person households, comprising 46.
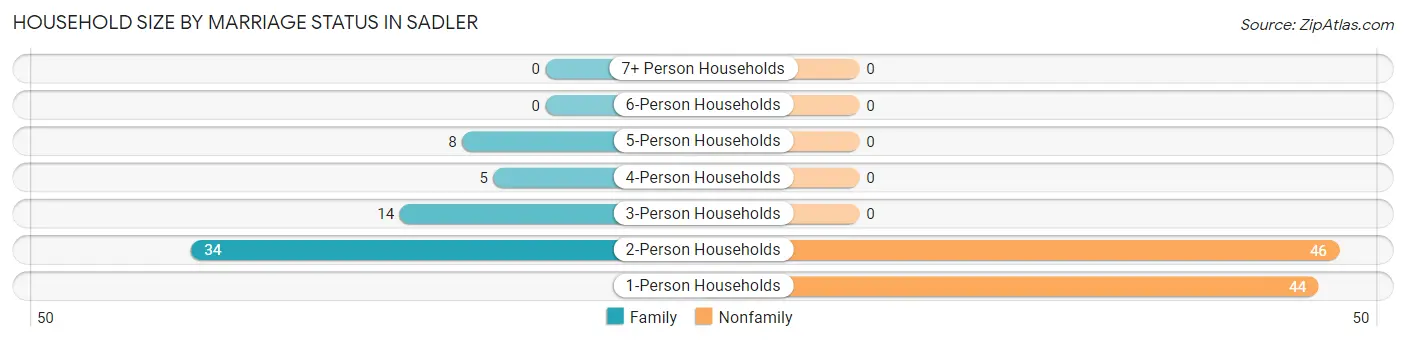
| Household Size | Family Households | Nonfamily Households |
| 1-Person Households | - | 44 (29.1%) |
| 2-Person Households | 34 (22.5%) | 46 (30.5%) |
| 3-Person Households | 14 (9.3%) | 0 (0.0%) |
| 4-Person Households | 5 (3.3%) | 0 (0.0%) |
| 5-Person Households | 8 (5.3%) | 0 (0.0%) |
| 6-Person Households | 0 (0.0%) | 0 (0.0%) |
| 7+ Person Households | 0 (0.0%) | 0 (0.0%) |
| Total | 61 (40.4%) | 90 (59.6%) |
Female Fertility in Sadler
Fertility by Age in Sadler
Average fertility rate in Sadler is 31.0 births per 1,000 women. Women in the age bracket of 20 to 34 years have the highest fertility rate with 176.0 births per 1,000 women. Women in the age bracket of 20 to 34 years acount for 100.0% of all women with births.
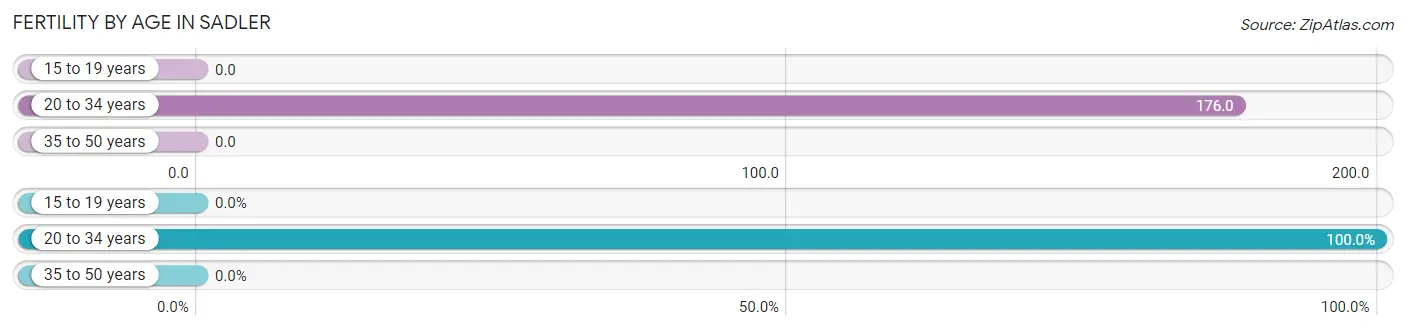
| Age Bracket | Women with Births | Births / 1,000 Women |
| 15 to 19 years | 0 (0.0%) | 0.0 |
| 20 to 34 years | 3 (100.0%) | 176.0 |
| 35 to 50 years | 0 (0.0%) | 0.0 |
| Total | 3 (100.0%) | 31.0 |
Fertility by Age by Marriage Status in Sadler
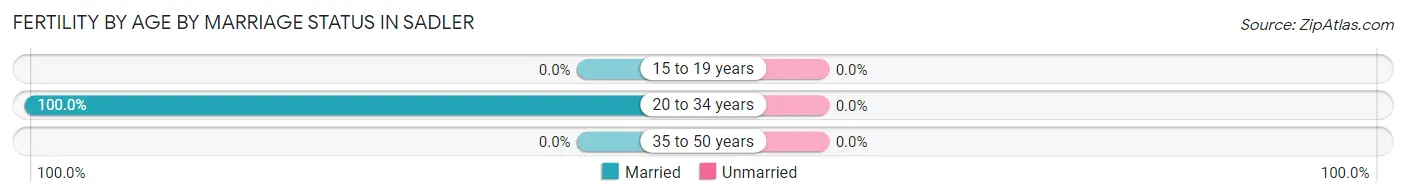
| Age Bracket | Married | Unmarried |
| 15 to 19 years | 0 (0.0%) | 0 (0.0%) |
| 20 to 34 years | 3 (100.0%) | 0 (0.0%) |
| 35 to 50 years | 0 (0.0%) | 0 (0.0%) |
| Total | 3 (100.0%) | 0 (0.0%) |
Fertility by Education in Sadler
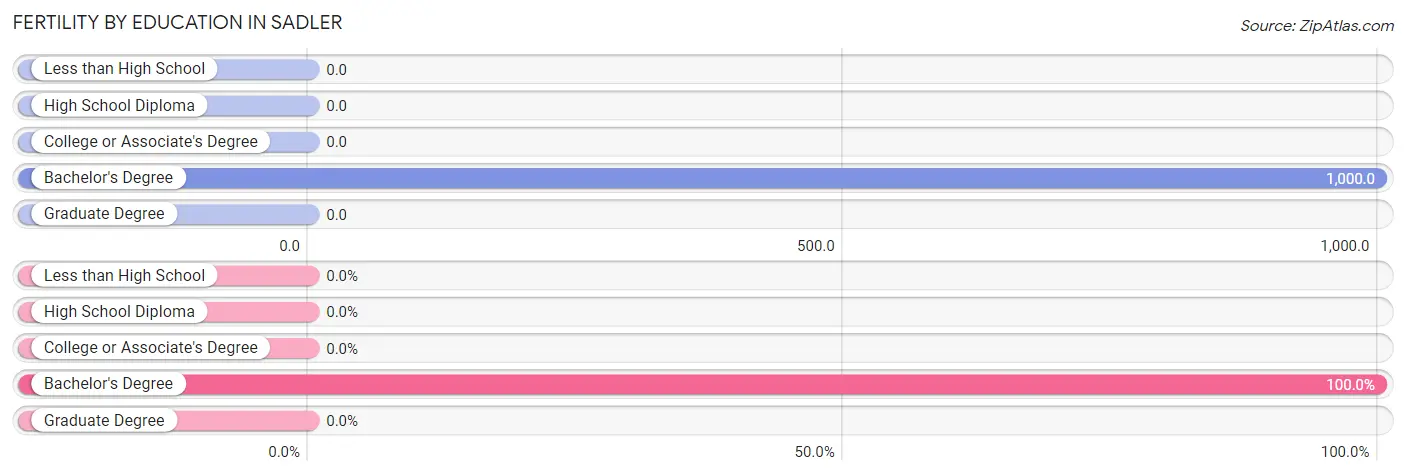
| Educational Attainment | Women with Births | Births / 1,000 Women |
| Less than High School | 0 (0.0%) | 0.0 |
| High School Diploma | 0 (0.0%) | 0.0 |
| College or Associate's Degree | 0 (0.0%) | 0.0 |
| Bachelor's Degree | 3 (100.0%) | 1,000.0 |
| Graduate Degree | 0 (0.0%) | 0.0 |
| Total | 3 (100.0%) | 31.0 |
Fertility by Education by Marriage Status in Sadler
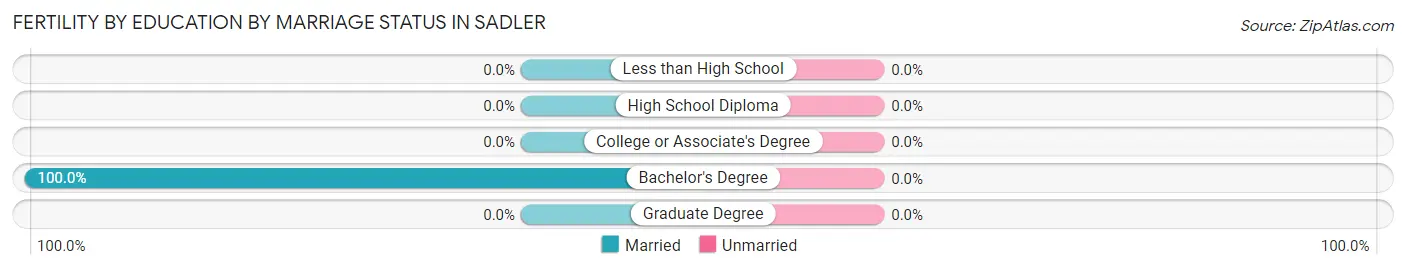
| Educational Attainment | Married | Unmarried |
| Less than High School | 0 (0.0%) | 0 (0.0%) |
| High School Diploma | 0 (0.0%) | 0 (0.0%) |
| College or Associate's Degree | 0 (0.0%) | 0 (0.0%) |
| Bachelor's Degree | 3 (100.0%) | 0 (0.0%) |
| Graduate Degree | 0 (0.0%) | 0 (0.0%) |
| Total | 3 (100.0%) | 0 (0.0%) |
Employment Characteristics in Sadler
Employment by Class of Employer in Sadler
Among the 176 employed individuals in Sadler, private company employees (122 | 69.3%), self-employed (not incorporated) (44 | 25.0%), and local government employees (6 | 3.4%) make up the most common classes of employment.
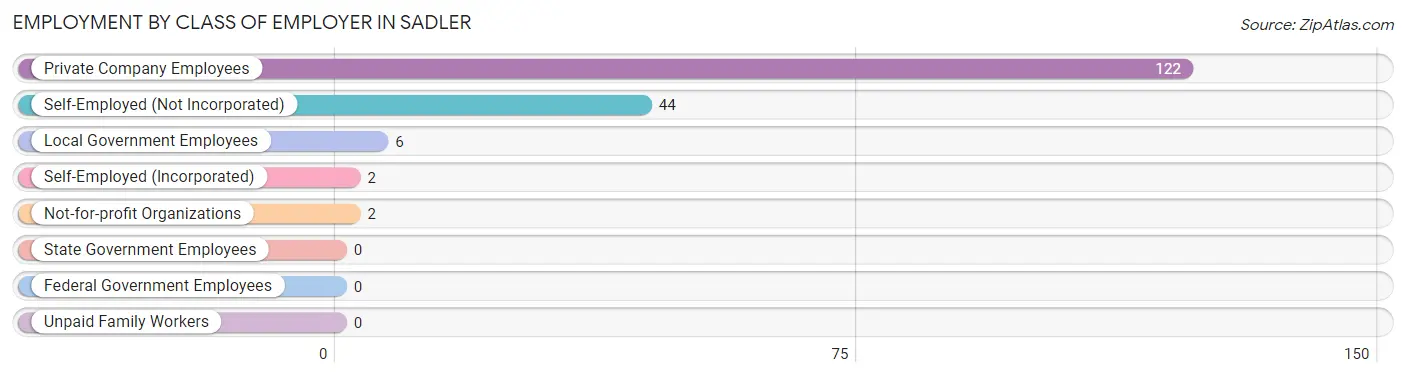
| Employer Class | # Employees | % Employees |
| Private Company Employees | 122 | 69.3% |
| Self-Employed (Incorporated) | 2 | 1.1% |
| Self-Employed (Not Incorporated) | 44 | 25.0% |
| Not-for-profit Organizations | 2 | 1.1% |
| Local Government Employees | 6 | 3.4% |
| State Government Employees | 0 | 0.0% |
| Federal Government Employees | 0 | 0.0% |
| Unpaid Family Workers | 0 | 0.0% |
| Total | 176 | 100.0% |
Employment Status by Age in Sadler
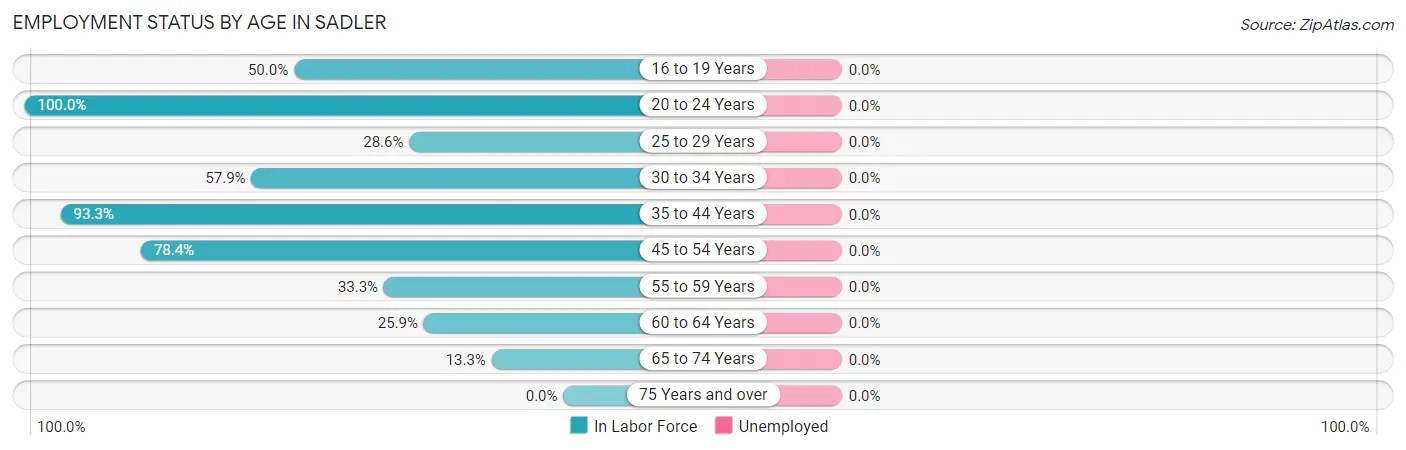
| Age Bracket | In Labor Force | Unemployed |
| 16 to 19 Years | 14 (50.0%) | 0 (0.0%) |
| 20 to 24 Years | 5 (100.0%) | 0 (0.0%) |
| 25 to 29 Years | 2 (28.6%) | 0 (0.0%) |
| 30 to 34 Years | 11 (57.9%) | 0 (0.0%) |
| 35 to 44 Years | 70 (93.3%) | 0 (0.0%) |
| 45 to 54 Years | 58 (78.4%) | 0 (0.0%) |
| 55 to 59 Years | 7 (33.3%) | 0 (0.0%) |
| 60 to 64 Years | 7 (25.9%) | 0 (0.0%) |
| 65 to 74 Years | 2 (13.3%) | 0 (0.0%) |
| 75 Years and over | 0 (0.0%) | 0 (0.0%) |
| Total | 176 (61.5%) | 0 (0.0%) |
Employment Status by Educational Attainment in Sadler
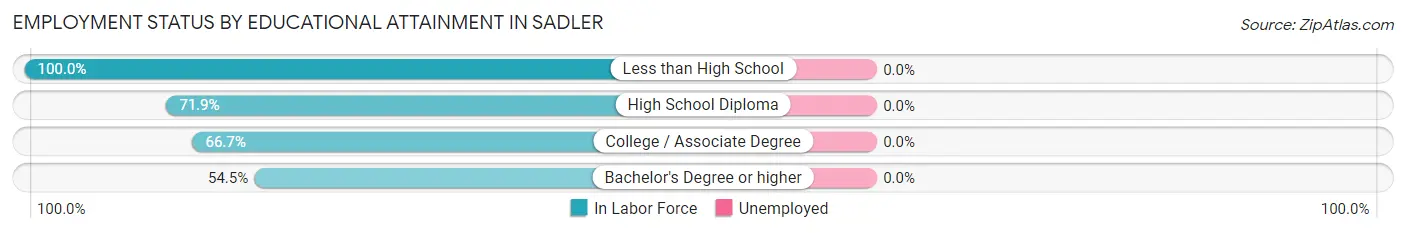
| Educational Attainment | In Labor Force | Unemployed |
| Less than High School | 5 (100.0%) | 0 (0.0%) |
| High School Diploma | 82 (71.9%) | 0 (0.0%) |
| College / Associate Degree | 62 (66.7%) | 0 (0.0%) |
| Bachelor's Degree or higher | 6 (54.5%) | 0 (0.0%) |
| Total | 155 (69.5%) | 0 (0.0%) |
Employment Occupations by Sex in Sadler
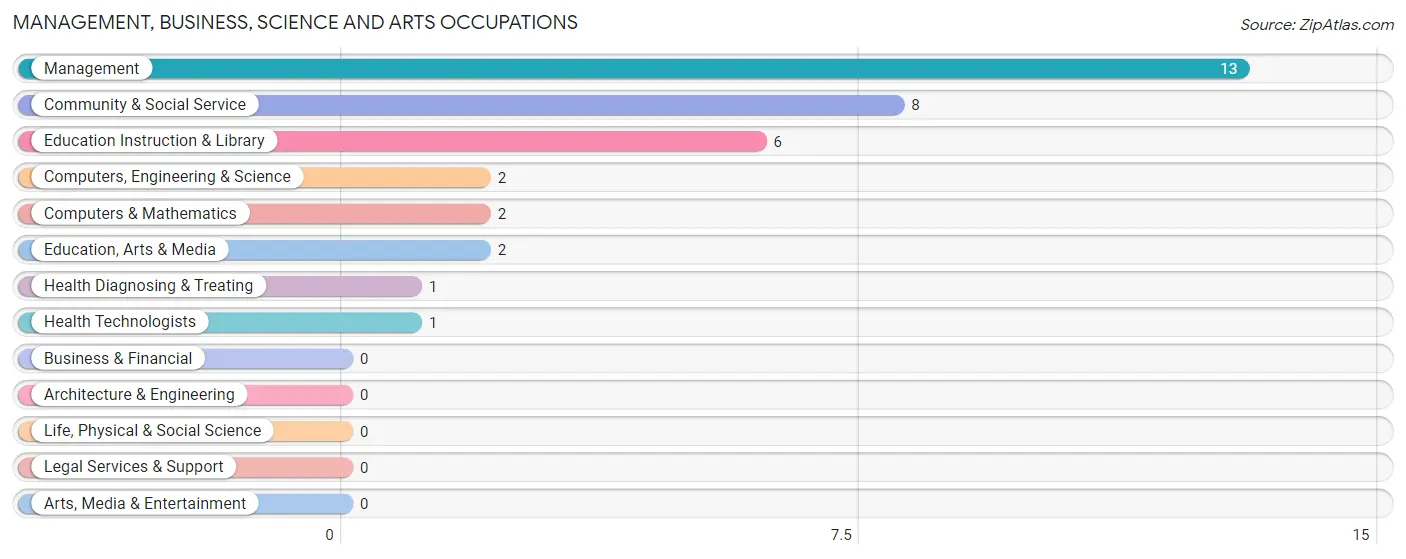
Management, Business, Science and Arts Occupations
The most common Management, Business, Science and Arts occupations in Sadler are Management (13 | 7.4%), Community & Social Service (8 | 4.5%), Education Instruction & Library (6 | 3.4%), Computers, Engineering & Science (2 | 1.1%), and Computers & Mathematics (2 | 1.1%).
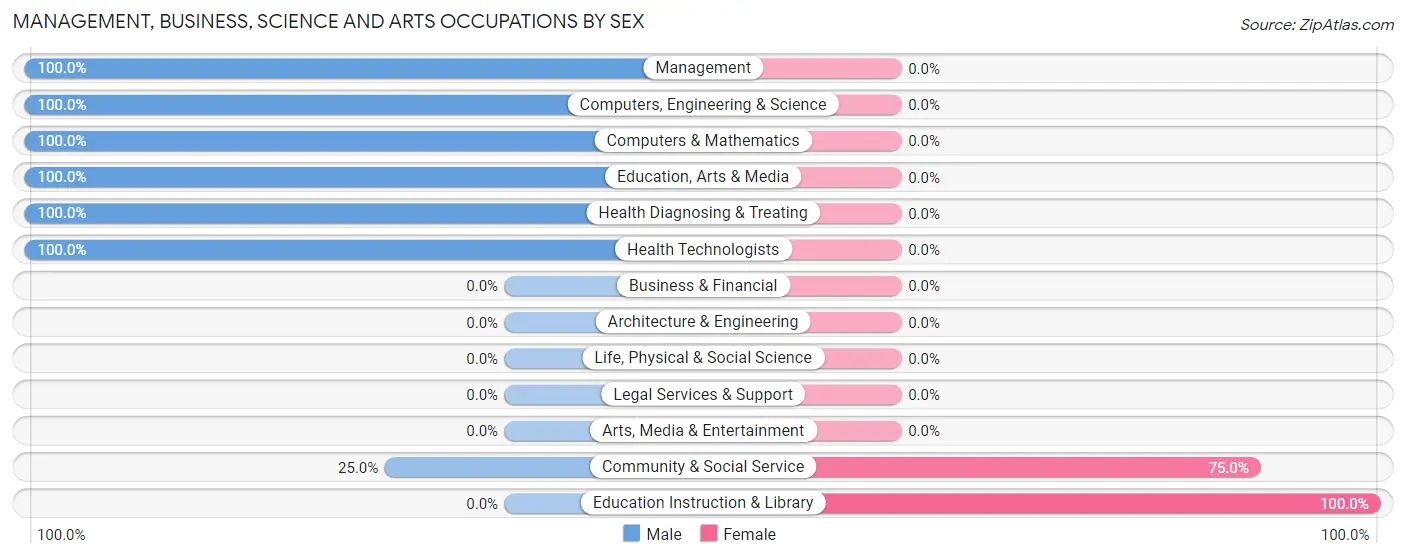
Management, Business, Science and Arts Occupations by Sex
Within the Management, Business, Science and Arts occupations in Sadler, the most male-oriented occupations are Management (100.0%), Computers, Engineering & Science (100.0%), and Computers & Mathematics (100.0%), while the most female-oriented occupations are Education Instruction & Library (100.0%), and Community & Social Service (75.0%).
| Occupation | Male | Female |
| Management | 13 (100.0%) | 0 (0.0%) |
| Business & Financial | 0 (0.0%) | 0 (0.0%) |
| Computers, Engineering & Science | 2 (100.0%) | 0 (0.0%) |
| Computers & Mathematics | 2 (100.0%) | 0 (0.0%) |
| Architecture & Engineering | 0 (0.0%) | 0 (0.0%) |
| Life, Physical & Social Science | 0 (0.0%) | 0 (0.0%) |
| Community & Social Service | 2 (25.0%) | 6 (75.0%) |
| Education, Arts & Media | 2 (100.0%) | 0 (0.0%) |
| Legal Services & Support | 0 (0.0%) | 0 (0.0%) |
| Education Instruction & Library | 0 (0.0%) | 6 (100.0%) |
| Arts, Media & Entertainment | 0 (0.0%) | 0 (0.0%) |
| Health Diagnosing & Treating | 1 (100.0%) | 0 (0.0%) |
| Health Technologists | 1 (100.0%) | 0 (0.0%) |
| Total (Category) | 18 (75.0%) | 6 (25.0%) |
| Total (Overall) | 86 (48.9%) | 90 (51.1%) |
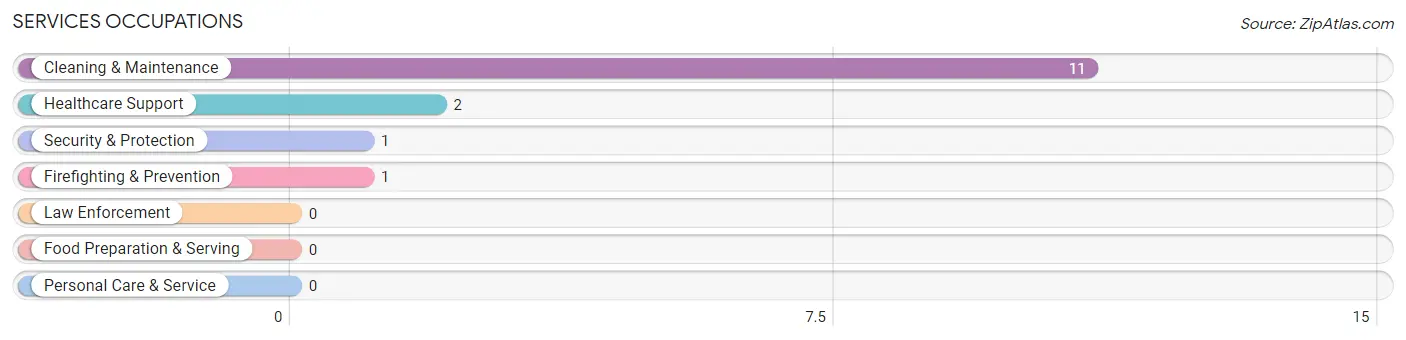
Services Occupations
The most common Services occupations in Sadler are Cleaning & Maintenance (11 | 6.2%), Healthcare Support (2 | 1.1%), Security & Protection (1 | 0.6%), and Firefighting & Prevention (1 | 0.6%).
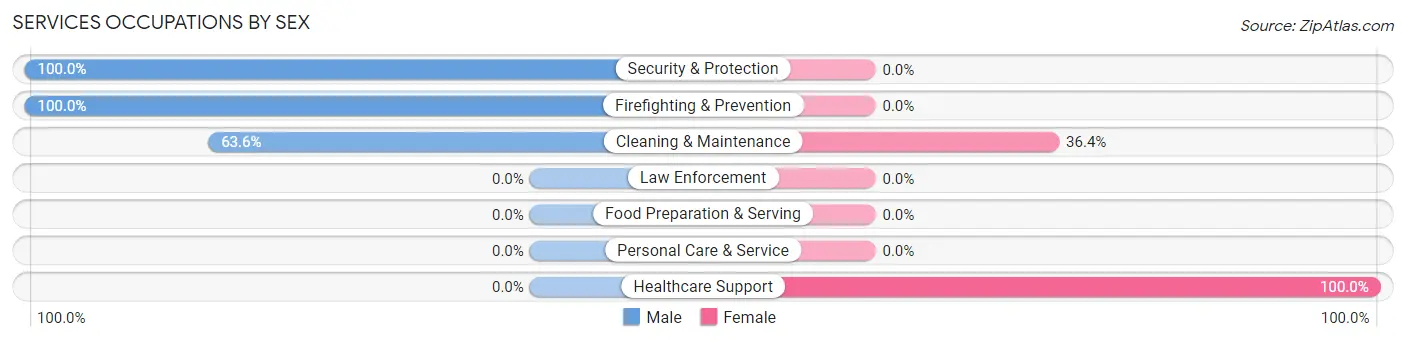
Services Occupations by Sex
Within the Services occupations in Sadler, the most male-oriented occupations are Security & Protection (100.0%), Firefighting & Prevention (100.0%), and Cleaning & Maintenance (63.6%), while the most female-oriented occupations are Healthcare Support (100.0%), and Cleaning & Maintenance (36.4%).
| Occupation | Male | Female |
| Healthcare Support | 0 (0.0%) | 2 (100.0%) |
| Security & Protection | 1 (100.0%) | 0 (0.0%) |
| Firefighting & Prevention | 1 (100.0%) | 0 (0.0%) |
| Law Enforcement | 0 (0.0%) | 0 (0.0%) |
| Food Preparation & Serving | 0 (0.0%) | 0 (0.0%) |
| Cleaning & Maintenance | 7 (63.6%) | 4 (36.4%) |
| Personal Care & Service | 0 (0.0%) | 0 (0.0%) |
| Total (Category) | 8 (57.1%) | 6 (42.9%) |
| Total (Overall) | 86 (48.9%) | 90 (51.1%) |
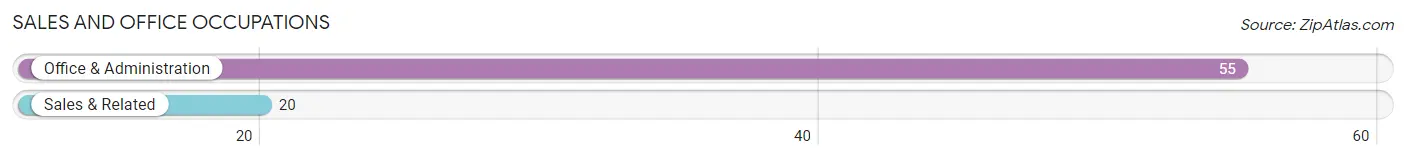
Sales and Office Occupations
The most common Sales and Office occupations in Sadler are Office & Administration (55 | 31.2%), and Sales & Related (20 | 11.4%).
Sales and Office Occupations by Sex
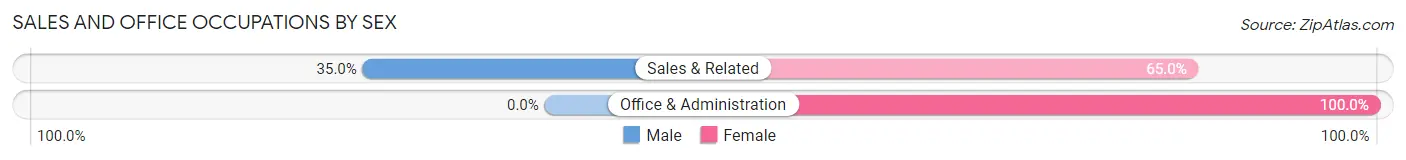
| Occupation | Male | Female |
| Sales & Related | 7 (35.0%) | 13 (65.0%) |
| Office & Administration | 0 (0.0%) | 55 (100.0%) |
| Total (Category) | 7 (9.3%) | 68 (90.7%) |
| Total (Overall) | 86 (48.9%) | 90 (51.1%) |
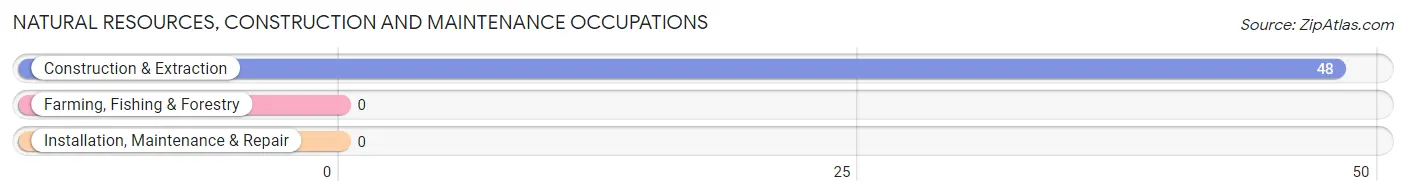
Natural Resources, Construction and Maintenance Occupations
The most common Natural Resources, Construction and Maintenance occupations in Sadler are , and Construction & Extraction (48 | 27.3%).
Natural Resources, Construction and Maintenance Occupations by Sex
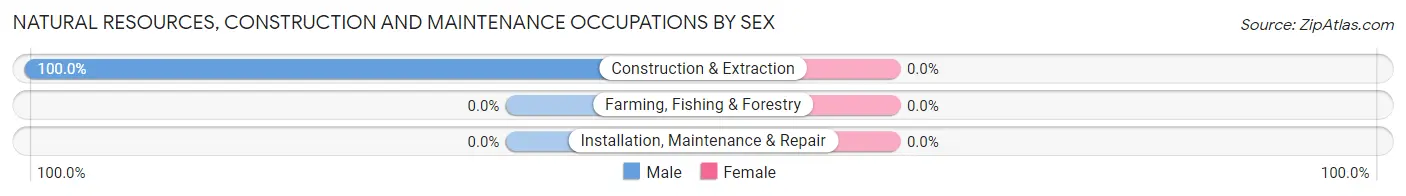
| Occupation | Male | Female |
| Farming, Fishing & Forestry | 0 (0.0%) | 0 (0.0%) |
| Construction & Extraction | 48 (100.0%) | 0 (0.0%) |
| Installation, Maintenance & Repair | 0 (0.0%) | 0 (0.0%) |
| Total (Category) | 48 (100.0%) | 0 (0.0%) |
| Total (Overall) | 86 (48.9%) | 90 (51.1%) |
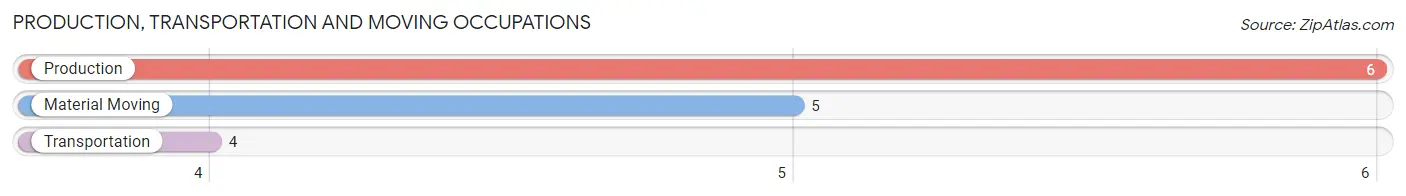
Production, Transportation and Moving Occupations
The most common Production, Transportation and Moving occupations in Sadler are Production (6 | 3.4%), Material Moving (5 | 2.8%), and Transportation (4 | 2.3%).
Production, Transportation and Moving Occupations by Sex
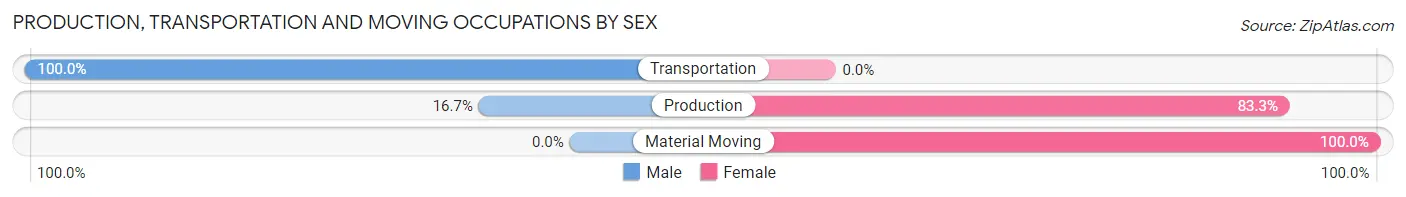
| Occupation | Male | Female |
| Production | 1 (16.7%) | 5 (83.3%) |
| Transportation | 4 (100.0%) | 0 (0.0%) |
| Material Moving | 0 (0.0%) | 5 (100.0%) |
| Total (Category) | 5 (33.3%) | 10 (66.7%) |
| Total (Overall) | 86 (48.9%) | 90 (51.1%) |
Employment Industries by Sex in Sadler
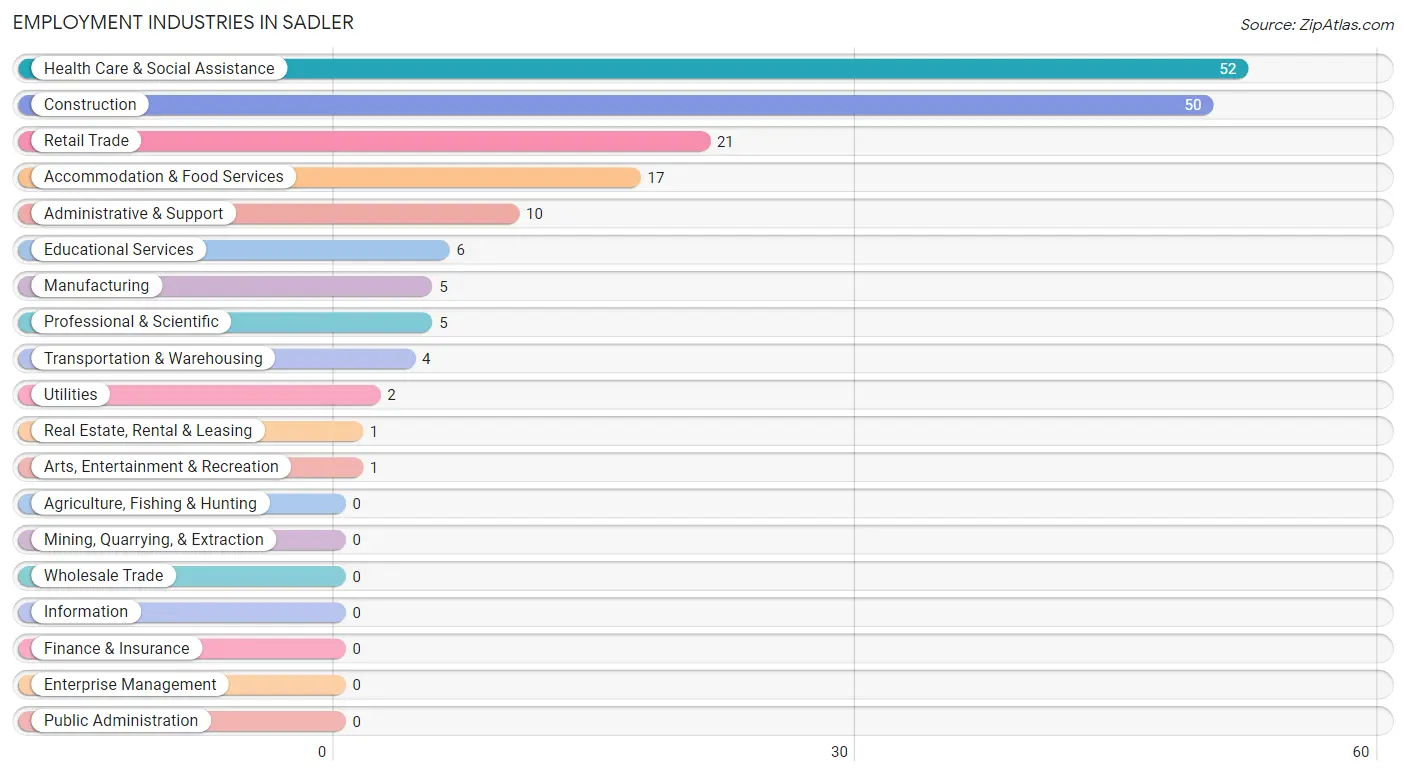
Employment Industries in Sadler
The major employment industries in Sadler include Health Care & Social Assistance (52 | 29.5%), Construction (50 | 28.4%), Retail Trade (21 | 11.9%), Accommodation & Food Services (17 | 9.7%), and Administrative & Support (10 | 5.7%).
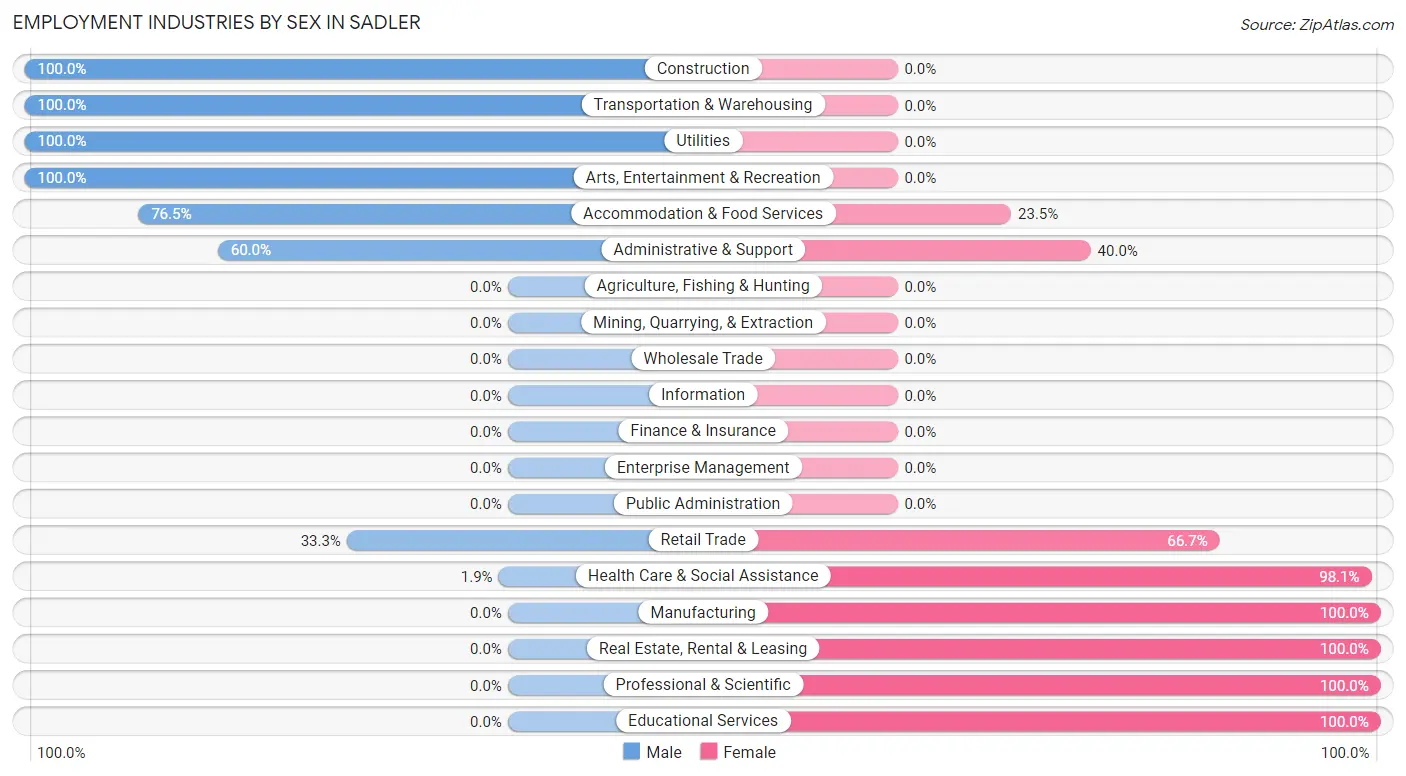
Employment Industries by Sex in Sadler
The Sadler industries that see more men than women are Construction (100.0%), Transportation & Warehousing (100.0%), and Utilities (100.0%), whereas the industries that tend to have a higher number of women are Manufacturing (100.0%), Real Estate, Rental & Leasing (100.0%), and Professional & Scientific (100.0%).
| Industry | Male | Female |
| Agriculture, Fishing & Hunting | 0 (0.0%) | 0 (0.0%) |
| Mining, Quarrying, & Extraction | 0 (0.0%) | 0 (0.0%) |
| Construction | 50 (100.0%) | 0 (0.0%) |
| Manufacturing | 0 (0.0%) | 5 (100.0%) |
| Wholesale Trade | 0 (0.0%) | 0 (0.0%) |
| Retail Trade | 7 (33.3%) | 14 (66.7%) |
| Transportation & Warehousing | 4 (100.0%) | 0 (0.0%) |
| Utilities | 2 (100.0%) | 0 (0.0%) |
| Information | 0 (0.0%) | 0 (0.0%) |
| Finance & Insurance | 0 (0.0%) | 0 (0.0%) |
| Real Estate, Rental & Leasing | 0 (0.0%) | 1 (100.0%) |
| Professional & Scientific | 0 (0.0%) | 5 (100.0%) |
| Enterprise Management | 0 (0.0%) | 0 (0.0%) |
| Administrative & Support | 6 (60.0%) | 4 (40.0%) |
| Educational Services | 0 (0.0%) | 6 (100.0%) |
| Health Care & Social Assistance | 1 (1.9%) | 51 (98.1%) |
| Arts, Entertainment & Recreation | 1 (100.0%) | 0 (0.0%) |
| Accommodation & Food Services | 13 (76.5%) | 4 (23.5%) |
| Public Administration | 0 (0.0%) | 0 (0.0%) |
| Total | 86 (48.9%) | 90 (51.1%) |
Education in Sadler
School Enrollment in Sadler
The most common levels of schooling among the 36 students in Sadler are high school (21 | 58.3%), middle school (8 | 22.2%), and college / undergraduate (7 | 19.4%).
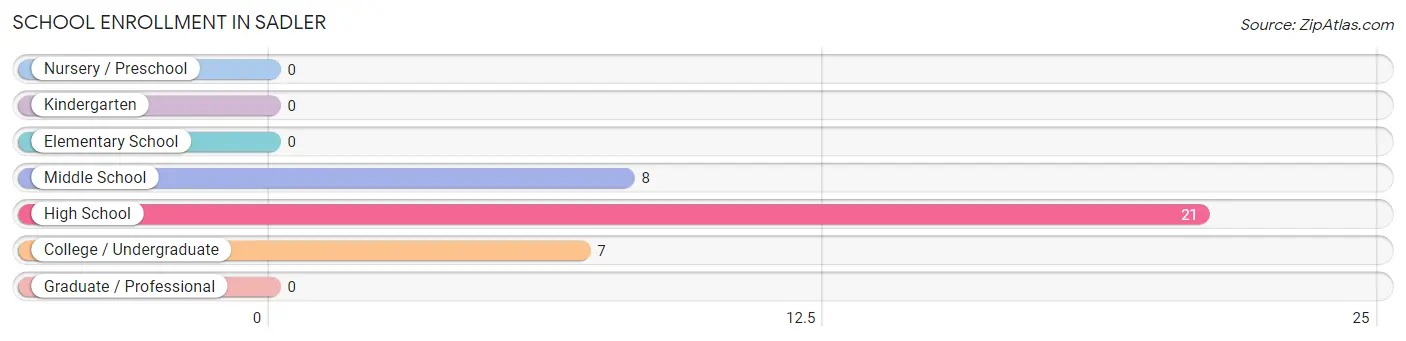
| School Level | # Students | % Students |
| Nursery / Preschool | 0 | 0.0% |
| Kindergarten | 0 | 0.0% |
| Elementary School | 0 | 0.0% |
| Middle School | 8 | 22.2% |
| High School | 21 | 58.3% |
| College / Undergraduate | 7 | 19.4% |
| Graduate / Professional | 0 | 0.0% |
| Total | 36 | 100.0% |
School Enrollment by Age by Funding Source in Sadler
Out of a total of 36 students who are enrolled in schools in Sadler, 3 (8.3%) attend a private institution, while the remaining 33 (91.7%) are enrolled in public schools. The age group of 18 to 19 year olds has the highest likelihood of being enrolled in private schools, with 3 (21.4% in the age bracket) enrolled. Conversely, the age group of 10 to 14 year olds has the lowest likelihood of being enrolled in a private school, with 11 (100.0% in the age bracket) attending a public institution.
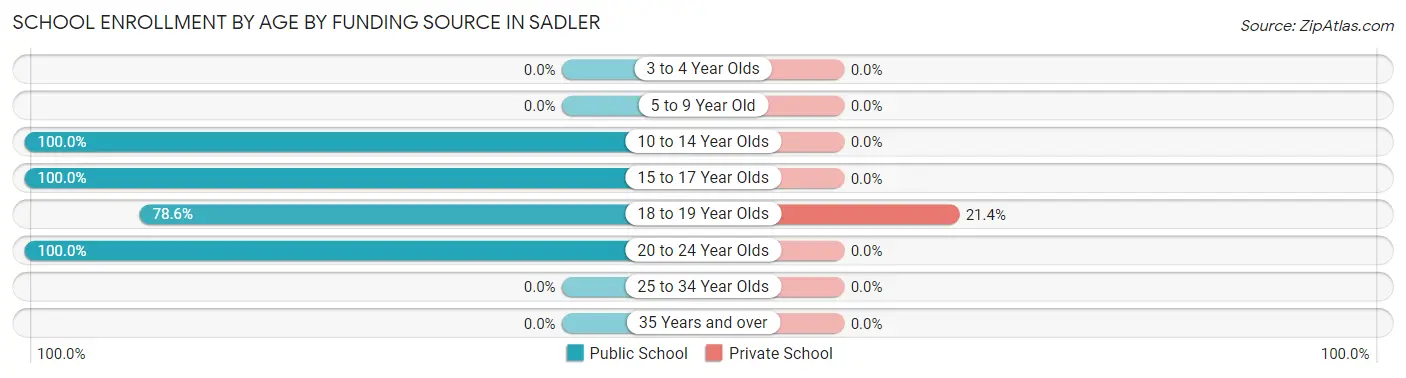
| Age Bracket | Public School | Private School |
| 3 to 4 Year Olds | 0 (0.0%) | 0 (0.0%) |
| 5 to 9 Year Old | 0 (0.0%) | 0 (0.0%) |
| 10 to 14 Year Olds | 11 (100.0%) | 0 (0.0%) |
| 15 to 17 Year Olds | 7 (100.0%) | 0 (0.0%) |
| 18 to 19 Year Olds | 11 (78.6%) | 3 (21.4%) |
| 20 to 24 Year Olds | 4 (100.0%) | 0 (0.0%) |
| 25 to 34 Year Olds | 0 (0.0%) | 0 (0.0%) |
| 35 Years and over | 0 (0.0%) | 0 (0.0%) |
| Total | 33 (91.7%) | 3 (8.3%) |
Educational Attainment by Field of Study in Sadler
Physical & health sciences (5 | 38.5%), business (3 | 23.1%), education (3 | 23.1%), and arts & humanities (2 | 15.4%) are the most common fields of study among 13 individuals in Sadler who have obtained a bachelor's degree or higher.
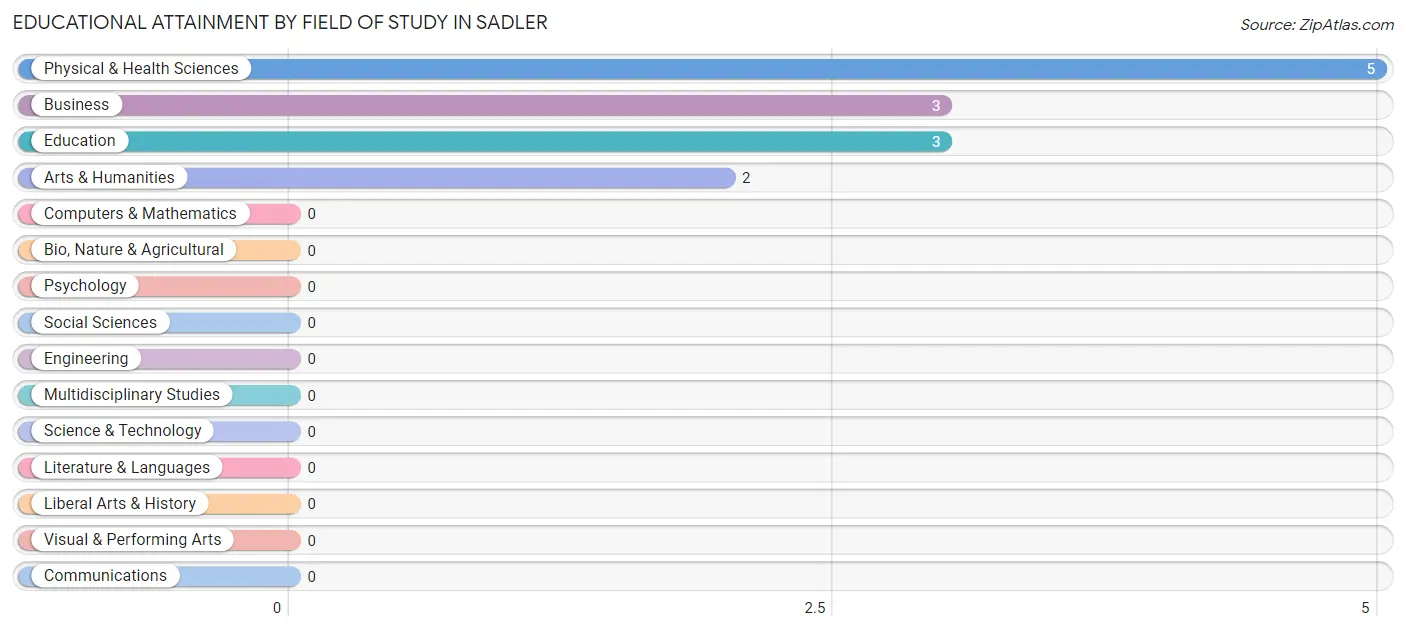
| Field of Study | # Graduates | % Graduates |
| Computers & Mathematics | 0 | 0.0% |
| Bio, Nature & Agricultural | 0 | 0.0% |
| Physical & Health Sciences | 5 | 38.5% |
| Psychology | 0 | 0.0% |
| Social Sciences | 0 | 0.0% |
| Engineering | 0 | 0.0% |
| Multidisciplinary Studies | 0 | 0.0% |
| Science & Technology | 0 | 0.0% |
| Business | 3 | 23.1% |
| Education | 3 | 23.1% |
| Literature & Languages | 0 | 0.0% |
| Liberal Arts & History | 0 | 0.0% |
| Visual & Performing Arts | 0 | 0.0% |
| Communications | 0 | 0.0% |
| Arts & Humanities | 2 | 15.4% |
| Total | 13 | 100.0% |
Transportation & Commute in Sadler
Vehicle Availability by Sex in Sadler
The most prevalent vehicle ownership categories in Sadler are males with 2 vehicles (74, accounting for 86.1%) and females with 2 vehicles (59, making up 82.2%).
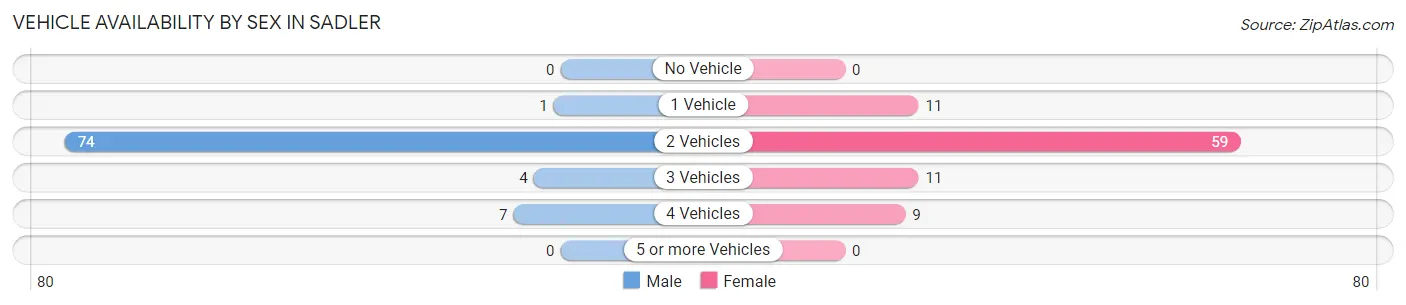
| Vehicles Available | Male | Female |
| No Vehicle | 0 (0.0%) | 0 (0.0%) |
| 1 Vehicle | 1 (1.2%) | 11 (12.2%) |
| 2 Vehicles | 74 (86.1%) | 59 (65.6%) |
| 3 Vehicles | 4 (4.6%) | 11 (12.2%) |
| 4 Vehicles | 7 (8.1%) | 9 (10.0%) |
| 5 or more Vehicles | 0 (0.0%) | 0 (0.0%) |
| Total | 86 (100.0%) | 90 (100.0%) |
Commute Time in Sadler
The most frequently occuring commute durations in Sadler are 25 to 29 minutes (60 commuters, 46.2%), 20 to 24 minutes (18 commuters, 13.9%), and 5 to 9 minutes (13 commuters, 10.0%).
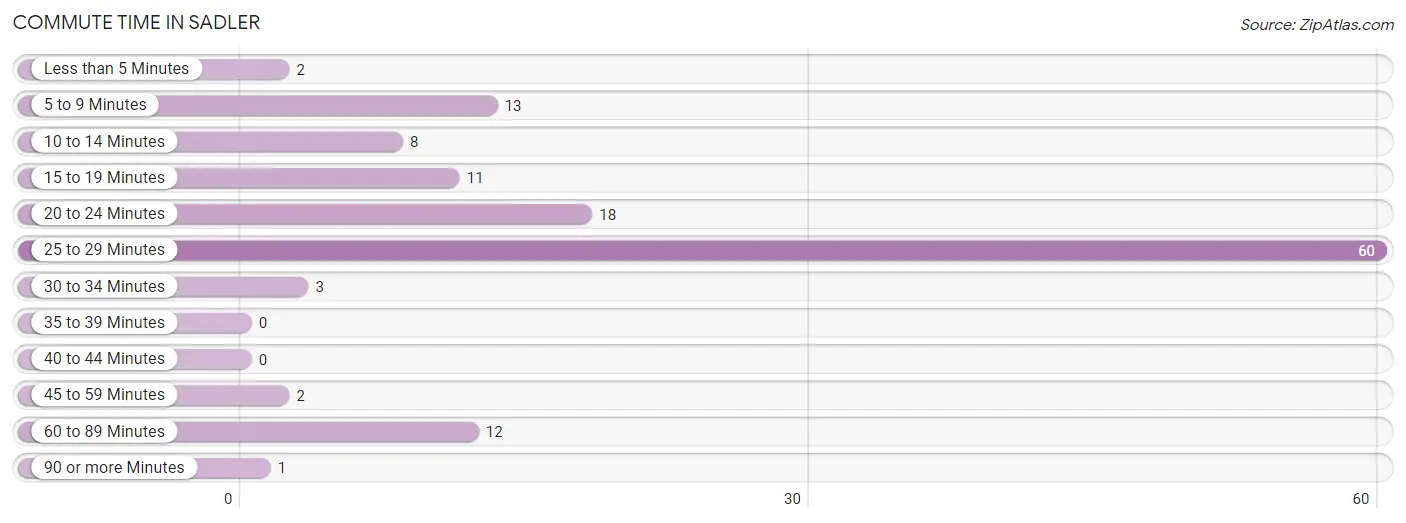
| Commute Time | # Commuters | % Commuters |
| Less than 5 Minutes | 2 | 1.5% |
| 5 to 9 Minutes | 13 | 10.0% |
| 10 to 14 Minutes | 8 | 6.1% |
| 15 to 19 Minutes | 11 | 8.5% |
| 20 to 24 Minutes | 18 | 13.9% |
| 25 to 29 Minutes | 60 | 46.2% |
| 30 to 34 Minutes | 3 | 2.3% |
| 35 to 39 Minutes | 0 | 0.0% |
| 40 to 44 Minutes | 0 | 0.0% |
| 45 to 59 Minutes | 2 | 1.5% |
| 60 to 89 Minutes | 12 | 9.2% |
| 90 or more Minutes | 1 | 0.8% |
Commute Time by Sex in Sadler
The most common commute times in Sadler are 60 to 89 minutes (12 commuters, 30.0%) for males and 25 to 29 minutes (52 commuters, 57.8%) for females.
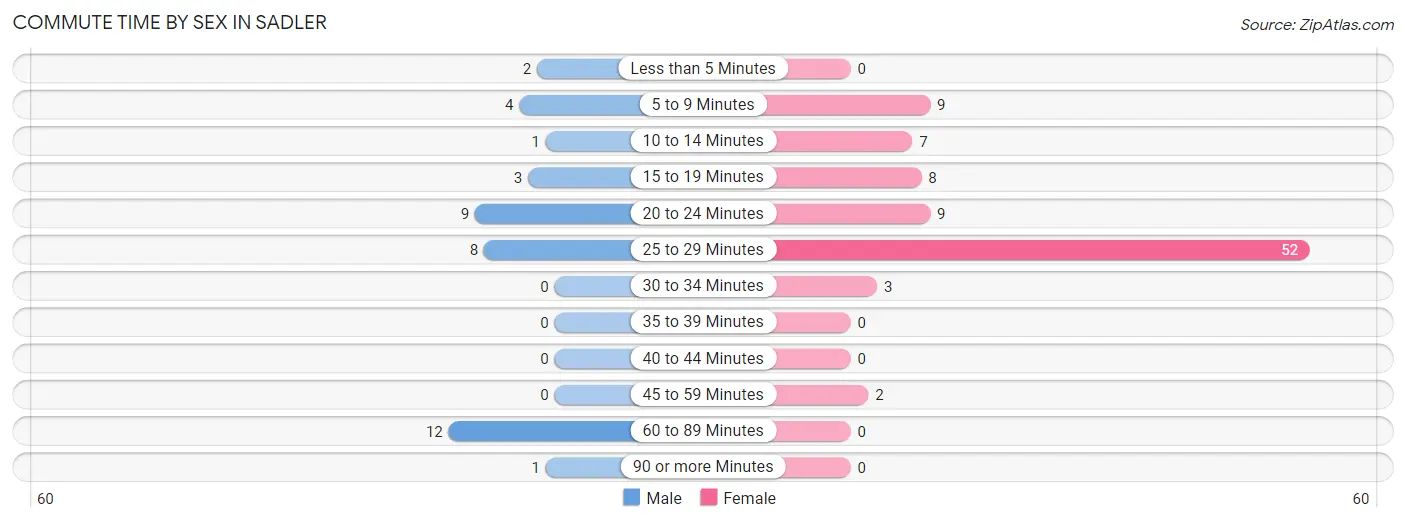
| Commute Time | Male | Female |
| Less than 5 Minutes | 2 (5.0%) | 0 (0.0%) |
| 5 to 9 Minutes | 4 (10.0%) | 9 (10.0%) |
| 10 to 14 Minutes | 1 (2.5%) | 7 (7.8%) |
| 15 to 19 Minutes | 3 (7.5%) | 8 (8.9%) |
| 20 to 24 Minutes | 9 (22.5%) | 9 (10.0%) |
| 25 to 29 Minutes | 8 (20.0%) | 52 (57.8%) |
| 30 to 34 Minutes | 0 (0.0%) | 3 (3.3%) |
| 35 to 39 Minutes | 0 (0.0%) | 0 (0.0%) |
| 40 to 44 Minutes | 0 (0.0%) | 0 (0.0%) |
| 45 to 59 Minutes | 0 (0.0%) | 2 (2.2%) |
| 60 to 89 Minutes | 12 (30.0%) | 0 (0.0%) |
| 90 or more Minutes | 1 (2.5%) | 0 (0.0%) |
Time of Departure to Work by Sex in Sadler
The most frequent times of departure to work in Sadler are 6:30 AM to 6:59 AM (19, 47.5%) for males and 5:00 AM to 5:29 AM (44, 48.9%) for females.
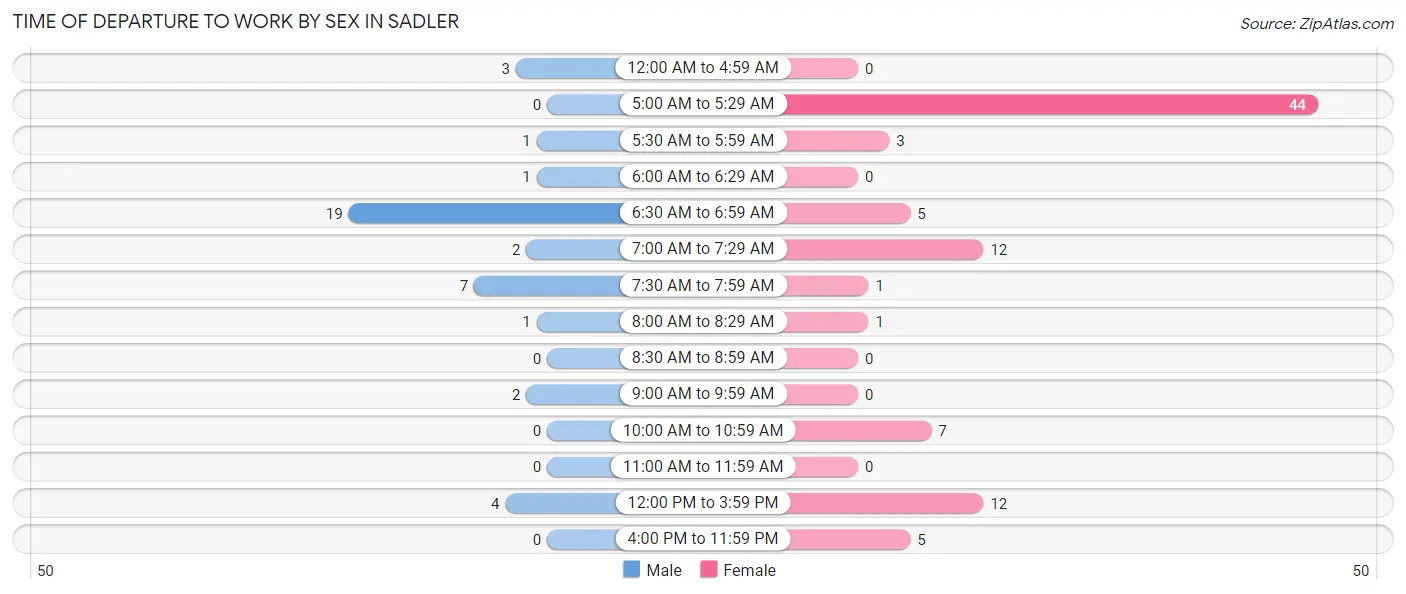
| Time of Departure | Male | Female |
| 12:00 AM to 4:59 AM | 3 (7.5%) | 0 (0.0%) |
| 5:00 AM to 5:29 AM | 0 (0.0%) | 44 (48.9%) |
| 5:30 AM to 5:59 AM | 1 (2.5%) | 3 (3.3%) |
| 6:00 AM to 6:29 AM | 1 (2.5%) | 0 (0.0%) |
| 6:30 AM to 6:59 AM | 19 (47.5%) | 5 (5.6%) |
| 7:00 AM to 7:29 AM | 2 (5.0%) | 12 (13.3%) |
| 7:30 AM to 7:59 AM | 7 (17.5%) | 1 (1.1%) |
| 8:00 AM to 8:29 AM | 1 (2.5%) | 1 (1.1%) |
| 8:30 AM to 8:59 AM | 0 (0.0%) | 0 (0.0%) |
| 9:00 AM to 9:59 AM | 2 (5.0%) | 0 (0.0%) |
| 10:00 AM to 10:59 AM | 0 (0.0%) | 7 (7.8%) |
| 11:00 AM to 11:59 AM | 0 (0.0%) | 0 (0.0%) |
| 12:00 PM to 3:59 PM | 4 (10.0%) | 12 (13.3%) |
| 4:00 PM to 11:59 PM | 0 (0.0%) | 5 (5.6%) |
| Total | 40 (100.0%) | 90 (100.0%) |
Housing Occupancy in Sadler
Occupancy by Ownership in Sadler
Of the total 151 dwellings in Sadler, owner-occupied units account for 64 (42.4%), while renter-occupied units make up 87 (57.6%).
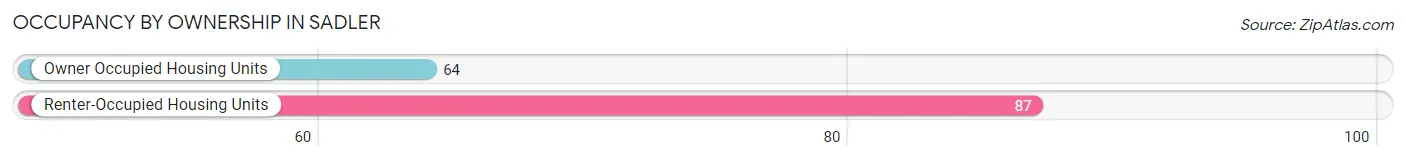
| Occupancy | # Housing Units | % Housing Units |
| Owner Occupied Housing Units | 64 | 42.4% |
| Renter-Occupied Housing Units | 87 | 57.6% |
| Total Occupied Housing Units | 151 | 100.0% |
Occupancy by Household Size in Sadler
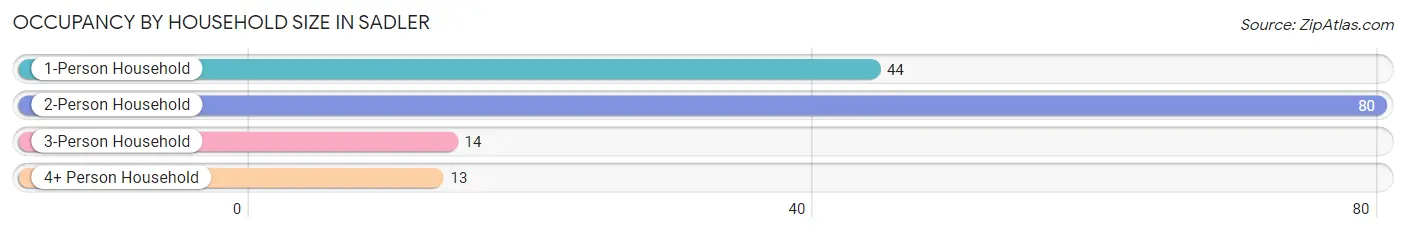
| Household Size | # Housing Units | % Housing Units |
| 1-Person Household | 44 | 29.1% |
| 2-Person Household | 80 | 53.0% |
| 3-Person Household | 14 | 9.3% |
| 4+ Person Household | 13 | 8.6% |
| Total Housing Units | 151 | 100.0% |
Occupancy by Ownership by Household Size in Sadler
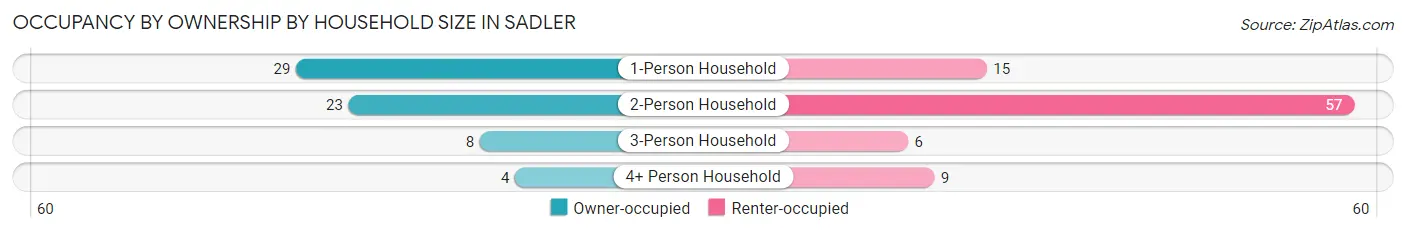
| Household Size | Owner-occupied | Renter-occupied |
| 1-Person Household | 29 (65.9%) | 15 (34.1%) |
| 2-Person Household | 23 (28.7%) | 57 (71.3%) |
| 3-Person Household | 8 (57.1%) | 6 (42.9%) |
| 4+ Person Household | 4 (30.8%) | 9 (69.2%) |
| Total Housing Units | 64 (42.4%) | 87 (57.6%) |
Occupancy by Educational Attainment in Sadler
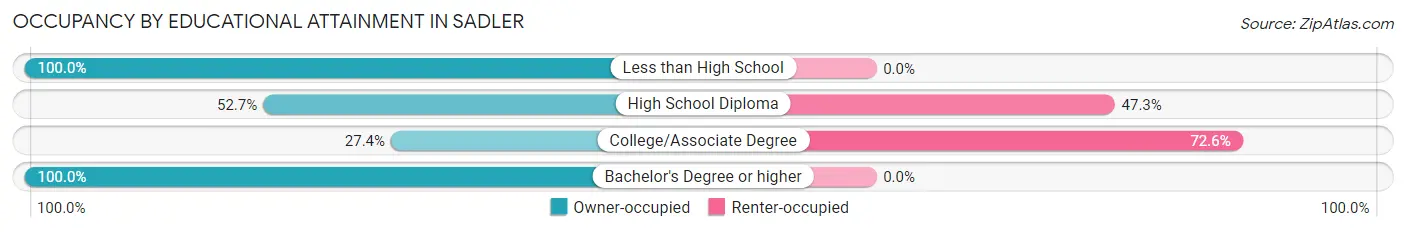
| Household Size | Owner-occupied | Renter-occupied |
| Less than High School | 4 (100.0%) | 0 (0.0%) |
| High School Diploma | 29 (52.7%) | 26 (47.3%) |
| College/Associate Degree | 23 (27.4%) | 61 (72.6%) |
| Bachelor's Degree or higher | 8 (100.0%) | 0 (0.0%) |
Occupancy by Age of Householder in Sadler
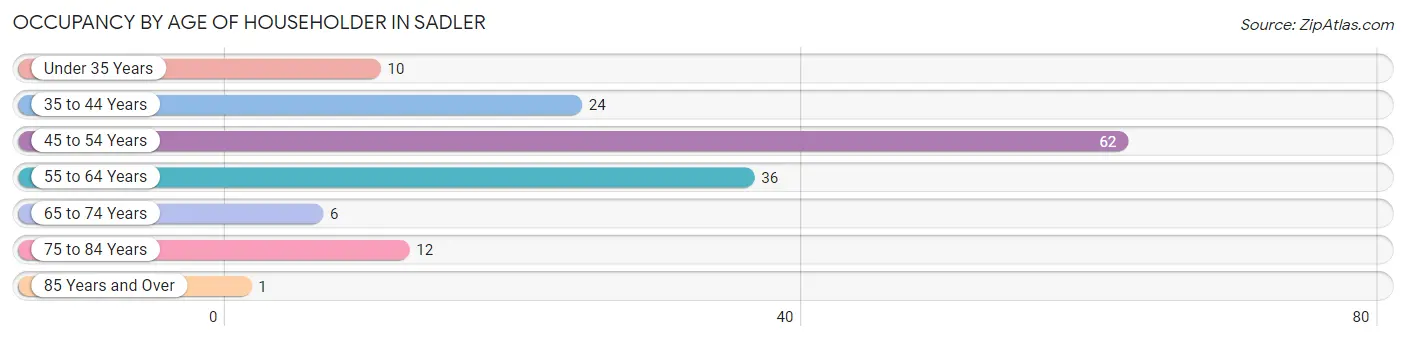
| Age Bracket | # Households | % Households |
| Under 35 Years | 10 | 6.6% |
| 35 to 44 Years | 24 | 15.9% |
| 45 to 54 Years | 62 | 41.1% |
| 55 to 64 Years | 36 | 23.8% |
| 65 to 74 Years | 6 | 4.0% |
| 75 to 84 Years | 12 | 8.0% |
| 85 Years and Over | 1 | 0.7% |
| Total | 151 | 100.0% |
Housing Finances in Sadler
Median Income by Occupancy in Sadler
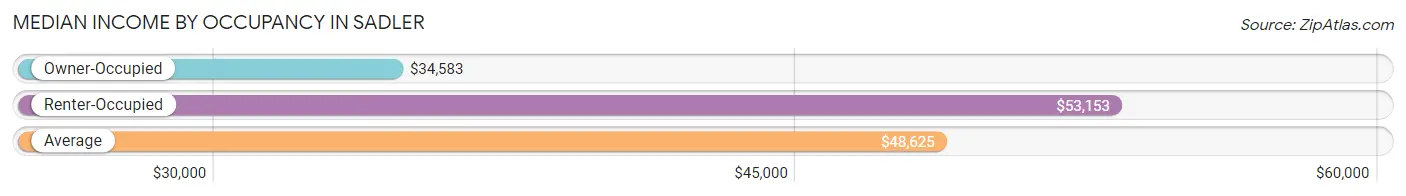
| Occupancy Type | # Households | Median Income |
| Owner-Occupied | 64 (42.4%) | $34,583 |
| Renter-Occupied | 87 (57.6%) | $53,153 |
| Average | 151 (100.0%) | $48,625 |
Occupancy by Householder Income Bracket in Sadler
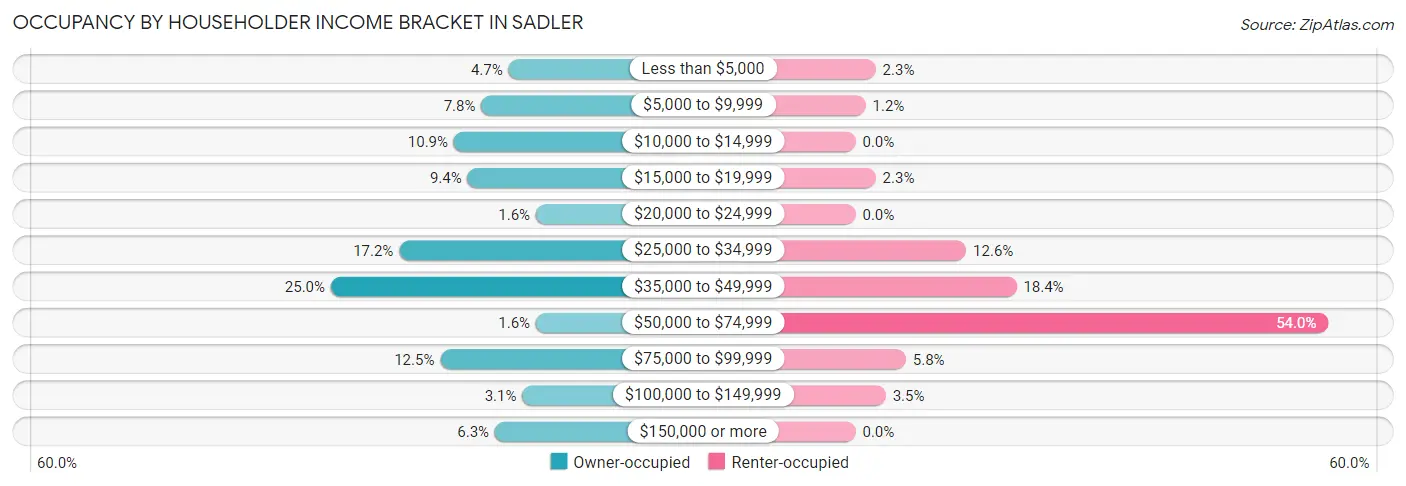
| Income Bracket | Owner-occupied | Renter-occupied |
| Less than $5,000 | 3 (4.7%) | 2 (2.3%) |
| $5,000 to $9,999 | 5 (7.8%) | 1 (1.1%) |
| $10,000 to $14,999 | 7 (10.9%) | 0 (0.0%) |
| $15,000 to $19,999 | 6 (9.4%) | 2 (2.3%) |
| $20,000 to $24,999 | 1 (1.6%) | 0 (0.0%) |
| $25,000 to $34,999 | 11 (17.2%) | 11 (12.6%) |
| $35,000 to $49,999 | 16 (25.0%) | 16 (18.4%) |
| $50,000 to $74,999 | 1 (1.6%) | 47 (54.0%) |
| $75,000 to $99,999 | 8 (12.5%) | 5 (5.8%) |
| $100,000 to $149,999 | 2 (3.1%) | 3 (3.5%) |
| $150,000 or more | 4 (6.2%) | 0 (0.0%) |
| Total | 64 (100.0%) | 87 (100.0%) |
Monthly Housing Cost Tiers in Sadler
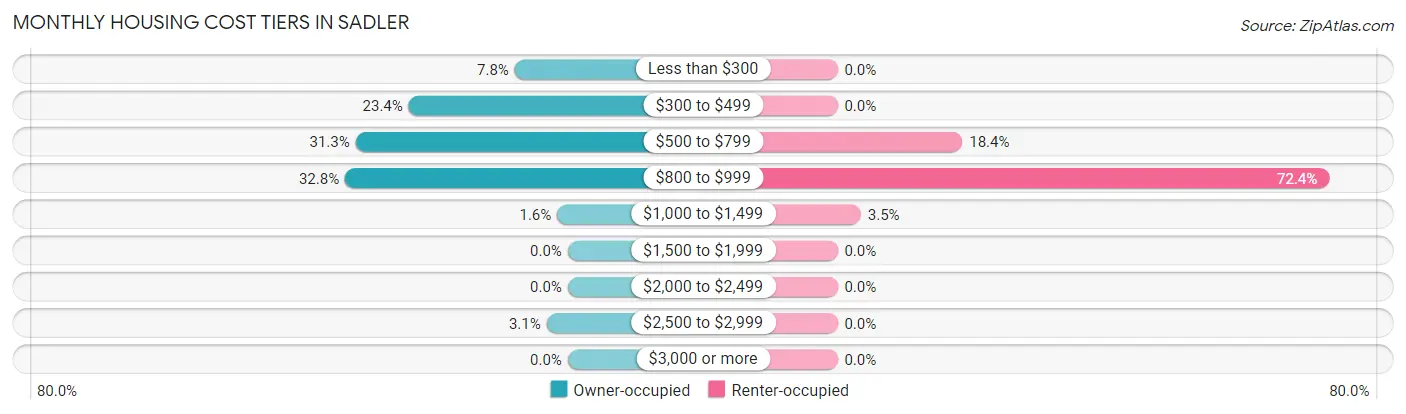
| Monthly Cost | Owner-occupied | Renter-occupied |
| Less than $300 | 5 (7.8%) | 0 (0.0%) |
| $300 to $499 | 15 (23.4%) | 0 (0.0%) |
| $500 to $799 | 20 (31.2%) | 16 (18.4%) |
| $800 to $999 | 21 (32.8%) | 63 (72.4%) |
| $1,000 to $1,499 | 1 (1.6%) | 3 (3.5%) |
| $1,500 to $1,999 | 0 (0.0%) | 0 (0.0%) |
| $2,000 to $2,499 | 0 (0.0%) | 0 (0.0%) |
| $2,500 to $2,999 | 2 (3.1%) | 0 (0.0%) |
| $3,000 or more | 0 (0.0%) | 0 (0.0%) |
| Total | 64 (100.0%) | 87 (100.0%) |
Physical Housing Characteristics in Sadler
Housing Structures in Sadler
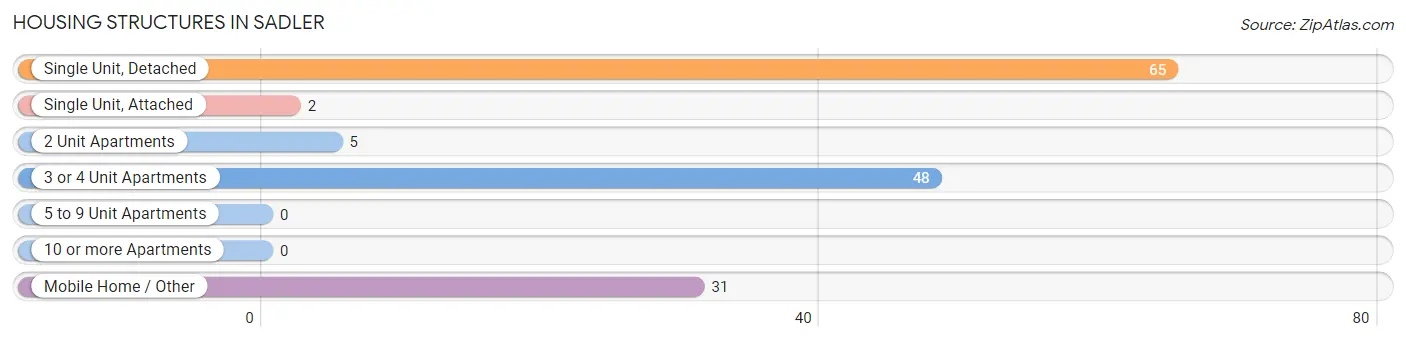
| Structure Type | # Housing Units | % Housing Units |
| Single Unit, Detached | 65 | 43.0% |
| Single Unit, Attached | 2 | 1.3% |
| 2 Unit Apartments | 5 | 3.3% |
| 3 or 4 Unit Apartments | 48 | 31.8% |
| 5 to 9 Unit Apartments | 0 | 0.0% |
| 10 or more Apartments | 0 | 0.0% |
| Mobile Home / Other | 31 | 20.5% |
| Total | 151 | 100.0% |
Housing Structures by Occupancy in Sadler
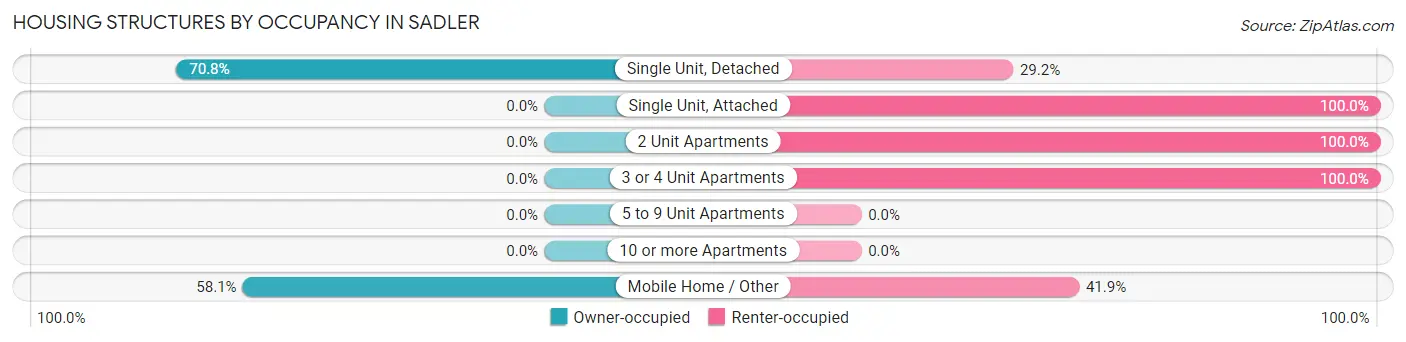
| Structure Type | Owner-occupied | Renter-occupied |
| Single Unit, Detached | 46 (70.8%) | 19 (29.2%) |
| Single Unit, Attached | 0 (0.0%) | 2 (100.0%) |
| 2 Unit Apartments | 0 (0.0%) | 5 (100.0%) |
| 3 or 4 Unit Apartments | 0 (0.0%) | 48 (100.0%) |
| 5 to 9 Unit Apartments | 0 (0.0%) | 0 (0.0%) |
| 10 or more Apartments | 0 (0.0%) | 0 (0.0%) |
| Mobile Home / Other | 18 (58.1%) | 13 (41.9%) |
| Total | 64 (42.4%) | 87 (57.6%) |
Housing Structures by Number of Rooms in Sadler
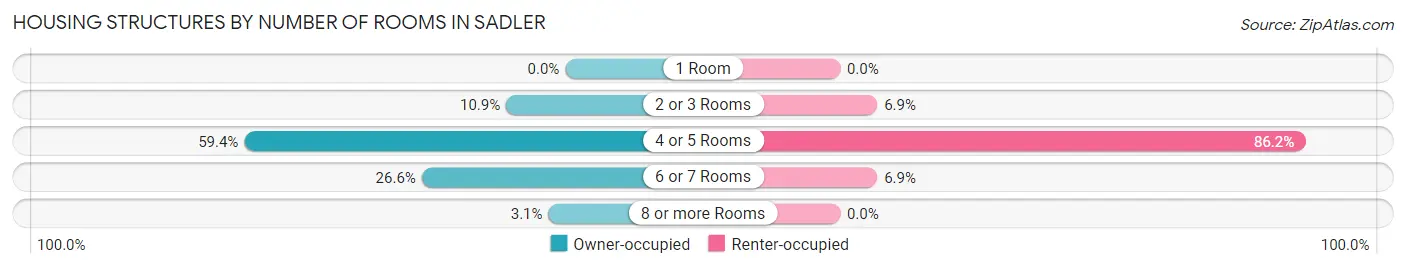
| Number of Rooms | Owner-occupied | Renter-occupied |
| 1 Room | 0 (0.0%) | 0 (0.0%) |
| 2 or 3 Rooms | 7 (10.9%) | 6 (6.9%) |
| 4 or 5 Rooms | 38 (59.4%) | 75 (86.2%) |
| 6 or 7 Rooms | 17 (26.6%) | 6 (6.9%) |
| 8 or more Rooms | 2 (3.1%) | 0 (0.0%) |
| Total | 64 (100.0%) | 87 (100.0%) |
Housing Structure by Heating Type in Sadler
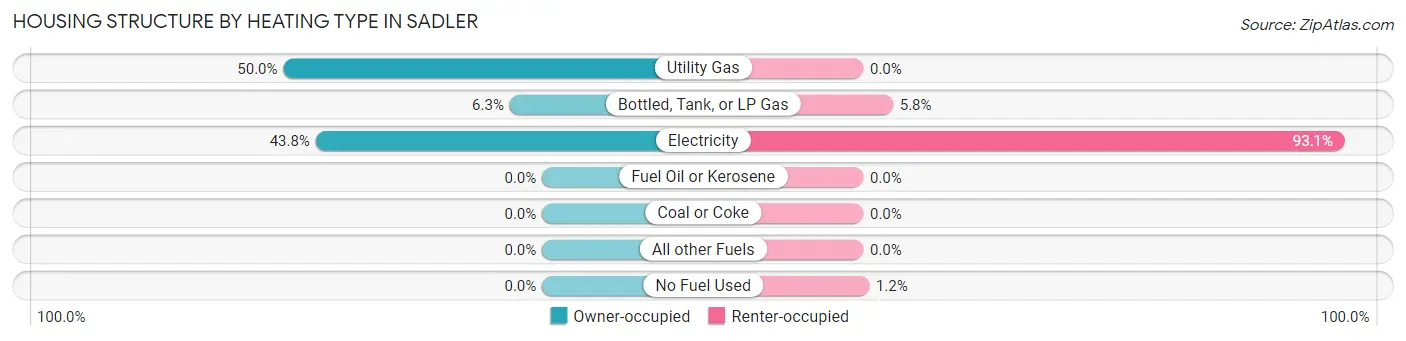
| Heating Type | Owner-occupied | Renter-occupied |
| Utility Gas | 32 (50.0%) | 0 (0.0%) |
| Bottled, Tank, or LP Gas | 4 (6.2%) | 5 (5.8%) |
| Electricity | 28 (43.8%) | 81 (93.1%) |
| Fuel Oil or Kerosene | 0 (0.0%) | 0 (0.0%) |
| Coal or Coke | 0 (0.0%) | 0 (0.0%) |
| All other Fuels | 0 (0.0%) | 0 (0.0%) |
| No Fuel Used | 0 (0.0%) | 1 (1.1%) |
| Total | 64 (100.0%) | 87 (100.0%) |
Household Vehicle Usage in Sadler
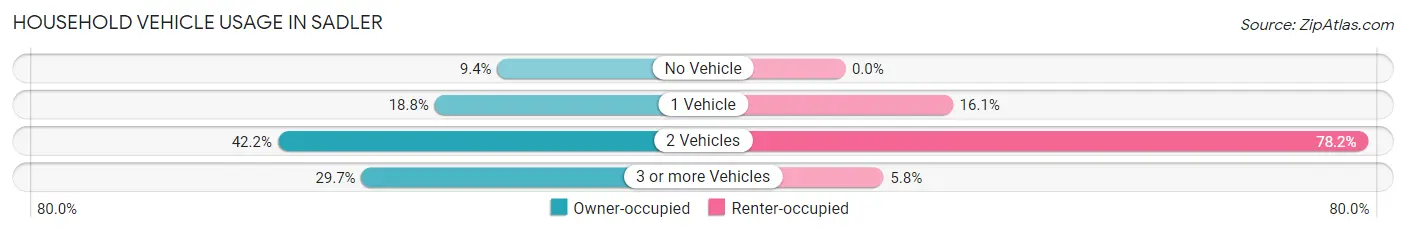
| Vehicles per Household | Owner-occupied | Renter-occupied |
| No Vehicle | 6 (9.4%) | 0 (0.0%) |
| 1 Vehicle | 12 (18.8%) | 14 (16.1%) |
| 2 Vehicles | 27 (42.2%) | 68 (78.2%) |
| 3 or more Vehicles | 19 (29.7%) | 5 (5.8%) |
| Total | 64 (100.0%) | 87 (100.0%) |
Real Estate & Mortgages in Sadler
Real Estate and Mortgage Overview in Sadler
| Characteristic | Without Mortgage | With Mortgage |
| Housing Units | 43 | 21 |
| Median Property Value | $110,900 | $91,700 |
| Median Household Income | $30,750 | $4 |
| Monthly Housing Costs | $617 | $0 |
| Real Estate Taxes | - | - |
Property Value by Mortgage Status in Sadler
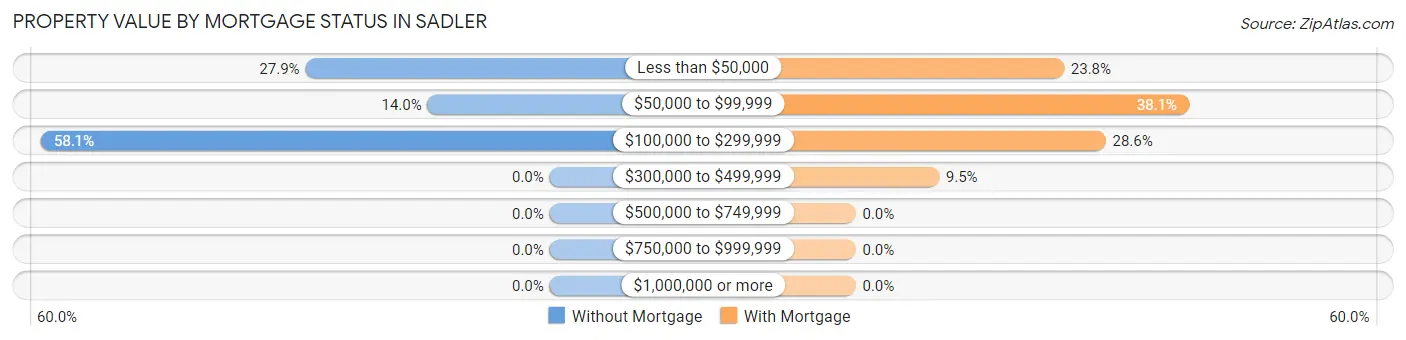
| Property Value | Without Mortgage | With Mortgage |
| Less than $50,000 | 12 (27.9%) | 5 (23.8%) |
| $50,000 to $99,999 | 6 (14.0%) | 8 (38.1%) |
| $100,000 to $299,999 | 25 (58.1%) | 6 (28.6%) |
| $300,000 to $499,999 | 0 (0.0%) | 2 (9.5%) |
| $500,000 to $749,999 | 0 (0.0%) | 0 (0.0%) |
| $750,000 to $999,999 | 0 (0.0%) | 0 (0.0%) |
| $1,000,000 or more | 0 (0.0%) | 0 (0.0%) |
| Total | 43 (100.0%) | 21 (100.0%) |
Household Income by Mortgage Status in Sadler
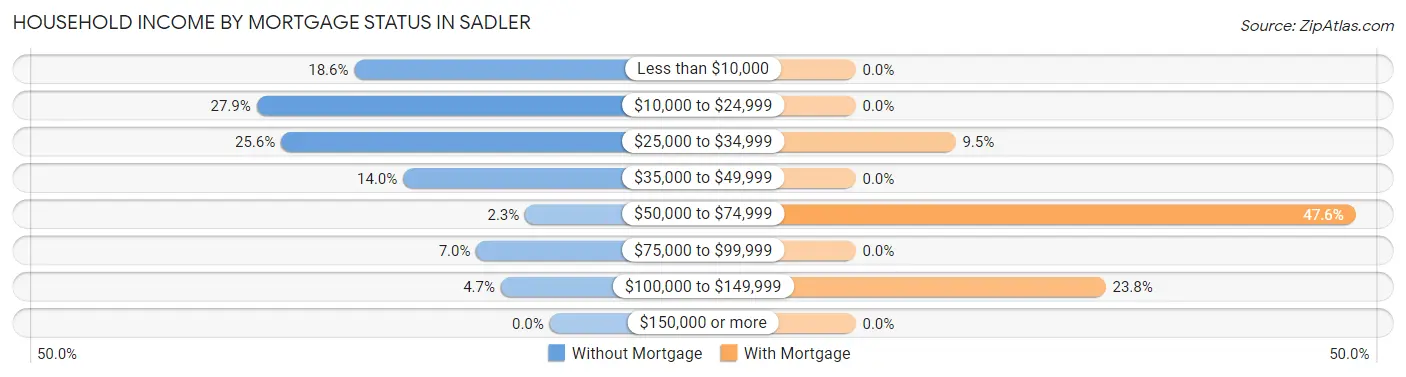
| Household Income | Without Mortgage | With Mortgage |
| Less than $10,000 | 8 (18.6%) | 0 (0.0%) |
| $10,000 to $24,999 | 12 (27.9%) | 0 (0.0%) |
| $25,000 to $34,999 | 11 (25.6%) | 2 (9.5%) |
| $35,000 to $49,999 | 6 (14.0%) | 0 (0.0%) |
| $50,000 to $74,999 | 1 (2.3%) | 10 (47.6%) |
| $75,000 to $99,999 | 3 (7.0%) | 0 (0.0%) |
| $100,000 to $149,999 | 2 (4.6%) | 5 (23.8%) |
| $150,000 or more | 0 (0.0%) | 0 (0.0%) |
| Total | 43 (100.0%) | 21 (100.0%) |
Property Value to Household Income Ratio in Sadler
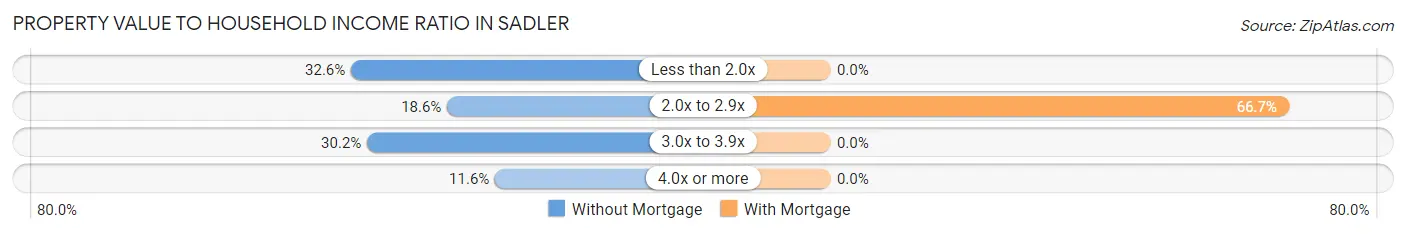
| Value-to-Income Ratio | Without Mortgage | With Mortgage |
| Less than 2.0x | 14 (32.6%) | 0 (0.0%) |
| 2.0x to 2.9x | 8 (18.6%) | 14 (66.7%) |
| 3.0x to 3.9x | 13 (30.2%) | 0 (0.0%) |
| 4.0x or more | 5 (11.6%) | 0 (0.0%) |
| Total | 43 (100.0%) | 21 (100.0%) |
Real Estate Taxes by Mortgage Status in Sadler
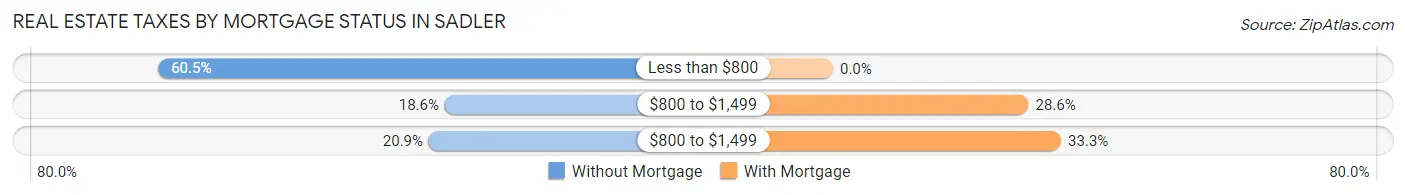
| Property Taxes | Without Mortgage | With Mortgage |
| Less than $800 | 26 (60.5%) | 0 (0.0%) |
| $800 to $1,499 | 8 (18.6%) | 6 (28.6%) |
| $800 to $1,499 | 9 (20.9%) | 7 (33.3%) |
| Total | 43 (100.0%) | 21 (100.0%) |
Health & Disability in Sadler
Health Insurance Coverage by Age in Sadler
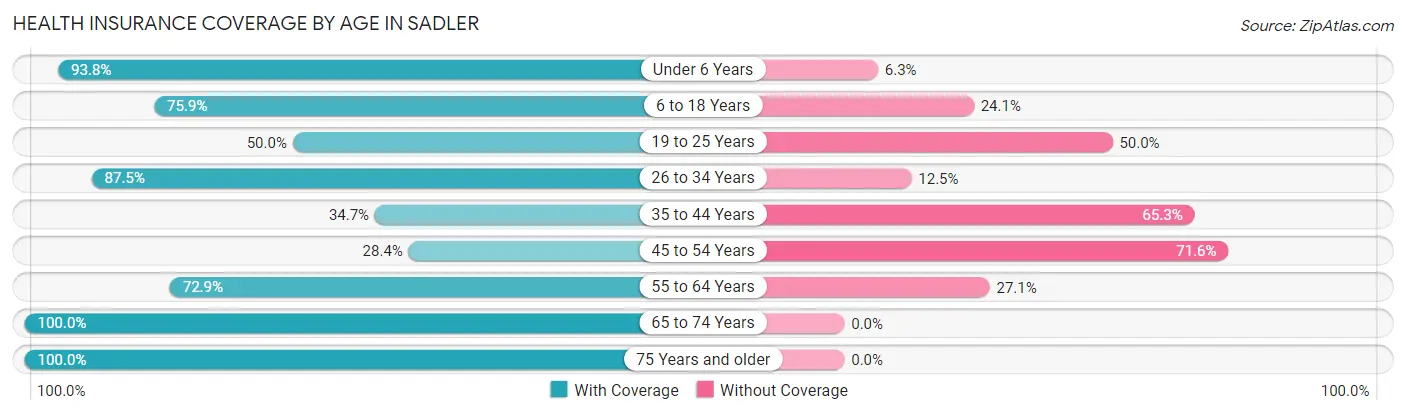
| Age Bracket | With Coverage | Without Coverage |
| Under 6 Years | 30 (93.8%) | 2 (6.2%) |
| 6 to 18 Years | 22 (75.9%) | 7 (24.1%) |
| 19 to 25 Years | 9 (50.0%) | 9 (50.0%) |
| 26 to 34 Years | 21 (87.5%) | 3 (12.5%) |
| 35 to 44 Years | 26 (34.7%) | 49 (65.3%) |
| 45 to 54 Years | 21 (28.4%) | 53 (71.6%) |
| 55 to 64 Years | 35 (72.9%) | 13 (27.1%) |
| 65 to 74 Years | 15 (100.0%) | 0 (0.0%) |
| 75 Years and older | 15 (100.0%) | 0 (0.0%) |
| Total | 194 (58.8%) | 136 (41.2%) |
Health Insurance Coverage by Citizenship Status in Sadler
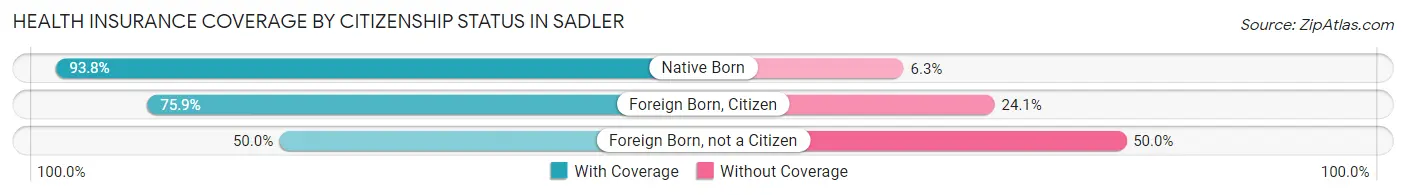
| Citizenship Status | With Coverage | Without Coverage |
| Native Born | 30 (93.8%) | 2 (6.2%) |
| Foreign Born, Citizen | 22 (75.9%) | 7 (24.1%) |
| Foreign Born, not a Citizen | 9 (50.0%) | 9 (50.0%) |
Health Insurance Coverage by Household Income in Sadler
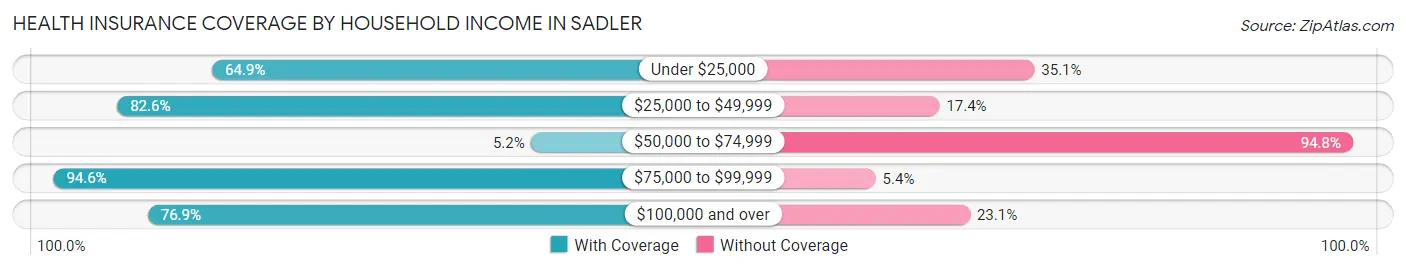
| Household Income | With Coverage | Without Coverage |
| Under $25,000 | 24 (64.9%) | 13 (35.1%) |
| $25,000 to $49,999 | 100 (82.6%) | 21 (17.4%) |
| $50,000 to $74,999 | 5 (5.2%) | 91 (94.8%) |
| $75,000 to $99,999 | 35 (94.6%) | 2 (5.4%) |
| $100,000 and over | 30 (76.9%) | 9 (23.1%) |
Public vs Private Health Insurance Coverage by Age in Sadler
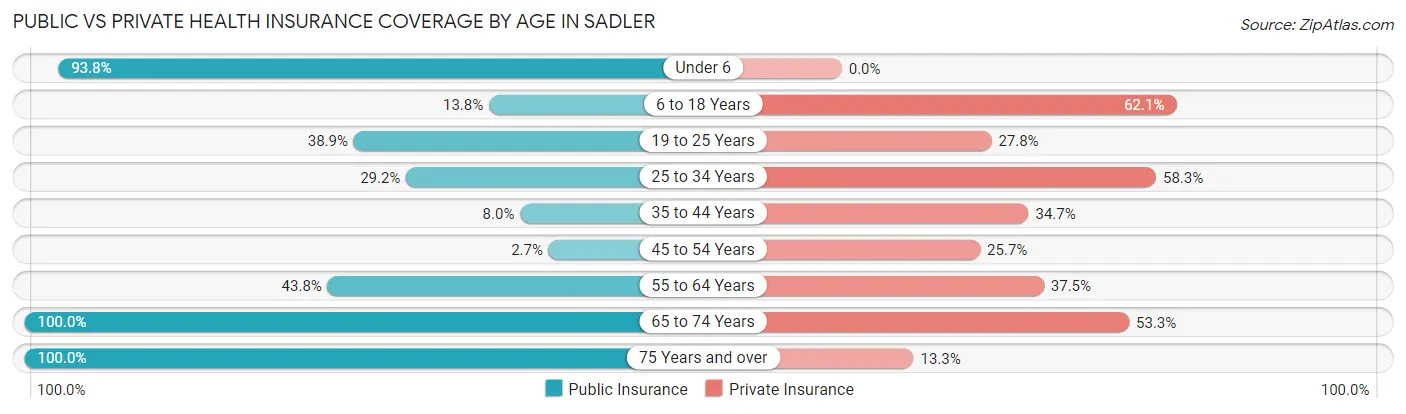
| Age Bracket | Public Insurance | Private Insurance |
| Under 6 | 30 (93.8%) | 0 (0.0%) |
| 6 to 18 Years | 4 (13.8%) | 18 (62.1%) |
| 19 to 25 Years | 7 (38.9%) | 5 (27.8%) |
| 25 to 34 Years | 7 (29.2%) | 14 (58.3%) |
| 35 to 44 Years | 6 (8.0%) | 26 (34.7%) |
| 45 to 54 Years | 2 (2.7%) | 19 (25.7%) |
| 55 to 64 Years | 21 (43.8%) | 18 (37.5%) |
| 65 to 74 Years | 15 (100.0%) | 8 (53.3%) |
| 75 Years and over | 15 (100.0%) | 2 (13.3%) |
| Total | 107 (32.4%) | 110 (33.3%) |
Disability Status by Sex by Age in Sadler
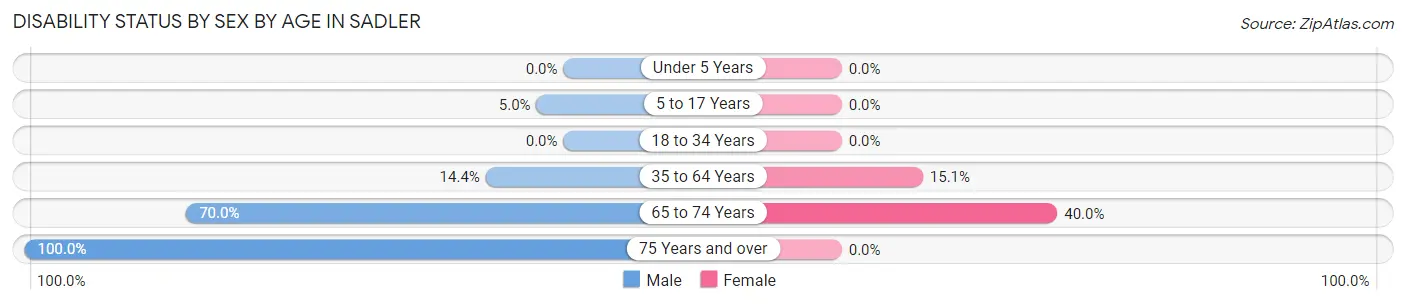
| Age Bracket | Male | Female |
| Under 5 Years | 0 (0.0%) | 0 (0.0%) |
| 5 to 17 Years | 1 (5.0%) | 0 (0.0%) |
| 18 to 34 Years | 0 (0.0%) | 0 (0.0%) |
| 35 to 64 Years | 15 (14.4%) | 14 (15.0%) |
| 65 to 74 Years | 7 (70.0%) | 2 (40.0%) |
| 75 Years and over | 12 (100.0%) | 0 (0.0%) |
Disability Class by Sex by Age in Sadler
Disability Class: Hearing Difficulty
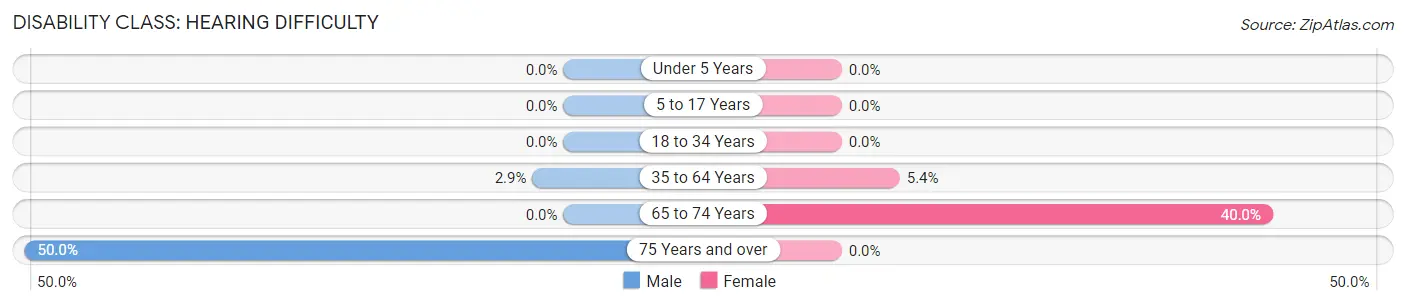
| Age Bracket | Male | Female |
| Under 5 Years | 0 (0.0%) | 0 (0.0%) |
| 5 to 17 Years | 0 (0.0%) | 0 (0.0%) |
| 18 to 34 Years | 0 (0.0%) | 0 (0.0%) |
| 35 to 64 Years | 3 (2.9%) | 5 (5.4%) |
| 65 to 74 Years | 0 (0.0%) | 2 (40.0%) |
| 75 Years and over | 6 (50.0%) | 0 (0.0%) |
Disability Class: Vision Difficulty
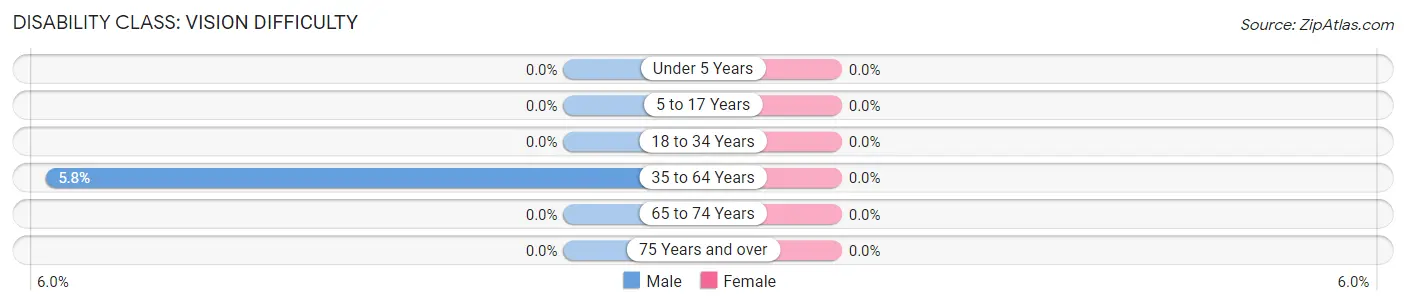
| Age Bracket | Male | Female |
| Under 5 Years | 0 (0.0%) | 0 (0.0%) |
| 5 to 17 Years | 0 (0.0%) | 0 (0.0%) |
| 18 to 34 Years | 0 (0.0%) | 0 (0.0%) |
| 35 to 64 Years | 6 (5.8%) | 0 (0.0%) |
| 65 to 74 Years | 0 (0.0%) | 0 (0.0%) |
| 75 Years and over | 0 (0.0%) | 0 (0.0%) |
Disability Class: Cognitive Difficulty
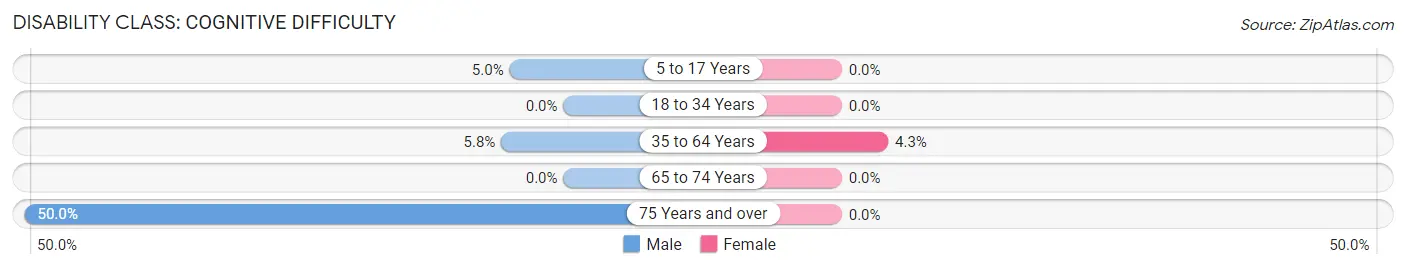
| Age Bracket | Male | Female |
| 5 to 17 Years | 1 (5.0%) | 0 (0.0%) |
| 18 to 34 Years | 0 (0.0%) | 0 (0.0%) |
| 35 to 64 Years | 6 (5.8%) | 4 (4.3%) |
| 65 to 74 Years | 0 (0.0%) | 0 (0.0%) |
| 75 Years and over | 6 (50.0%) | 0 (0.0%) |
Disability Class: Ambulatory Difficulty
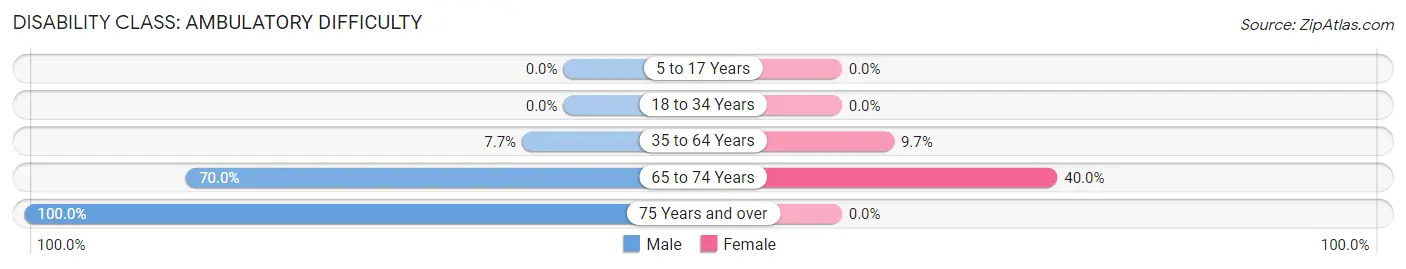
| Age Bracket | Male | Female |
| 5 to 17 Years | 0 (0.0%) | 0 (0.0%) |
| 18 to 34 Years | 0 (0.0%) | 0 (0.0%) |
| 35 to 64 Years | 8 (7.7%) | 9 (9.7%) |
| 65 to 74 Years | 7 (70.0%) | 2 (40.0%) |
| 75 Years and over | 12 (100.0%) | 0 (0.0%) |
Disability Class: Self-Care Difficulty
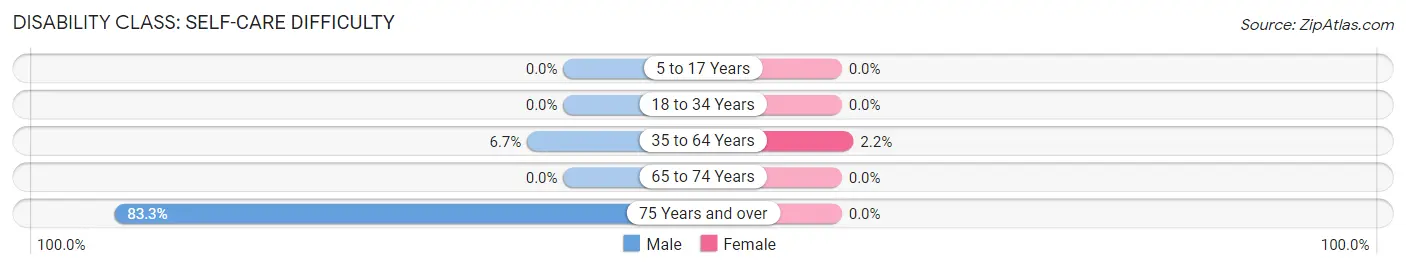
| Age Bracket | Male | Female |
| 5 to 17 Years | 0 (0.0%) | 0 (0.0%) |
| 18 to 34 Years | 0 (0.0%) | 0 (0.0%) |
| 35 to 64 Years | 7 (6.7%) | 2 (2.1%) |
| 65 to 74 Years | 0 (0.0%) | 0 (0.0%) |
| 75 Years and over | 10 (83.3%) | 0 (0.0%) |
Technology Access in Sadler
Computing Device Access in Sadler
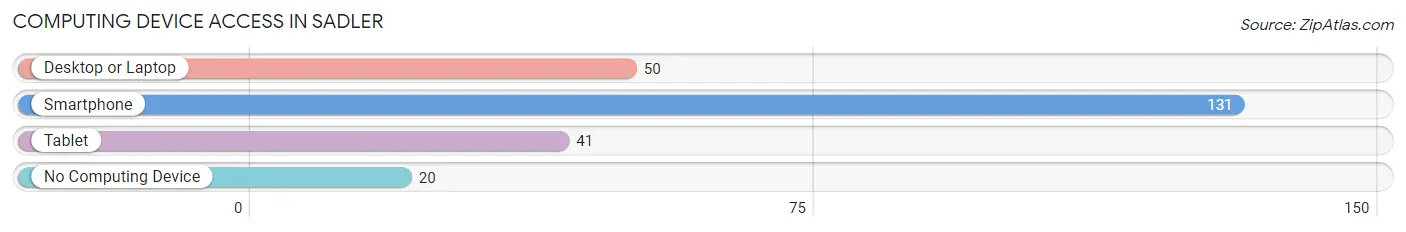
| Device Type | # Households | % Households |
| Desktop or Laptop | 50 | 33.1% |
| Smartphone | 131 | 86.8% |
| Tablet | 41 | 27.2% |
| No Computing Device | 20 | 13.3% |
| Total | 151 | 100.0% |
Internet Access in Sadler
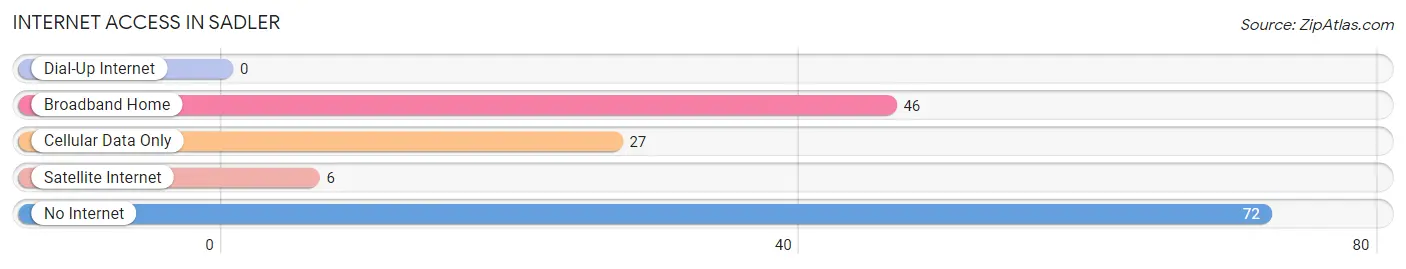
| Internet Type | # Households | % Households |
| Dial-Up Internet | 0 | 0.0% |
| Broadband Home | 46 | 30.5% |
| Cellular Data Only | 27 | 17.9% |
| Satellite Internet | 6 | 4.0% |
| No Internet | 72 | 47.7% |
| Total | 151 | 100.0% |
Sadler Summary
History
The city of Sadler, Texas is located in Grayson County, about 60 miles north of Dallas. It was founded in 1881 by William Sadler, a local farmer and rancher. The town was originally called Sadler's Station, but the name was changed to Sadler in 1883. The town was incorporated in 1885 and has remained a small, rural community ever since.
The town was originally a stop on the Missouri-Kansas-Texas Railroad, and it served as a shipping point for local farmers and ranchers. The railroad also brought new settlers to the area, and the population of Sadler grew steadily throughout the late 19th and early 20th centuries.
The town was home to several businesses, including a cotton gin, a blacksmith shop, a general store, and a hotel. The town also had a school, a post office, and a bank.
In the early 20th century, Sadler was a thriving agricultural community. Cotton was the main crop, but farmers also grew corn, wheat, and other crops. The town also had a thriving dairy industry, and several local dairies supplied milk to the surrounding area.
In the 1950s, Sadler began to decline as the railroad stopped running and the local economy shifted away from agriculture. The population of the town decreased, and many of the businesses closed.
In the late 20th century, Sadler began to experience a resurgence. The town was revitalized by the opening of a new highway, which brought new businesses and residents to the area. The town also benefited from the growth of nearby cities, such as Sherman and Denison.
Today, Sadler is a small, rural community with a population of about 1,000. The town is home to several businesses, including a grocery store, a hardware store, and a few restaurants. The town also has a post office, a bank, and a library.
Geography
Sadler is located in Grayson County, about 60 miles north of Dallas. The town is situated on the banks of the Red River, which forms the border between Texas and Oklahoma. The town is surrounded by rolling hills and farmland, and the terrain is mostly flat.
The climate in Sadler is humid subtropical, with hot summers and mild winters. The average annual temperature is around 70 degrees Fahrenheit, and the average annual precipitation is around 40 inches.
Economy
The economy of Sadler is largely based on agriculture. The town is home to several farms, and the surrounding area is used for growing cotton, corn, wheat, and other crops. The town also has a thriving dairy industry, and several local dairies supply milk to the surrounding area.
In addition to agriculture, Sadler is home to several small businesses, including a grocery store, a hardware store, and a few restaurants. The town also has a post office, a bank, and a library.
Demographics
As of the 2010 census, the population of Sadler was 1,039. The racial makeup of the town was 94.3% White, 0.7% African American, 0.3% Native American, 0.2% Asian, 0.1% Pacific Islander, 2.7% from other races, and 1.9% from two or more races. Hispanic or Latino of any race were 5.2% of the population.
The median household income in Sadler was $37,500, and the median family income was $41,250. The per capita income was $17,845. About 11.3% of families and 14.2% of the population were below the poverty line, including 18.2% of those under age 18 and 8.3% of those age 65 or over.
Common Questions
What is Per Capita Income in Sadler?
Per Capita income in Sadler is $23,362.
What is the Median Family Income in Sadler?
Median Family Income in Sadler is $48,375.
What is the Median Household income in Sadler?
Median Household Income in Sadler is $48,625.
What is Income or Wage Gap in Sadler?
Income or Wage Gap in Sadler is 15.9%.
Women in Sadler earn 84.1 cents for every dollar earned by a man.
What is Inequality or Gini Index in Sadler?
Inequality or Gini Index in Sadler is 0.33.
What is the Total Population of Sadler?
Total Population of Sadler is 330.
What is the Total Male Population of Sadler?
Total Male Population of Sadler is 169.
What is the Total Female Population of Sadler?
Total Female Population of Sadler is 161.
What is the Ratio of Males per 100 Females in Sadler?
There are 104.97 Males per 100 Females in Sadler.
What is the Ratio of Females per 100 Males in Sadler?
There are 95.27 Females per 100 Males in Sadler.
What is the Median Population Age in Sadler?
Median Population Age in Sadler is 43.7 Years.
What is the Average Family Size in Sadler
Average Family Size in Sadler is 3.0 People.
What is the Average Household Size in Sadler
Average Household Size in Sadler is 2.2 People.
How Large is the Labor Force in Sadler?
There are 176 People in the Labor Forcein in Sadler.
What is the Percentage of People in the Labor Force in Sadler?
61.5% of People are in the Labor Force in Sadler.