Zip Codes with the Highest Percentage of Population Employed in Office & Administration in Denison, TX
RELATED REPORTS & OPTIONS
Office & Administration
Denison
Compare Zip Codes
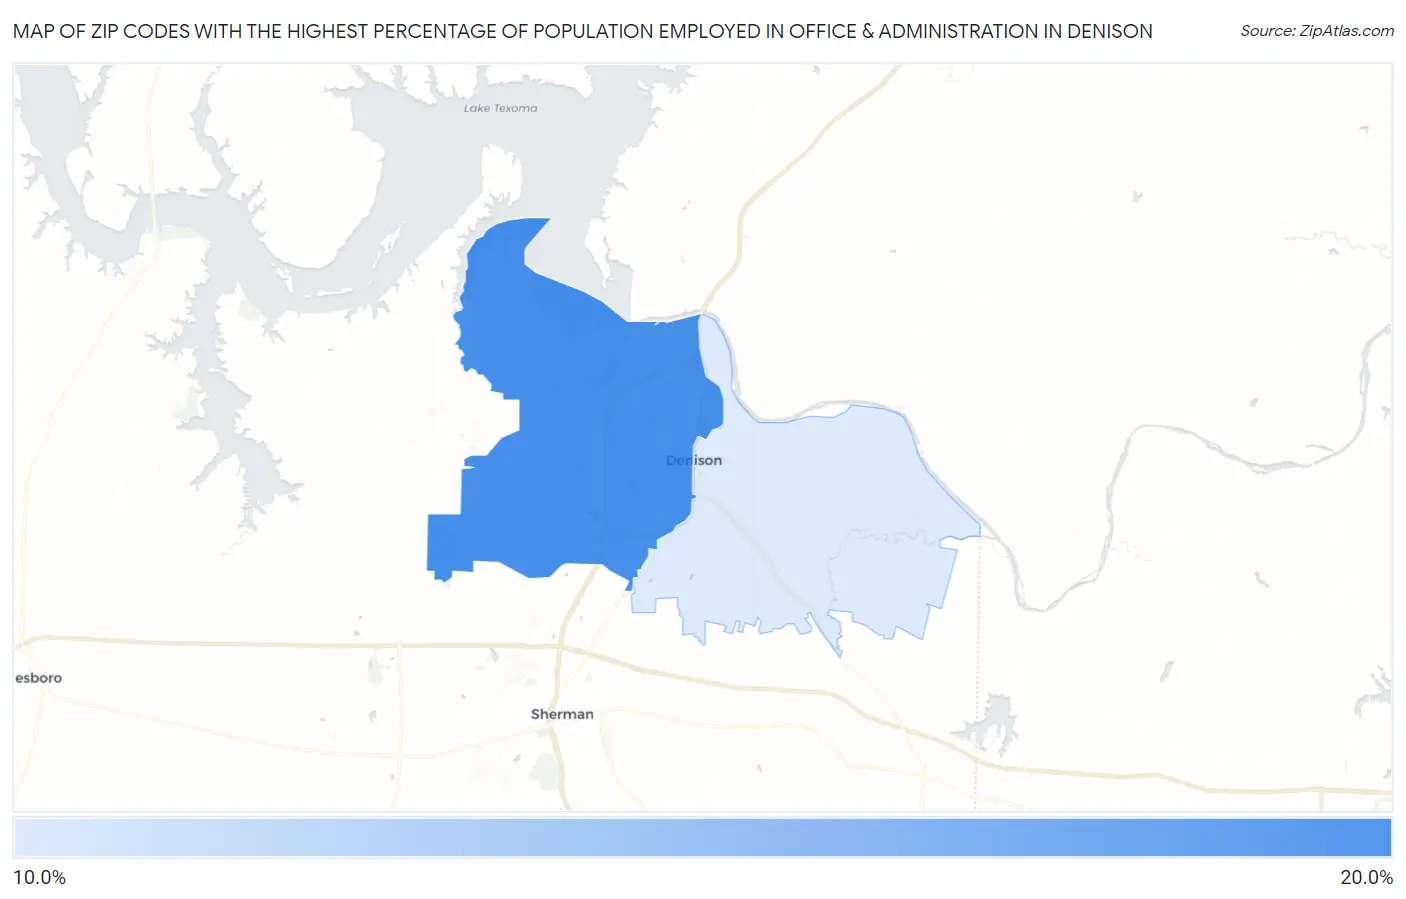
Map of Zip Codes with the Highest Percentage of Population Employed in Office & Administration in Denison
12.6%
15.1%
Zip Codes with the Highest Percentage of Population Employed in Office & Administration in Denison, TX
| Zip Code | % Employed | vs State | vs National | |
| 1. | 75020 | 15.1% | 11.0%(+4.08)#267 | 10.9%(+4.20)#4,497 |
| 2. | 75021 | 12.6% | 11.0%(+1.60)#573 | 10.9%(+1.71)#9,106 |
1
Common Questions
What are the Top Zip Codes with the Highest Percentage of Population Employed in Office & Administration in Denison, TX?
Top Zip Codes with the Highest Percentage of Population Employed in Office & Administration in Denison, TX are:
What zip code has the Highest Percentage of Population Employed in Office & Administration in Denison, TX?
75020 has the Highest Percentage of Population Employed in Office & Administration in Denison, TX with 15.1%.
What is the Percentage of Population Employed in Office & Administration in Denison, TX?
Percentage of Population Employed in Office & Administration in Denison is 14.7%.
What is the Percentage of Population Employed in Office & Administration in Texas?
Percentage of Population Employed in Office & Administration in Texas is 11.0%.
What is the Percentage of Population Employed in Office & Administration in the United States?
Percentage of Population Employed in Office & Administration in the United States is 10.9%.