Zip Codes with the Highest Percentage of Population Employed in Office & Administration in El Paso, TX
RELATED REPORTS & OPTIONS
Office & Administration
El Paso
Compare Zip Codes
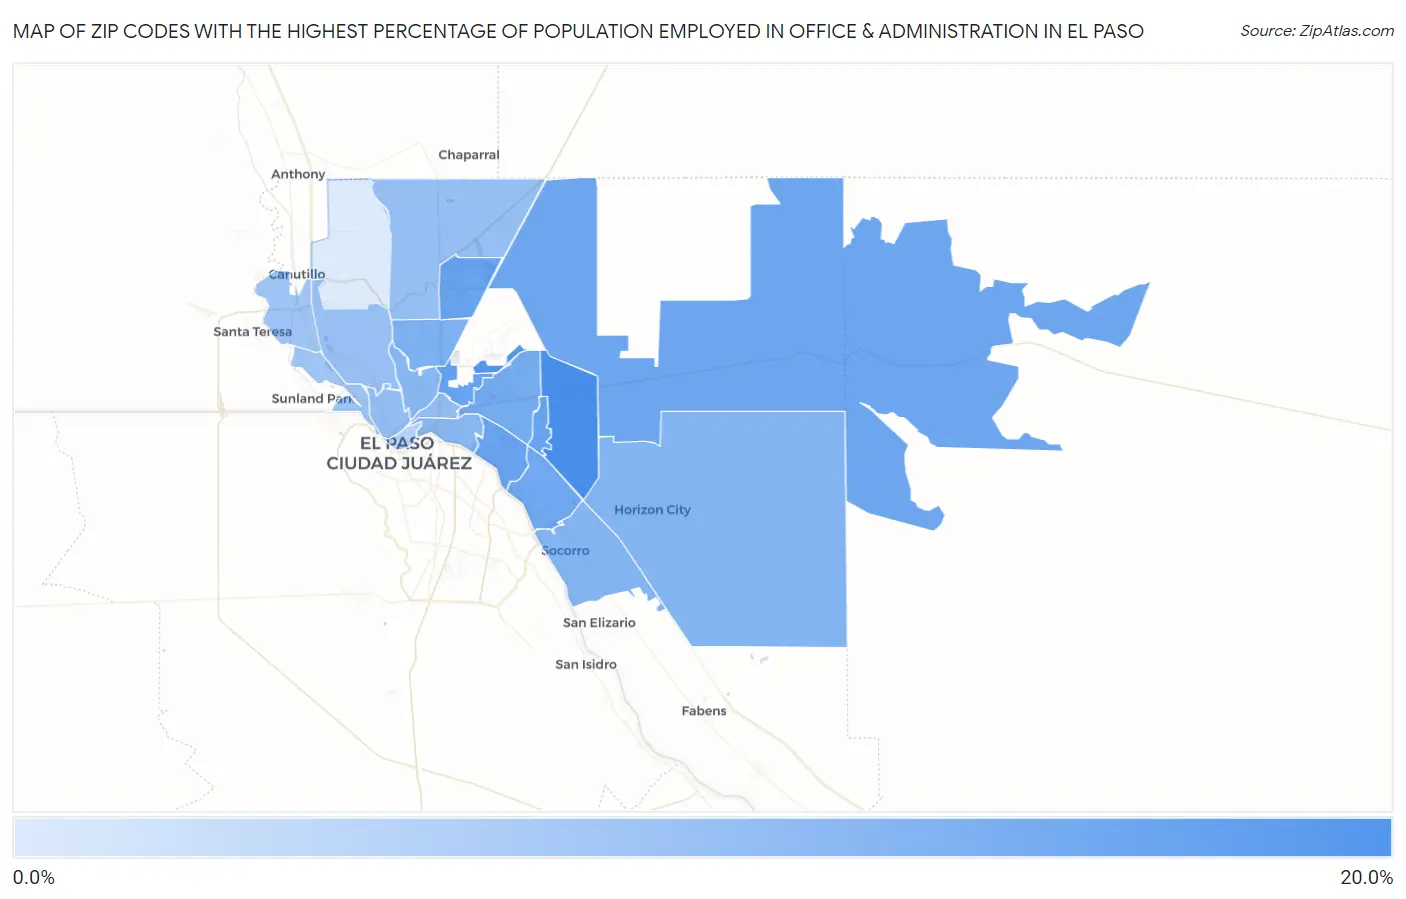
Map of Zip Codes with the Highest Percentage of Population Employed in Office & Administration in El Paso
4.8%
16.5%
Zip Codes with the Highest Percentage of Population Employed in Office & Administration in El Paso, TX
| Zip Code | % Employed | vs State | vs National | |
| 1. | 79936 | 16.5% | 11.0%(+5.56)#185 | 10.9%(+5.68)#3,146 |
| 2. | 79908 | 15.7% | 11.0%(+4.69)#219 | 10.9%(+4.81)#3,867 |
| 3. | 79906 | 14.0% | 11.0%(+3.05)#371 | 10.9%(+3.16)#5,986 |
| 4. | 79915 | 14.0% | 11.0%(+3.01)#376 | 10.9%(+3.13)#6,042 |
| 5. | 79924 | 13.9% | 11.0%(+2.94)#383 | 10.9%(+3.05)#6,173 |
| 6. | 79935 | 13.8% | 11.0%(+2.80)#398 | 10.9%(+2.91)#6,425 |
| 7. | 79938 | 13.3% | 11.0%(+2.35)#455 | 10.9%(+2.46)#7,339 |
| 8. | 79907 | 13.1% | 11.0%(+2.11)#494 | 10.9%(+2.23)#7,870 |
| 9. | 79925 | 12.9% | 11.0%(+1.88)#524 | 10.9%(+1.99)#8,420 |
| 10. | 79904 | 12.3% | 11.0%(+1.30)#616 | 10.9%(+1.42)#9,915 |
| 11. | 79928 | 11.7% | 11.0%(+0.692)#706 | 10.9%(+0.807)#11,744 |
| 12. | 79927 | 11.6% | 11.0%(+0.660)#708 | 10.9%(+0.775)#11,844 |
| 13. | 79930 | 11.3% | 11.0%(+0.325)#767 | 10.9%(+0.440)#12,888 |
| 14. | 79905 | 11.1% | 11.0%(+0.095)#813 | 10.9%(+0.210)#13,638 |
| 15. | 79903 | 10.7% | 11.0%(-0.309)#891 | 10.9%(-0.194)#14,929 |
| 16. | 79902 | 10.5% | 11.0%(-0.500)#934 | 10.9%(-0.385)#15,581 |
| 17. | 79934 | 10.3% | 11.0%(-0.689)#976 | 10.9%(-0.574)#16,222 |
| 18. | 79912 | 10.1% | 11.0%(-0.857)#1,012 | 10.9%(-0.742)#16,749 |
| 19. | 79932 | 9.5% | 11.0%(-1.47)#1,146 | 10.9%(-1.35)#18,728 |
| 20. | 79922 | 9.5% | 11.0%(-1.48)#1,149 | 10.9%(-1.36)#18,780 |
| 21. | 79901 | 7.6% | 11.0%(-3.39)#1,428 | 10.9%(-3.27)#23,963 |
| 22. | 79911 | 4.8% | 11.0%(-6.19)#1,648 | 10.9%(-6.07)#28,275 |
1
Common Questions
What are the Top 10 Zip Codes with the Highest Percentage of Population Employed in Office & Administration in El Paso, TX?
Top 10 Zip Codes with the Highest Percentage of Population Employed in Office & Administration in El Paso, TX are:
What zip code has the Highest Percentage of Population Employed in Office & Administration in El Paso, TX?
79936 has the Highest Percentage of Population Employed in Office & Administration in El Paso, TX with 16.5%.
What is the Percentage of Population Employed in Office & Administration in El Paso, TX?
Percentage of Population Employed in Office & Administration in El Paso is 12.6%.
What is the Percentage of Population Employed in Office & Administration in Texas?
Percentage of Population Employed in Office & Administration in Texas is 11.0%.
What is the Percentage of Population Employed in Office & Administration in the United States?
Percentage of Population Employed in Office & Administration in the United States is 10.9%.