Zip Codes with the Highest Percentage of Population Employed in Office & Administration in San Angelo, TX
RELATED REPORTS & OPTIONS
Office & Administration
San Angelo
Compare Zip Codes
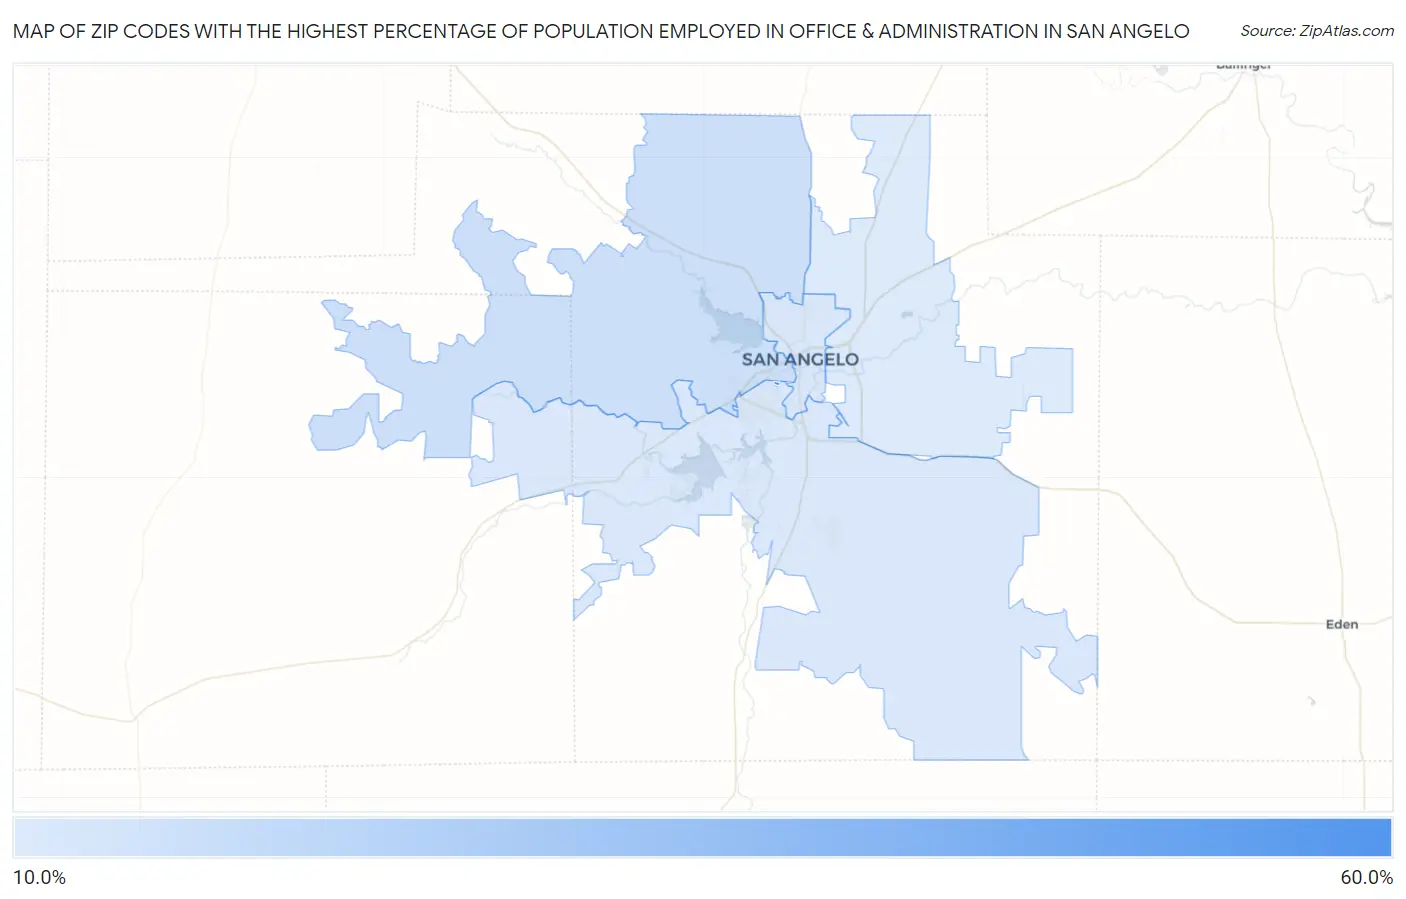
Map of Zip Codes with the Highest Percentage of Population Employed in Office & Administration in San Angelo
12.2%
51.9%
Zip Codes with the Highest Percentage of Population Employed in Office & Administration in San Angelo, TX
| Zip Code | % Employed | vs State | vs National | |
| 1. | 76909 | 51.9% | 11.0%(+40.9)#13 | 10.9%(+41.1)#115 |
| 2. | 76901 | 15.8% | 11.0%(+4.78)#209 | 10.9%(+4.90)#3,773 |
| 3. | 76903 | 13.4% | 11.0%(+2.42)#448 | 10.9%(+2.53)#7,170 |
| 4. | 76904 | 12.8% | 11.0%(+1.81)#539 | 10.9%(+1.93)#8,574 |
| 5. | 76905 | 12.2% | 11.0%(+1.18)#631 | 10.9%(+1.30)#10,268 |
1
Common Questions
What are the Top 3 Zip Codes with the Highest Percentage of Population Employed in Office & Administration in San Angelo, TX?
Top 3 Zip Codes with the Highest Percentage of Population Employed in Office & Administration in San Angelo, TX are:
What zip code has the Highest Percentage of Population Employed in Office & Administration in San Angelo, TX?
76909 has the Highest Percentage of Population Employed in Office & Administration in San Angelo, TX with 51.9%.
What is the Percentage of Population Employed in Office & Administration in San Angelo, TX?
Percentage of Population Employed in Office & Administration in San Angelo is 14.2%.
What is the Percentage of Population Employed in Office & Administration in Texas?
Percentage of Population Employed in Office & Administration in Texas is 11.0%.
What is the Percentage of Population Employed in Office & Administration in the United States?
Percentage of Population Employed in Office & Administration in the United States is 10.9%.