Zip Codes with the Highest Percentage of Population Employed in Office & Administration in Spring, TX
RELATED REPORTS & OPTIONS
Office & Administration
Spring
Compare Zip Codes
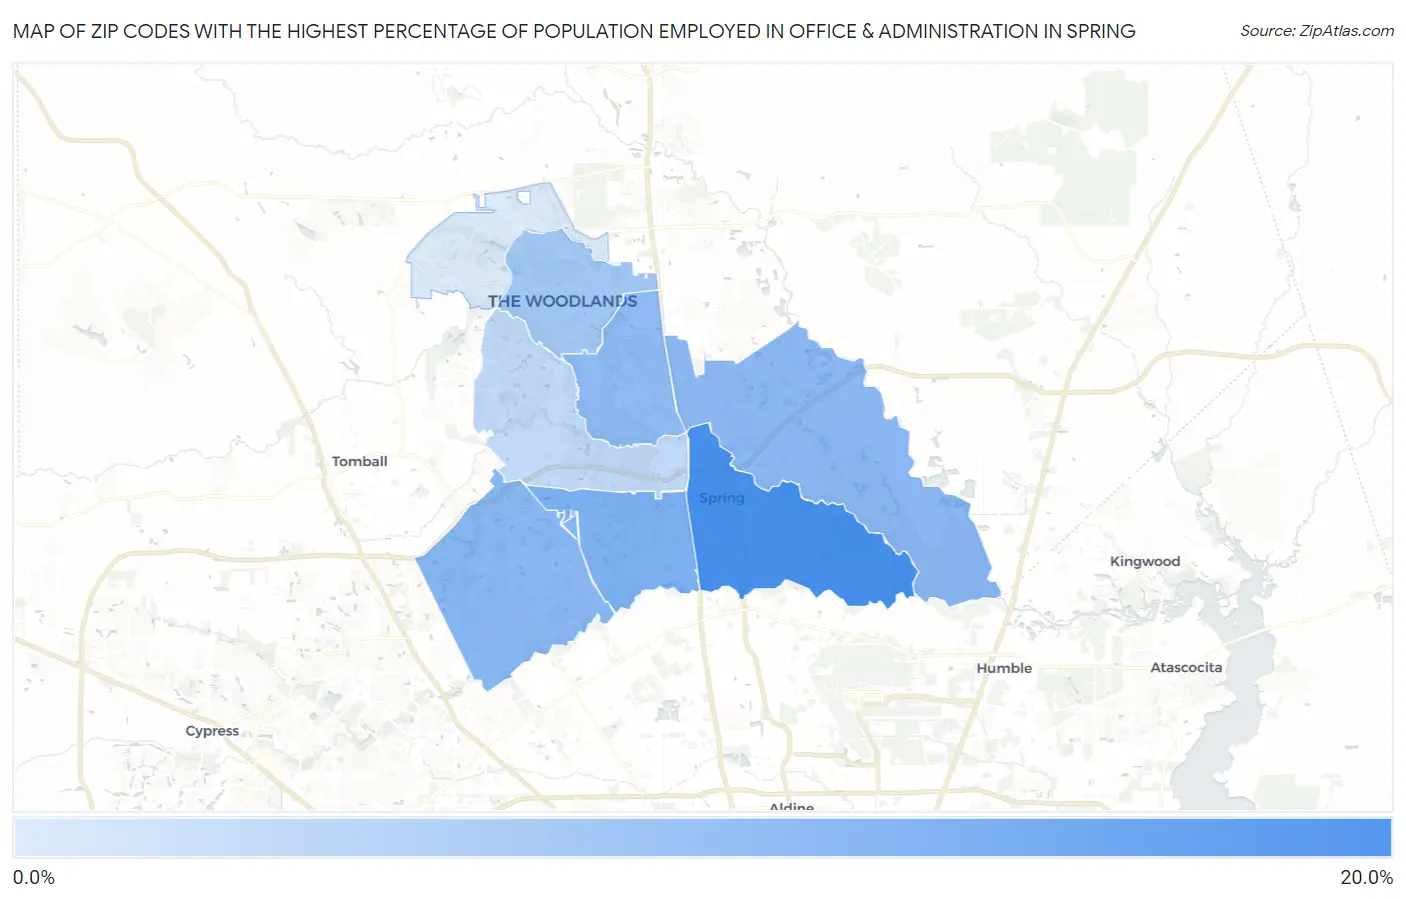
Map of Zip Codes with the Highest Percentage of Population Employed in Office & Administration in Spring
5.3%
15.0%
Zip Codes with the Highest Percentage of Population Employed in Office & Administration in Spring, TX
| Zip Code | % Employed | vs State | vs National | |
| 1. | 77373 | 15.0% | 11.0%(+4.06)#269 | 10.9%(+4.18)#4,521 |
| 2. | 77388 | 11.5% | 11.0%(+0.548)#726 | 10.9%(+0.664)#12,198 |
| 3. | 77379 | 10.8% | 11.0%(-0.175)#876 | 10.9%(-0.060)#14,518 |
| 4. | 77386 | 10.6% | 11.0%(-0.399)#910 | 10.9%(-0.284)#15,226 |
| 5. | 77380 | 10.3% | 11.0%(-0.711)#979 | 10.9%(-0.596)#16,296 |
| 6. | 77381 | 8.9% | 11.0%(-2.05)#1,230 | 10.9%(-1.93)#20,483 |
| 7. | 77389 | 7.1% | 11.0%(-3.91)#1,484 | 10.9%(-3.79)#25,096 |
| 8. | 77382 | 5.3% | 11.0%(-5.66)#1,623 | 10.9%(-5.55)#27,774 |
1
Common Questions
What are the Top 5 Zip Codes with the Highest Percentage of Population Employed in Office & Administration in Spring, TX?
Top 5 Zip Codes with the Highest Percentage of Population Employed in Office & Administration in Spring, TX are:
What zip code has the Highest Percentage of Population Employed in Office & Administration in Spring, TX?
77373 has the Highest Percentage of Population Employed in Office & Administration in Spring, TX with 15.0%.
What is the Percentage of Population Employed in Office & Administration in Spring, TX?
Percentage of Population Employed in Office & Administration in Spring is 14.7%.
What is the Percentage of Population Employed in Office & Administration in Texas?
Percentage of Population Employed in Office & Administration in Texas is 11.0%.
What is the Percentage of Population Employed in Office & Administration in the United States?
Percentage of Population Employed in Office & Administration in the United States is 10.9%.