Zip Codes with the Highest Percentage of Population Employed in Office & Administration in Denton, TX
RELATED REPORTS & OPTIONS
Office & Administration
Denton
Compare Zip Codes
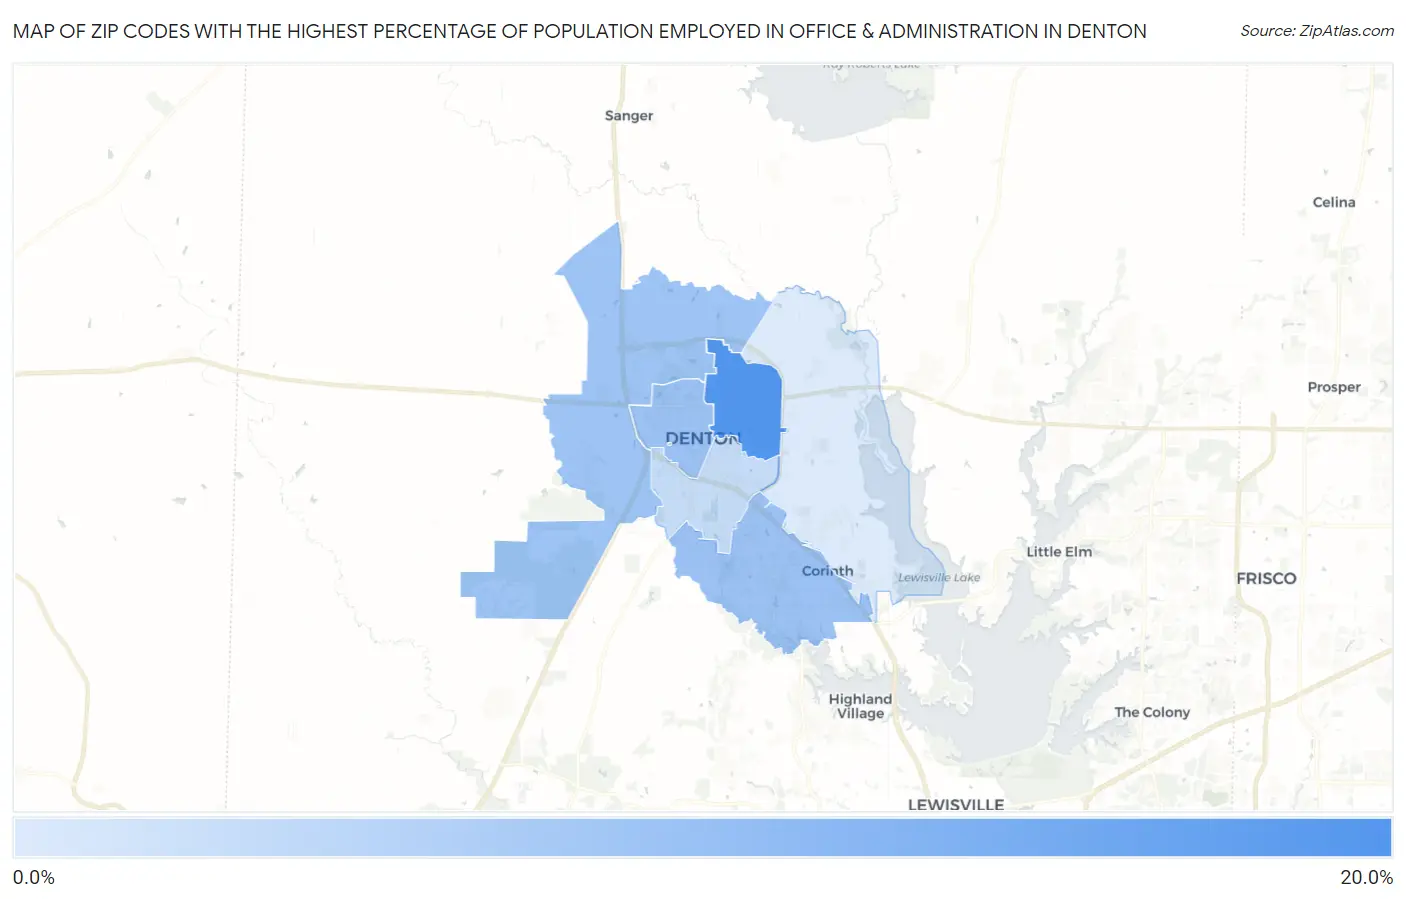
Map of Zip Codes with the Highest Percentage of Population Employed in Office & Administration in Denton
8.8%
15.5%
Zip Codes with the Highest Percentage of Population Employed in Office & Administration in Denton, TX
| Zip Code | % Employed | vs State | vs National | |
| 1. | 76203 | 15.5% | 11.0%(+4.48)#233 | 10.9%(+4.60)#4,052 |
| 2. | 76209 | 14.9% | 11.0%(+3.93)#281 | 10.9%(+4.05)#4,692 |
| 3. | 76201 | 11.7% | 11.0%(+0.760)#694 | 10.9%(+0.875)#11,542 |
| 4. | 76210 | 11.7% | 11.0%(+0.709)#702 | 10.9%(+0.824)#11,685 |
| 5. | 76207 | 11.5% | 11.0%(+0.524)#731 | 10.9%(+0.639)#12,251 |
| 6. | 76205 | 9.7% | 11.0%(-1.25)#1,102 | 10.9%(-1.14)#17,993 |
| 7. | 76208 | 8.8% | 11.0%(-2.22)#1,259 | 10.9%(-2.10)#20,976 |
1
Common Questions
What are the Top 5 Zip Codes with the Highest Percentage of Population Employed in Office & Administration in Denton, TX?
Top 5 Zip Codes with the Highest Percentage of Population Employed in Office & Administration in Denton, TX are:
What zip code has the Highest Percentage of Population Employed in Office & Administration in Denton, TX?
76203 has the Highest Percentage of Population Employed in Office & Administration in Denton, TX with 15.5%.
What is the Percentage of Population Employed in Office & Administration in Denton, TX?
Percentage of Population Employed in Office & Administration in Denton is 11.6%.
What is the Percentage of Population Employed in Office & Administration in Texas?
Percentage of Population Employed in Office & Administration in Texas is 11.0%.
What is the Percentage of Population Employed in Office & Administration in the United States?
Percentage of Population Employed in Office & Administration in the United States is 10.9%.