Zip Codes with the Highest Percentage of Population Employed in Accommodation & Food Services in Morristown, TN
RELATED REPORTS & OPTIONS
Accommodation & Food Services
Morristown
Compare Zip Codes
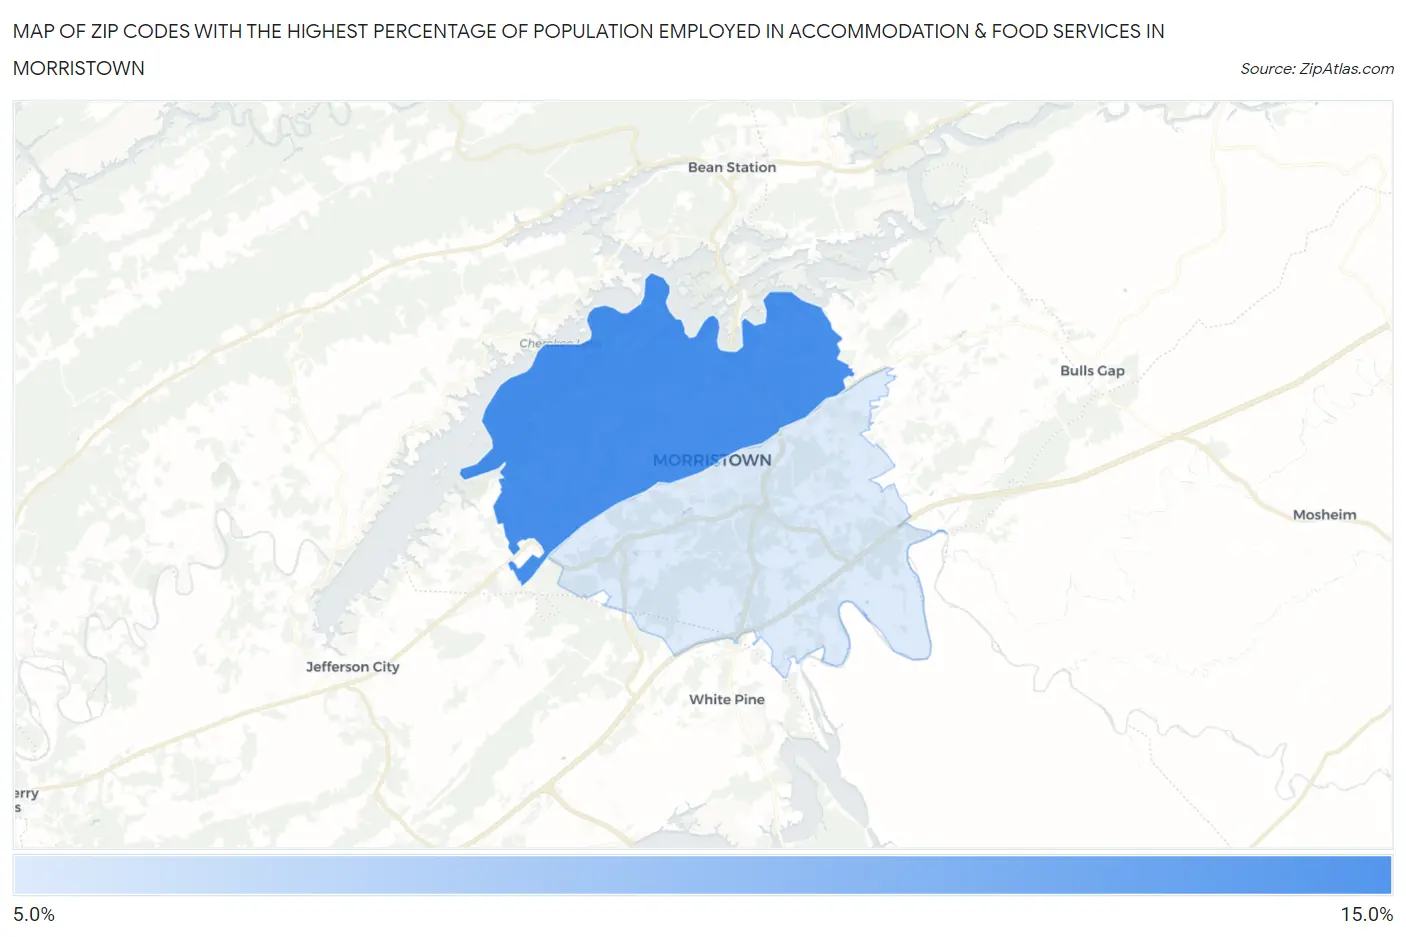
Map of Zip Codes with the Highest Percentage of Population Employed in Accommodation & Food Services in Morristown
11.3%
12.6%
Zip Codes with the Highest Percentage of Population Employed in Accommodation & Food Services in Morristown, TN
| Zip Code | % Employed | vs State | vs National | |
| 1. | 37814 | 12.6% | 7.4%(+5.18)#41 | 6.9%(+5.69)#2,550 |
| 2. | 37813 | 11.3% | 7.4%(+3.90)#66 | 6.9%(+4.41)#3,331 |
1
Common Questions
What are the Top Zip Codes with the Highest Percentage of Population Employed in Accommodation & Food Services in Morristown, TN?
Top Zip Codes with the Highest Percentage of Population Employed in Accommodation & Food Services in Morristown, TN are:
What zip code has the Highest Percentage of Population Employed in Accommodation & Food Services in Morristown, TN?
37814 has the Highest Percentage of Population Employed in Accommodation & Food Services in Morristown, TN with 12.6%.
What is the Percentage of Population Employed in Accommodation & Food Services in Morristown, TN?
Percentage of Population Employed in Accommodation & Food Services in Morristown is 18.4%.
What is the Percentage of Population Employed in Accommodation & Food Services in Tennessee?
Percentage of Population Employed in Accommodation & Food Services in Tennessee is 7.4%.
What is the Percentage of Population Employed in Accommodation & Food Services in the United States?
Percentage of Population Employed in Accommodation & Food Services in the United States is 6.9%.