Zip Codes with the Highest Percentage of Population Employed in Accommodation & Food Services in Sevierville, TN
RELATED REPORTS & OPTIONS
Accommodation & Food Services
Sevierville
Compare Zip Codes
Map of Zip Codes with the Highest Percentage of Population Employed in Accommodation & Food Services in Sevierville
11.7%
21.3%
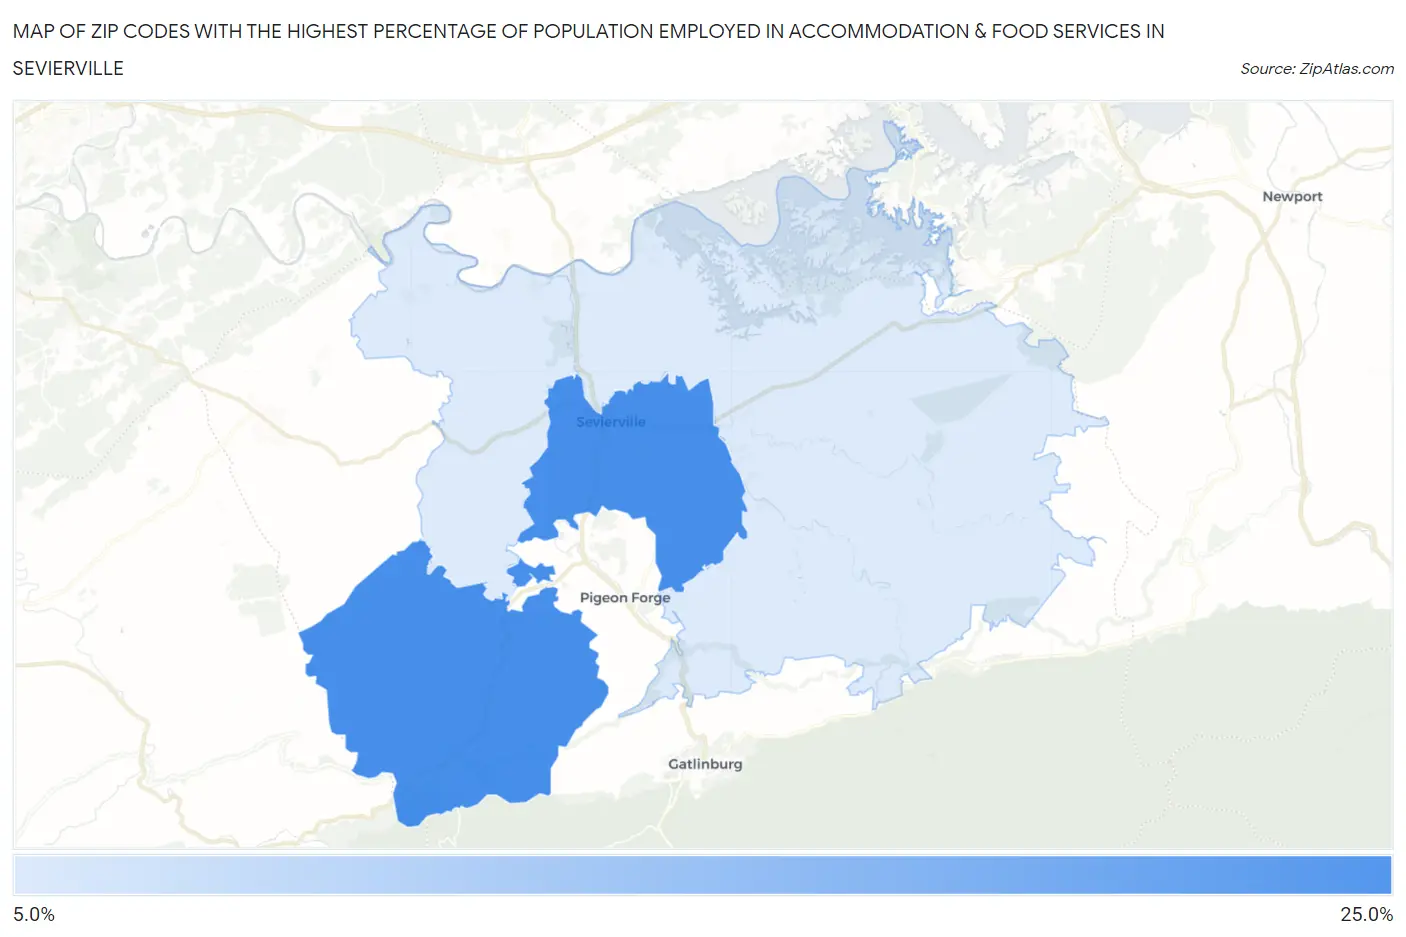
Zip Codes with the Highest Percentage of Population Employed in Accommodation & Food Services in Sevierville, TN
| Zip Code | % Employed | vs State | vs National | |
| 1. | 37862 | 21.3% | 7.4%(+13.9)#12 | 6.9%(+14.4)#724 |
| 2. | 37876 | 11.7% | 7.4%(+4.29)#56 | 6.9%(+4.80)#3,030 |
1
Common Questions
What are the Top Zip Codes with the Highest Percentage of Population Employed in Accommodation & Food Services in Sevierville, TN?
Top Zip Codes with the Highest Percentage of Population Employed in Accommodation & Food Services in Sevierville, TN are:
What zip code has the Highest Percentage of Population Employed in Accommodation & Food Services in Sevierville, TN?
37862 has the Highest Percentage of Population Employed in Accommodation & Food Services in Sevierville, TN with 21.3%.
What is the Percentage of Population Employed in Accommodation & Food Services in Sevierville, TN?
Percentage of Population Employed in Accommodation & Food Services in Sevierville is 26.5%.
What is the Percentage of Population Employed in Accommodation & Food Services in Tennessee?
Percentage of Population Employed in Accommodation & Food Services in Tennessee is 7.4%.
What is the Percentage of Population Employed in Accommodation & Food Services in the United States?
Percentage of Population Employed in Accommodation & Food Services in the United States is 6.9%.