Zip Codes with the Highest Percentage of Population Employed in Accommodation & Food Services in Greeneville, TN
RELATED REPORTS & OPTIONS
Accommodation & Food Services
Greeneville
Compare Zip Codes
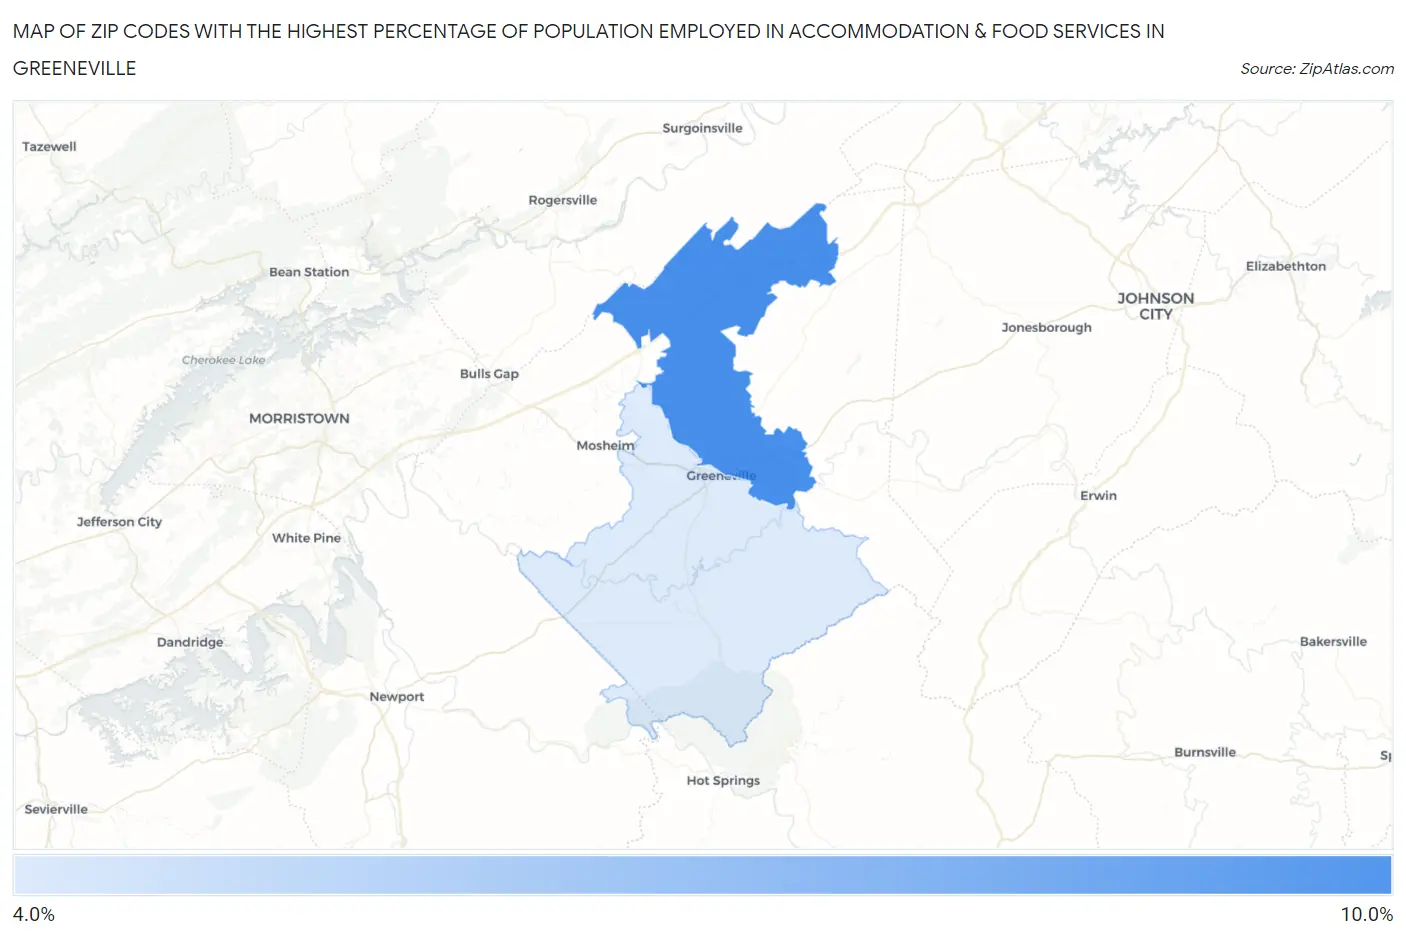
Map of Zip Codes with the Highest Percentage of Population Employed in Accommodation & Food Services in Greeneville
4.8%
8.3%
Zip Codes with the Highest Percentage of Population Employed in Accommodation & Food Services in Greeneville, TN
| Zip Code | % Employed | vs State | vs National | |
| 1. | 37745 | 8.3% | 7.4%(+0.884)#152 | 6.9%(+1.39)#7,267 |
| 2. | 37743 | 4.8% | 7.4%(-2.55)#362 | 6.9%(-2.04)#17,334 |
1
Common Questions
What are the Top Zip Codes with the Highest Percentage of Population Employed in Accommodation & Food Services in Greeneville, TN?
Top Zip Codes with the Highest Percentage of Population Employed in Accommodation & Food Services in Greeneville, TN are:
What zip code has the Highest Percentage of Population Employed in Accommodation & Food Services in Greeneville, TN?
37745 has the Highest Percentage of Population Employed in Accommodation & Food Services in Greeneville, TN with 8.3%.
What is the Percentage of Population Employed in Accommodation & Food Services in Greeneville, TN?
Percentage of Population Employed in Accommodation & Food Services in Greeneville is 7.5%.
What is the Percentage of Population Employed in Accommodation & Food Services in Tennessee?
Percentage of Population Employed in Accommodation & Food Services in Tennessee is 7.4%.
What is the Percentage of Population Employed in Accommodation & Food Services in the United States?
Percentage of Population Employed in Accommodation & Food Services in the United States is 6.9%.