Zip Codes with the Highest Percentage of Population Employed in Accommodation & Food Services in Crossville, TN
RELATED REPORTS & OPTIONS
Accommodation & Food Services
Crossville
Compare Zip Codes
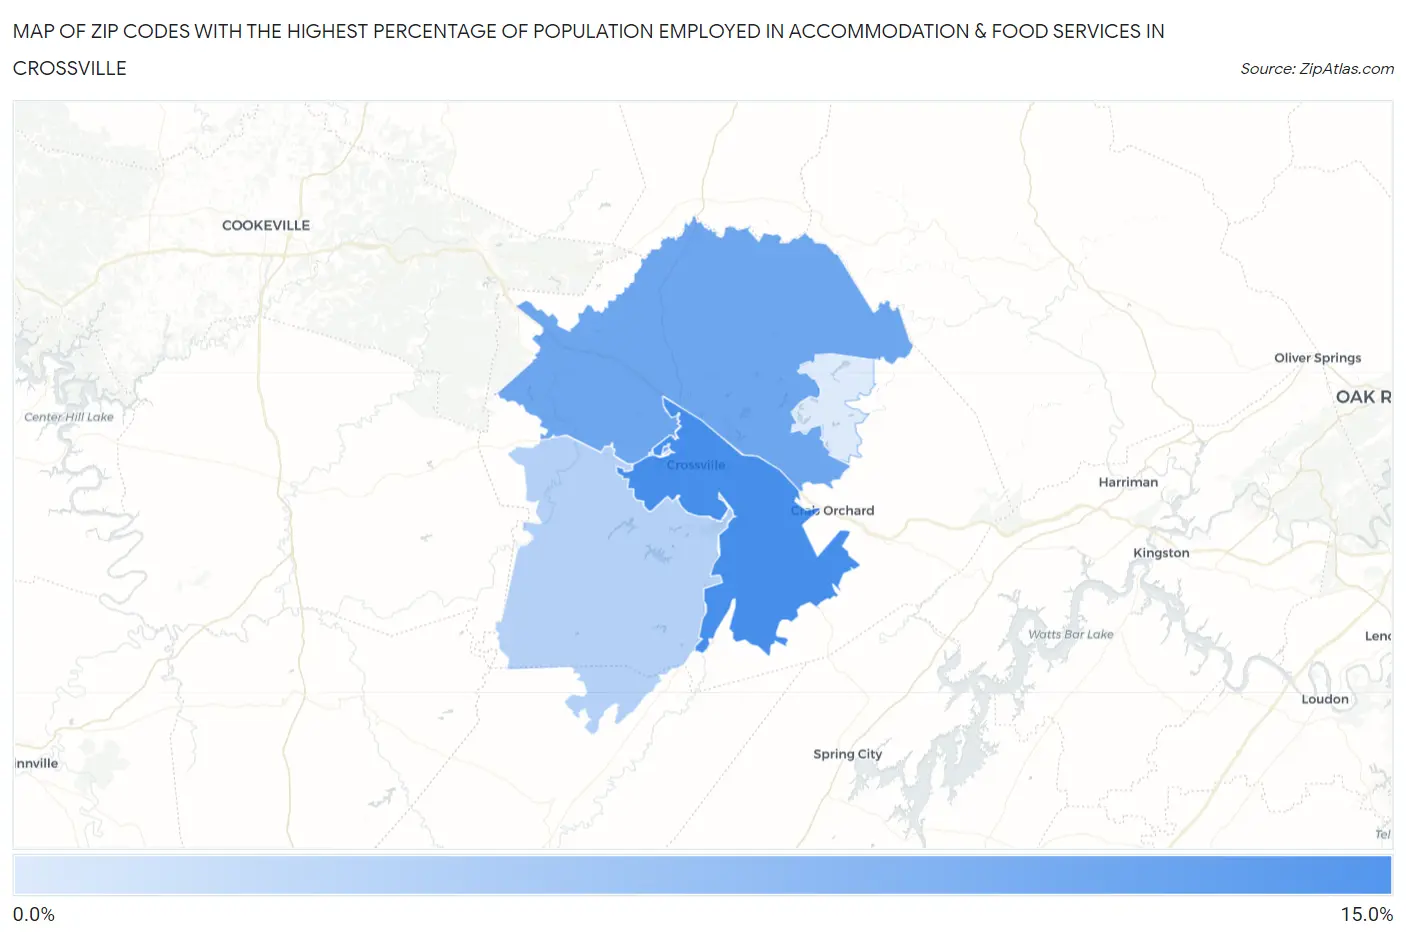
Map of Zip Codes with the Highest Percentage of Population Employed in Accommodation & Food Services in Crossville
3.0%
10.3%
Zip Codes with the Highest Percentage of Population Employed in Accommodation & Food Services in Crossville, TN
| Zip Code | % Employed | vs State | vs National | |
| 1. | 38555 | 10.3% | 7.4%(+2.96)#84 | 6.9%(+3.47)#4,150 |
| 2. | 38571 | 8.4% | 7.4%(+0.972)#147 | 6.9%(+1.48)#7,068 |
| 3. | 38572 | 5.0% | 7.4%(-2.37)#355 | 6.9%(-1.86)#16,748 |
| 4. | 38558 | 3.0% | 7.4%(-4.37)#478 | 6.9%(-3.86)#23,162 |
1
Common Questions
What are the Top 3 Zip Codes with the Highest Percentage of Population Employed in Accommodation & Food Services in Crossville, TN?
Top 3 Zip Codes with the Highest Percentage of Population Employed in Accommodation & Food Services in Crossville, TN are:
What zip code has the Highest Percentage of Population Employed in Accommodation & Food Services in Crossville, TN?
38555 has the Highest Percentage of Population Employed in Accommodation & Food Services in Crossville, TN with 10.3%.
What is the Percentage of Population Employed in Accommodation & Food Services in Crossville, TN?
Percentage of Population Employed in Accommodation & Food Services in Crossville is 15.2%.
What is the Percentage of Population Employed in Accommodation & Food Services in Tennessee?
Percentage of Population Employed in Accommodation & Food Services in Tennessee is 7.4%.
What is the Percentage of Population Employed in Accommodation & Food Services in the United States?
Percentage of Population Employed in Accommodation & Food Services in the United States is 6.9%.