Zip Codes with the Highest Percentage of Population Employed in Accommodation & Food Services in Maryville, TN
RELATED REPORTS & OPTIONS
Accommodation & Food Services
Maryville
Compare Zip Codes
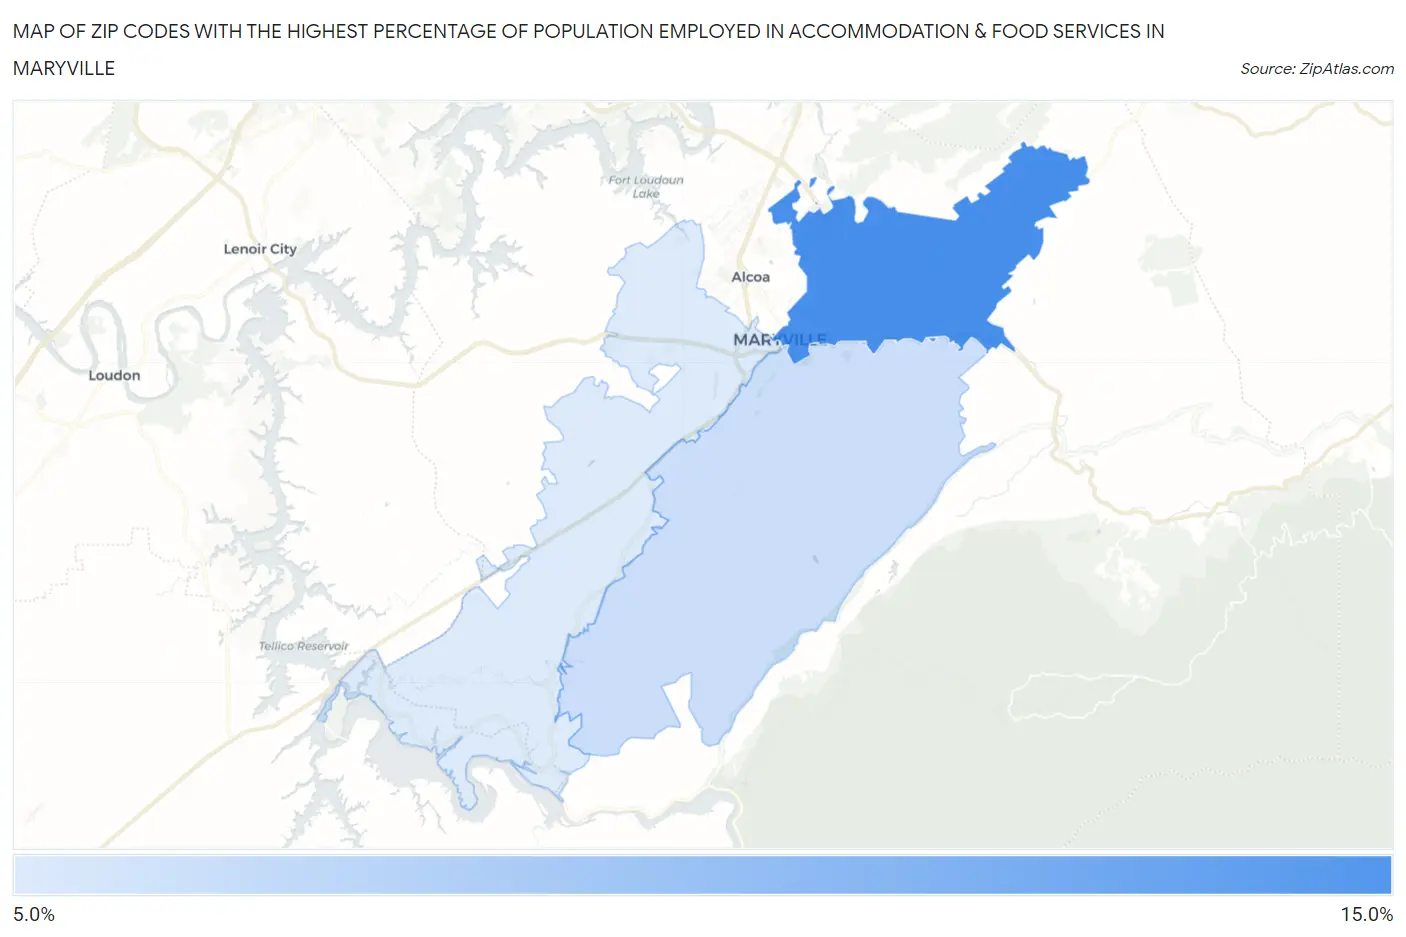
Map of Zip Codes with the Highest Percentage of Population Employed in Accommodation & Food Services in Maryville
6.5%
10.3%
Zip Codes with the Highest Percentage of Population Employed in Accommodation & Food Services in Maryville, TN
| Zip Code | % Employed | vs State | vs National | |
| 1. | 37804 | 10.3% | 7.4%(+2.92)#85 | 6.9%(+3.43)#4,188 |
| 2. | 37803 | 6.9% | 7.4%(-0.459)#238 | 6.9%(+0.051)#10,519 |
| 3. | 37801 | 6.5% | 7.4%(-0.933)#272 | 6.9%(-0.423)#11,978 |
1
Common Questions
What are the Top Zip Codes with the Highest Percentage of Population Employed in Accommodation & Food Services in Maryville, TN?
Top Zip Codes with the Highest Percentage of Population Employed in Accommodation & Food Services in Maryville, TN are:
What zip code has the Highest Percentage of Population Employed in Accommodation & Food Services in Maryville, TN?
37804 has the Highest Percentage of Population Employed in Accommodation & Food Services in Maryville, TN with 10.3%.
What is the Percentage of Population Employed in Accommodation & Food Services in Maryville, TN?
Percentage of Population Employed in Accommodation & Food Services in Maryville is 7.1%.
What is the Percentage of Population Employed in Accommodation & Food Services in Tennessee?
Percentage of Population Employed in Accommodation & Food Services in Tennessee is 7.4%.
What is the Percentage of Population Employed in Accommodation & Food Services in the United States?
Percentage of Population Employed in Accommodation & Food Services in the United States is 6.9%.