Zip Codes with the Highest Percentage of Population Employed in Accommodation & Food Services in Cleveland, TN
RELATED REPORTS & OPTIONS
Accommodation & Food Services
Cleveland
Compare Zip Codes
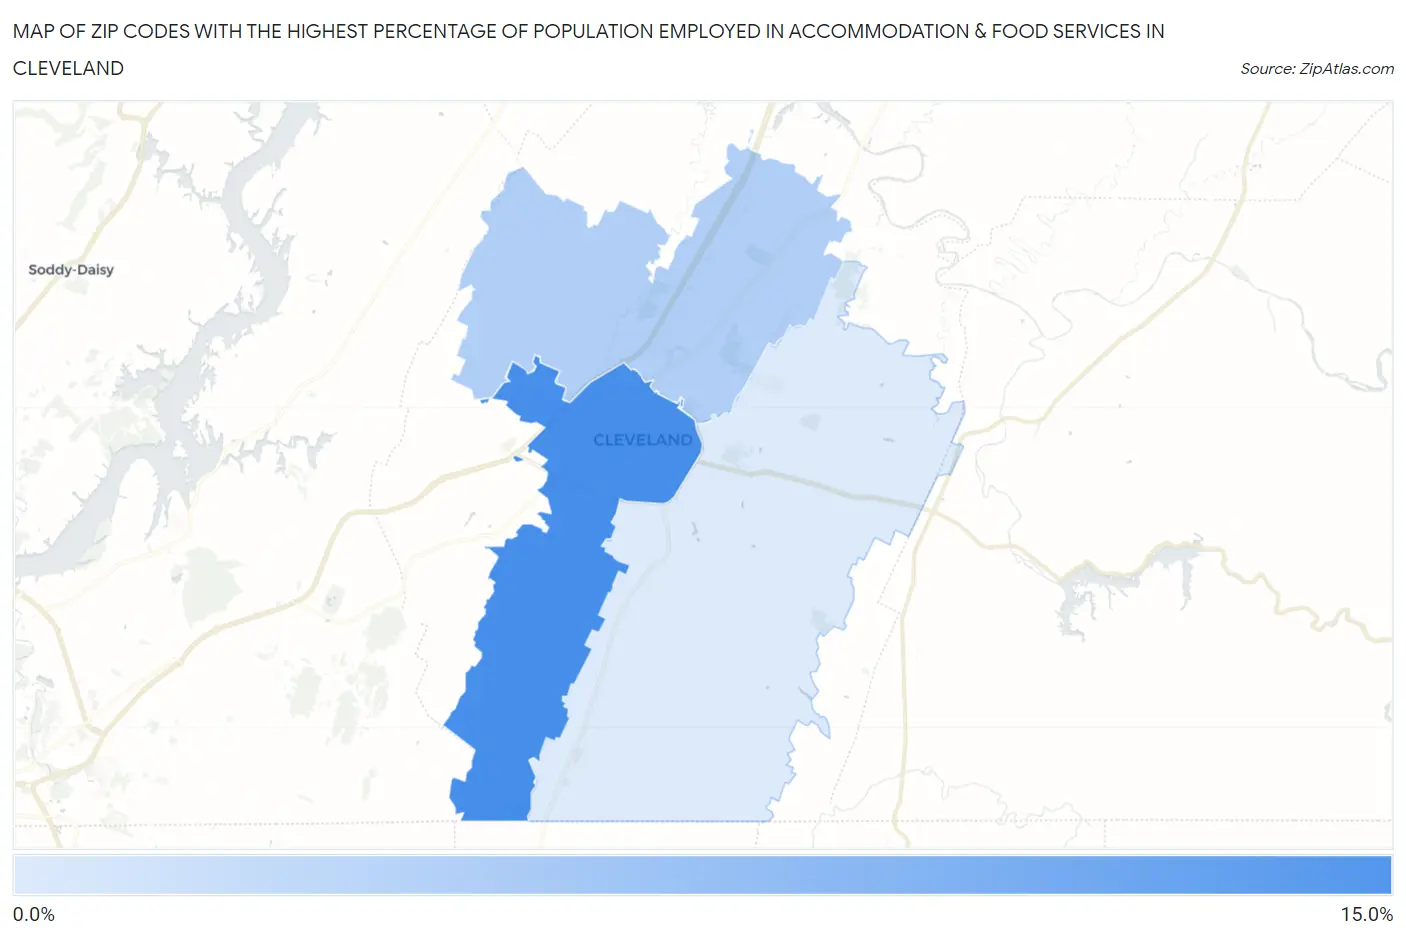
Map of Zip Codes with the Highest Percentage of Population Employed in Accommodation & Food Services in Cleveland
4.6%
10.7%
Zip Codes with the Highest Percentage of Population Employed in Accommodation & Food Services in Cleveland, TN
| Zip Code | % Employed | vs State | vs National | |
| 1. | 37311 | 10.7% | 7.4%(+3.29)#77 | 6.9%(+3.80)#3,816 |
| 2. | 37312 | 6.3% | 7.4%(-1.04)#280 | 6.9%(-0.534)#12,333 |
| 3. | 37323 | 4.6% | 7.4%(-2.82)#384 | 6.9%(-2.31)#18,254 |
1
Common Questions
What are the Top Zip Codes with the Highest Percentage of Population Employed in Accommodation & Food Services in Cleveland, TN?
Top Zip Codes with the Highest Percentage of Population Employed in Accommodation & Food Services in Cleveland, TN are:
What zip code has the Highest Percentage of Population Employed in Accommodation & Food Services in Cleveland, TN?
37311 has the Highest Percentage of Population Employed in Accommodation & Food Services in Cleveland, TN with 10.7%.
What is the Percentage of Population Employed in Accommodation & Food Services in Cleveland, TN?
Percentage of Population Employed in Accommodation & Food Services in Cleveland is 9.7%.
What is the Percentage of Population Employed in Accommodation & Food Services in Tennessee?
Percentage of Population Employed in Accommodation & Food Services in Tennessee is 7.4%.
What is the Percentage of Population Employed in Accommodation & Food Services in the United States?
Percentage of Population Employed in Accommodation & Food Services in the United States is 6.9%.