Zip Codes with the Highest Percentage of Population Employed in Accommodation & Food Services in Cordova, TN
RELATED REPORTS & OPTIONS
Accommodation & Food Services
Cordova
Compare Zip Codes
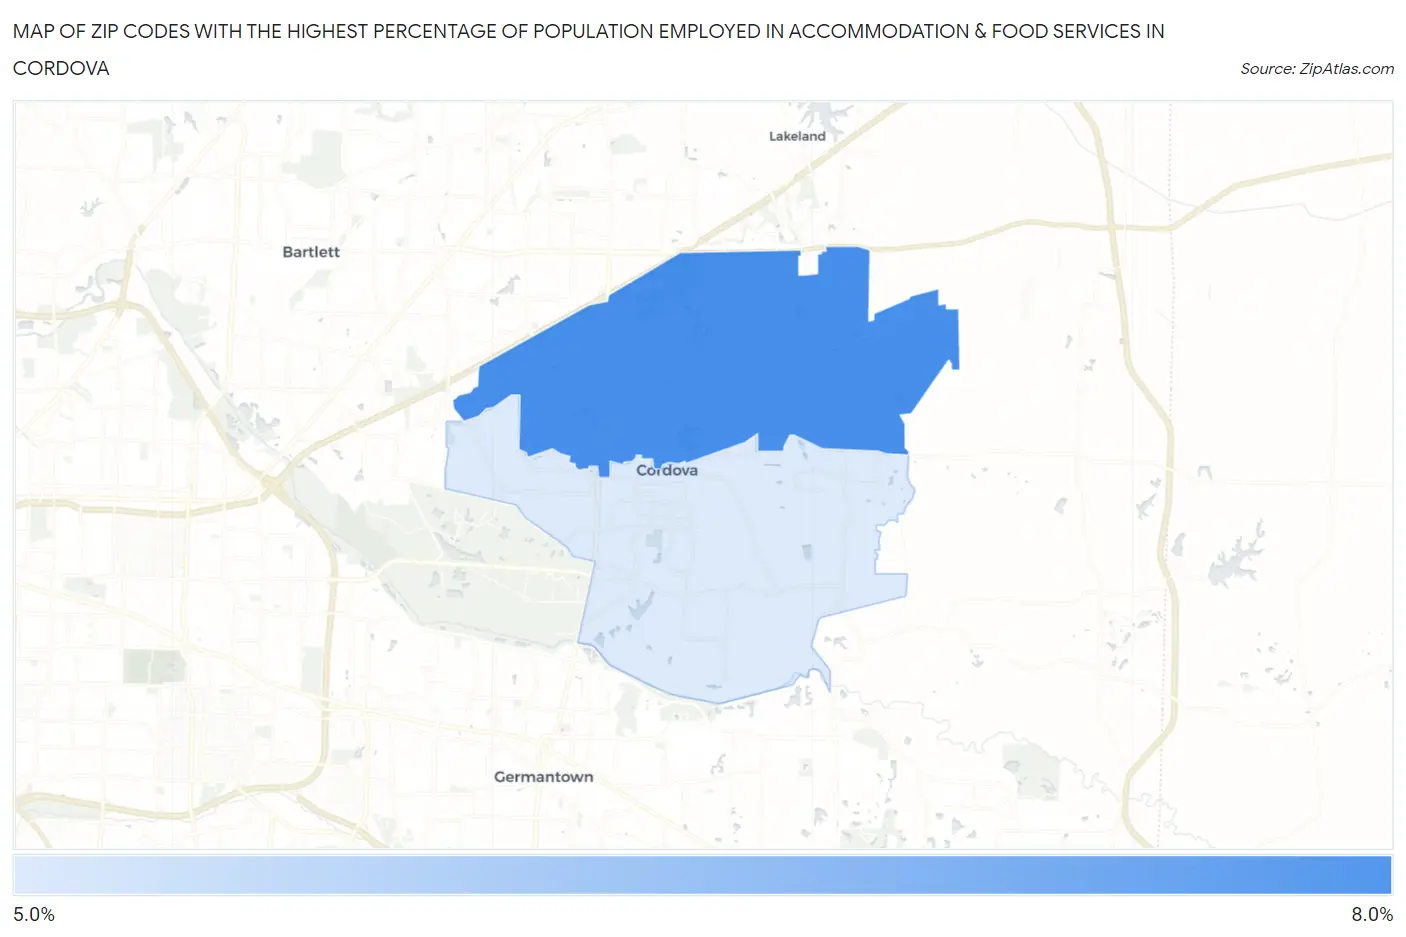
Map of Zip Codes with the Highest Percentage of Population Employed in Accommodation & Food Services in Cordova
5.4%
7.7%
Zip Codes with the Highest Percentage of Population Employed in Accommodation & Food Services in Cordova, TN
| Zip Code | % Employed | vs State | vs National | |
| 1. | 38016 | 7.7% | 7.4%(+0.327)#176 | 6.9%(+0.838)#8,445 |
| 2. | 38018 | 5.4% | 7.4%(-1.95)#327 | 6.9%(-1.44)#15,255 |
1
Common Questions
What are the Top Zip Codes with the Highest Percentage of Population Employed in Accommodation & Food Services in Cordova, TN?
Top Zip Codes with the Highest Percentage of Population Employed in Accommodation & Food Services in Cordova, TN are:
What zip code has the Highest Percentage of Population Employed in Accommodation & Food Services in Cordova, TN?
38016 has the Highest Percentage of Population Employed in Accommodation & Food Services in Cordova, TN with 7.7%.
What is the Percentage of Population Employed in Accommodation & Food Services in Tennessee?
Percentage of Population Employed in Accommodation & Food Services in Tennessee is 7.4%.
What is the Percentage of Population Employed in Accommodation & Food Services in the United States?
Percentage of Population Employed in Accommodation & Food Services in the United States is 6.9%.