Eastview, TN Map & Demographics
Eastview Map
Eastview Overview
$24,670
PER CAPITA INCOME
$66,389
AVG FAMILY INCOME
$55,313
AVG HOUSEHOLD INCOME
37.6%
WAGE / INCOME GAP [ % ]
62.4¢/ $1
WAGE / INCOME GAP [ $ ]
0.38
INEQUALITY / GINI INDEX
835
TOTAL POPULATION
430
MALE POPULATION
405
FEMALE POPULATION
106.17
MALES / 100 FEMALES
94.19
FEMALES / 100 MALES
36.7
MEDIAN AGE
3.3
AVG FAMILY SIZE
2.6
AVG HOUSEHOLD SIZE
387
LABOR FORCE [ PEOPLE ]
63.8%
PERCENT IN LABOR FORCE
7.0%
UNEMPLOYMENT RATE
Eastview Area Codes
Income in Eastview
Income Overview in Eastview
Per Capita Income in Eastview is $24,670, while median incomes of families and households are $66,389 and $55,313 respectively.
| Characteristic | Number | Measure |
| Per Capita Income | 835 | $24,670 |
| Median Family Income | 192 | $66,389 |
| Mean Family Income | 192 | $82,032 |
| Median Household Income | 324 | $55,313 |
| Mean Household Income | 324 | $65,684 |
| Income Deficit | 192 | $0 |
| Wage / Income Gap (%) | 835 | 37.57% |
| Wage / Income Gap ($) | 835 | 62.43¢ per $1 |
| Gini / Inequality Index | 835 | 0.38 |
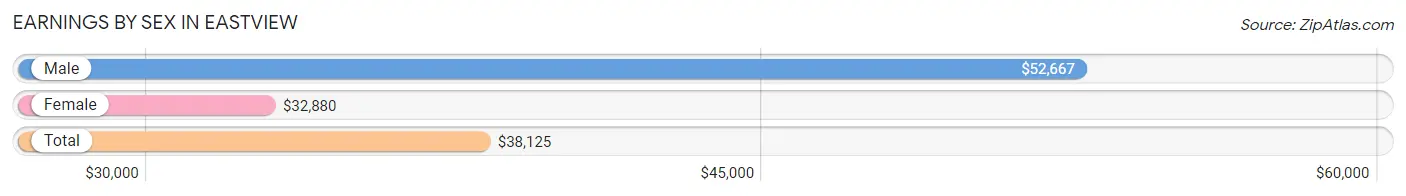
Earnings by Sex in Eastview
Average Earnings in Eastview are $38,125, $52,667 for men and $32,880 for women, a difference of 37.6%.
| Sex | Number | Average Earnings |
| Male | 208 (54.3%) | $52,667 |
| Female | 175 (45.7%) | $32,880 |
| Total | 383 (100.0%) | $38,125 |
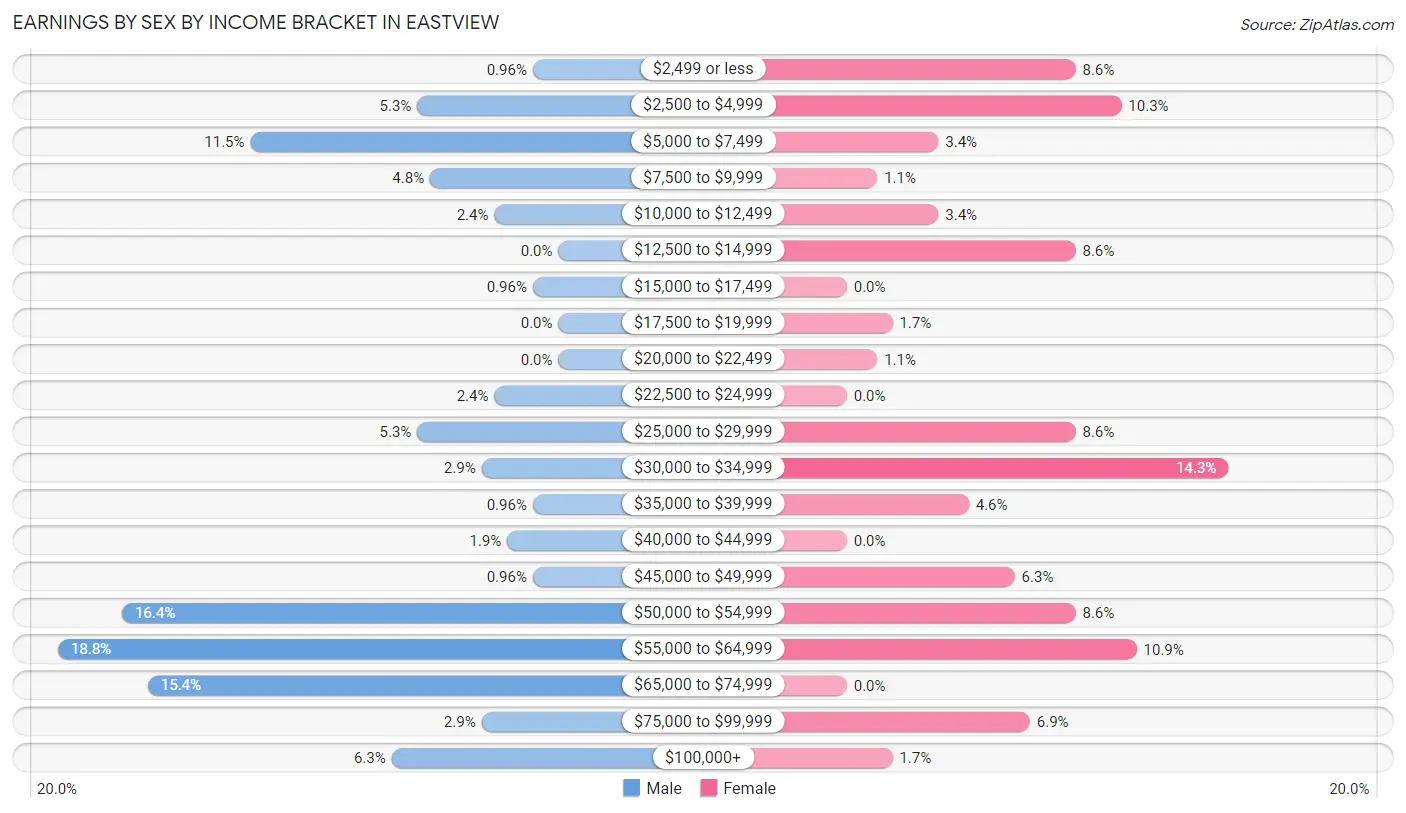
Earnings by Sex by Income Bracket in Eastview
The most common earnings brackets in Eastview are $55,000 to $64,999 for men (39 | 18.8%) and $30,000 to $34,999 for women (25 | 14.3%).
| Income | Male | Female |
| $2,499 or less | 2 (1.0%) | 15 (8.6%) |
| $2,500 to $4,999 | 11 (5.3%) | 18 (10.3%) |
| $5,000 to $7,499 | 24 (11.5%) | 6 (3.4%) |
| $7,500 to $9,999 | 10 (4.8%) | 2 (1.1%) |
| $10,000 to $12,499 | 5 (2.4%) | 6 (3.4%) |
| $12,500 to $14,999 | 0 (0.0%) | 15 (8.6%) |
| $15,000 to $17,499 | 2 (1.0%) | 0 (0.0%) |
| $17,500 to $19,999 | 0 (0.0%) | 3 (1.7%) |
| $20,000 to $22,499 | 0 (0.0%) | 2 (1.1%) |
| $22,500 to $24,999 | 5 (2.4%) | 0 (0.0%) |
| $25,000 to $29,999 | 11 (5.3%) | 15 (8.6%) |
| $30,000 to $34,999 | 6 (2.9%) | 25 (14.3%) |
| $35,000 to $39,999 | 2 (1.0%) | 8 (4.6%) |
| $40,000 to $44,999 | 4 (1.9%) | 0 (0.0%) |
| $45,000 to $49,999 | 2 (1.0%) | 11 (6.3%) |
| $50,000 to $54,999 | 34 (16.4%) | 15 (8.6%) |
| $55,000 to $64,999 | 39 (18.8%) | 19 (10.9%) |
| $65,000 to $74,999 | 32 (15.4%) | 0 (0.0%) |
| $75,000 to $99,999 | 6 (2.9%) | 12 (6.9%) |
| $100,000+ | 13 (6.2%) | 3 (1.7%) |
| Total | 208 (100.0%) | 175 (100.0%) |
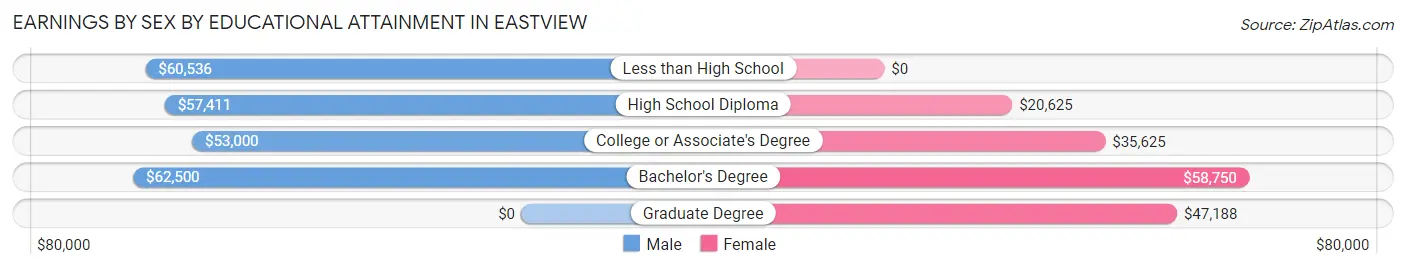
Earnings by Sex by Educational Attainment in Eastview
Average earnings in Eastview are $55,735 for men and $33,313 for women, a difference of 40.2%. Men with an educational attainment of bachelor's degree enjoy the highest average annual earnings of $62,500, while those with college or associate's degree education earn the least with $53,000. Women with an educational attainment of bachelor's degree earn the most with the average annual earnings of $58,750, while those with high school diploma education have the smallest earnings of $20,625.
| Educational Attainment | Male Income | Female Income |
| Less than High School | $60,536 | $0 |
| High School Diploma | $57,411 | $20,625 |
| College or Associate's Degree | $53,000 | $35,625 |
| Bachelor's Degree | $62,500 | $58,750 |
| Graduate Degree | - | - |
| Total | $55,735 | $33,313 |
Family Income in Eastview
Family Income Brackets in Eastview
According to the Eastview family income data, there are 60 families falling into the $50,000 to $74,999 income range, which is the most common income bracket and makes up 31.2% of all families.
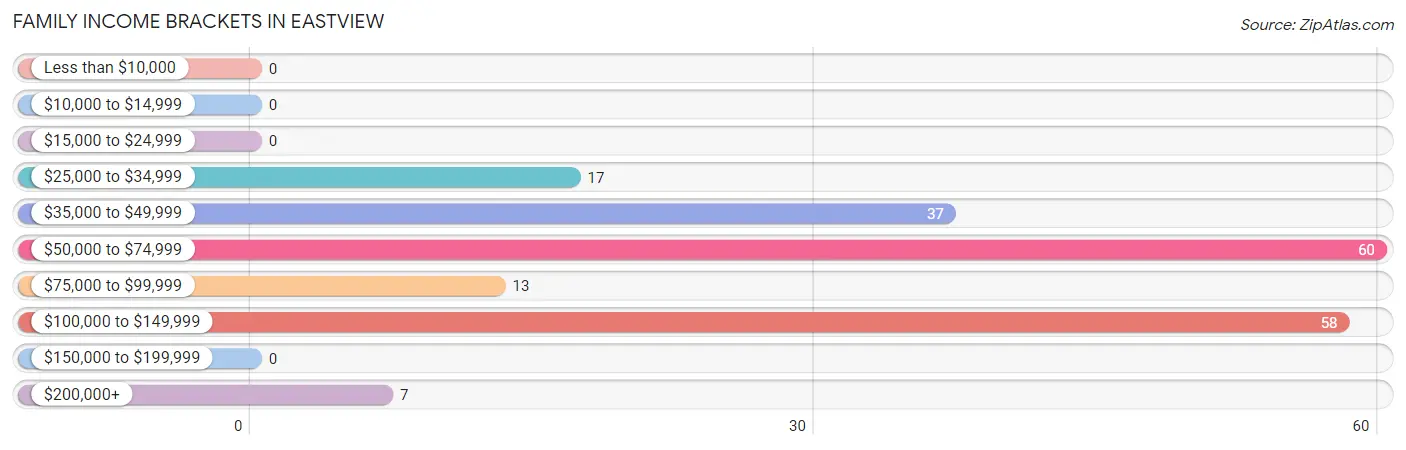
| Income Bracket | # Families | % Families |
| Less than $10,000 | 0 | 0.0% |
| $10,000 to $14,999 | 0 | 0.0% |
| $15,000 to $24,999 | 0 | 0.0% |
| $25,000 to $34,999 | 17 | 8.9% |
| $35,000 to $49,999 | 37 | 19.3% |
| $50,000 to $74,999 | 60 | 31.3% |
| $75,000 to $99,999 | 13 | 6.8% |
| $100,000 to $149,999 | 58 | 30.2% |
| $150,000 to $199,999 | 0 | 0.0% |
| $200,000+ | 7 | 3.6% |
Family Income by Famaliy Size in Eastview
4-person families (63 | 32.8%) account for the highest median family income in Eastview with $105,781 per family, while 2-person families (82 | 42.7%) have the highest median income of $33,334 per family member.
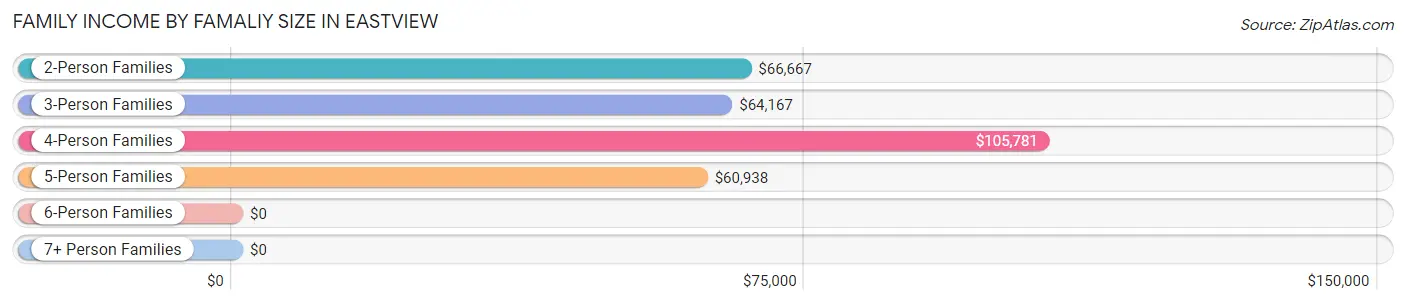
| Income Bracket | # Families | Median Income |
| 2-Person Families | 82 (42.7%) | $66,667 |
| 3-Person Families | 26 (13.5%) | $64,167 |
| 4-Person Families | 63 (32.8%) | $105,781 |
| 5-Person Families | 21 (10.9%) | $60,938 |
| 6-Person Families | 0 (0.0%) | $0 |
| 7+ Person Families | 0 (0.0%) | $0 |
| Total | 192 (100.0%) | $66,389 |
Family Income by Number of Earners in Eastview
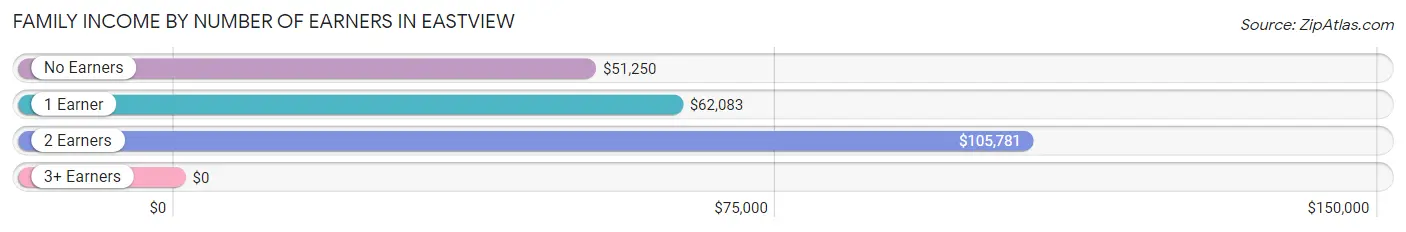
| Number of Earners | # Families | Median Income |
| No Earners | 18 (9.4%) | $51,250 |
| 1 Earner | 75 (39.1%) | $62,083 |
| 2 Earners | 85 (44.3%) | $105,781 |
| 3+ Earners | 14 (7.3%) | $0 |
| Total | 192 (100.0%) | $66,389 |
Household Income in Eastview
Household Income Brackets in Eastview
With 90 households falling in the category, the $50,000 to $74,999 income range is the most frequent in Eastview, accounting for 27.8% of all households.
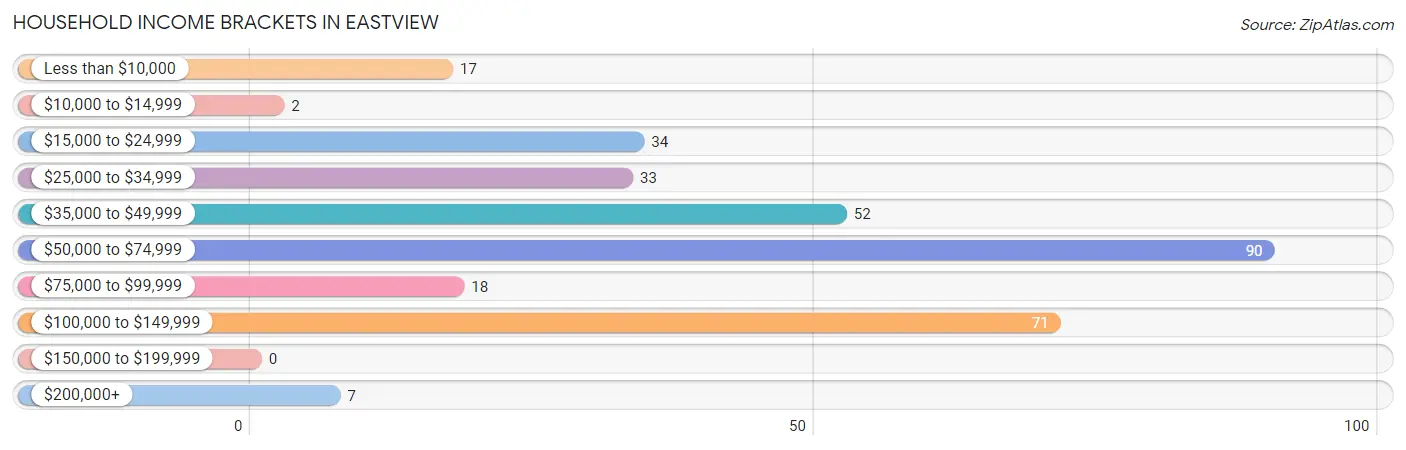
| Income Bracket | # Households | % Households |
| Less than $10,000 | 17 | 5.2% |
| $10,000 to $14,999 | 2 | 0.6% |
| $15,000 to $24,999 | 34 | 10.5% |
| $25,000 to $34,999 | 33 | 10.2% |
| $35,000 to $49,999 | 52 | 16.0% |
| $50,000 to $74,999 | 90 | 27.8% |
| $75,000 to $99,999 | 18 | 5.6% |
| $100,000 to $149,999 | 71 | 21.9% |
| $150,000 to $199,999 | 0 | 0.0% |
| $200,000+ | 7 | 2.2% |
Household Income by Householder Age in Eastview
The median household income in Eastview is $55,313, with the highest median household income of $70,625 found in the 25 to 44 years age bracket for the primary householder. A total of 133 households (41.0%) fall into this category. Meanwhile, the 15 to 24 years age bracket for the primary householder has the lowest median household income of $33,333, with 12 households (3.7%) in this group.
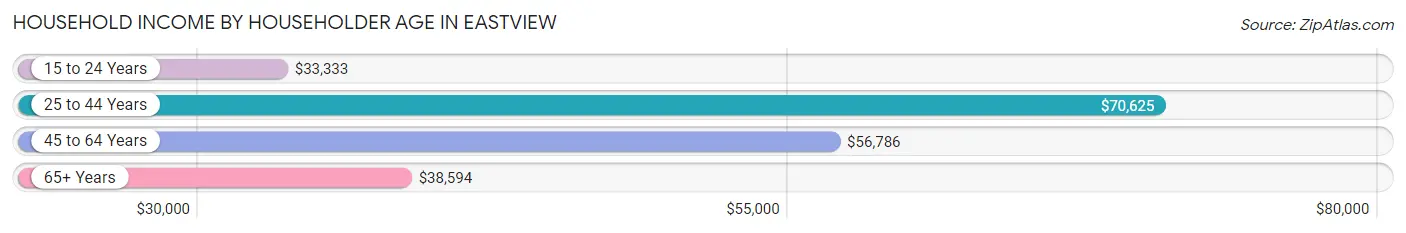
| Income Bracket | # Households | Median Income |
| 15 to 24 Years | 12 (3.7%) | $33,333 |
| 25 to 44 Years | 133 (41.0%) | $70,625 |
| 45 to 64 Years | 92 (28.4%) | $56,786 |
| 65+ Years | 87 (26.9%) | $38,594 |
| Total | 324 (100.0%) | $55,313 |
Poverty in Eastview
Income Below Poverty by Sex and Age in Eastview
With 9.1% poverty level for males and 16.0% for females among the residents of Eastview, 16 and 17 year old males and under 5 year old females are the most vulnerable to poverty, with 11 males (52.4%) and 7 females (43.8%) in their respective age groups living below the poverty level.
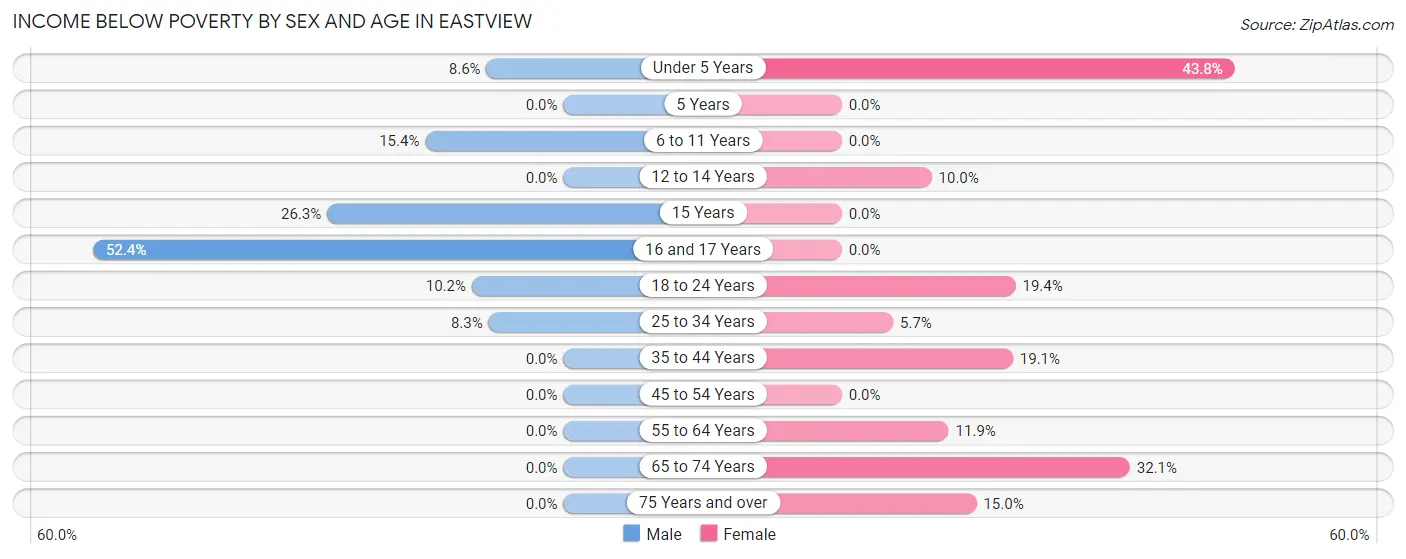
| Age Bracket | Male | Female |
| Under 5 Years | 3 (8.6%) | 7 (43.8%) |
| 5 Years | 0 (0.0%) | 0 (0.0%) |
| 6 to 11 Years | 6 (15.4%) | 0 (0.0%) |
| 12 to 14 Years | 0 (0.0%) | 2 (10.0%) |
| 15 Years | 10 (26.3%) | 0 (0.0%) |
| 16 and 17 Years | 11 (52.4%) | 0 (0.0%) |
| 18 to 24 Years | 5 (10.2%) | 6 (19.4%) |
| 25 to 34 Years | 3 (8.3%) | 2 (5.7%) |
| 35 to 44 Years | 0 (0.0%) | 20 (19.1%) |
| 45 to 54 Years | 0 (0.0%) | 0 (0.0%) |
| 55 to 64 Years | 0 (0.0%) | 5 (11.9%) |
| 65 to 74 Years | 0 (0.0%) | 17 (32.1%) |
| 75 Years and over | 0 (0.0%) | 3 (15.0%) |
| Total | 38 (9.1%) | 62 (16.0%) |
Income Above Poverty by Sex and Age in Eastview
According to the poverty statistics in Eastview, males aged 12 to 14 years and females aged 5 years are the age groups that are most secure financially, with 100.0% of males and 100.0% of females in these age groups living above the poverty line.
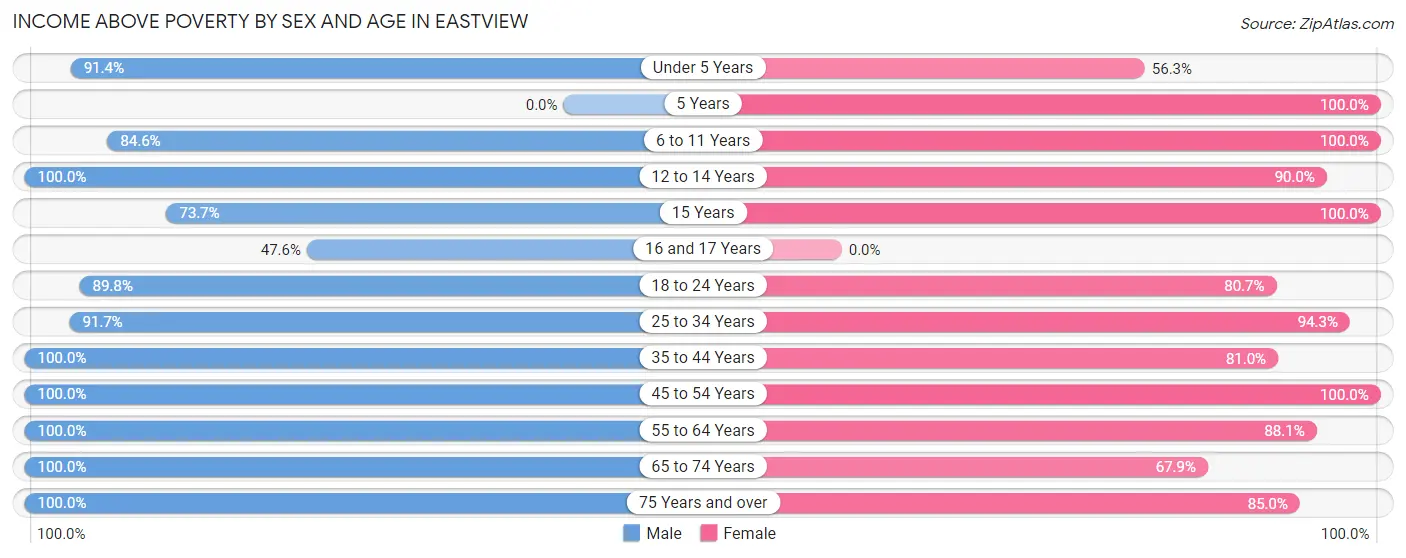
| Age Bracket | Male | Female |
| Under 5 Years | 32 (91.4%) | 9 (56.2%) |
| 5 Years | 0 (0.0%) | 9 (100.0%) |
| 6 to 11 Years | 33 (84.6%) | 30 (100.0%) |
| 12 to 14 Years | 10 (100.0%) | 18 (90.0%) |
| 15 Years | 28 (73.7%) | 2 (100.0%) |
| 16 and 17 Years | 10 (47.6%) | 0 (0.0%) |
| 18 to 24 Years | 44 (89.8%) | 25 (80.6%) |
| 25 to 34 Years | 33 (91.7%) | 33 (94.3%) |
| 35 to 44 Years | 35 (100.0%) | 85 (80.9%) |
| 45 to 54 Years | 50 (100.0%) | 24 (100.0%) |
| 55 to 64 Years | 45 (100.0%) | 37 (88.1%) |
| 65 to 74 Years | 32 (100.0%) | 36 (67.9%) |
| 75 Years and over | 29 (100.0%) | 17 (85.0%) |
| Total | 381 (90.9%) | 325 (84.0%) |
Income Below Poverty Among Married-Couple Families in Eastview
The poverty statistics for married-couple families in Eastview show that 2.9% or 5 of the total 170 families live below the poverty line. Families with 1 or 2 children have the highest poverty rate of 6.7%, comprising of 5 families. On the other hand, families with no children have the lowest poverty rate of 0.0%, which includes 0 families.
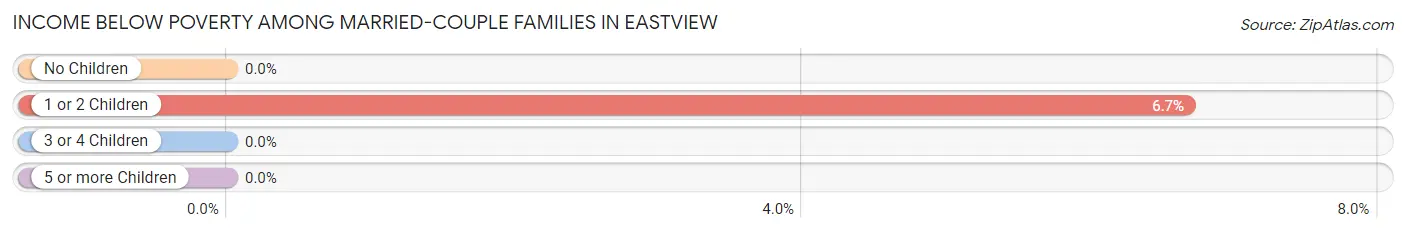
| Children | Above Poverty | Below Poverty |
| No Children | 88 (100.0%) | 0 (0.0%) |
| 1 or 2 Children | 70 (93.3%) | 5 (6.7%) |
| 3 or 4 Children | 7 (100.0%) | 0 (0.0%) |
| 5 or more Children | 0 (0.0%) | 0 (0.0%) |
| Total | 165 (97.1%) | 5 (2.9%) |
Income Below Poverty Among Single-Parent Households in Eastview
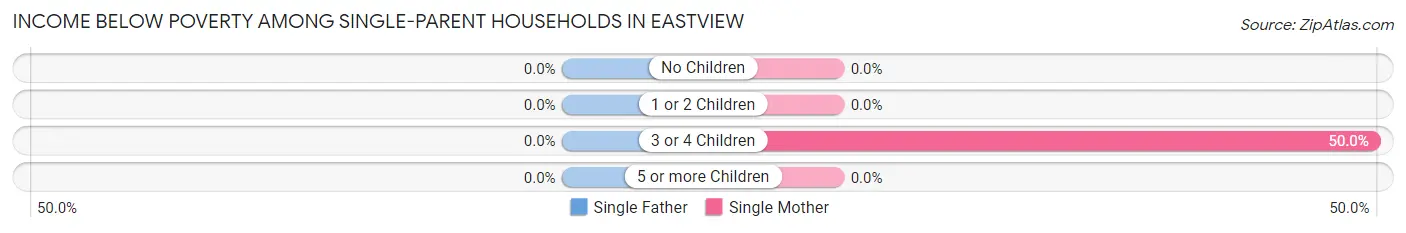
| Children | Single Father | Single Mother |
| No Children | 0 (0.0%) | 0 (0.0%) |
| 1 or 2 Children | 0 (0.0%) | 0 (0.0%) |
| 3 or 4 Children | 0 (0.0%) | 2 (50.0%) |
| 5 or more Children | 0 (0.0%) | 0 (0.0%) |
| Total | 0 (0.0%) | 2 (12.5%) |
Income Below Poverty Among Married-Couple vs Single-Parent Households in Eastview
The poverty data for Eastview shows that 5 of the married-couple family households (2.9%) and 2 of the single-parent households (9.1%) are living below the poverty level. Within the married-couple family households, those with 1 or 2 children have the highest poverty rate, with 5 households (6.7%) falling below the poverty line. Among the single-parent households, those with 3 or 4 children have the highest poverty rate, with 2 household (50.0%) living below poverty.
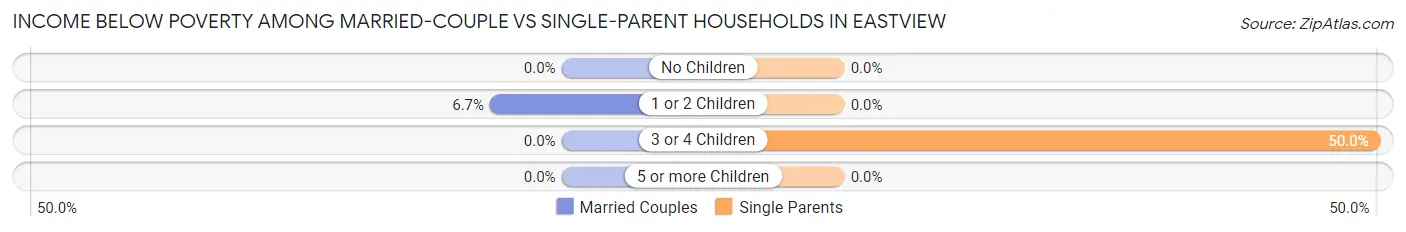
| Children | Married-Couple Families | Single-Parent Households |
| No Children | 0 (0.0%) | 0 (0.0%) |
| 1 or 2 Children | 5 (6.7%) | 0 (0.0%) |
| 3 or 4 Children | 0 (0.0%) | 2 (50.0%) |
| 5 or more Children | 0 (0.0%) | 0 (0.0%) |
| Total | 5 (2.9%) | 2 (9.1%) |
Race in Eastview
The most populous races in Eastview are White / Caucasian (811 | 97.1%), Hispanic or Latino (28 | 3.4%), and Black / African American (13 | 1.6%).
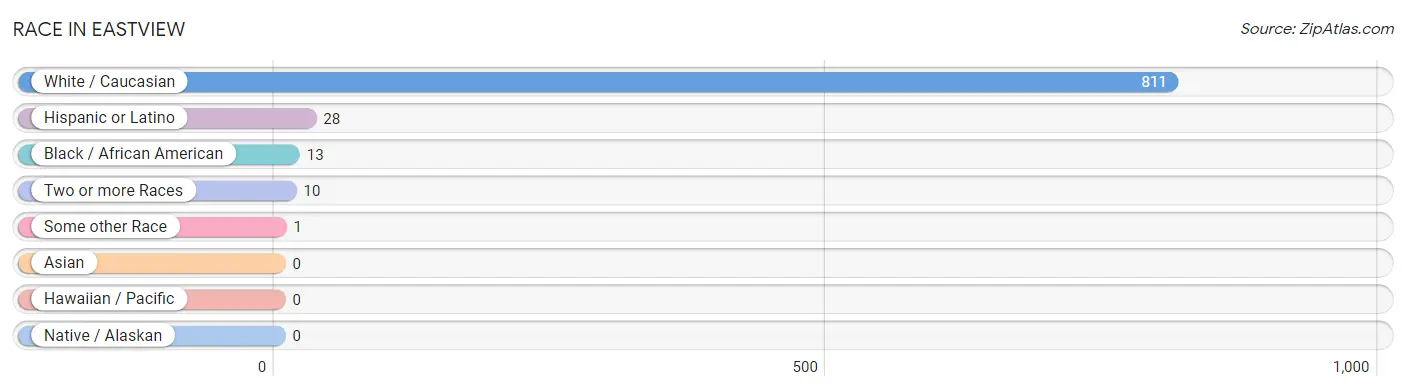
| Race | # Population | % Population |
| Asian | 0 | 0.0% |
| Black / African American | 13 | 1.6% |
| Hawaiian / Pacific | 0 | 0.0% |
| Hispanic or Latino | 28 | 3.4% |
| Native / Alaskan | 0 | 0.0% |
| White / Caucasian | 811 | 97.1% |
| Two or more Races | 10 | 1.2% |
| Some other Race | 1 | 0.1% |
| Total | 835 | 100.0% |
Ancestry in Eastview
The most populous ancestries reported in Eastview are Irish (113 | 13.5%), German (45 | 5.4%), American (44 | 5.3%), European (28 | 3.4%), and Mexican (25 | 3.0%), together accounting for 30.5% of all Eastview residents.
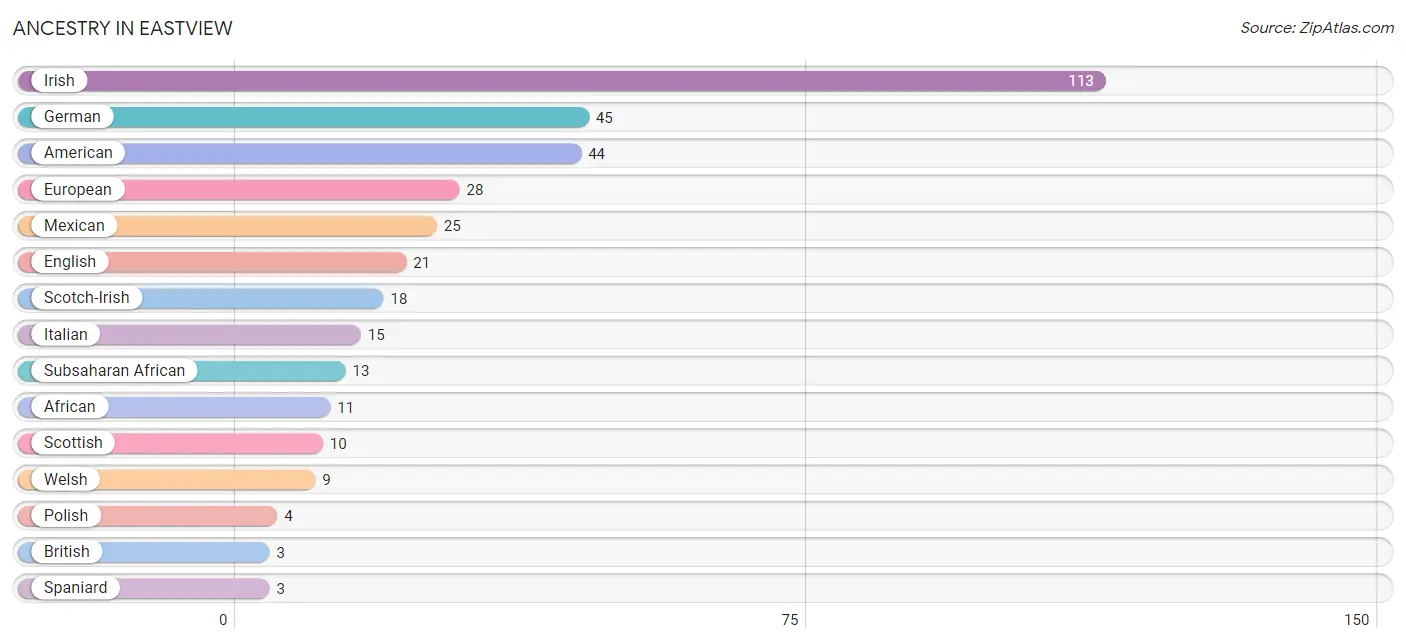
| Ancestry | # Population | % Population |
| African | 11 | 1.3% |
| American | 44 | 5.3% |
| British | 3 | 0.4% |
| English | 21 | 2.5% |
| European | 28 | 3.4% |
| German | 45 | 5.4% |
| Irish | 113 | 13.5% |
| Italian | 15 | 1.8% |
| Mexican | 25 | 3.0% |
| Nigerian | 2 | 0.2% |
| Pennsylvania German | 2 | 0.2% |
| Polish | 4 | 0.5% |
| Scotch-Irish | 18 | 2.2% |
| Scottish | 10 | 1.2% |
| Spaniard | 3 | 0.4% |
| Subsaharan African | 13 | 1.6% |
| Welsh | 9 | 1.1% | View All 17 Rows |
Immigrants in Eastview

| Immigration Origin | # Population | % Population | View All 0 Rows |
Sex and Age in Eastview
Sex and Age in Eastview
The most populous age groups in Eastview are 15 to 19 Years (82 | 19.1%) for men and 40 to 44 Years (74 | 18.3%) for women.
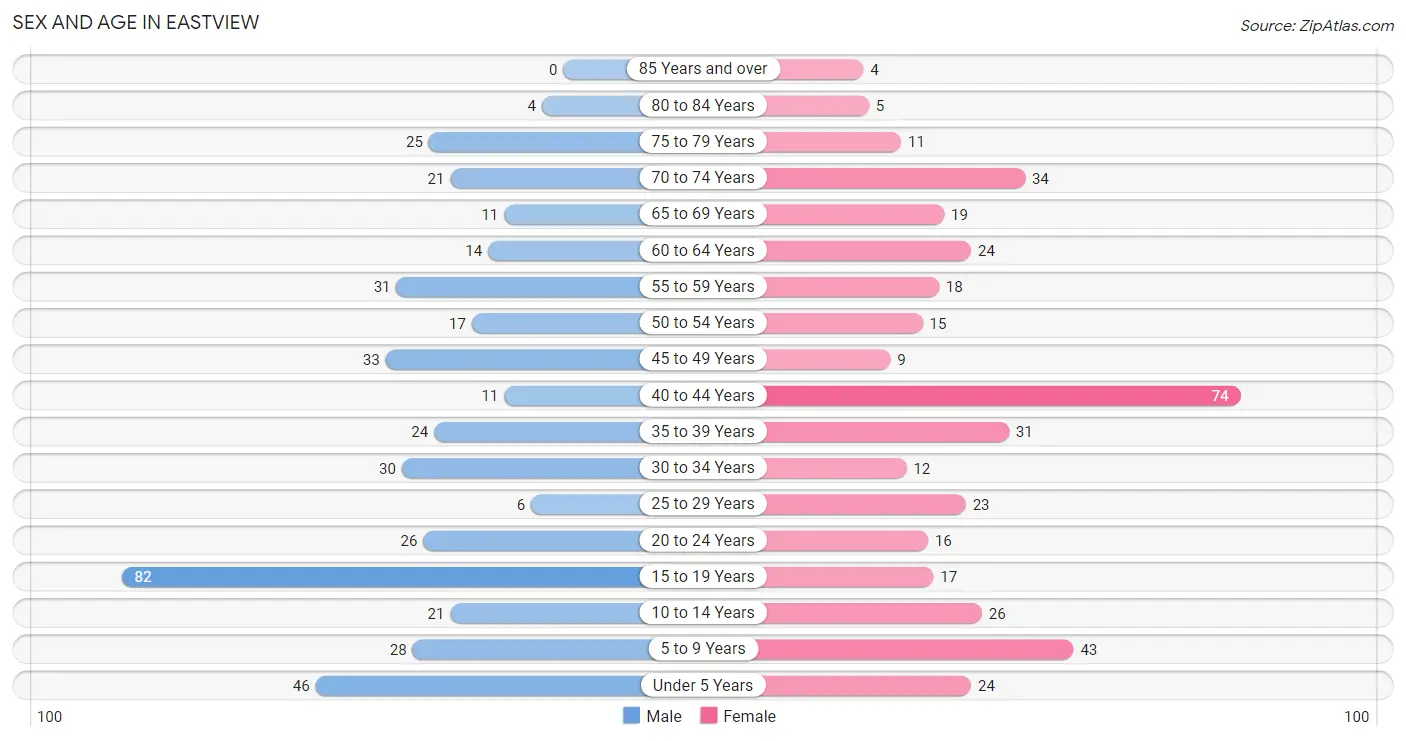
| Age Bracket | Male | Female |
| Under 5 Years | 46 (10.7%) | 24 (5.9%) |
| 5 to 9 Years | 28 (6.5%) | 43 (10.6%) |
| 10 to 14 Years | 21 (4.9%) | 26 (6.4%) |
| 15 to 19 Years | 82 (19.1%) | 17 (4.2%) |
| 20 to 24 Years | 26 (6.0%) | 16 (4.0%) |
| 25 to 29 Years | 6 (1.4%) | 23 (5.7%) |
| 30 to 34 Years | 30 (7.0%) | 12 (3.0%) |
| 35 to 39 Years | 24 (5.6%) | 31 (7.6%) |
| 40 to 44 Years | 11 (2.6%) | 74 (18.3%) |
| 45 to 49 Years | 33 (7.7%) | 9 (2.2%) |
| 50 to 54 Years | 17 (4.0%) | 15 (3.7%) |
| 55 to 59 Years | 31 (7.2%) | 18 (4.4%) |
| 60 to 64 Years | 14 (3.3%) | 24 (5.9%) |
| 65 to 69 Years | 11 (2.6%) | 19 (4.7%) |
| 70 to 74 Years | 21 (4.9%) | 34 (8.4%) |
| 75 to 79 Years | 25 (5.8%) | 11 (2.7%) |
| 80 to 84 Years | 4 (0.9%) | 5 (1.2%) |
| 85 Years and over | 0 (0.0%) | 4 (1.0%) |
| Total | 430 (100.0%) | 405 (100.0%) |
Families and Households in Eastview
Median Family Size in Eastview
The median family size in Eastview is 3.27 persons per family, with single female/mother families (16 | 8.3%) accounting for the largest median family size of 4.69 persons per family. On the other hand, single male/father families (6 | 3.1%) represent the smallest median family size with 3.00 persons per family.
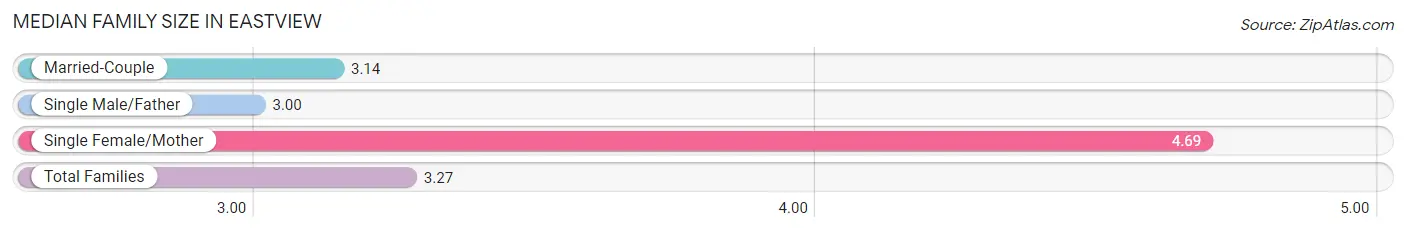
| Family Type | # Families | Family Size |
| Married-Couple | 170 (88.5%) | 3.14 |
| Single Male/Father | 6 (3.1%) | 3.00 |
| Single Female/Mother | 16 (8.3%) | 4.69 |
| Total Families | 192 (100.0%) | 3.27 |
Median Household Size in Eastview
The median household size in Eastview is 2.58 persons per household, with single female/mother households (16 | 4.9%) accounting for the largest median household size of 5.31 persons per household. non-family households (132 | 40.7%) represent the smallest median household size with 1.12 persons per household.
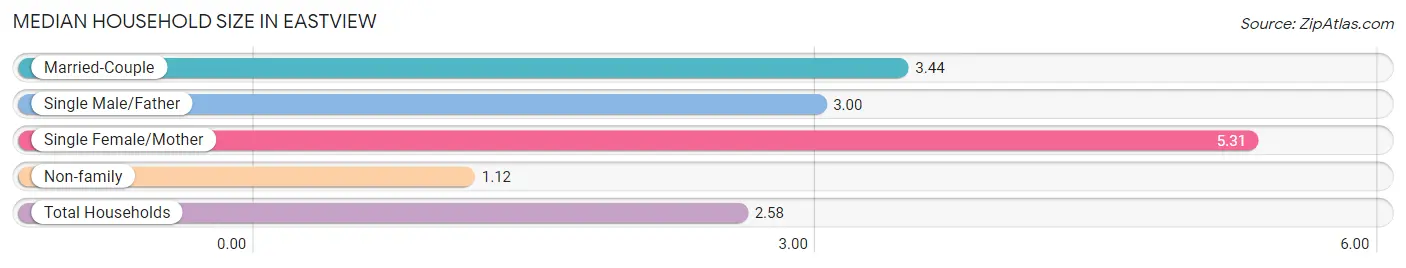
| Household Type | # Households | Household Size |
| Married-Couple | 170 (52.5%) | 3.44 |
| Single Male/Father | 6 (1.8%) | 3.00 |
| Single Female/Mother | 16 (4.9%) | 5.31 |
| Non-family | 132 (40.7%) | 1.12 |
| Total Households | 324 (100.0%) | 2.58 |
Household Size by Marriage Status in Eastview
Out of a total of 324 households in Eastview, 192 (59.3%) are family households, while 132 (40.7%) are nonfamily households. The most numerous type of family households are 2-person households, comprising 82, and the most common type of nonfamily households are 1-person households, comprising 118.
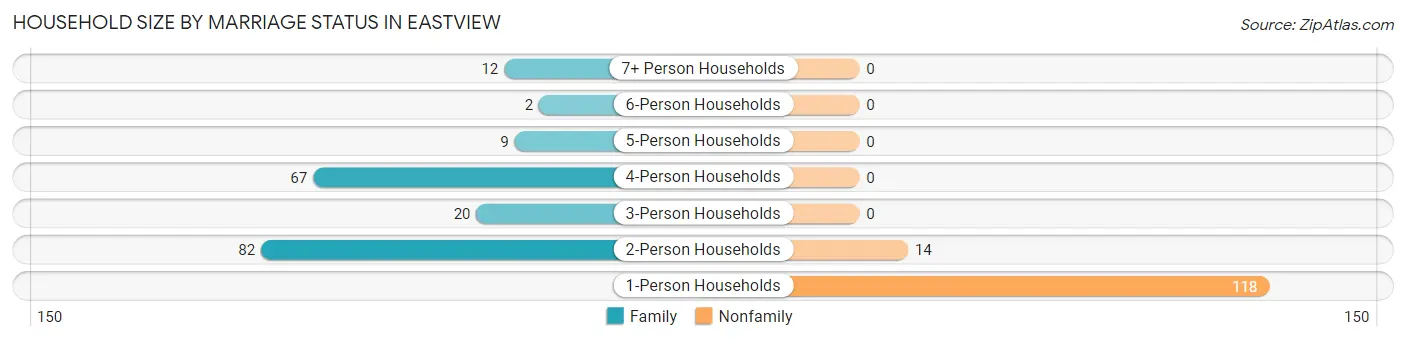
| Household Size | Family Households | Nonfamily Households |
| 1-Person Households | - | 118 (36.4%) |
| 2-Person Households | 82 (25.3%) | 14 (4.3%) |
| 3-Person Households | 20 (6.2%) | 0 (0.0%) |
| 4-Person Households | 67 (20.7%) | 0 (0.0%) |
| 5-Person Households | 9 (2.8%) | 0 (0.0%) |
| 6-Person Households | 2 (0.6%) | 0 (0.0%) |
| 7+ Person Households | 12 (3.7%) | 0 (0.0%) |
| Total | 192 (59.3%) | 132 (40.7%) |
Female Fertility in Eastview
Fertility by Age in Eastview
Average fertility rate in Eastview is 49.0 births per 1,000 women. Women in the age bracket of 20 to 34 years have the highest fertility rate with 176.0 births per 1,000 women. Women in the age bracket of 20 to 34 years acount for 100.0% of all women with births.
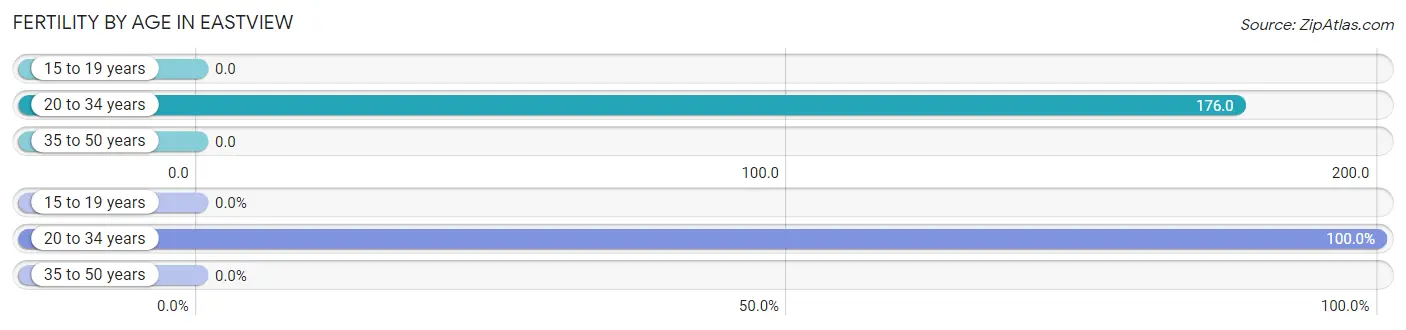
| Age Bracket | Women with Births | Births / 1,000 Women |
| 15 to 19 years | 0 (0.0%) | 0.0 |
| 20 to 34 years | 9 (100.0%) | 176.0 |
| 35 to 50 years | 0 (0.0%) | 0.0 |
| Total | 9 (100.0%) | 49.0 |
Fertility by Age by Marriage Status in Eastview
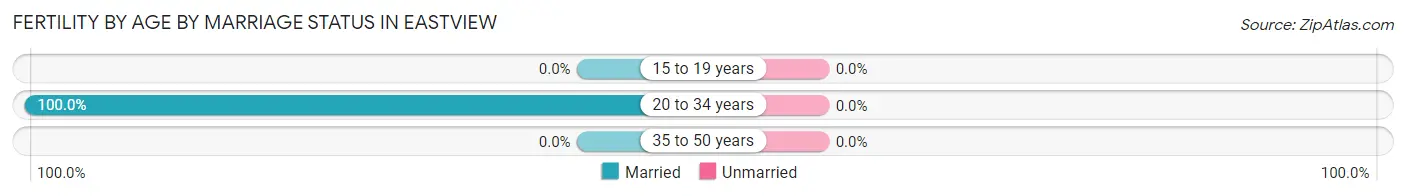
| Age Bracket | Married | Unmarried |
| 15 to 19 years | 0 (0.0%) | 0 (0.0%) |
| 20 to 34 years | 9 (100.0%) | 0 (0.0%) |
| 35 to 50 years | 0 (0.0%) | 0 (0.0%) |
| Total | 9 (100.0%) | 0 (0.0%) |
Fertility by Education in Eastview
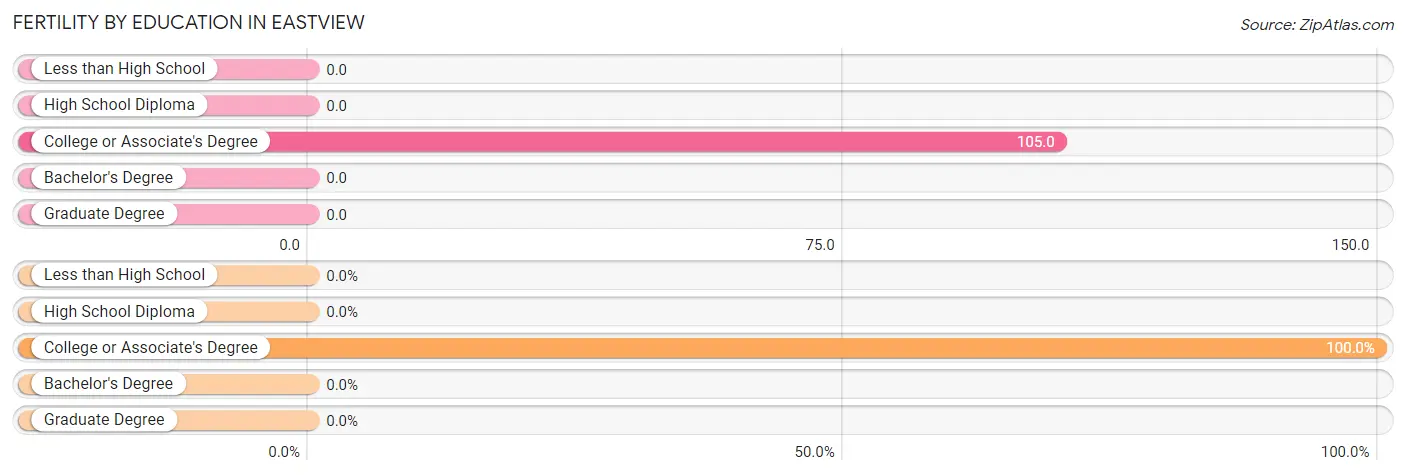
| Educational Attainment | Women with Births | Births / 1,000 Women |
| Less than High School | 0 (0.0%) | 0.0 |
| High School Diploma | 0 (0.0%) | 0.0 |
| College or Associate's Degree | 9 (100.0%) | 105.0 |
| Bachelor's Degree | 0 (0.0%) | 0.0 |
| Graduate Degree | 0 (0.0%) | 0.0 |
| Total | 9 (100.0%) | 49.0 |
Fertility by Education by Marriage Status in Eastview
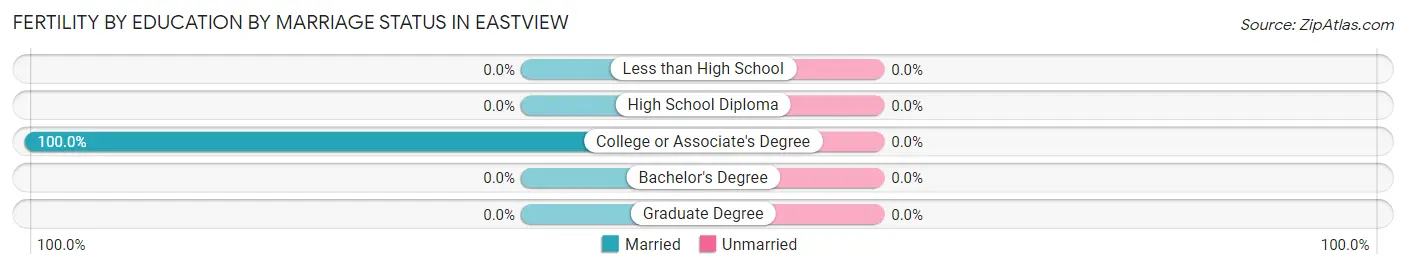
| Educational Attainment | Married | Unmarried |
| Less than High School | 0 (0.0%) | 0 (0.0%) |
| High School Diploma | 0 (0.0%) | 0 (0.0%) |
| College or Associate's Degree | 9 (100.0%) | 0 (0.0%) |
| Bachelor's Degree | 0 (0.0%) | 0 (0.0%) |
| Graduate Degree | 0 (0.0%) | 0 (0.0%) |
| Total | 9 (100.0%) | 0 (0.0%) |
Employment Characteristics in Eastview
Employment by Class of Employer in Eastview
Among the 353 employed individuals in Eastview, private company employees (274 | 77.6%), local government employees (40 | 11.3%), and self-employed (not incorporated) (20 | 5.7%) make up the most common classes of employment.
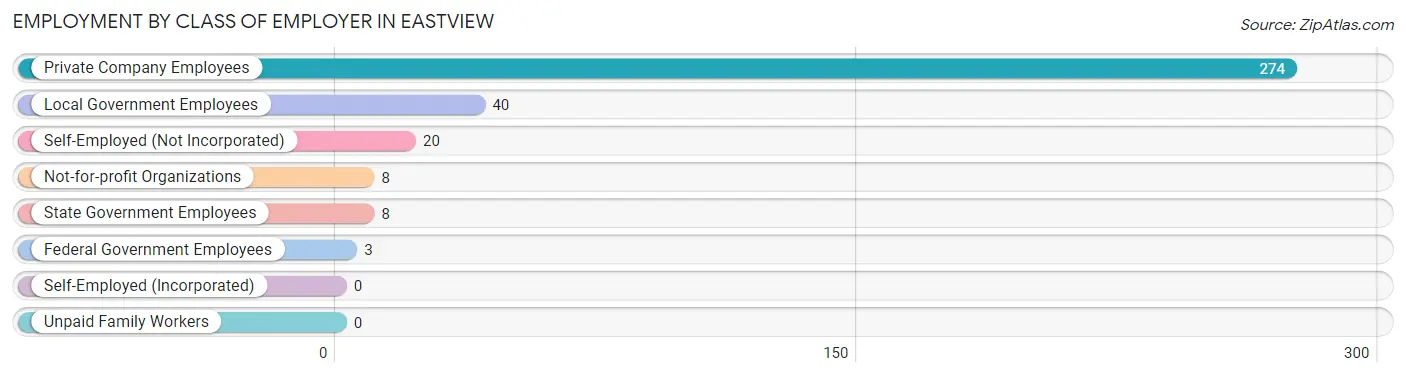
| Employer Class | # Employees | % Employees |
| Private Company Employees | 274 | 77.6% |
| Self-Employed (Incorporated) | 0 | 0.0% |
| Self-Employed (Not Incorporated) | 20 | 5.7% |
| Not-for-profit Organizations | 8 | 2.3% |
| Local Government Employees | 40 | 11.3% |
| State Government Employees | 8 | 2.3% |
| Federal Government Employees | 3 | 0.9% |
| Unpaid Family Workers | 0 | 0.0% |
| Total | 353 | 100.0% |
Employment Status by Age in Eastview
According to the labor force statistics for Eastview, out of the total population over 16 years of age (607), 63.8% or 387 individuals are in the labor force, with 7.0% or 27 of them unemployed. The age group with the highest labor force participation rate is 45 to 54 years, with 90.5% or 67 individuals in the labor force. Within the labor force, the 16 to 19 years age range has the highest percentage of unemployed individuals, with 67.6% or 25 of them being unemployed.
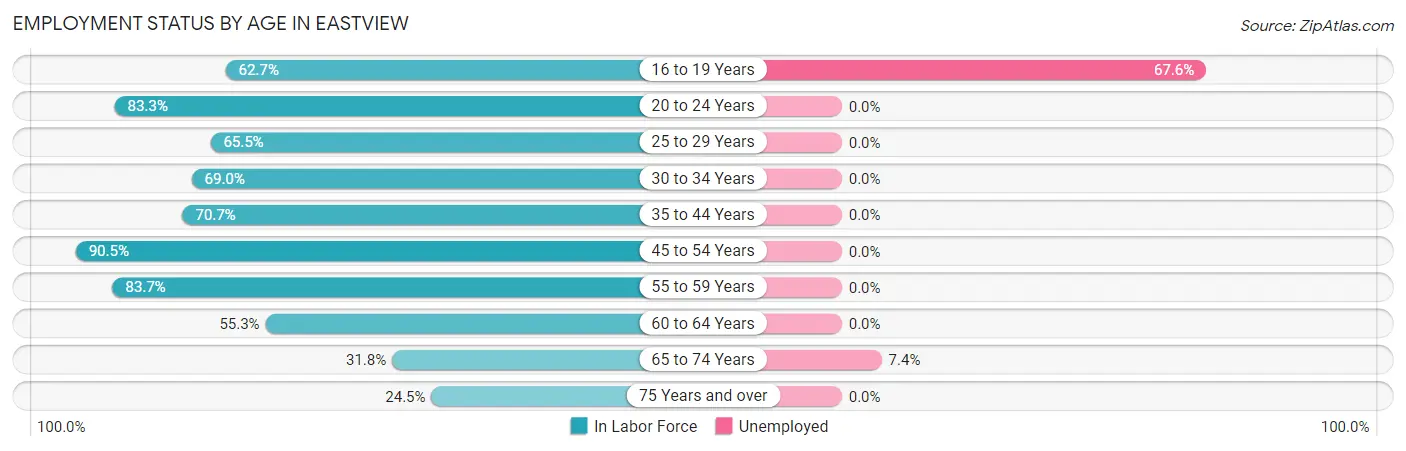
| Age Bracket | In Labor Force | Unemployed |
| 16 to 19 Years | 37 (62.7%) | 25 (67.6%) |
| 20 to 24 Years | 35 (83.3%) | 0 (0.0%) |
| 25 to 29 Years | 19 (65.5%) | 0 (0.0%) |
| 30 to 34 Years | 29 (69.0%) | 0 (0.0%) |
| 35 to 44 Years | 99 (70.7%) | 0 (0.0%) |
| 45 to 54 Years | 67 (90.5%) | 0 (0.0%) |
| 55 to 59 Years | 41 (83.7%) | 0 (0.0%) |
| 60 to 64 Years | 21 (55.3%) | 0 (0.0%) |
| 65 to 74 Years | 27 (31.8%) | 2 (7.4%) |
| 75 Years and over | 12 (24.5%) | 0 (0.0%) |
| Total | 387 (63.8%) | 27 (7.0%) |
Employment Status by Educational Attainment in Eastview
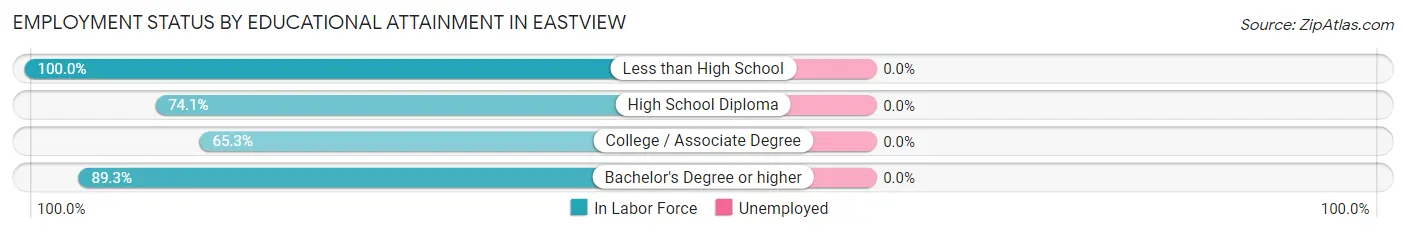
| Educational Attainment | In Labor Force | Unemployed |
| Less than High School | 8 (100.0%) | 0 (0.0%) |
| High School Diploma | 103 (74.1%) | 0 (0.0%) |
| College / Associate Degree | 98 (65.3%) | 0 (0.0%) |
| Bachelor's Degree or higher | 67 (89.3%) | 0 (0.0%) |
| Total | 276 (74.2%) | 0 (0.0%) |
Employment Occupations by Sex in Eastview
Management, Business, Science and Arts Occupations
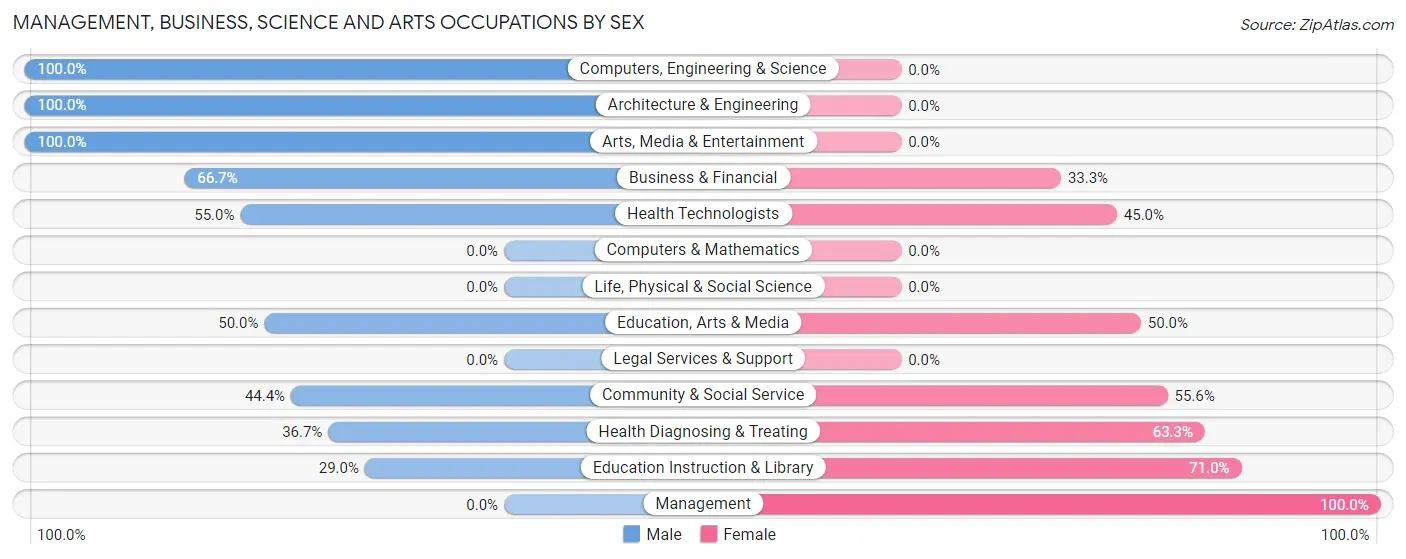
The most common Management, Business, Science and Arts occupations in Eastview are Community & Social Service (45 | 12.5%), Education Instruction & Library (31 | 8.6%), Health Diagnosing & Treating (30 | 8.3%), Health Technologists (20 | 5.6%), and Management (12 | 3.3%).
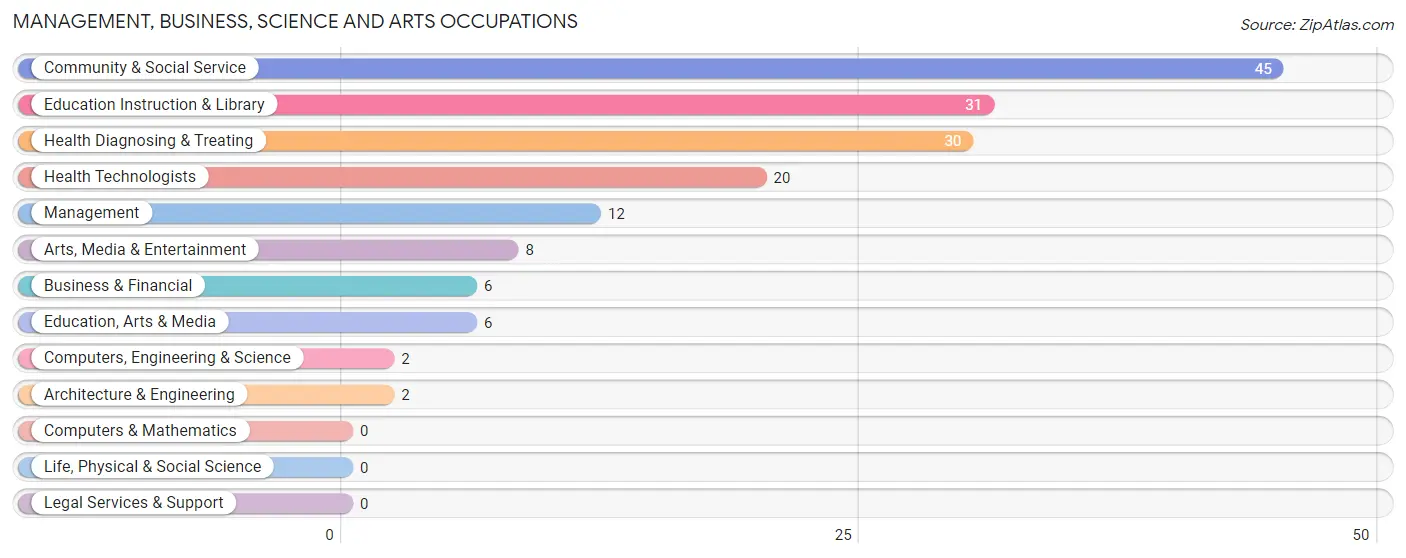
Management, Business, Science and Arts Occupations by Sex
Within the Management, Business, Science and Arts occupations in Eastview, the most male-oriented occupations are Computers, Engineering & Science (100.0%), Architecture & Engineering (100.0%), and Arts, Media & Entertainment (100.0%), while the most female-oriented occupations are Management (100.0%), Education Instruction & Library (71.0%), and Health Diagnosing & Treating (63.3%).
| Occupation | Male | Female |
| Management | 0 (0.0%) | 12 (100.0%) |
| Business & Financial | 4 (66.7%) | 2 (33.3%) |
| Computers, Engineering & Science | 2 (100.0%) | 0 (0.0%) |
| Computers & Mathematics | 0 (0.0%) | 0 (0.0%) |
| Architecture & Engineering | 2 (100.0%) | 0 (0.0%) |
| Life, Physical & Social Science | 0 (0.0%) | 0 (0.0%) |
| Community & Social Service | 20 (44.4%) | 25 (55.6%) |
| Education, Arts & Media | 3 (50.0%) | 3 (50.0%) |
| Legal Services & Support | 0 (0.0%) | 0 (0.0%) |
| Education Instruction & Library | 9 (29.0%) | 22 (71.0%) |
| Arts, Media & Entertainment | 8 (100.0%) | 0 (0.0%) |
| Health Diagnosing & Treating | 11 (36.7%) | 19 (63.3%) |
| Health Technologists | 11 (55.0%) | 9 (45.0%) |
| Total (Category) | 37 (39.0%) | 58 (61.1%) |
| Total (Overall) | 206 (57.2%) | 154 (42.8%) |
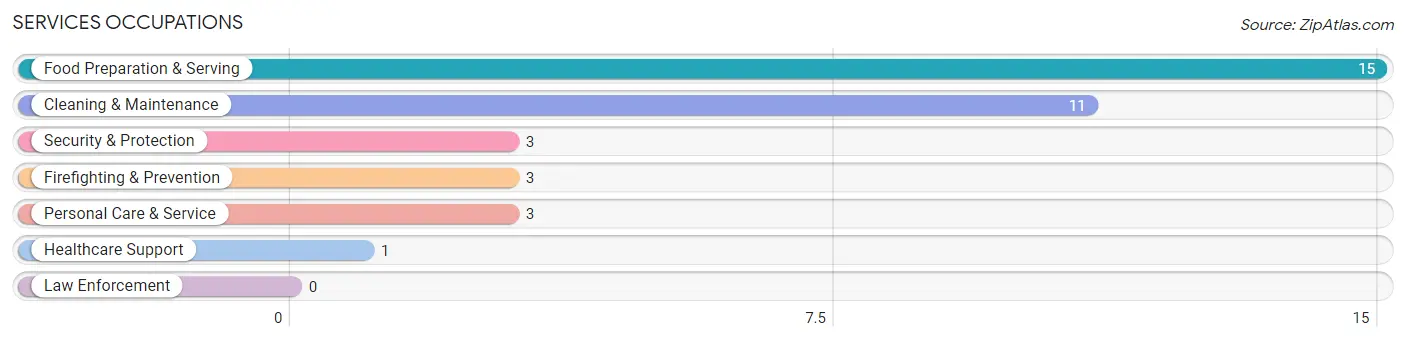
Services Occupations
The most common Services occupations in Eastview are Food Preparation & Serving (15 | 4.2%), Cleaning & Maintenance (11 | 3.1%), Security & Protection (3 | 0.8%), Firefighting & Prevention (3 | 0.8%), and Personal Care & Service (3 | 0.8%).
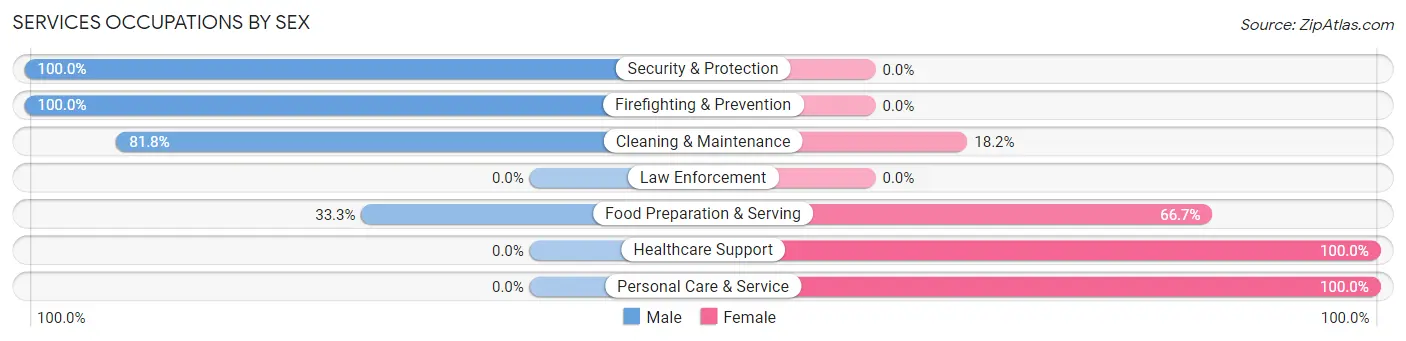
Services Occupations by Sex
Within the Services occupations in Eastview, the most male-oriented occupations are Security & Protection (100.0%), Firefighting & Prevention (100.0%), and Cleaning & Maintenance (81.8%), while the most female-oriented occupations are Healthcare Support (100.0%), Personal Care & Service (100.0%), and Food Preparation & Serving (66.7%).
| Occupation | Male | Female |
| Healthcare Support | 0 (0.0%) | 1 (100.0%) |
| Security & Protection | 3 (100.0%) | 0 (0.0%) |
| Firefighting & Prevention | 3 (100.0%) | 0 (0.0%) |
| Law Enforcement | 0 (0.0%) | 0 (0.0%) |
| Food Preparation & Serving | 5 (33.3%) | 10 (66.7%) |
| Cleaning & Maintenance | 9 (81.8%) | 2 (18.2%) |
| Personal Care & Service | 0 (0.0%) | 3 (100.0%) |
| Total (Category) | 17 (51.5%) | 16 (48.5%) |
| Total (Overall) | 206 (57.2%) | 154 (42.8%) |
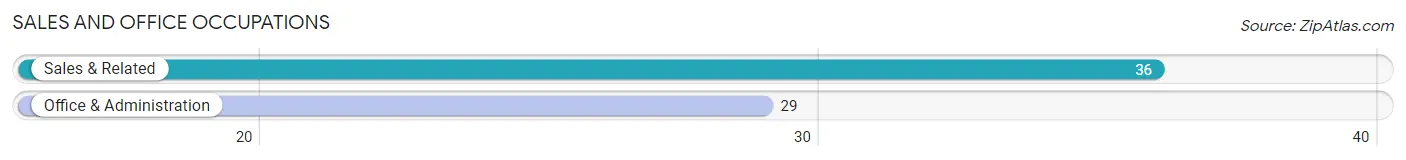
Sales and Office Occupations
The most common Sales and Office occupations in Eastview are Sales & Related (36 | 10.0%), and Office & Administration (29 | 8.1%).
Sales and Office Occupations by Sex

| Occupation | Male | Female |
| Sales & Related | 32 (88.9%) | 4 (11.1%) |
| Office & Administration | 0 (0.0%) | 29 (100.0%) |
| Total (Category) | 32 (49.2%) | 33 (50.8%) |
| Total (Overall) | 206 (57.2%) | 154 (42.8%) |
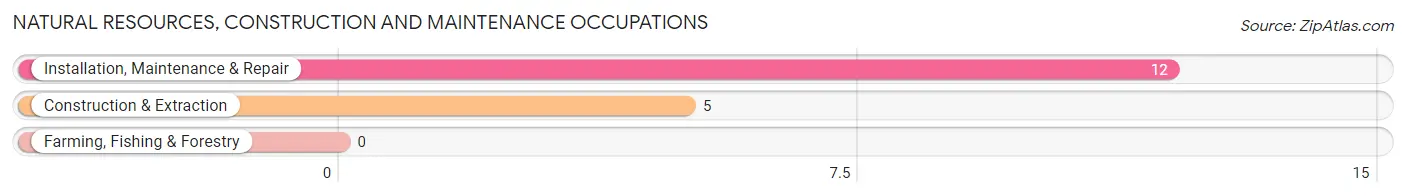
Natural Resources, Construction and Maintenance Occupations
The most common Natural Resources, Construction and Maintenance occupations in Eastview are Installation, Maintenance & Repair (12 | 3.3%), and Construction & Extraction (5 | 1.4%).
Natural Resources, Construction and Maintenance Occupations by Sex
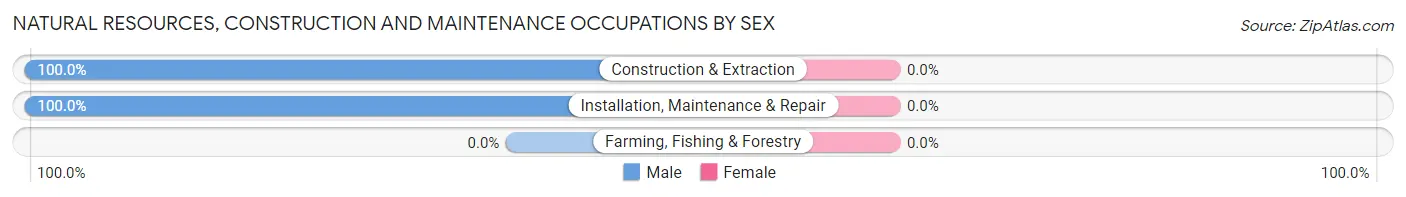
| Occupation | Male | Female |
| Farming, Fishing & Forestry | 0 (0.0%) | 0 (0.0%) |
| Construction & Extraction | 5 (100.0%) | 0 (0.0%) |
| Installation, Maintenance & Repair | 12 (100.0%) | 0 (0.0%) |
| Total (Category) | 17 (100.0%) | 0 (0.0%) |
| Total (Overall) | 206 (57.2%) | 154 (42.8%) |
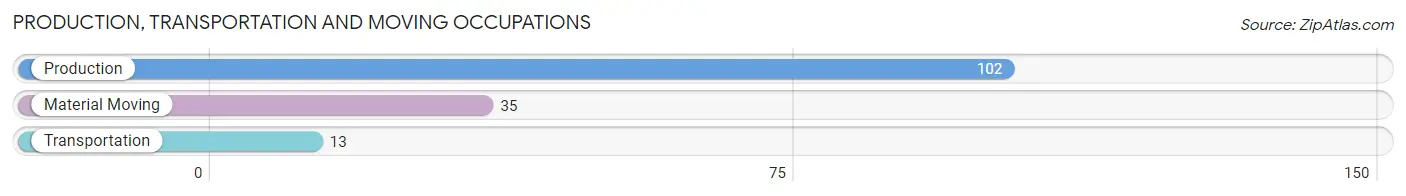
Production, Transportation and Moving Occupations
The most common Production, Transportation and Moving occupations in Eastview are Production (102 | 28.3%), Material Moving (35 | 9.7%), and Transportation (13 | 3.6%).
Production, Transportation and Moving Occupations by Sex
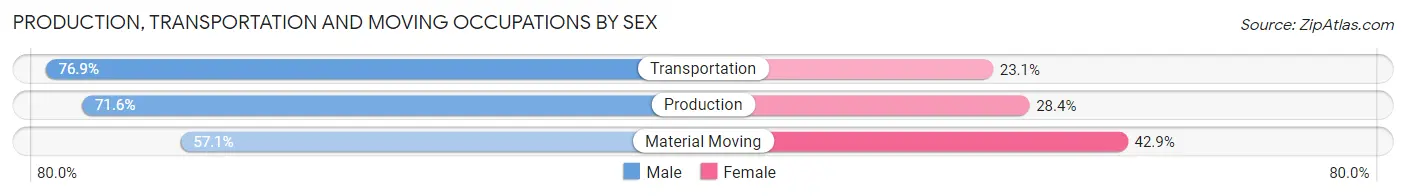
| Occupation | Male | Female |
| Production | 73 (71.6%) | 29 (28.4%) |
| Transportation | 10 (76.9%) | 3 (23.1%) |
| Material Moving | 20 (57.1%) | 15 (42.9%) |
| Total (Category) | 103 (68.7%) | 47 (31.3%) |
| Total (Overall) | 206 (57.2%) | 154 (42.8%) |
Employment Industries by Sex in Eastview
Employment Industries in Eastview
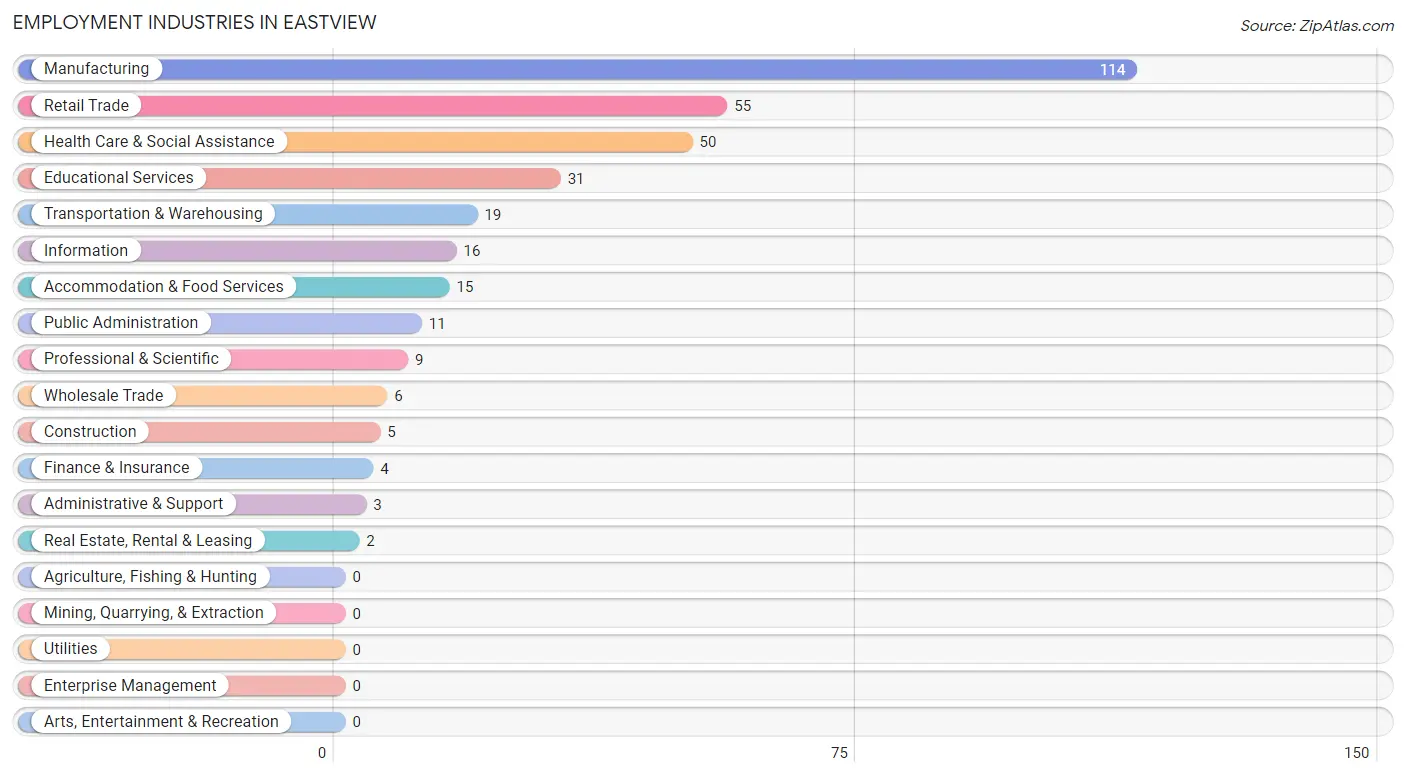
The major employment industries in Eastview include Manufacturing (114 | 31.7%), Retail Trade (55 | 15.3%), Health Care & Social Assistance (50 | 13.9%), Educational Services (31 | 8.6%), and Transportation & Warehousing (19 | 5.3%).
Employment Industries by Sex in Eastview
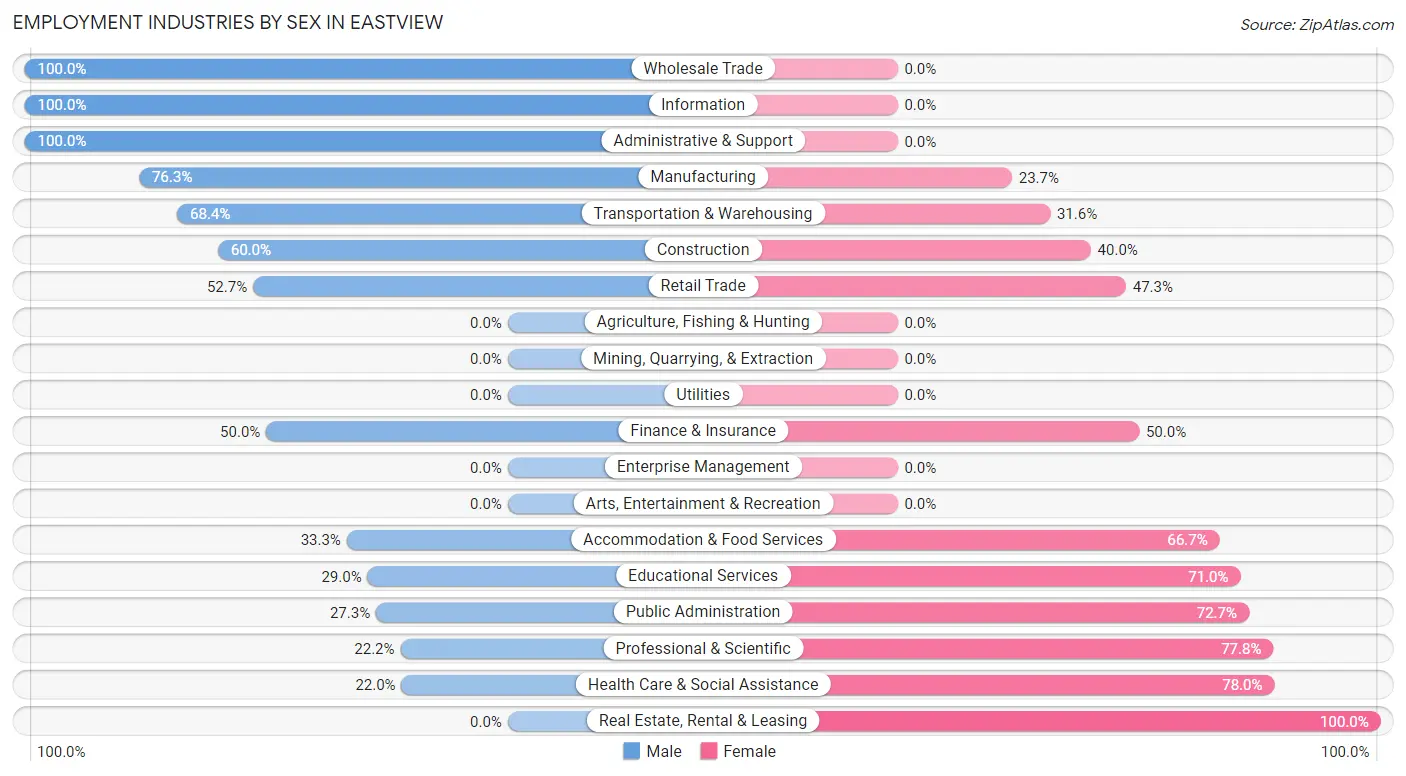
The Eastview industries that see more men than women are Wholesale Trade (100.0%), Information (100.0%), and Administrative & Support (100.0%), whereas the industries that tend to have a higher number of women are Real Estate, Rental & Leasing (100.0%), Health Care & Social Assistance (78.0%), and Professional & Scientific (77.8%).
| Industry | Male | Female |
| Agriculture, Fishing & Hunting | 0 (0.0%) | 0 (0.0%) |
| Mining, Quarrying, & Extraction | 0 (0.0%) | 0 (0.0%) |
| Construction | 3 (60.0%) | 2 (40.0%) |
| Manufacturing | 87 (76.3%) | 27 (23.7%) |
| Wholesale Trade | 6 (100.0%) | 0 (0.0%) |
| Retail Trade | 29 (52.7%) | 26 (47.3%) |
| Transportation & Warehousing | 13 (68.4%) | 6 (31.6%) |
| Utilities | 0 (0.0%) | 0 (0.0%) |
| Information | 16 (100.0%) | 0 (0.0%) |
| Finance & Insurance | 2 (50.0%) | 2 (50.0%) |
| Real Estate, Rental & Leasing | 0 (0.0%) | 2 (100.0%) |
| Professional & Scientific | 2 (22.2%) | 7 (77.8%) |
| Enterprise Management | 0 (0.0%) | 0 (0.0%) |
| Administrative & Support | 3 (100.0%) | 0 (0.0%) |
| Educational Services | 9 (29.0%) | 22 (71.0%) |
| Health Care & Social Assistance | 11 (22.0%) | 39 (78.0%) |
| Arts, Entertainment & Recreation | 0 (0.0%) | 0 (0.0%) |
| Accommodation & Food Services | 5 (33.3%) | 10 (66.7%) |
| Public Administration | 3 (27.3%) | 8 (72.7%) |
| Total | 206 (57.2%) | 154 (42.8%) |
Education in Eastview
School Enrollment in Eastview
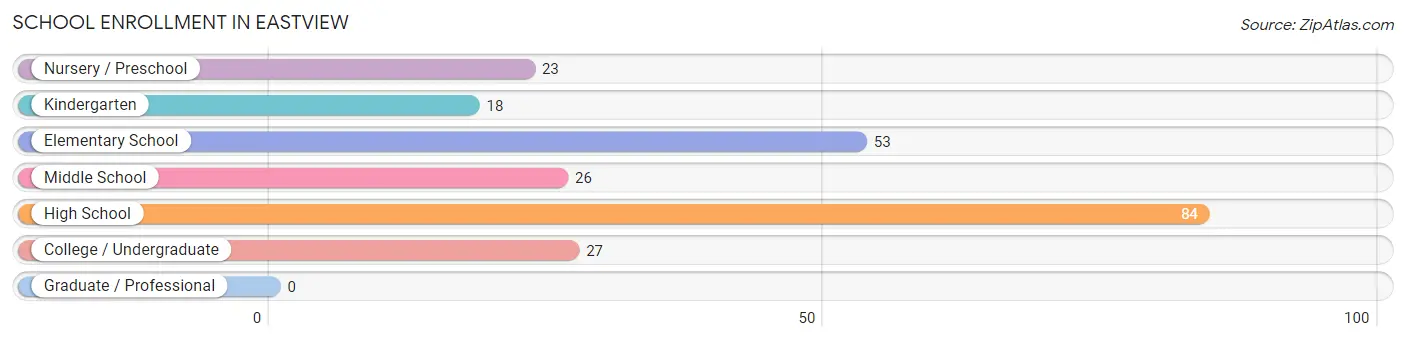
The most common levels of schooling among the 231 students in Eastview are high school (84 | 36.4%), elementary school (53 | 22.9%), and college / undergraduate (27 | 11.7%).
| School Level | # Students | % Students |
| Nursery / Preschool | 23 | 10.0% |
| Kindergarten | 18 | 7.8% |
| Elementary School | 53 | 22.9% |
| Middle School | 26 | 11.3% |
| High School | 84 | 36.4% |
| College / Undergraduate | 27 | 11.7% |
| Graduate / Professional | 0 | 0.0% |
| Total | 231 | 100.0% |
School Enrollment by Age by Funding Source in Eastview
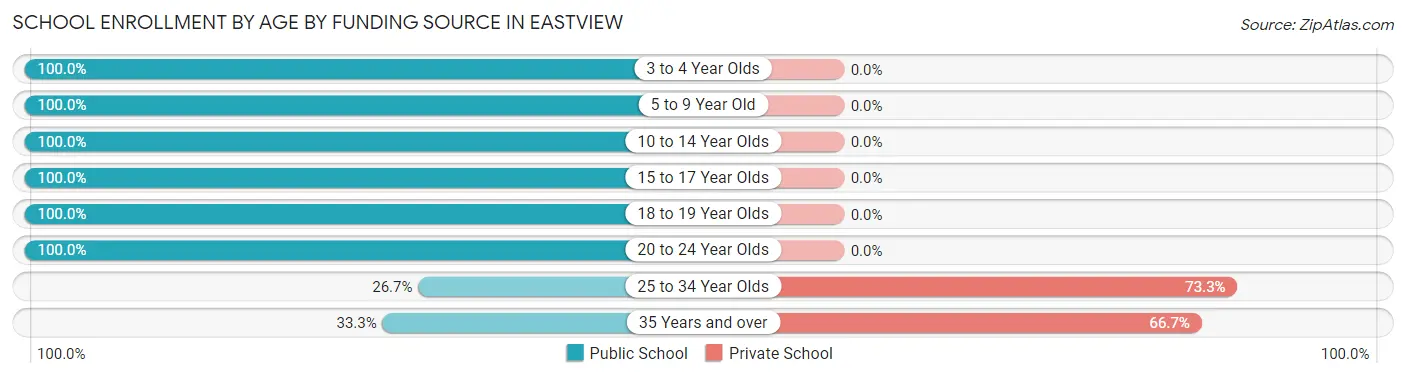
Out of a total of 231 students who are enrolled in schools in Eastview, 17 (7.4%) attend a private institution, while the remaining 214 (92.6%) are enrolled in public schools. The age group of 25 to 34 year olds has the highest likelihood of being enrolled in private schools, with 11 (73.3% in the age bracket) enrolled. Conversely, the age group of 3 to 4 year olds has the lowest likelihood of being enrolled in a private school, with 14 (100.0% in the age bracket) attending a public institution.
| Age Bracket | Public School | Private School |
| 3 to 4 Year Olds | 14 (100.0%) | 0 (0.0%) |
| 5 to 9 Year Old | 71 (100.0%) | 0 (0.0%) |
| 10 to 14 Year Olds | 47 (100.0%) | 0 (0.0%) |
| 15 to 17 Year Olds | 61 (100.0%) | 0 (0.0%) |
| 18 to 19 Year Olds | 11 (100.0%) | 0 (0.0%) |
| 20 to 24 Year Olds | 3 (100.0%) | 0 (0.0%) |
| 25 to 34 Year Olds | 4 (26.7%) | 11 (73.3%) |
| 35 Years and over | 3 (33.3%) | 6 (66.7%) |
| Total | 214 (92.6%) | 17 (7.4%) |
Educational Attainment by Field of Study in Eastview
Business (22 | 24.7%), science & technology (20 | 22.5%), education (13 | 14.6%), psychology (8 | 9.0%), and engineering (6 | 6.7%) are the most common fields of study among 89 individuals in Eastview who have obtained a bachelor's degree or higher.
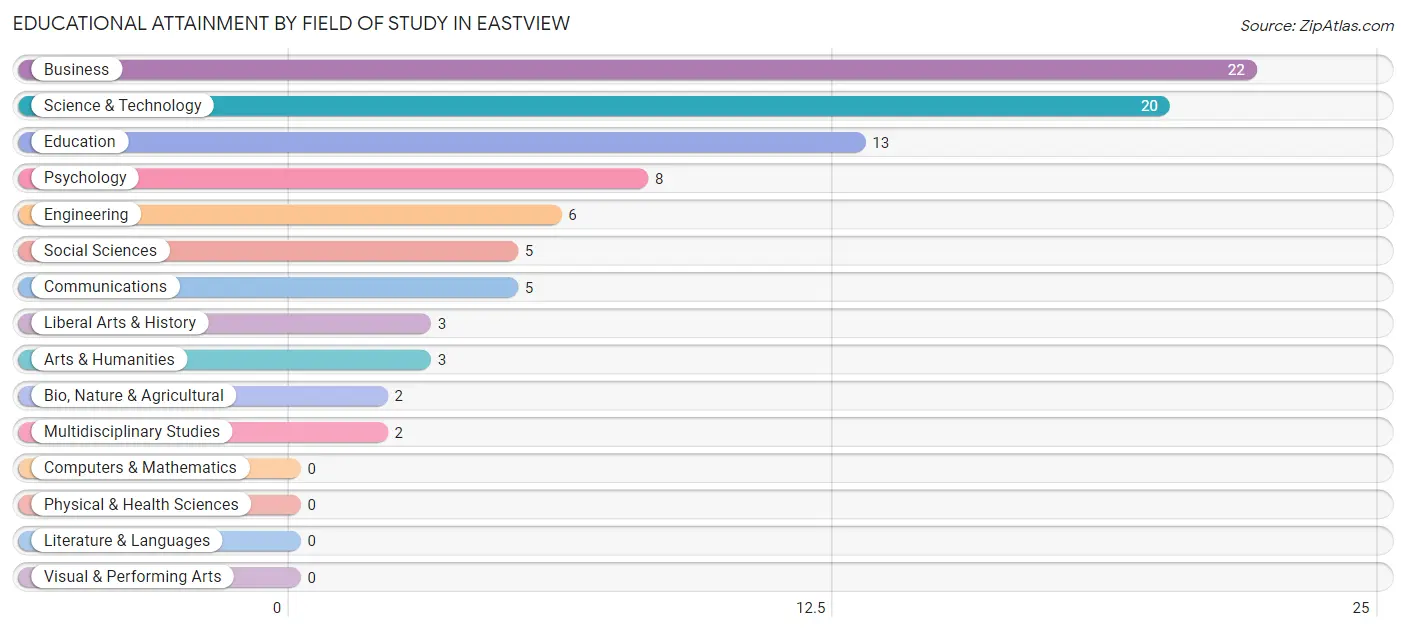
| Field of Study | # Graduates | % Graduates |
| Computers & Mathematics | 0 | 0.0% |
| Bio, Nature & Agricultural | 2 | 2.2% |
| Physical & Health Sciences | 0 | 0.0% |
| Psychology | 8 | 9.0% |
| Social Sciences | 5 | 5.6% |
| Engineering | 6 | 6.7% |
| Multidisciplinary Studies | 2 | 2.2% |
| Science & Technology | 20 | 22.5% |
| Business | 22 | 24.7% |
| Education | 13 | 14.6% |
| Literature & Languages | 0 | 0.0% |
| Liberal Arts & History | 3 | 3.4% |
| Visual & Performing Arts | 0 | 0.0% |
| Communications | 5 | 5.6% |
| Arts & Humanities | 3 | 3.4% |
| Total | 89 | 100.0% |
Transportation & Commute in Eastview
Vehicle Availability by Sex in Eastview
The most prevalent vehicle ownership categories in Eastview are males with 3 vehicles (125, accounting for 61.9%) and females with 3 vehicles (60, making up 82.8%).
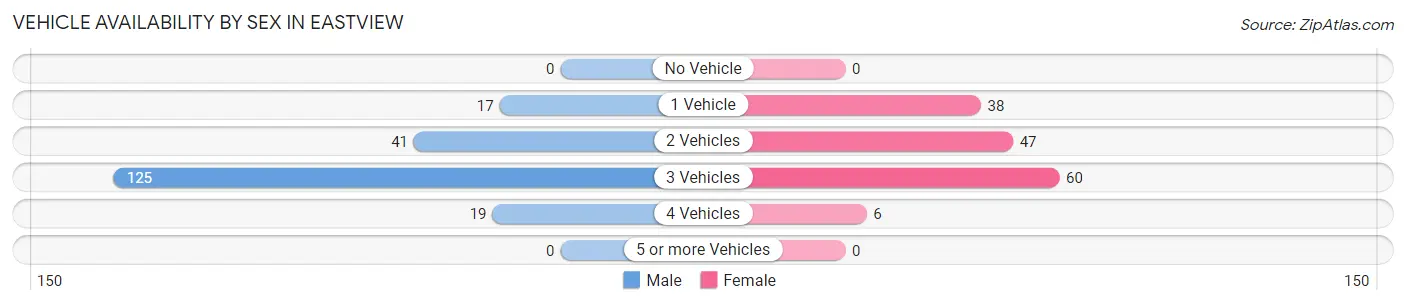
| Vehicles Available | Male | Female |
| No Vehicle | 0 (0.0%) | 0 (0.0%) |
| 1 Vehicle | 17 (8.4%) | 38 (25.2%) |
| 2 Vehicles | 41 (20.3%) | 47 (31.1%) |
| 3 Vehicles | 125 (61.9%) | 60 (39.7%) |
| 4 Vehicles | 19 (9.4%) | 6 (4.0%) |
| 5 or more Vehicles | 0 (0.0%) | 0 (0.0%) |
| Total | 202 (100.0%) | 151 (100.0%) |
Commute Time in Eastview
The most frequently occuring commute durations in Eastview are 45 to 59 minutes (68 commuters, 20.7%), 20 to 24 minutes (54 commuters, 16.5%), and 15 to 19 minutes (53 commuters, 16.2%).
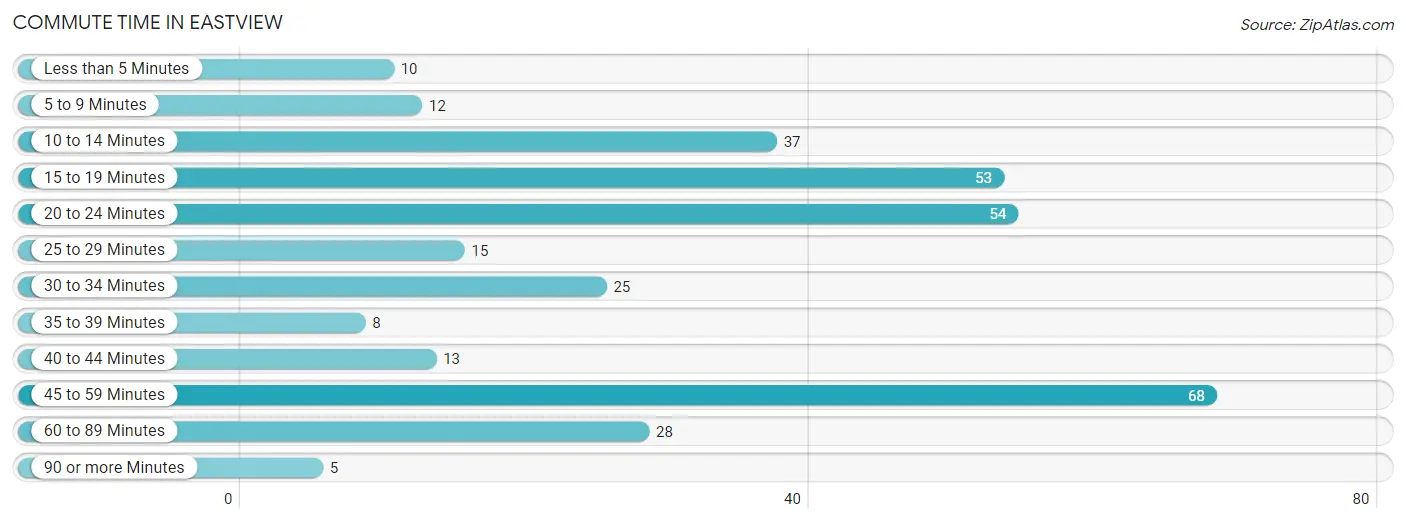
| Commute Time | # Commuters | % Commuters |
| Less than 5 Minutes | 10 | 3.0% |
| 5 to 9 Minutes | 12 | 3.7% |
| 10 to 14 Minutes | 37 | 11.3% |
| 15 to 19 Minutes | 53 | 16.2% |
| 20 to 24 Minutes | 54 | 16.5% |
| 25 to 29 Minutes | 15 | 4.6% |
| 30 to 34 Minutes | 25 | 7.6% |
| 35 to 39 Minutes | 8 | 2.4% |
| 40 to 44 Minutes | 13 | 4.0% |
| 45 to 59 Minutes | 68 | 20.7% |
| 60 to 89 Minutes | 28 | 8.5% |
| 90 or more Minutes | 5 | 1.5% |
Commute Time by Sex in Eastview
The most common commute times in Eastview are 20 to 24 minutes (32 commuters, 17.8%) for males and 45 to 59 minutes (36 commuters, 24.3%) for females.
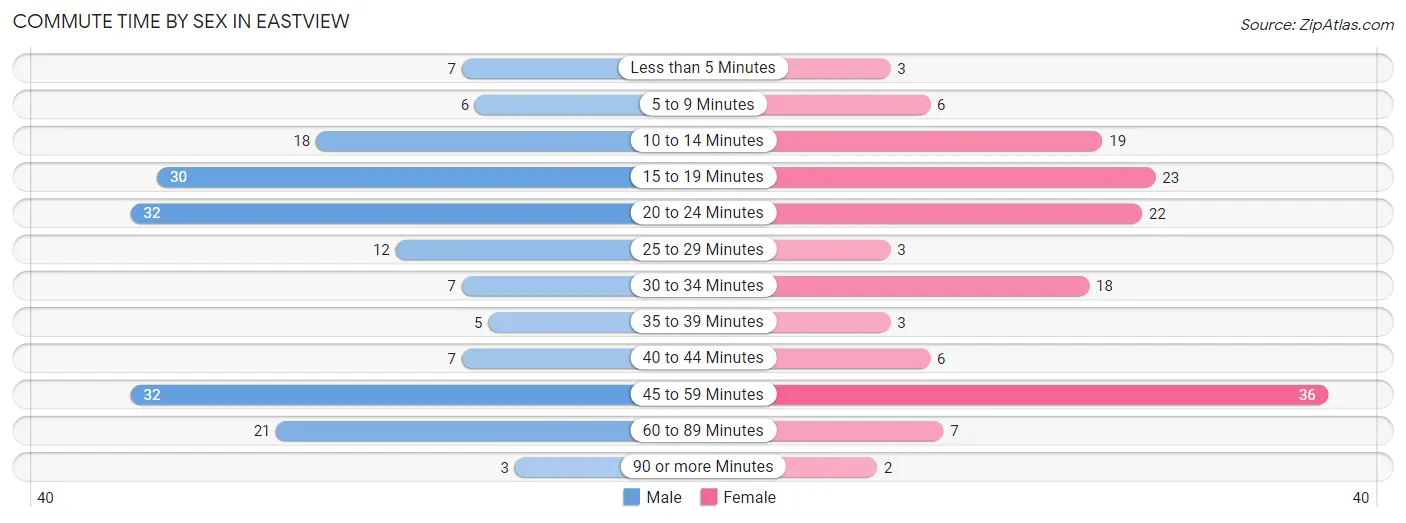
| Commute Time | Male | Female |
| Less than 5 Minutes | 7 (3.9%) | 3 (2.0%) |
| 5 to 9 Minutes | 6 (3.3%) | 6 (4.1%) |
| 10 to 14 Minutes | 18 (10.0%) | 19 (12.8%) |
| 15 to 19 Minutes | 30 (16.7%) | 23 (15.5%) |
| 20 to 24 Minutes | 32 (17.8%) | 22 (14.9%) |
| 25 to 29 Minutes | 12 (6.7%) | 3 (2.0%) |
| 30 to 34 Minutes | 7 (3.9%) | 18 (12.2%) |
| 35 to 39 Minutes | 5 (2.8%) | 3 (2.0%) |
| 40 to 44 Minutes | 7 (3.9%) | 6 (4.1%) |
| 45 to 59 Minutes | 32 (17.8%) | 36 (24.3%) |
| 60 to 89 Minutes | 21 (11.7%) | 7 (4.7%) |
| 90 or more Minutes | 3 (1.7%) | 2 (1.3%) |
Time of Departure to Work by Sex in Eastview
The most frequent times of departure to work in Eastview are 7:00 AM to 7:29 AM (37, 20.6%) for males and 7:30 AM to 7:59 AM (32, 21.6%) for females.
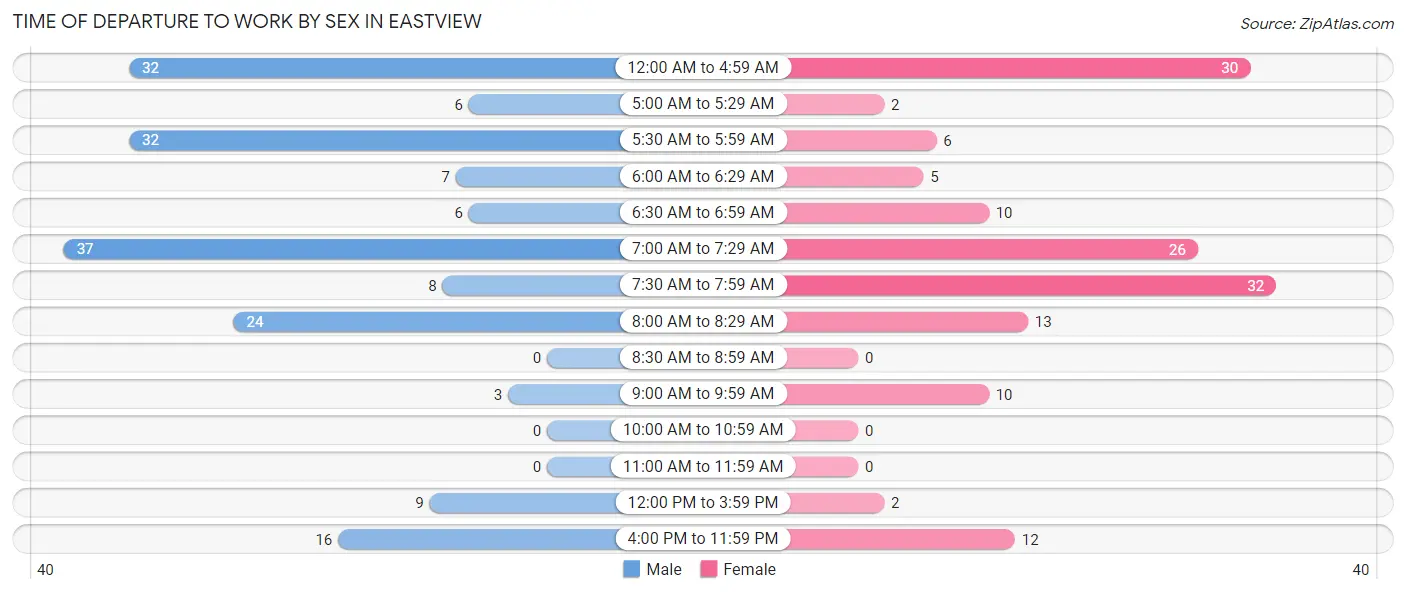
| Time of Departure | Male | Female |
| 12:00 AM to 4:59 AM | 32 (17.8%) | 30 (20.3%) |
| 5:00 AM to 5:29 AM | 6 (3.3%) | 2 (1.3%) |
| 5:30 AM to 5:59 AM | 32 (17.8%) | 6 (4.1%) |
| 6:00 AM to 6:29 AM | 7 (3.9%) | 5 (3.4%) |
| 6:30 AM to 6:59 AM | 6 (3.3%) | 10 (6.8%) |
| 7:00 AM to 7:29 AM | 37 (20.6%) | 26 (17.6%) |
| 7:30 AM to 7:59 AM | 8 (4.4%) | 32 (21.6%) |
| 8:00 AM to 8:29 AM | 24 (13.3%) | 13 (8.8%) |
| 8:30 AM to 8:59 AM | 0 (0.0%) | 0 (0.0%) |
| 9:00 AM to 9:59 AM | 3 (1.7%) | 10 (6.8%) |
| 10:00 AM to 10:59 AM | 0 (0.0%) | 0 (0.0%) |
| 11:00 AM to 11:59 AM | 0 (0.0%) | 0 (0.0%) |
| 12:00 PM to 3:59 PM | 9 (5.0%) | 2 (1.3%) |
| 4:00 PM to 11:59 PM | 16 (8.9%) | 12 (8.1%) |
| Total | 180 (100.0%) | 148 (100.0%) |
Housing Occupancy in Eastview
Occupancy by Ownership in Eastview
Of the total 324 dwellings in Eastview, owner-occupied units account for 233 (71.9%), while renter-occupied units make up 91 (28.1%).
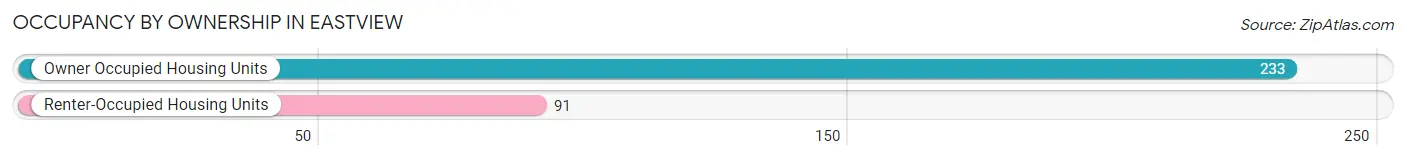
| Occupancy | # Housing Units | % Housing Units |
| Owner Occupied Housing Units | 233 | 71.9% |
| Renter-Occupied Housing Units | 91 | 28.1% |
| Total Occupied Housing Units | 324 | 100.0% |
Occupancy by Household Size in Eastview
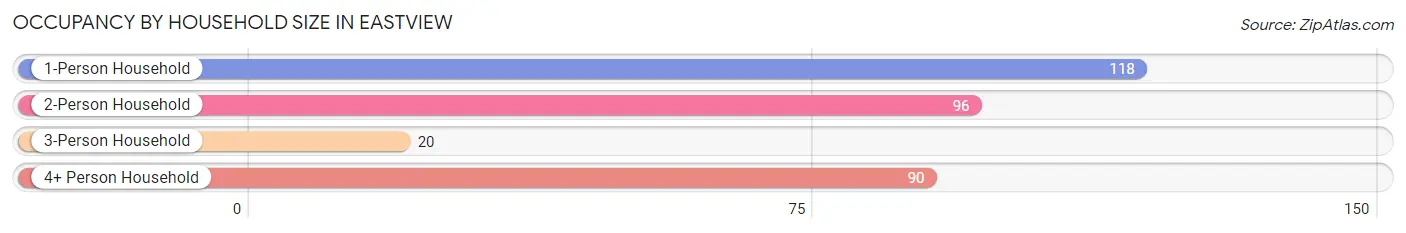
| Household Size | # Housing Units | % Housing Units |
| 1-Person Household | 118 | 36.4% |
| 2-Person Household | 96 | 29.6% |
| 3-Person Household | 20 | 6.2% |
| 4+ Person Household | 90 | 27.8% |
| Total Housing Units | 324 | 100.0% |
Occupancy by Ownership by Household Size in Eastview
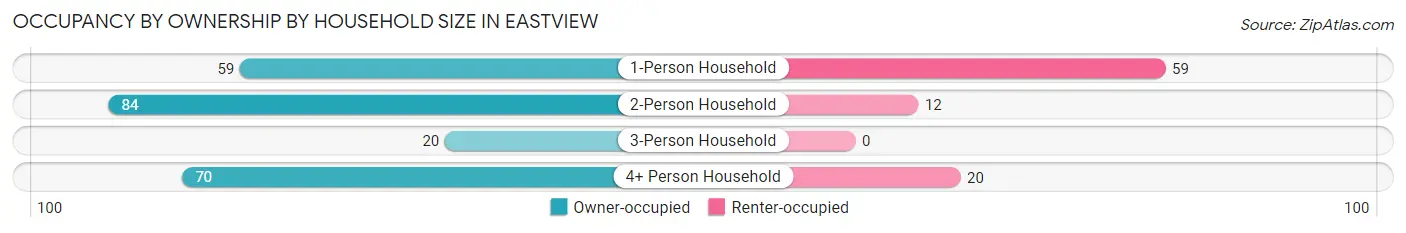
| Household Size | Owner-occupied | Renter-occupied |
| 1-Person Household | 59 (50.0%) | 59 (50.0%) |
| 2-Person Household | 84 (87.5%) | 12 (12.5%) |
| 3-Person Household | 20 (100.0%) | 0 (0.0%) |
| 4+ Person Household | 70 (77.8%) | 20 (22.2%) |
| Total Housing Units | 233 (71.9%) | 91 (28.1%) |
Occupancy by Educational Attainment in Eastview
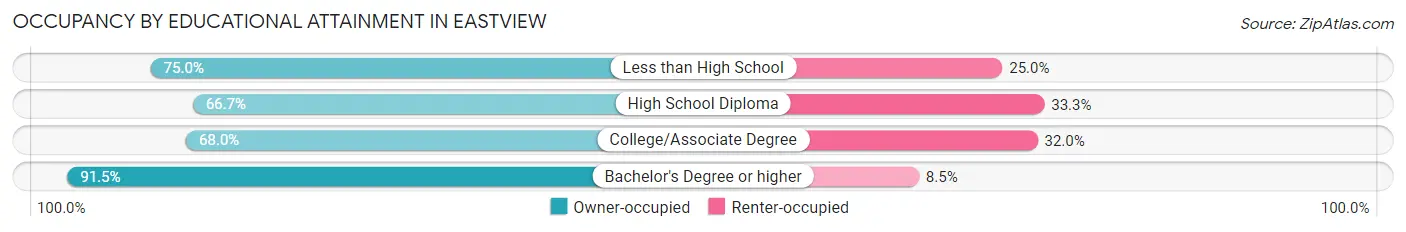
| Household Size | Owner-occupied | Renter-occupied |
| Less than High School | 6 (75.0%) | 2 (25.0%) |
| High School Diploma | 88 (66.7%) | 44 (33.3%) |
| College/Associate Degree | 85 (68.0%) | 40 (32.0%) |
| Bachelor's Degree or higher | 54 (91.5%) | 5 (8.5%) |
Occupancy by Age of Householder in Eastview
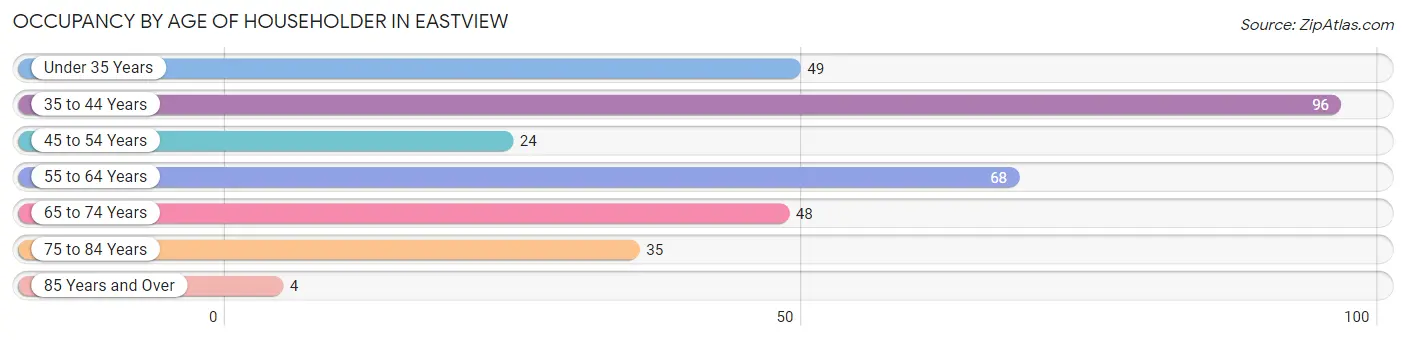
| Age Bracket | # Households | % Households |
| Under 35 Years | 49 | 15.1% |
| 35 to 44 Years | 96 | 29.6% |
| 45 to 54 Years | 24 | 7.4% |
| 55 to 64 Years | 68 | 21.0% |
| 65 to 74 Years | 48 | 14.8% |
| 75 to 84 Years | 35 | 10.8% |
| 85 Years and Over | 4 | 1.2% |
| Total | 324 | 100.0% |
Housing Finances in Eastview
Median Income by Occupancy in Eastview
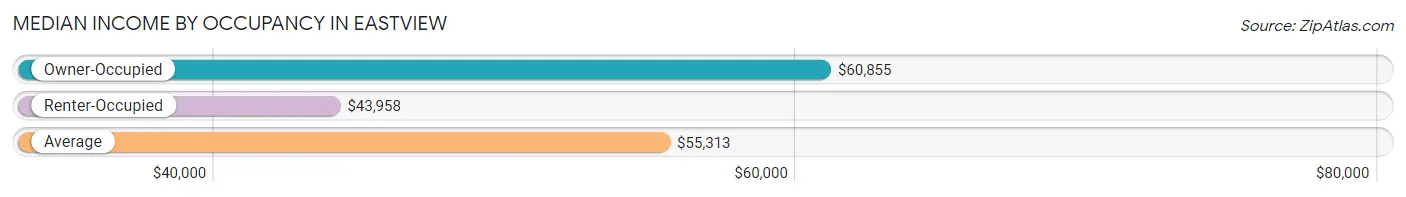
| Occupancy Type | # Households | Median Income |
| Owner-Occupied | 233 (71.9%) | $60,855 |
| Renter-Occupied | 91 (28.1%) | $43,958 |
| Average | 324 (100.0%) | $55,313 |
Occupancy by Householder Income Bracket in Eastview
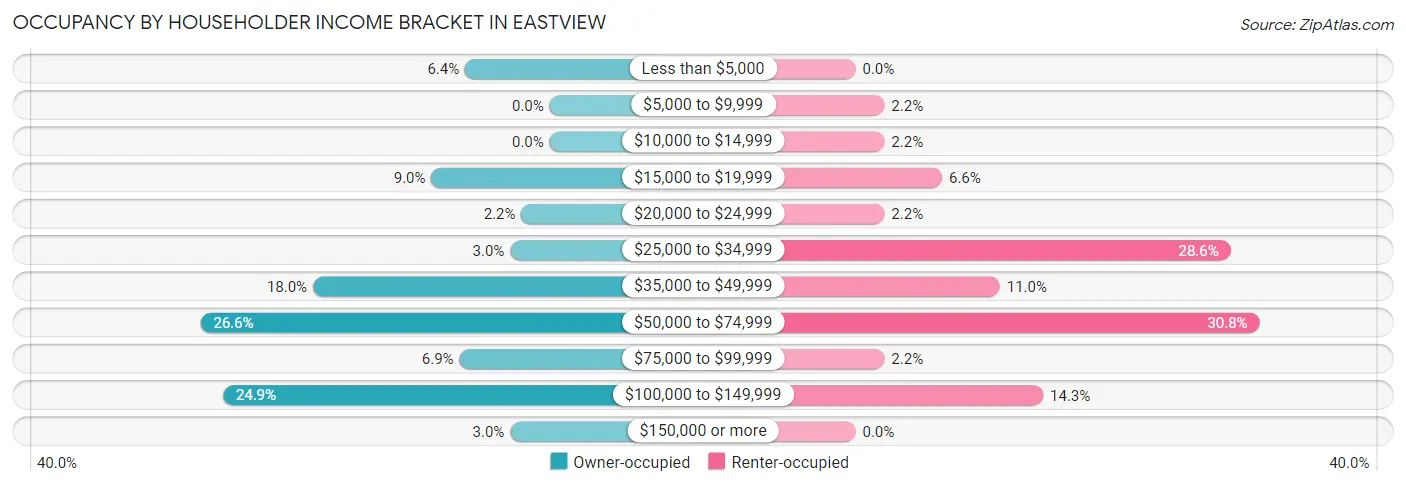
| Income Bracket | Owner-occupied | Renter-occupied |
| Less than $5,000 | 15 (6.4%) | 0 (0.0%) |
| $5,000 to $9,999 | 0 (0.0%) | 2 (2.2%) |
| $10,000 to $14,999 | 0 (0.0%) | 2 (2.2%) |
| $15,000 to $19,999 | 21 (9.0%) | 6 (6.6%) |
| $20,000 to $24,999 | 5 (2.1%) | 2 (2.2%) |
| $25,000 to $34,999 | 7 (3.0%) | 26 (28.6%) |
| $35,000 to $49,999 | 42 (18.0%) | 10 (11.0%) |
| $50,000 to $74,999 | 62 (26.6%) | 28 (30.8%) |
| $75,000 to $99,999 | 16 (6.9%) | 2 (2.2%) |
| $100,000 to $149,999 | 58 (24.9%) | 13 (14.3%) |
| $150,000 or more | 7 (3.0%) | 0 (0.0%) |
| Total | 233 (100.0%) | 91 (100.0%) |
Monthly Housing Cost Tiers in Eastview
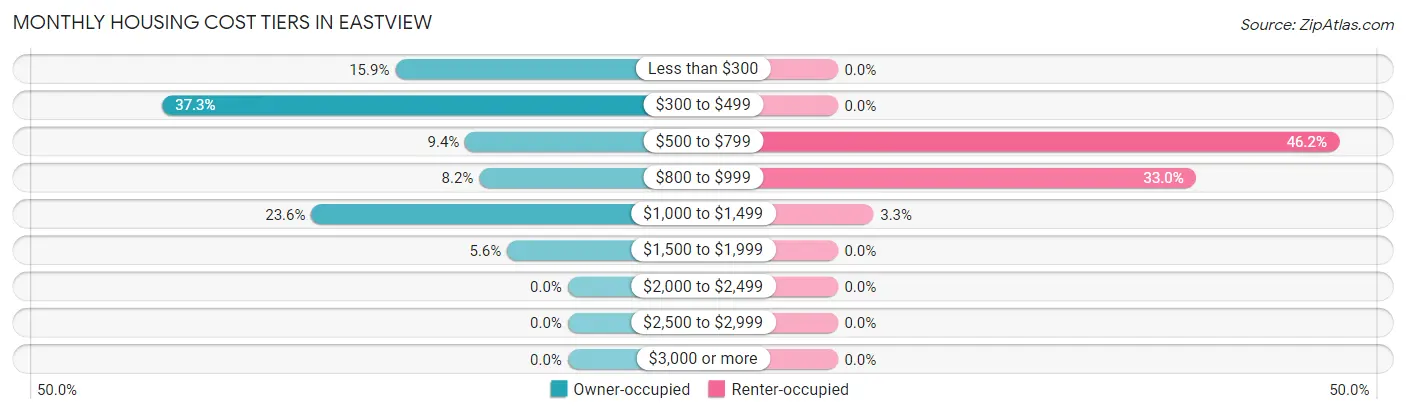
| Monthly Cost | Owner-occupied | Renter-occupied |
| Less than $300 | 37 (15.9%) | 0 (0.0%) |
| $300 to $499 | 87 (37.3%) | 0 (0.0%) |
| $500 to $799 | 22 (9.4%) | 42 (46.2%) |
| $800 to $999 | 19 (8.2%) | 30 (33.0%) |
| $1,000 to $1,499 | 55 (23.6%) | 3 (3.3%) |
| $1,500 to $1,999 | 13 (5.6%) | 0 (0.0%) |
| $2,000 to $2,499 | 0 (0.0%) | 0 (0.0%) |
| $2,500 to $2,999 | 0 (0.0%) | 0 (0.0%) |
| $3,000 or more | 0 (0.0%) | 0 (0.0%) |
| Total | 233 (100.0%) | 91 (100.0%) |
Physical Housing Characteristics in Eastview
Housing Structures in Eastview
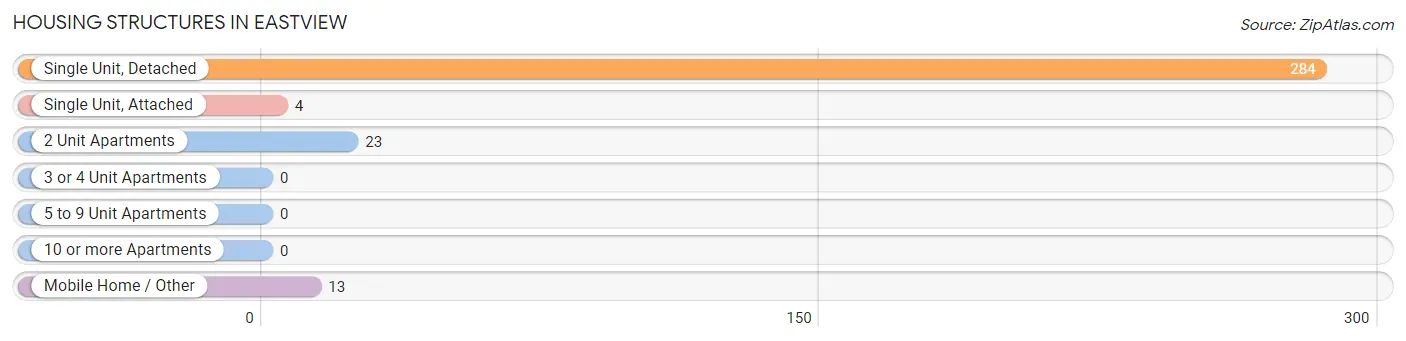
| Structure Type | # Housing Units | % Housing Units |
| Single Unit, Detached | 284 | 87.6% |
| Single Unit, Attached | 4 | 1.2% |
| 2 Unit Apartments | 23 | 7.1% |
| 3 or 4 Unit Apartments | 0 | 0.0% |
| 5 to 9 Unit Apartments | 0 | 0.0% |
| 10 or more Apartments | 0 | 0.0% |
| Mobile Home / Other | 13 | 4.0% |
| Total | 324 | 100.0% |
Housing Structures by Occupancy in Eastview
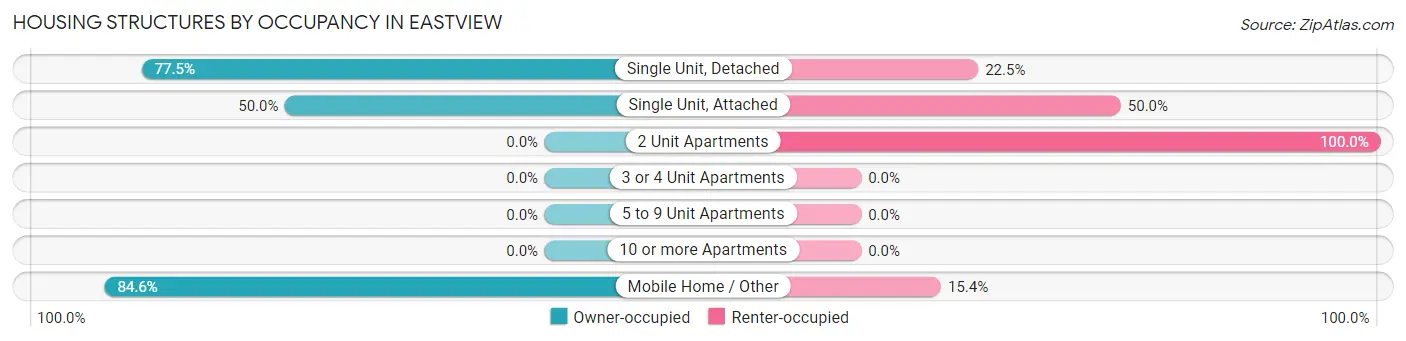
| Structure Type | Owner-occupied | Renter-occupied |
| Single Unit, Detached | 220 (77.5%) | 64 (22.5%) |
| Single Unit, Attached | 2 (50.0%) | 2 (50.0%) |
| 2 Unit Apartments | 0 (0.0%) | 23 (100.0%) |
| 3 or 4 Unit Apartments | 0 (0.0%) | 0 (0.0%) |
| 5 to 9 Unit Apartments | 0 (0.0%) | 0 (0.0%) |
| 10 or more Apartments | 0 (0.0%) | 0 (0.0%) |
| Mobile Home / Other | 11 (84.6%) | 2 (15.4%) |
| Total | 233 (71.9%) | 91 (28.1%) |
Housing Structures by Number of Rooms in Eastview
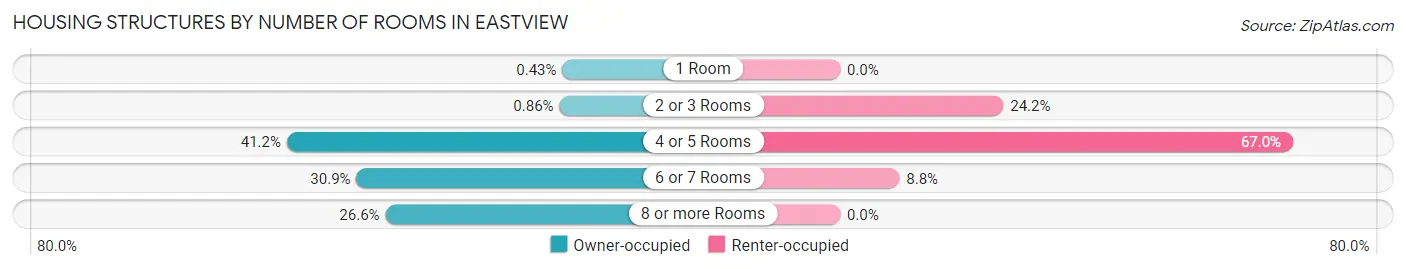
| Number of Rooms | Owner-occupied | Renter-occupied |
| 1 Room | 1 (0.4%) | 0 (0.0%) |
| 2 or 3 Rooms | 2 (0.9%) | 22 (24.2%) |
| 4 or 5 Rooms | 96 (41.2%) | 61 (67.0%) |
| 6 or 7 Rooms | 72 (30.9%) | 8 (8.8%) |
| 8 or more Rooms | 62 (26.6%) | 0 (0.0%) |
| Total | 233 (100.0%) | 91 (100.0%) |
Housing Structure by Heating Type in Eastview
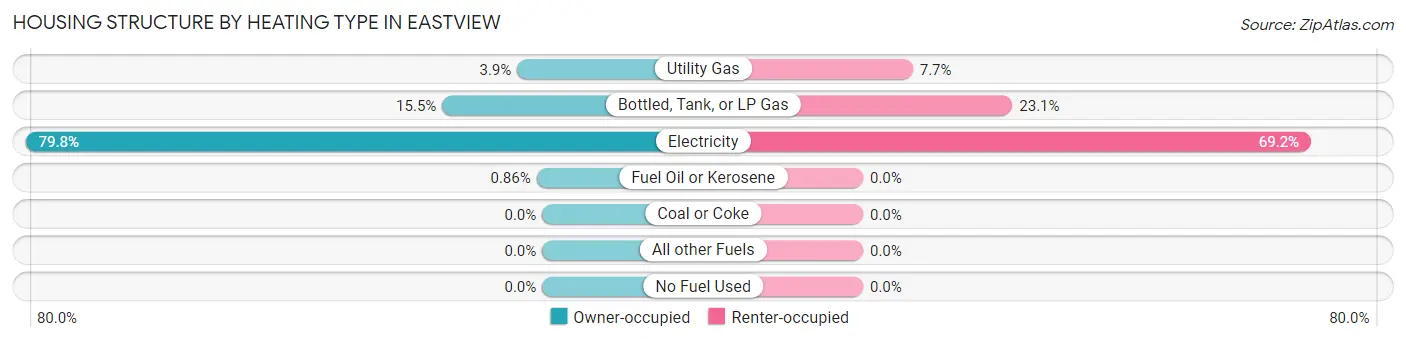
| Heating Type | Owner-occupied | Renter-occupied |
| Utility Gas | 9 (3.9%) | 7 (7.7%) |
| Bottled, Tank, or LP Gas | 36 (15.4%) | 21 (23.1%) |
| Electricity | 186 (79.8%) | 63 (69.2%) |
| Fuel Oil or Kerosene | 2 (0.9%) | 0 (0.0%) |
| Coal or Coke | 0 (0.0%) | 0 (0.0%) |
| All other Fuels | 0 (0.0%) | 0 (0.0%) |
| No Fuel Used | 0 (0.0%) | 0 (0.0%) |
| Total | 233 (100.0%) | 91 (100.0%) |
Household Vehicle Usage in Eastview
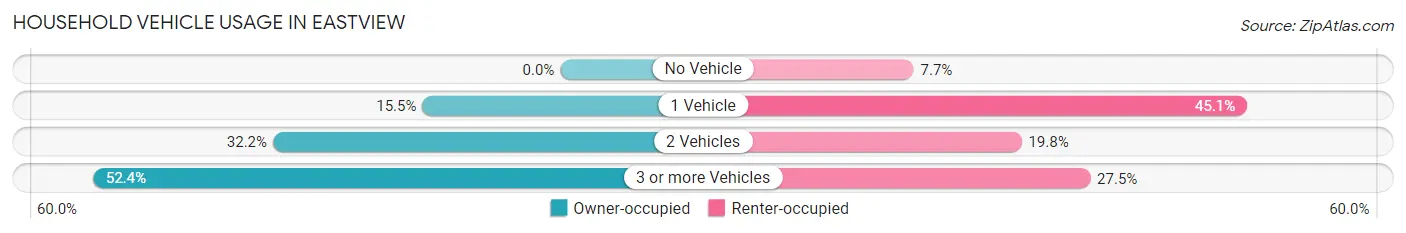
| Vehicles per Household | Owner-occupied | Renter-occupied |
| No Vehicle | 0 (0.0%) | 7 (7.7%) |
| 1 Vehicle | 36 (15.4%) | 41 (45.1%) |
| 2 Vehicles | 75 (32.2%) | 18 (19.8%) |
| 3 or more Vehicles | 122 (52.4%) | 25 (27.5%) |
| Total | 233 (100.0%) | 91 (100.0%) |
Real Estate & Mortgages in Eastview
Real Estate and Mortgage Overview in Eastview
| Characteristic | Without Mortgage | With Mortgage |
| Housing Units | 140 | 93 |
| Median Property Value | $104,700 | $128,900 |
| Median Household Income | $46,250 | $4 |
| Monthly Housing Costs | $335 | $0 |
| Real Estate Taxes | $449 | $0 |
Property Value by Mortgage Status in Eastview
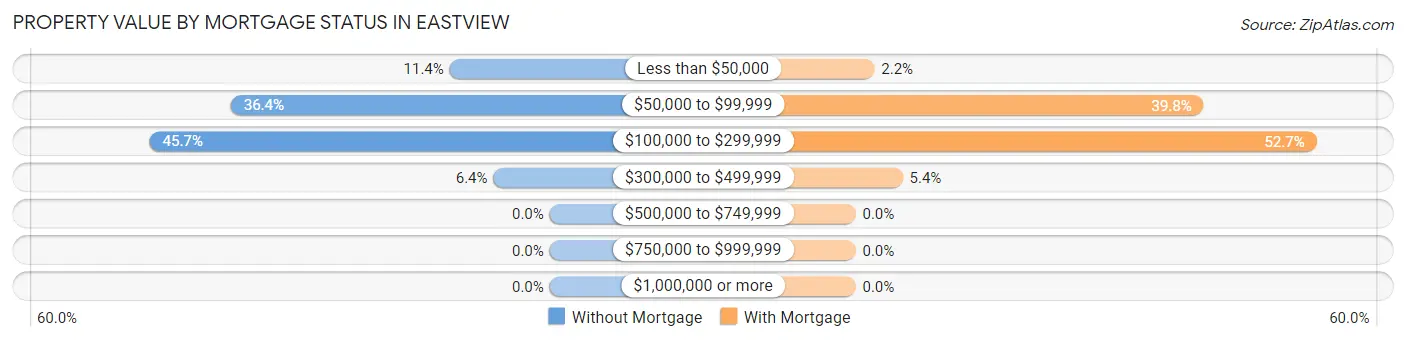
| Property Value | Without Mortgage | With Mortgage |
| Less than $50,000 | 16 (11.4%) | 2 (2.1%) |
| $50,000 to $99,999 | 51 (36.4%) | 37 (39.8%) |
| $100,000 to $299,999 | 64 (45.7%) | 49 (52.7%) |
| $300,000 to $499,999 | 9 (6.4%) | 5 (5.4%) |
| $500,000 to $749,999 | 0 (0.0%) | 0 (0.0%) |
| $750,000 to $999,999 | 0 (0.0%) | 0 (0.0%) |
| $1,000,000 or more | 0 (0.0%) | 0 (0.0%) |
| Total | 140 (100.0%) | 93 (100.0%) |
Household Income by Mortgage Status in Eastview
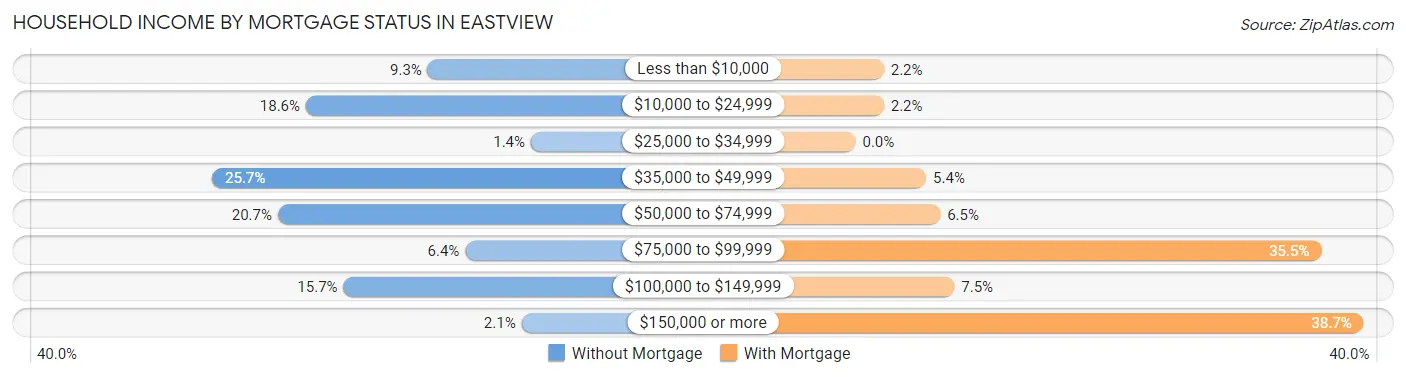
| Household Income | Without Mortgage | With Mortgage |
| Less than $10,000 | 13 (9.3%) | 2 (2.1%) |
| $10,000 to $24,999 | 26 (18.6%) | 2 (2.1%) |
| $25,000 to $34,999 | 2 (1.4%) | 0 (0.0%) |
| $35,000 to $49,999 | 36 (25.7%) | 5 (5.4%) |
| $50,000 to $74,999 | 29 (20.7%) | 6 (6.5%) |
| $75,000 to $99,999 | 9 (6.4%) | 33 (35.5%) |
| $100,000 to $149,999 | 22 (15.7%) | 7 (7.5%) |
| $150,000 or more | 3 (2.1%) | 36 (38.7%) |
| Total | 140 (100.0%) | 93 (100.0%) |
Property Value to Household Income Ratio in Eastview
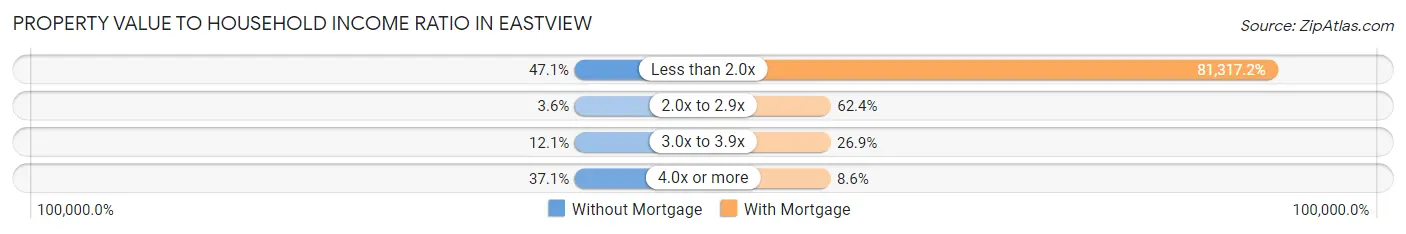
| Value-to-Income Ratio | Without Mortgage | With Mortgage |
| Less than 2.0x | 66 (47.1%) | 75,625 (81,317.2%) |
| 2.0x to 2.9x | 5 (3.6%) | 58 (62.4%) |
| 3.0x to 3.9x | 17 (12.1%) | 25 (26.9%) |
| 4.0x or more | 52 (37.1%) | 8 (8.6%) |
| Total | 140 (100.0%) | 93 (100.0%) |
Real Estate Taxes by Mortgage Status in Eastview
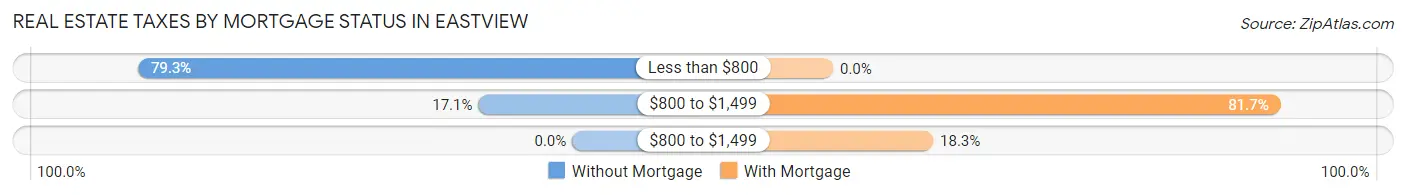
| Property Taxes | Without Mortgage | With Mortgage |
| Less than $800 | 111 (79.3%) | 0 (0.0%) |
| $800 to $1,499 | 24 (17.1%) | 76 (81.7%) |
| $800 to $1,499 | 0 (0.0%) | 17 (18.3%) |
| Total | 140 (100.0%) | 93 (100.0%) |
Health & Disability in Eastview
Health Insurance Coverage by Age in Eastview
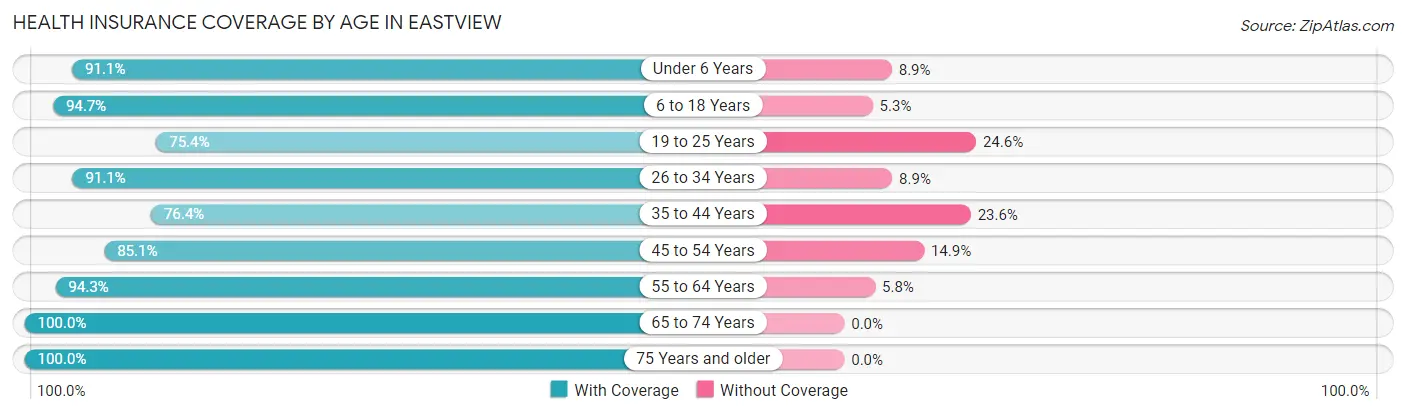
| Age Bracket | With Coverage | Without Coverage |
| Under 6 Years | 72 (91.1%) | 7 (8.9%) |
| 6 to 18 Years | 197 (94.7%) | 11 (5.3%) |
| 19 to 25 Years | 43 (75.4%) | 14 (24.6%) |
| 26 to 34 Years | 51 (91.1%) | 5 (8.9%) |
| 35 to 44 Years | 107 (76.4%) | 33 (23.6%) |
| 45 to 54 Years | 63 (85.1%) | 11 (14.9%) |
| 55 to 64 Years | 82 (94.3%) | 5 (5.8%) |
| 65 to 74 Years | 85 (100.0%) | 0 (0.0%) |
| 75 Years and older | 49 (100.0%) | 0 (0.0%) |
| Total | 749 (89.7%) | 86 (10.3%) |
Health Insurance Coverage by Citizenship Status in Eastview
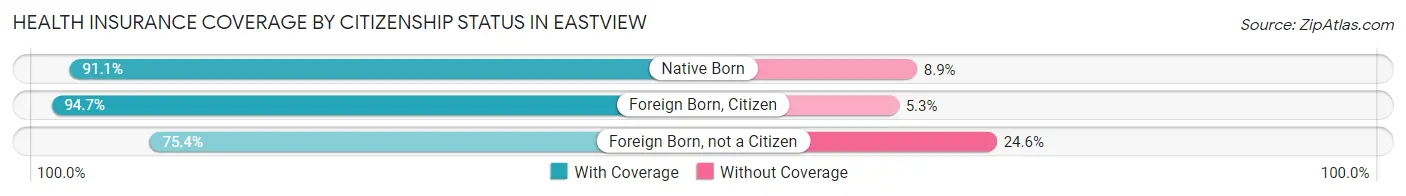
| Citizenship Status | With Coverage | Without Coverage |
| Native Born | 72 (91.1%) | 7 (8.9%) |
| Foreign Born, Citizen | 197 (94.7%) | 11 (5.3%) |
| Foreign Born, not a Citizen | 43 (75.4%) | 14 (24.6%) |
Health Insurance Coverage by Household Income in Eastview
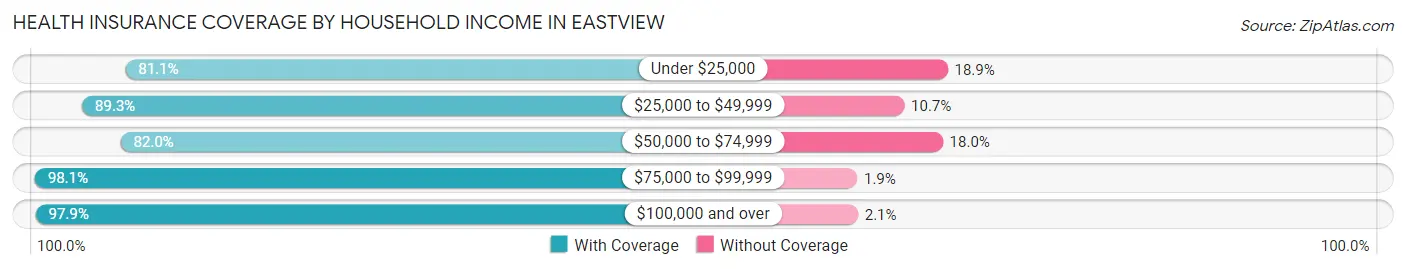
| Household Income | With Coverage | Without Coverage |
| Under $25,000 | 43 (81.1%) | 10 (18.9%) |
| $25,000 to $49,999 | 216 (89.3%) | 26 (10.7%) |
| $50,000 to $74,999 | 201 (82.0%) | 44 (18.0%) |
| $75,000 to $99,999 | 51 (98.1%) | 1 (1.9%) |
| $100,000 and over | 238 (97.9%) | 5 (2.1%) |
Public vs Private Health Insurance Coverage by Age in Eastview
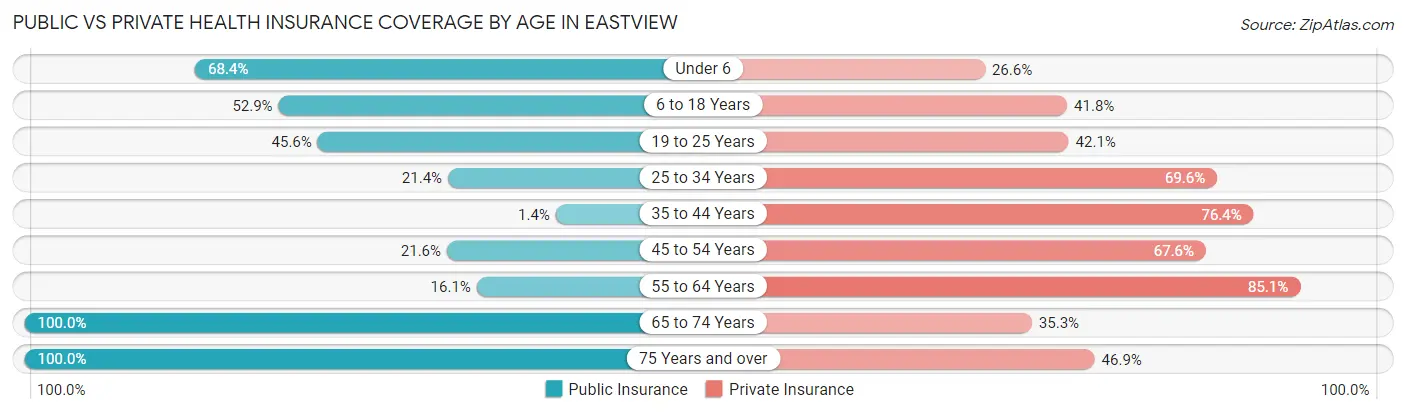
| Age Bracket | Public Insurance | Private Insurance |
| Under 6 | 54 (68.3%) | 21 (26.6%) |
| 6 to 18 Years | 110 (52.9%) | 87 (41.8%) |
| 19 to 25 Years | 26 (45.6%) | 24 (42.1%) |
| 25 to 34 Years | 12 (21.4%) | 39 (69.6%) |
| 35 to 44 Years | 2 (1.4%) | 107 (76.4%) |
| 45 to 54 Years | 16 (21.6%) | 50 (67.6%) |
| 55 to 64 Years | 14 (16.1%) | 74 (85.1%) |
| 65 to 74 Years | 85 (100.0%) | 30 (35.3%) |
| 75 Years and over | 49 (100.0%) | 23 (46.9%) |
| Total | 368 (44.1%) | 455 (54.5%) |
Disability Status by Sex by Age in Eastview
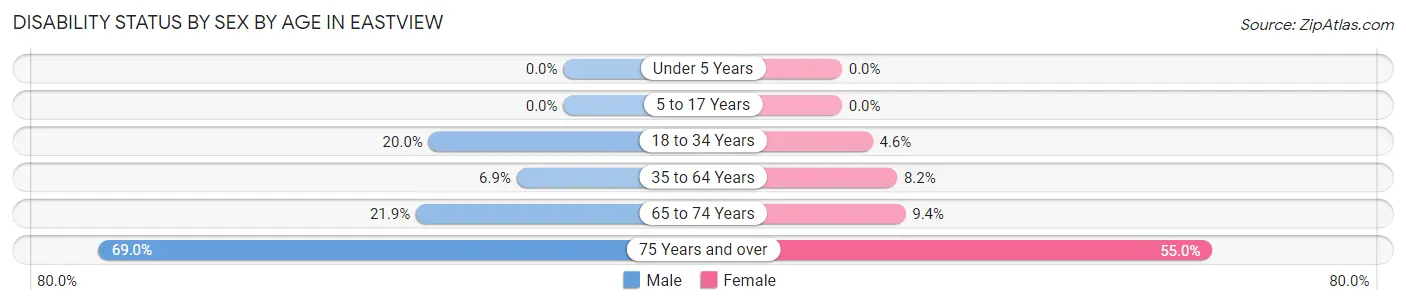
| Age Bracket | Male | Female |
| Under 5 Years | 0 (0.0%) | 0 (0.0%) |
| 5 to 17 Years | 0 (0.0%) | 0 (0.0%) |
| 18 to 34 Years | 17 (20.0%) | 3 (4.5%) |
| 35 to 64 Years | 9 (6.9%) | 14 (8.2%) |
| 65 to 74 Years | 7 (21.9%) | 5 (9.4%) |
| 75 Years and over | 20 (69.0%) | 11 (55.0%) |
Disability Class by Sex by Age in Eastview
Disability Class: Hearing Difficulty
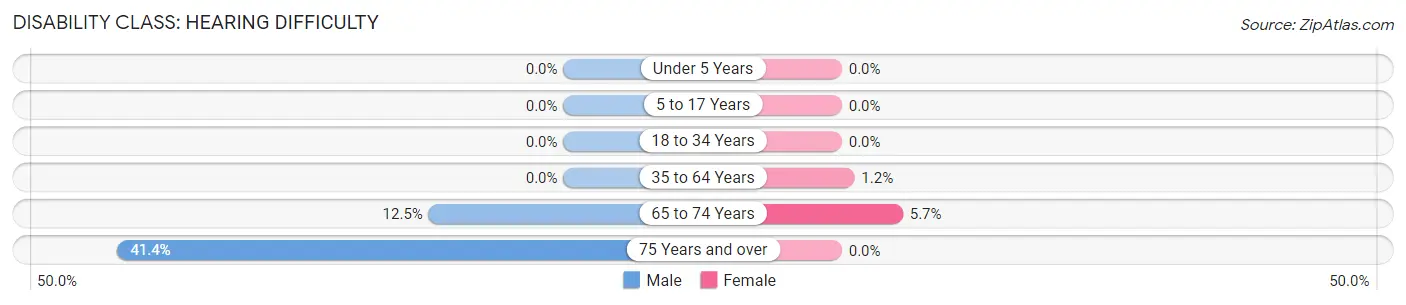
| Age Bracket | Male | Female |
| Under 5 Years | 0 (0.0%) | 0 (0.0%) |
| 5 to 17 Years | 0 (0.0%) | 0 (0.0%) |
| 18 to 34 Years | 0 (0.0%) | 0 (0.0%) |
| 35 to 64 Years | 0 (0.0%) | 2 (1.2%) |
| 65 to 74 Years | 4 (12.5%) | 3 (5.7%) |
| 75 Years and over | 12 (41.4%) | 0 (0.0%) |
Disability Class: Vision Difficulty
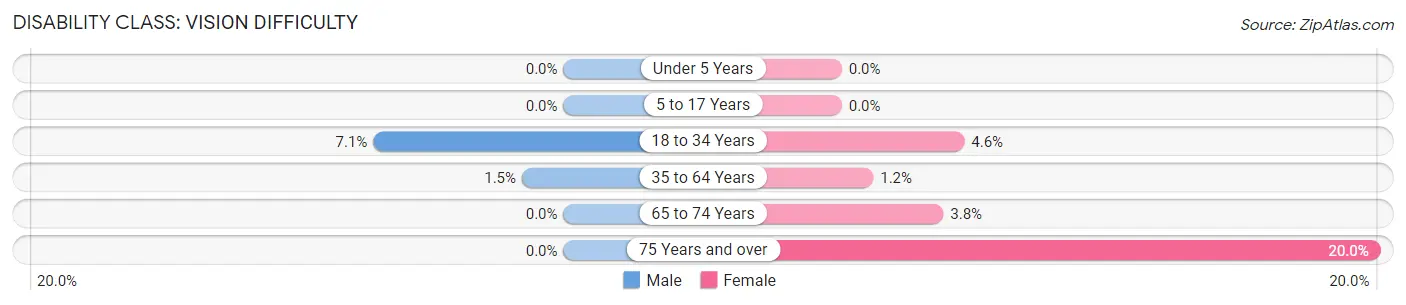
| Age Bracket | Male | Female |
| Under 5 Years | 0 (0.0%) | 0 (0.0%) |
| 5 to 17 Years | 0 (0.0%) | 0 (0.0%) |
| 18 to 34 Years | 6 (7.1%) | 3 (4.5%) |
| 35 to 64 Years | 2 (1.5%) | 2 (1.2%) |
| 65 to 74 Years | 0 (0.0%) | 2 (3.8%) |
| 75 Years and over | 0 (0.0%) | 4 (20.0%) |
Disability Class: Cognitive Difficulty
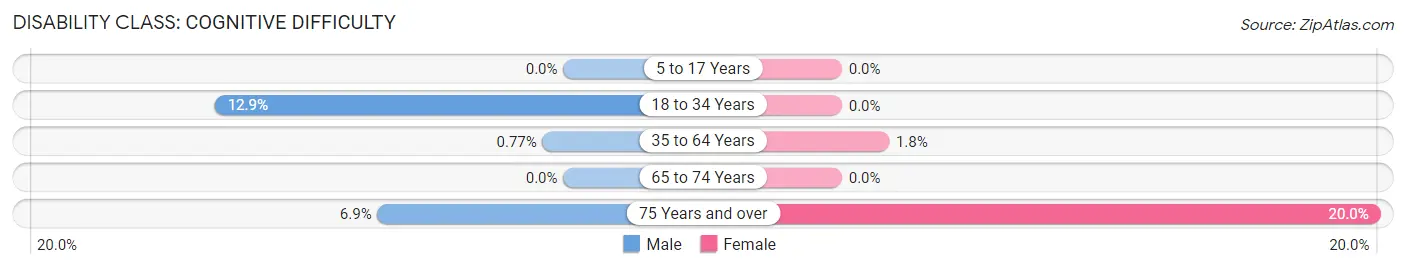
| Age Bracket | Male | Female |
| 5 to 17 Years | 0 (0.0%) | 0 (0.0%) |
| 18 to 34 Years | 11 (12.9%) | 0 (0.0%) |
| 35 to 64 Years | 1 (0.8%) | 3 (1.8%) |
| 65 to 74 Years | 0 (0.0%) | 0 (0.0%) |
| 75 Years and over | 2 (6.9%) | 4 (20.0%) |
Disability Class: Ambulatory Difficulty
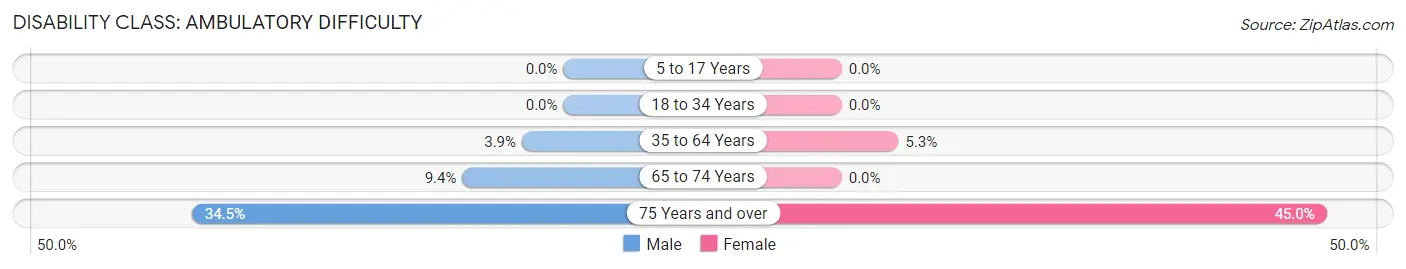
| Age Bracket | Male | Female |
| 5 to 17 Years | 0 (0.0%) | 0 (0.0%) |
| 18 to 34 Years | 0 (0.0%) | 0 (0.0%) |
| 35 to 64 Years | 5 (3.8%) | 9 (5.3%) |
| 65 to 74 Years | 3 (9.4%) | 0 (0.0%) |
| 75 Years and over | 10 (34.5%) | 9 (45.0%) |
Disability Class: Self-Care Difficulty
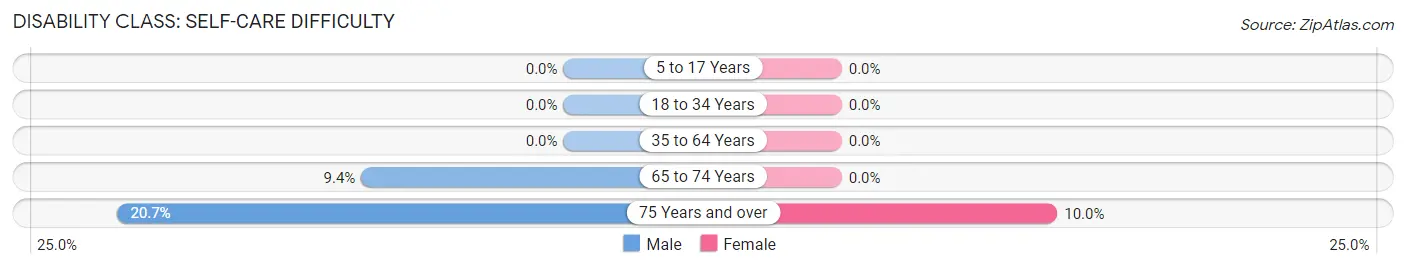
| Age Bracket | Male | Female |
| 5 to 17 Years | 0 (0.0%) | 0 (0.0%) |
| 18 to 34 Years | 0 (0.0%) | 0 (0.0%) |
| 35 to 64 Years | 0 (0.0%) | 0 (0.0%) |
| 65 to 74 Years | 3 (9.4%) | 0 (0.0%) |
| 75 Years and over | 6 (20.7%) | 2 (10.0%) |
Technology Access in Eastview
Computing Device Access in Eastview
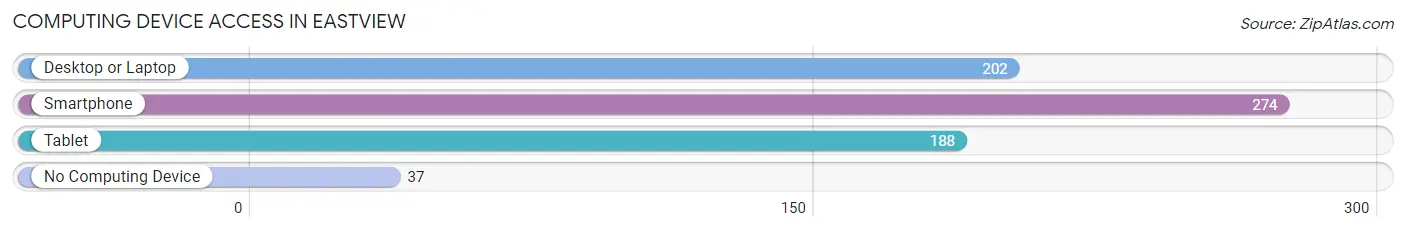
| Device Type | # Households | % Households |
| Desktop or Laptop | 202 | 62.4% |
| Smartphone | 274 | 84.6% |
| Tablet | 188 | 58.0% |
| No Computing Device | 37 | 11.4% |
| Total | 324 | 100.0% |
Internet Access in Eastview
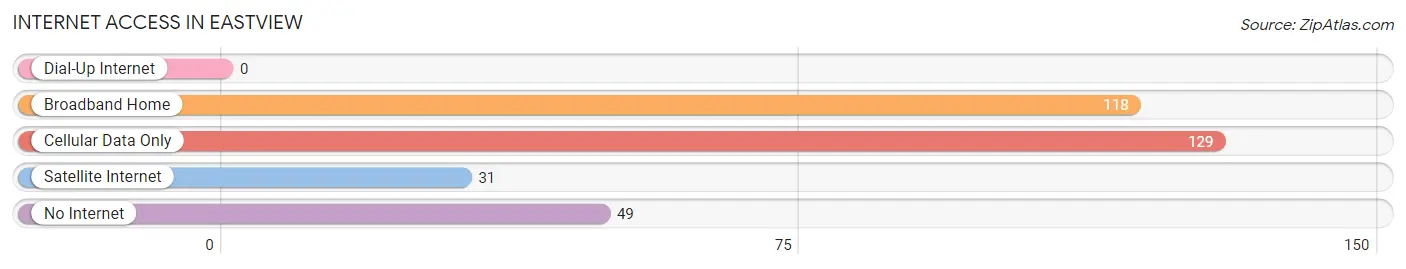
| Internet Type | # Households | % Households |
| Dial-Up Internet | 0 | 0.0% |
| Broadband Home | 118 | 36.4% |
| Cellular Data Only | 129 | 39.8% |
| Satellite Internet | 31 | 9.6% |
| No Internet | 49 | 15.1% |
| Total | 324 | 100.0% |
Eastview Summary
Eastview is a small town located in Fayette County, Tennessee. It is situated in the southwestern part of the state, about 25 miles east of Memphis. The town was founded in 1887 and has a population of approximately 1,000 people.
History
Eastview was founded in 1887 by a group of settlers from the nearby town of Somerville. The town was named after the nearby Eastview Plantation, which was owned by the prominent local family of the same name. The plantation was established in the early 1800s and was one of the largest in the area. The town was originally a farming community, but it soon developed into a small industrial center. The first industry in Eastview was a cotton mill, which was established in 1891. This was followed by a sawmill, a gristmill, and a brickyard.
In the early 1900s, Eastview began to experience a period of growth and prosperity. The town was home to several businesses, including a bank, a hotel, a general store, and a post office. The town also had a school, a library, and a movie theater. The population of Eastview peaked in the 1950s, when it had a population of over 1,500 people.
Geography
Eastview is located in the southwestern part of Fayette County, Tennessee. It is situated on the banks of the Wolf River, which flows through the town. The town is surrounded by rolling hills and is located about 25 miles east of Memphis. The climate in Eastview is humid subtropical, with hot summers and mild winters.
Economy
The economy of Eastview is largely based on agriculture and manufacturing. The town is home to several small businesses, including a grocery store, a hardware store, and a restaurant. The town also has a few small manufacturing plants, which produce a variety of products, including furniture, clothing, and automotive parts.
Demographics
As of the 2010 census, the population of Eastview was 1,000 people. The racial makeup of the town was 95.2% White, 2.2% African American, 0.2% Native American, 0.2% Asian, 0.2% from other races, and 1.9% from two or more races. The median household income in Eastview was $37,500, and the median family income was $45,000. The per capita income in Eastview was $18,000.
Conclusion
Eastview is a small town located in Fayette County, Tennessee. It was founded in 1887 and has a population of approximately 1,000 people. The town is largely based on agriculture and manufacturing, and it is home to several small businesses. The racial makeup of the town is predominantly White, with a small percentage of African American, Native American, and Asian residents. The median household income in Eastview is $37,500, and the per capita income is $18,000.
Common Questions
What is Per Capita Income in Eastview?
Per Capita income in Eastview is $24,670.
What is the Median Family Income in Eastview?
Median Family Income in Eastview is $66,389.
What is the Median Household income in Eastview?
Median Household Income in Eastview is $55,313.
What is Income or Wage Gap in Eastview?
Income or Wage Gap in Eastview is 37.6%.
Women in Eastview earn 62.4 cents for every dollar earned by a man.
What is Inequality or Gini Index in Eastview?
Inequality or Gini Index in Eastview is 0.38.
What is the Total Population of Eastview?
Total Population of Eastview is 835.
What is the Total Male Population of Eastview?
Total Male Population of Eastview is 430.
What is the Total Female Population of Eastview?
Total Female Population of Eastview is 405.
What is the Ratio of Males per 100 Females in Eastview?
There are 106.17 Males per 100 Females in Eastview.
What is the Ratio of Females per 100 Males in Eastview?
There are 94.19 Females per 100 Males in Eastview.
What is the Median Population Age in Eastview?
Median Population Age in Eastview is 36.7 Years.
What is the Average Family Size in Eastview
Average Family Size in Eastview is 3.3 People.
What is the Average Household Size in Eastview
Average Household Size in Eastview is 2.6 People.
How Large is the Labor Force in Eastview?
There are 387 People in the Labor Forcein in Eastview.
What is the Percentage of People in the Labor Force in Eastview?
63.8% of People are in the Labor Force in Eastview.
What is the Unemployment Rate in Eastview?
Unemployment Rate in Eastview is 7.0%.