Olivet, TN Map & Demographics
Olivet Map
Olivet Overview
$31,910
PER CAPITA INCOME
$54,130
AVG FAMILY INCOME
$76,136
AVG HOUSEHOLD INCOME
61.7%
WAGE / INCOME GAP [ % ]
38.3¢/ $1
WAGE / INCOME GAP [ $ ]
0.30
INEQUALITY / GINI INDEX
1,314
TOTAL POPULATION
677
MALE POPULATION
637
FEMALE POPULATION
106.28
MALES / 100 FEMALES
94.09
FEMALES / 100 MALES
45.7
MEDIAN AGE
2.7
AVG FAMILY SIZE
2.5
AVG HOUSEHOLD SIZE
609
LABOR FORCE [ PEOPLE ]
51.0%
PERCENT IN LABOR FORCE
Income in Olivet
Income Overview in Olivet
Per Capita Income in Olivet is $31,910, while median incomes of families and households are $54,130 and $76,136 respectively.
| Characteristic | Number | Measure |
| Per Capita Income | 1,314 | $31,910 |
| Median Family Income | 354 | $54,130 |
| Mean Family Income | 354 | $61,230 |
| Median Household Income | 536 | $76,136 |
| Mean Household Income | 536 | $74,908 |
| Income Deficit | 354 | $0 |
| Wage / Income Gap (%) | 1,314 | 61.68% |
| Wage / Income Gap ($) | 1,314 | 38.32¢ per $1 |
| Gini / Inequality Index | 1,314 | 0.30 |
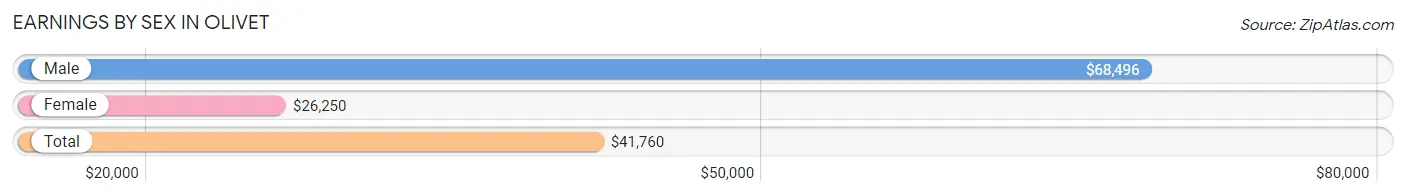
Earnings by Sex in Olivet
Average Earnings in Olivet are $41,760, $68,496 for men and $26,250 for women, a difference of 61.7%.
| Sex | Number | Average Earnings |
| Male | 389 (63.0%) | $68,496 |
| Female | 228 (36.9%) | $26,250 |
| Total | 617 (100.0%) | $41,760 |
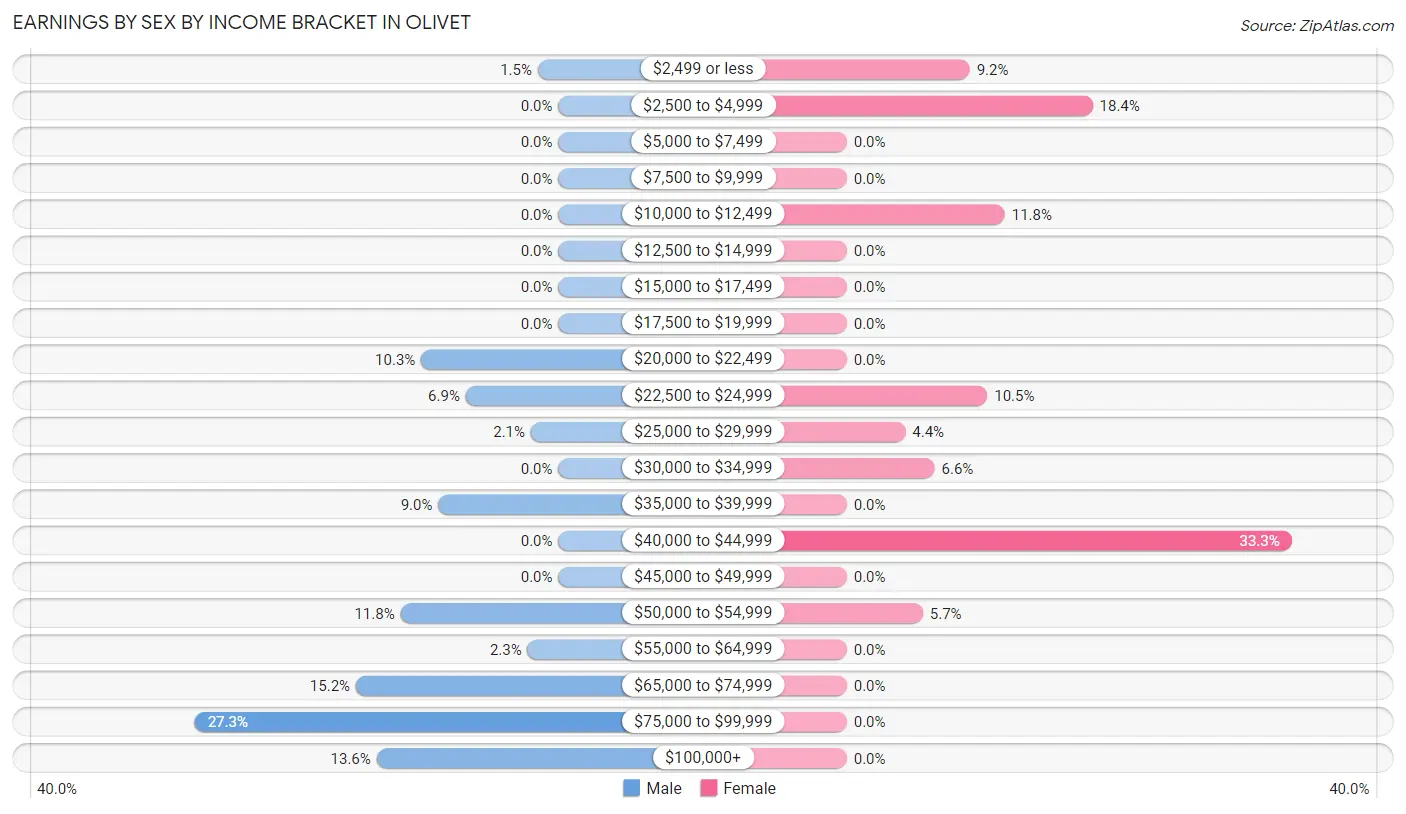
Earnings by Sex by Income Bracket in Olivet
The most common earnings brackets in Olivet are $75,000 to $99,999 for men (106 | 27.3%) and $40,000 to $44,999 for women (76 | 33.3%).
| Income | Male | Female |
| $2,499 or less | 6 (1.5%) | 21 (9.2%) |
| $2,500 to $4,999 | 0 (0.0%) | 42 (18.4%) |
| $5,000 to $7,499 | 0 (0.0%) | 0 (0.0%) |
| $7,500 to $9,999 | 0 (0.0%) | 0 (0.0%) |
| $10,000 to $12,499 | 0 (0.0%) | 27 (11.8%) |
| $12,500 to $14,999 | 0 (0.0%) | 0 (0.0%) |
| $15,000 to $17,499 | 0 (0.0%) | 0 (0.0%) |
| $17,500 to $19,999 | 0 (0.0%) | 0 (0.0%) |
| $20,000 to $22,499 | 40 (10.3%) | 0 (0.0%) |
| $22,500 to $24,999 | 27 (6.9%) | 24 (10.5%) |
| $25,000 to $29,999 | 8 (2.1%) | 10 (4.4%) |
| $30,000 to $34,999 | 0 (0.0%) | 15 (6.6%) |
| $35,000 to $39,999 | 35 (9.0%) | 0 (0.0%) |
| $40,000 to $44,999 | 0 (0.0%) | 76 (33.3%) |
| $45,000 to $49,999 | 0 (0.0%) | 0 (0.0%) |
| $50,000 to $54,999 | 46 (11.8%) | 13 (5.7%) |
| $55,000 to $64,999 | 9 (2.3%) | 0 (0.0%) |
| $65,000 to $74,999 | 59 (15.2%) | 0 (0.0%) |
| $75,000 to $99,999 | 106 (27.3%) | 0 (0.0%) |
| $100,000+ | 53 (13.6%) | 0 (0.0%) |
| Total | 389 (100.0%) | 228 (100.0%) |
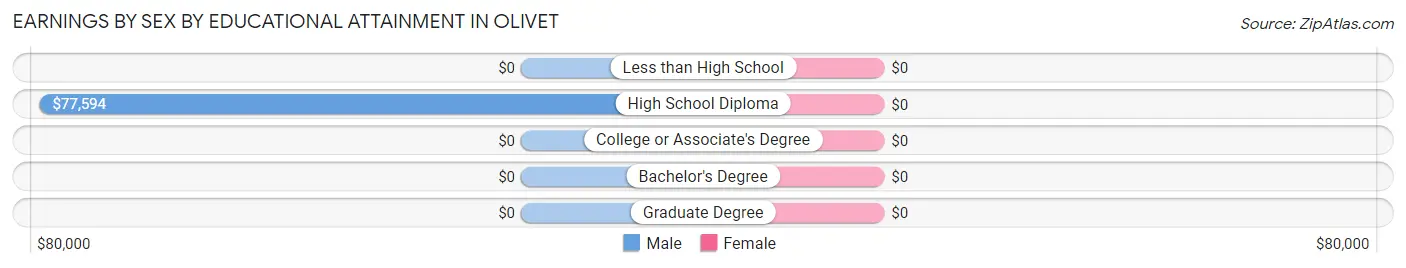
Earnings by Sex by Educational Attainment in Olivet
| Educational Attainment | Male Income | Female Income |
| Less than High School | - | - |
| High School Diploma | $77,594 | $0 |
| College or Associate's Degree | - | - |
| Bachelor's Degree | - | - |
| Graduate Degree | - | - |
| Total | $62,500 | $32,833 |
Family Income in Olivet
Family Income Brackets in Olivet
According to the Olivet family income data, there are 117 families falling into the $75,000 to $99,999 income range, which is the most common income bracket and makes up 33.1% of all families.
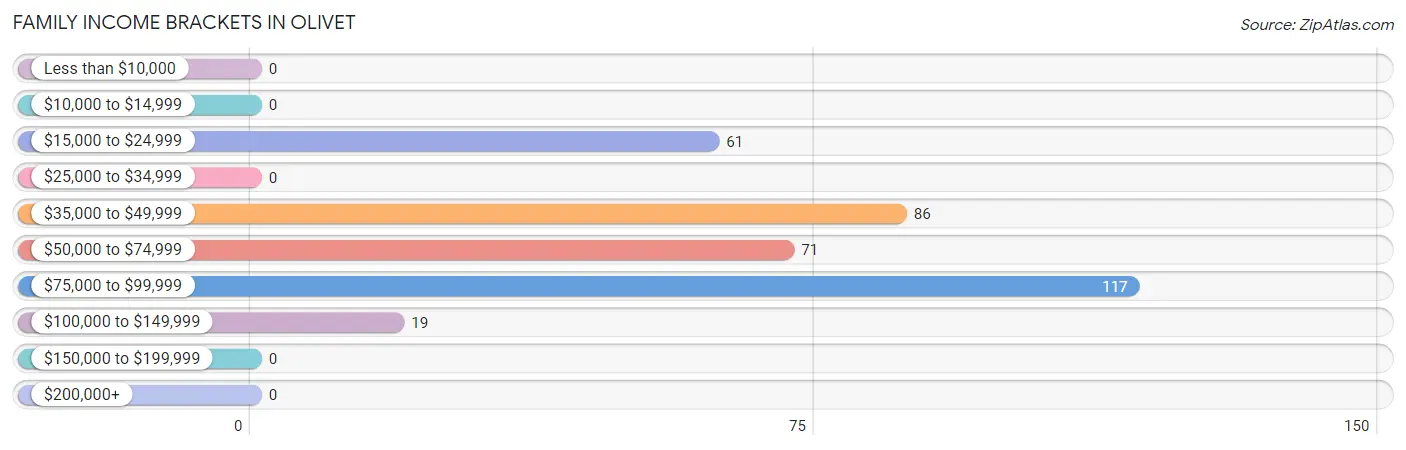
| Income Bracket | # Families | % Families |
| Less than $10,000 | 0 | 0.0% |
| $10,000 to $14,999 | 0 | 0.0% |
| $15,000 to $24,999 | 61 | 17.2% |
| $25,000 to $34,999 | 0 | 0.0% |
| $35,000 to $49,999 | 86 | 24.3% |
| $50,000 to $74,999 | 71 | 20.1% |
| $75,000 to $99,999 | 117 | 33.1% |
| $100,000 to $149,999 | 19 | 5.4% |
| $150,000 to $199,999 | 0 | 0.0% |
| $200,000+ | 0 | 0.0% |
Family Income by Famaliy Size in Olivet
3-person families (83 | 23.4%) account for the highest median family income in Olivet with $90,293 per family, while 3-person families (83 | 23.4%) have the highest median income of $30,098 per family member.
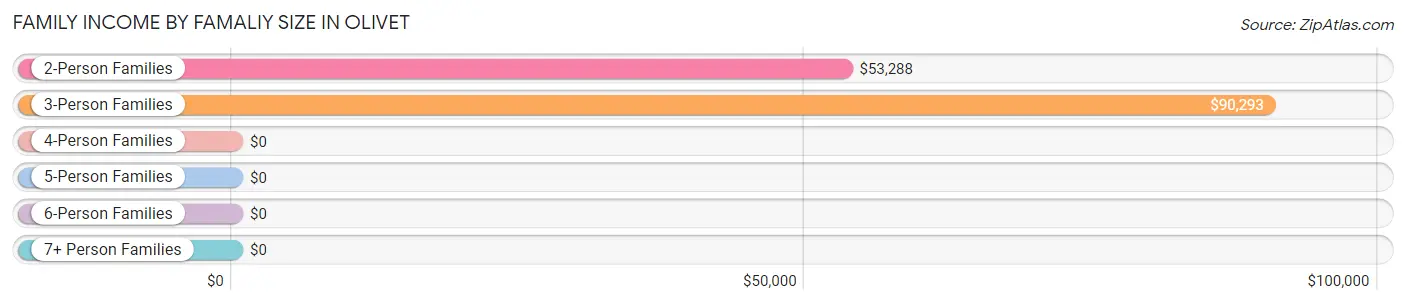
| Income Bracket | # Families | Median Income |
| 2-Person Families | 249 (70.3%) | $53,288 |
| 3-Person Families | 83 (23.4%) | $90,293 |
| 4-Person Families | 22 (6.2%) | $0 |
| 5-Person Families | 0 (0.0%) | $0 |
| 6-Person Families | 0 (0.0%) | $0 |
| 7+ Person Families | 0 (0.0%) | $0 |
| Total | 354 (100.0%) | $54,130 |
Family Income by Number of Earners in Olivet
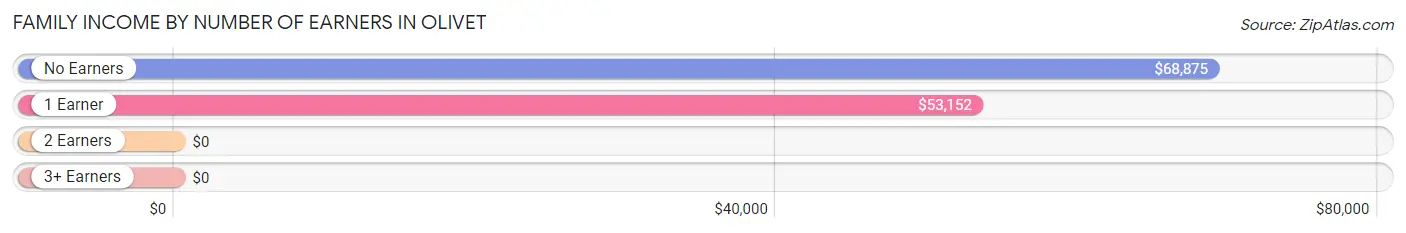
| Number of Earners | # Families | Median Income |
| No Earners | 77 (21.7%) | $68,875 |
| 1 Earner | 252 (71.2%) | $53,152 |
| 2 Earners | 25 (7.1%) | $0 |
| 3+ Earners | 0 (0.0%) | $0 |
| Total | 354 (100.0%) | $54,130 |
Household Income in Olivet
Household Income Brackets in Olivet
With 155 households falling in the category, the $100,000 to $149,999 income range is the most frequent in Olivet, accounting for 28.9% of all households.
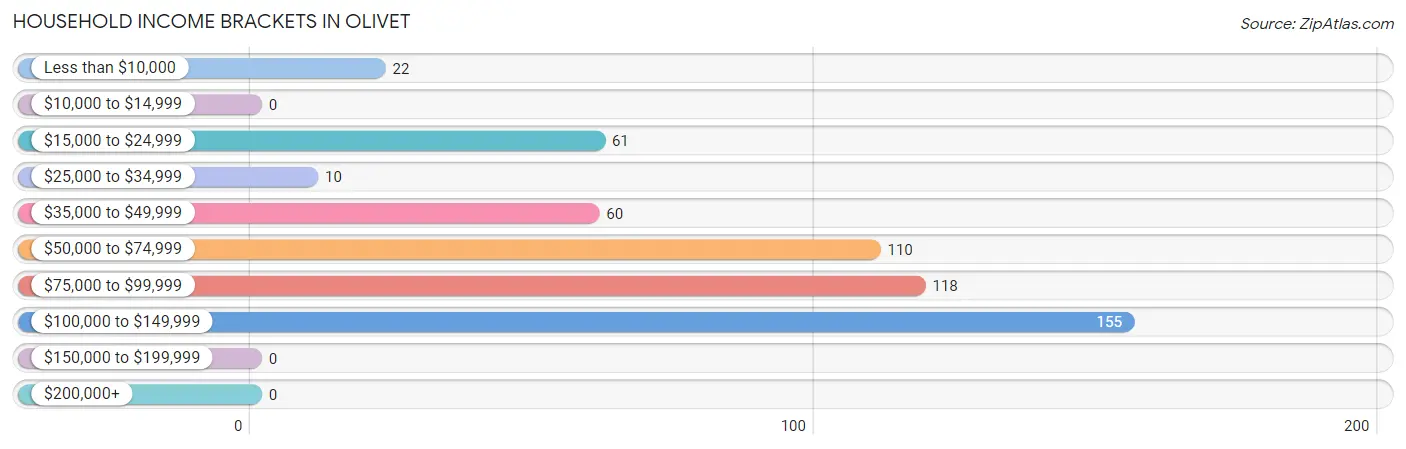
| Income Bracket | # Households | % Households |
| Less than $10,000 | 22 | 4.1% |
| $10,000 to $14,999 | 0 | 0.0% |
| $15,000 to $24,999 | 61 | 11.4% |
| $25,000 to $34,999 | 10 | 1.9% |
| $35,000 to $49,999 | 60 | 11.2% |
| $50,000 to $74,999 | 110 | 20.5% |
| $75,000 to $99,999 | 118 | 22.0% |
| $100,000 to $149,999 | 155 | 28.9% |
| $150,000 to $199,999 | 0 | 0.0% |
| $200,000+ | 0 | 0.0% |
Household Income by Householder Age in Olivet
The median household income in Olivet is $76,136, with the highest median household income of $62,260 found in the 25 to 44 years age bracket for the primary householder. A total of 217 households (40.5%) fall into this category. Meanwhile, the 15 to 24 years age bracket for the primary householder has the lowest median household income of $0, with 47 households (8.8%) in this group.
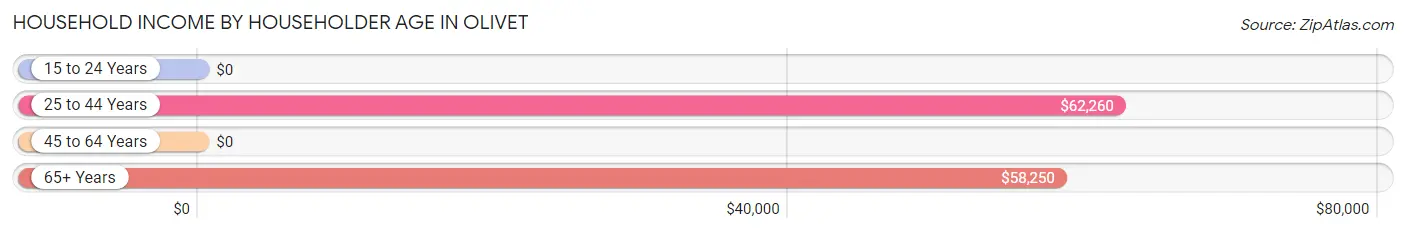
| Income Bracket | # Households | Median Income |
| 15 to 24 Years | 47 (8.8%) | $0 |
| 25 to 44 Years | 217 (40.5%) | $62,260 |
| 45 to 64 Years | 145 (27.1%) | $0 |
| 65+ Years | 127 (23.7%) | $58,250 |
| Total | 536 (100.0%) | $76,136 |
Poverty in Olivet
Income Below Poverty by Sex and Age in Olivet
With 4.0% poverty level for males and 16.3% for females among the residents of Olivet, 6 to 11 year old males and 18 to 24 year old females are the most vulnerable to poverty, with 11 males (30.6%) and 22 females (47.8%) in their respective age groups living below the poverty level.
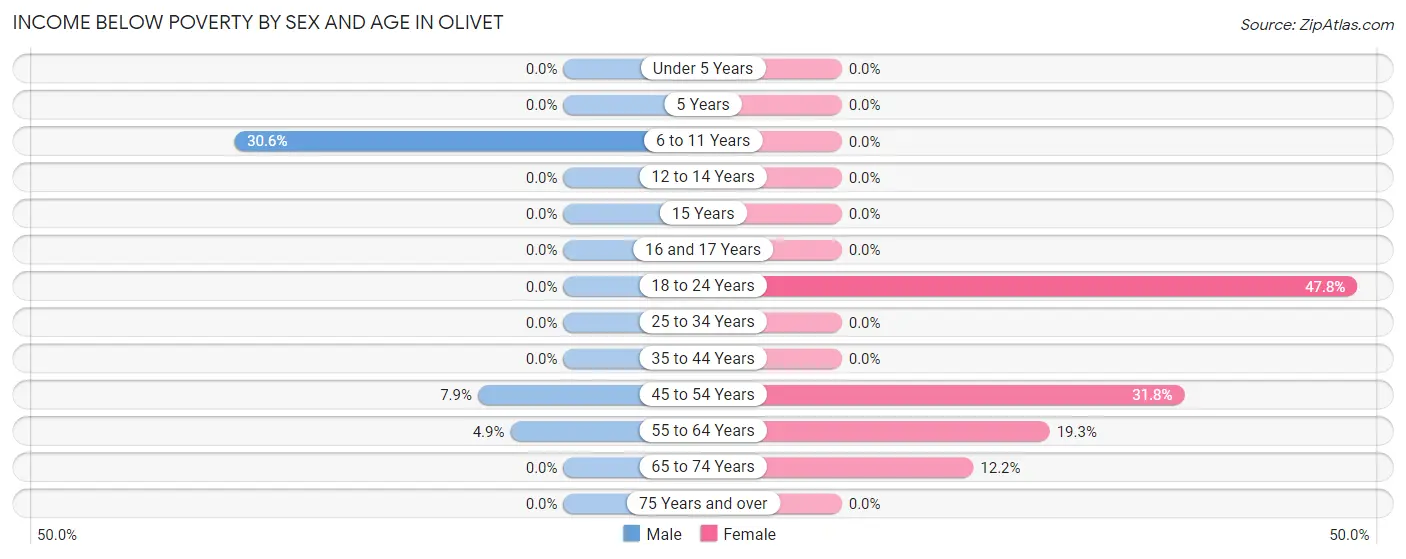
| Age Bracket | Male | Female |
| Under 5 Years | 0 (0.0%) | 0 (0.0%) |
| 5 Years | 0 (0.0%) | 0 (0.0%) |
| 6 to 11 Years | 11 (30.6%) | 0 (0.0%) |
| 12 to 14 Years | 0 (0.0%) | 0 (0.0%) |
| 15 Years | 0 (0.0%) | 0 (0.0%) |
| 16 and 17 Years | 0 (0.0%) | 0 (0.0%) |
| 18 to 24 Years | 0 (0.0%) | 22 (47.8%) |
| 25 to 34 Years | 0 (0.0%) | 0 (0.0%) |
| 35 to 44 Years | 0 (0.0%) | 0 (0.0%) |
| 45 to 54 Years | 10 (7.9%) | 55 (31.8%) |
| 55 to 64 Years | 6 (4.9%) | 11 (19.3%) |
| 65 to 74 Years | 0 (0.0%) | 16 (12.2%) |
| 75 Years and over | 0 (0.0%) | 0 (0.0%) |
| Total | 27 (4.0%) | 104 (16.3%) |
Income Above Poverty by Sex and Age in Olivet
According to the poverty statistics in Olivet, males aged under 5 years and females aged under 5 years are the age groups that are most secure financially, with 100.0% of males and 100.0% of females in these age groups living above the poverty line.
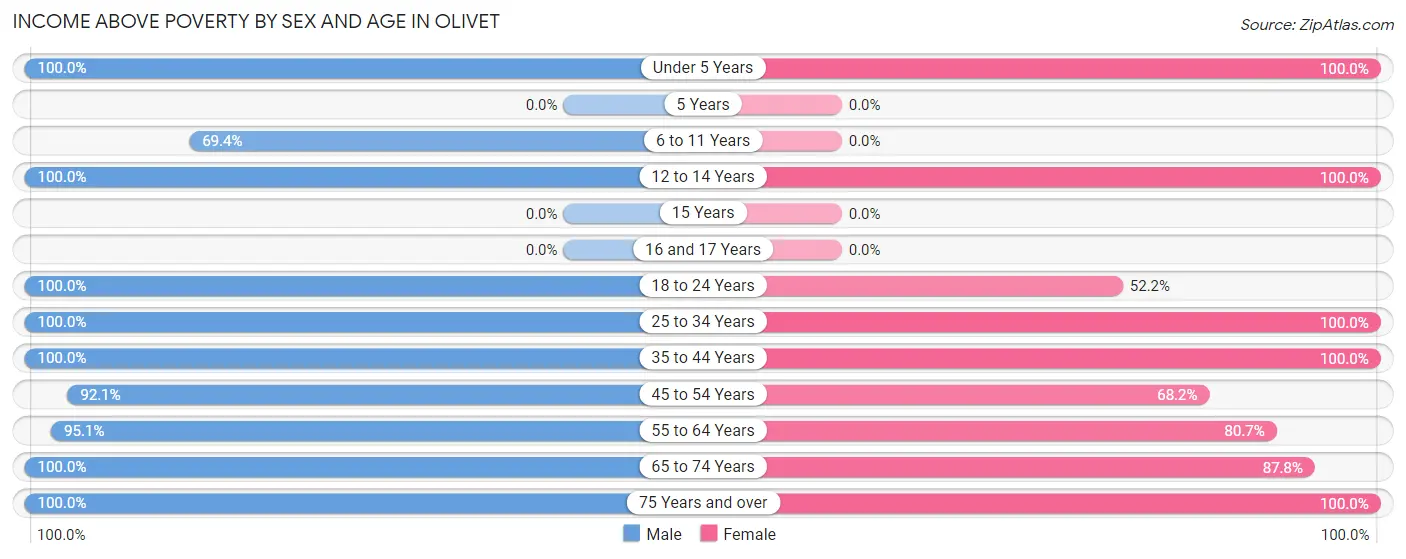
| Age Bracket | Male | Female |
| Under 5 Years | 27 (100.0%) | 28 (100.0%) |
| 5 Years | 0 (0.0%) | 0 (0.0%) |
| 6 to 11 Years | 25 (69.4%) | 0 (0.0%) |
| 12 to 14 Years | 22 (100.0%) | 7 (100.0%) |
| 15 Years | 0 (0.0%) | 0 (0.0%) |
| 16 and 17 Years | 0 (0.0%) | 0 (0.0%) |
| 18 to 24 Years | 47 (100.0%) | 24 (52.2%) |
| 25 to 34 Years | 145 (100.0%) | 145 (100.0%) |
| 35 to 44 Years | 55 (100.0%) | 35 (100.0%) |
| 45 to 54 Years | 116 (92.1%) | 118 (68.2%) |
| 55 to 64 Years | 116 (95.1%) | 46 (80.7%) |
| 65 to 74 Years | 75 (100.0%) | 115 (87.8%) |
| 75 Years and over | 22 (100.0%) | 15 (100.0%) |
| Total | 650 (96.0%) | 533 (83.7%) |
Income Below Poverty Among Married-Couple Families in Olivet
The poverty statistics for married-couple families in Olivet show that 4.6% or 11 of the total 240 families live below the poverty line. Families with 1 or 2 children have the highest poverty rate of 50.0%, comprising of 11 families. On the other hand, families with no children have the lowest poverty rate of 0.0%, which includes 0 families.
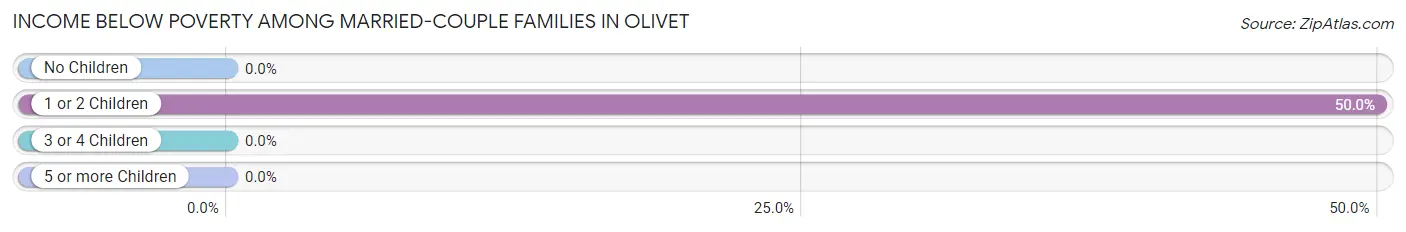
| Children | Above Poverty | Below Poverty |
| No Children | 218 (100.0%) | 0 (0.0%) |
| 1 or 2 Children | 11 (50.0%) | 11 (50.0%) |
| 3 or 4 Children | 0 (0.0%) | 0 (0.0%) |
| 5 or more Children | 0 (0.0%) | 0 (0.0%) |
| Total | 229 (95.4%) | 11 (4.6%) |
Income Below Poverty Among Single-Parent Households in Olivet
| Children | Single Father | Single Mother |
| No Children | 0 (0.0%) | 0 (0.0%) |
| 1 or 2 Children | 0 (0.0%) | 0 (0.0%) |
| 3 or 4 Children | 0 (0.0%) | 0 (0.0%) |
| 5 or more Children | 0 (0.0%) | 0 (0.0%) |
| Total | 0 (0.0%) | 0 (0.0%) |
Income Below Poverty Among Married-Couple vs Single-Parent Households in Olivet
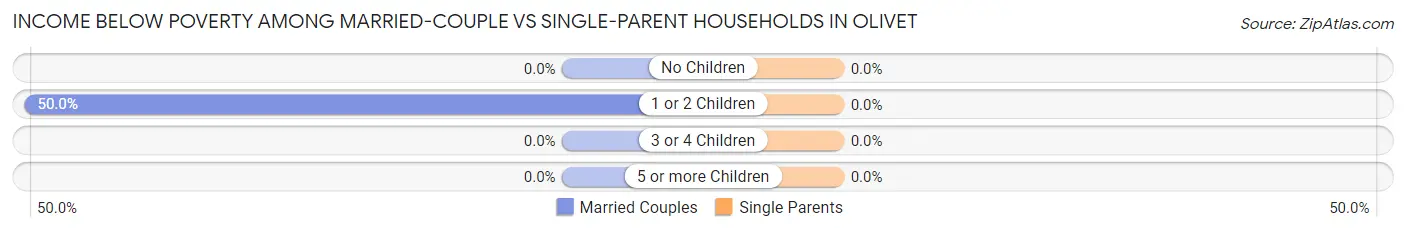
| Children | Married-Couple Families | Single-Parent Households |
| No Children | 0 (0.0%) | 0 (0.0%) |
| 1 or 2 Children | 11 (50.0%) | 0 (0.0%) |
| 3 or 4 Children | 0 (0.0%) | 0 (0.0%) |
| 5 or more Children | 0 (0.0%) | 0 (0.0%) |
| Total | 11 (4.6%) | 0 (0.0%) |
Race in Olivet
The most populous races in Olivet are , and White / Caucasian (1,314 | 100.0%).
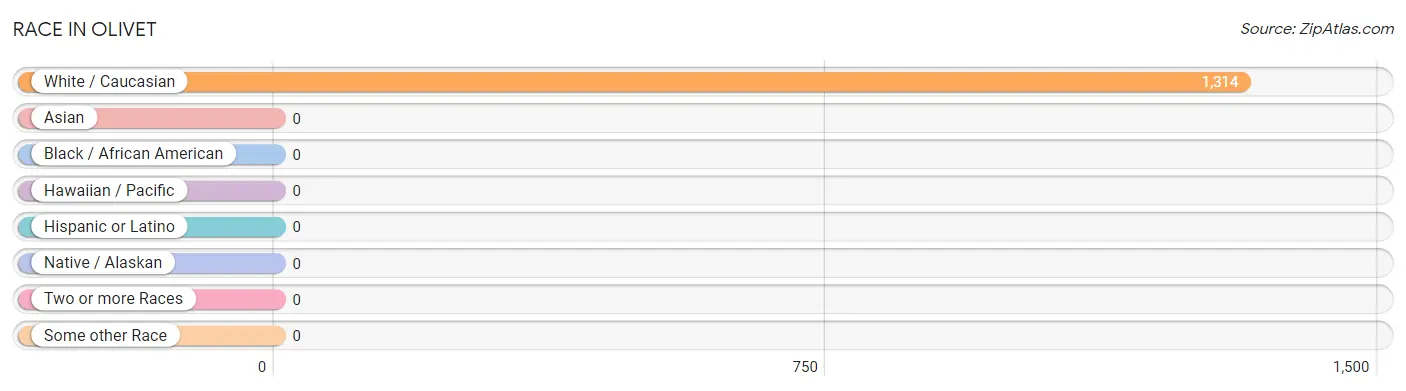
| Race | # Population | % Population |
| Asian | 0 | 0.0% |
| Black / African American | 0 | 0.0% |
| Hawaiian / Pacific | 0 | 0.0% |
| Hispanic or Latino | 0 | 0.0% |
| Native / Alaskan | 0 | 0.0% |
| White / Caucasian | 1,314 | 100.0% |
| Two or more Races | 0 | 0.0% |
| Some other Race | 0 | 0.0% |
| Total | 1,314 | 100.0% |
Ancestry in Olivet
The most populous ancestries reported in Olivet are Irish (213 | 16.2%), English (182 | 13.9%), German (135 | 10.3%), American (113 | 8.6%), and Welsh (50 | 3.8%), together accounting for 52.7% of all Olivet residents.
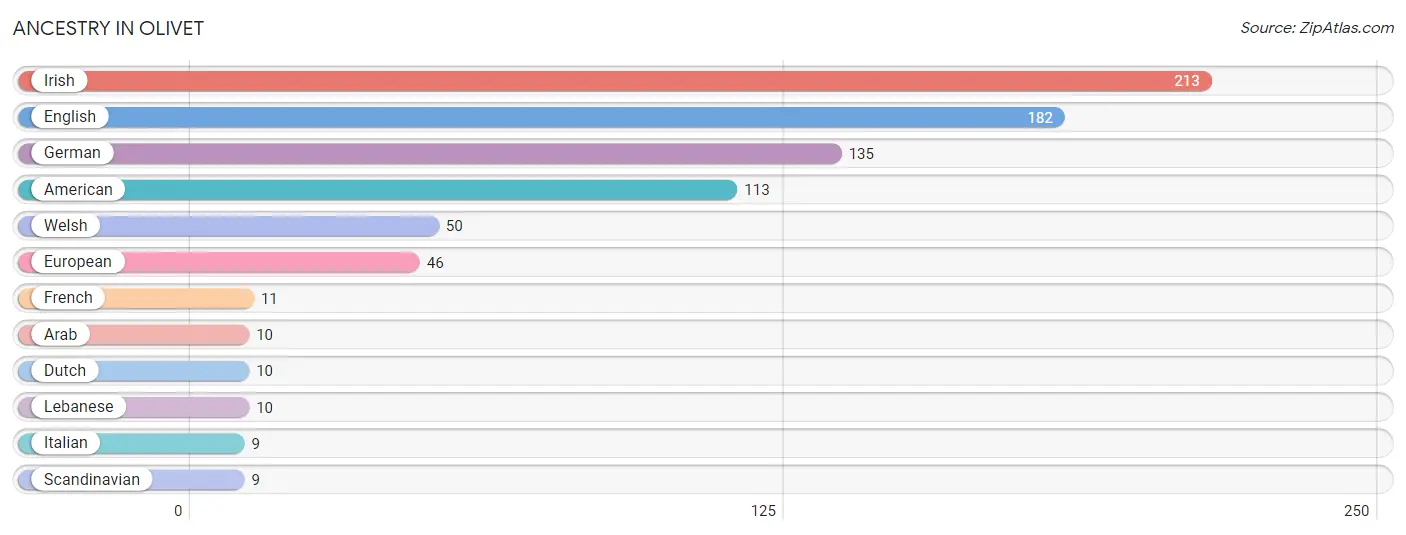
| Ancestry | # Population | % Population |
| American | 113 | 8.6% |
| Arab | 10 | 0.8% |
| Dutch | 10 | 0.8% |
| English | 182 | 13.9% |
| European | 46 | 3.5% |
| French | 11 | 0.8% |
| German | 135 | 10.3% |
| Irish | 213 | 16.2% |
| Italian | 9 | 0.7% |
| Lebanese | 10 | 0.8% |
| Scandinavian | 9 | 0.7% |
| Welsh | 50 | 3.8% | View All 12 Rows |
Immigrants in Olivet

| Immigration Origin | # Population | % Population | View All 0 Rows |
Sex and Age in Olivet
Sex and Age in Olivet
The most populous age groups in Olivet are 30 to 34 Years (133 | 19.7%) for men and 30 to 34 Years (130 | 20.4%) for women.
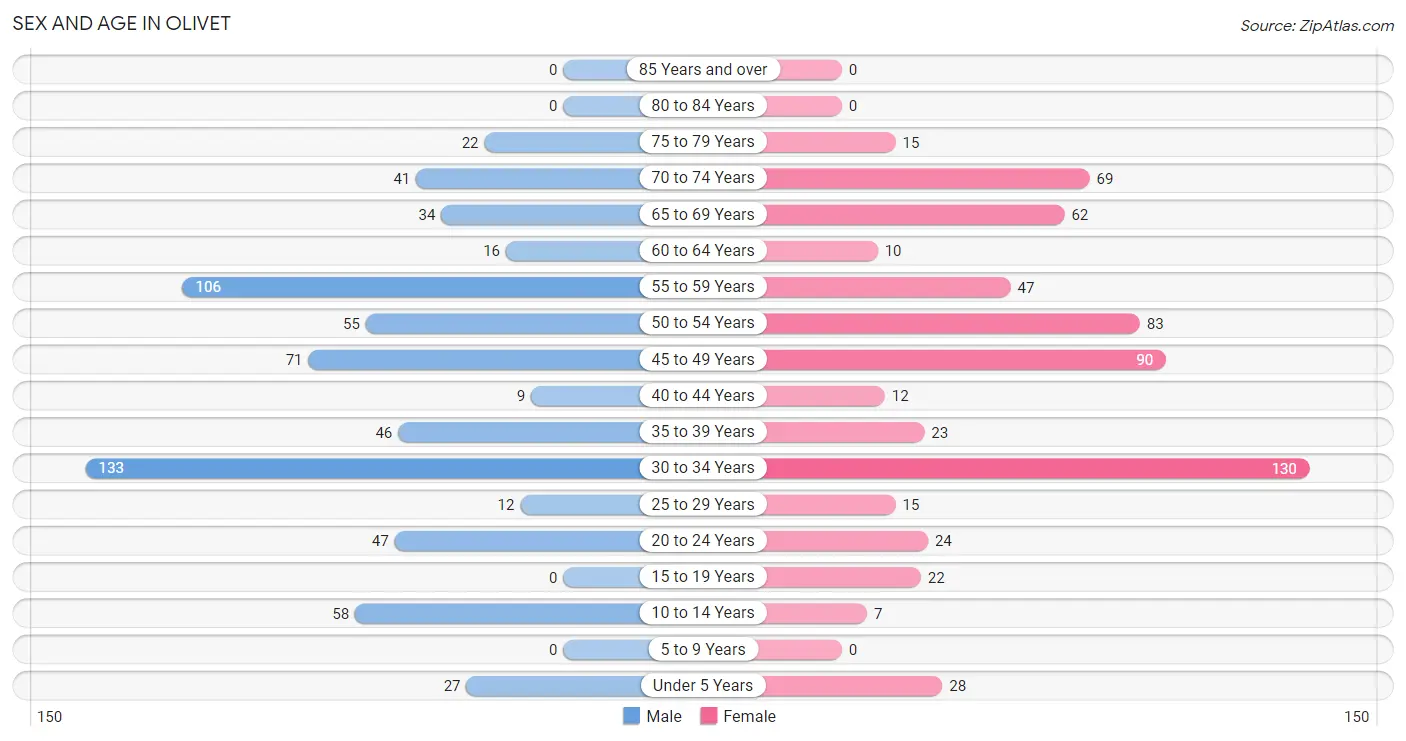
| Age Bracket | Male | Female |
| Under 5 Years | 27 (4.0%) | 28 (4.4%) |
| 5 to 9 Years | 0 (0.0%) | 0 (0.0%) |
| 10 to 14 Years | 58 (8.6%) | 7 (1.1%) |
| 15 to 19 Years | 0 (0.0%) | 22 (3.5%) |
| 20 to 24 Years | 47 (6.9%) | 24 (3.8%) |
| 25 to 29 Years | 12 (1.8%) | 15 (2.4%) |
| 30 to 34 Years | 133 (19.7%) | 130 (20.4%) |
| 35 to 39 Years | 46 (6.8%) | 23 (3.6%) |
| 40 to 44 Years | 9 (1.3%) | 12 (1.9%) |
| 45 to 49 Years | 71 (10.5%) | 90 (14.1%) |
| 50 to 54 Years | 55 (8.1%) | 83 (13.0%) |
| 55 to 59 Years | 106 (15.7%) | 47 (7.4%) |
| 60 to 64 Years | 16 (2.4%) | 10 (1.6%) |
| 65 to 69 Years | 34 (5.0%) | 62 (9.7%) |
| 70 to 74 Years | 41 (6.1%) | 69 (10.8%) |
| 75 to 79 Years | 22 (3.3%) | 15 (2.4%) |
| 80 to 84 Years | 0 (0.0%) | 0 (0.0%) |
| 85 Years and over | 0 (0.0%) | 0 (0.0%) |
| Total | 677 (100.0%) | 637 (100.0%) |
Families and Households in Olivet
Median Family Size in Olivet
The median family size in Olivet is 2.69 persons per family, with single male/father families (100 | 28.2%) accounting for the largest median family size of 3.56 persons per family. On the other hand, single female/mother families (14 | 4.0%) represent the smallest median family size with 2.21 persons per family.
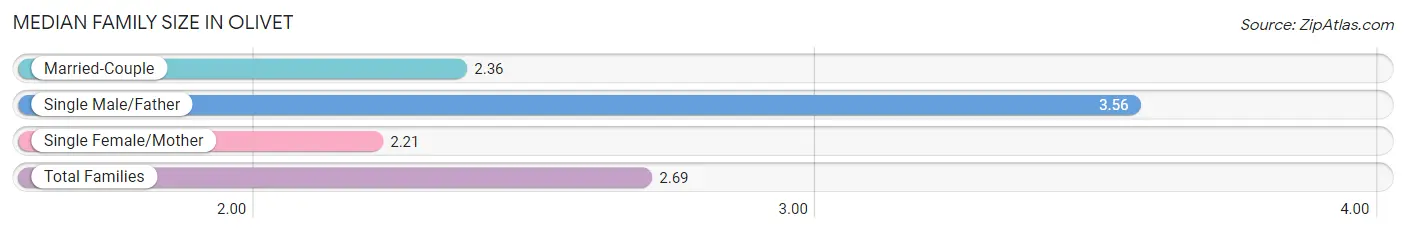
| Family Type | # Families | Family Size |
| Married-Couple | 240 (67.8%) | 2.36 |
| Single Male/Father | 100 (28.2%) | 3.56 |
| Single Female/Mother | 14 (4.0%) | 2.21 |
| Total Families | 354 (100.0%) | 2.69 |
Median Household Size in Olivet
The median household size in Olivet is 2.45 persons per household, with single male/father households (100 | 18.7%) accounting for the largest median household size of 3.8 persons per household. non-family households (182 | 34.0%) represent the smallest median household size with 1.78 persons per household.
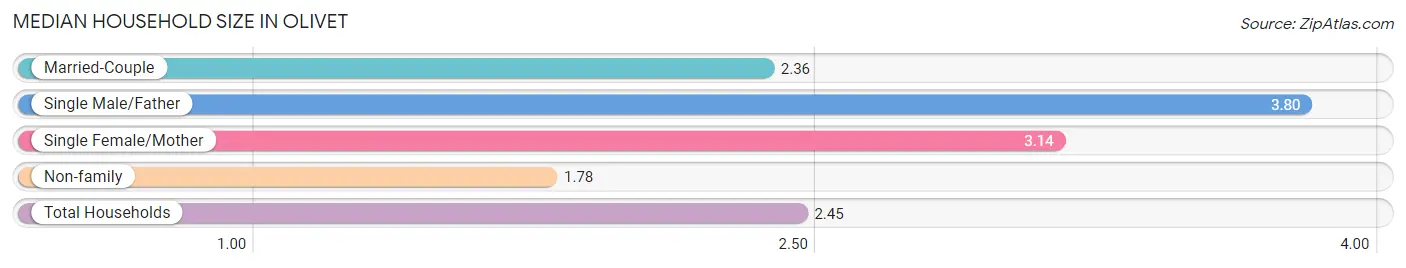
| Household Type | # Households | Household Size |
| Married-Couple | 240 (44.8%) | 2.36 |
| Single Male/Father | 100 (18.7%) | 3.80 |
| Single Female/Mother | 14 (2.6%) | 3.14 |
| Non-family | 182 (34.0%) | 1.78 |
| Total Households | 536 (100.0%) | 2.45 |
Household Size by Marriage Status in Olivet
Out of a total of 536 households in Olivet, 354 (66.0%) are family households, while 182 (34.0%) are nonfamily households. The most numerous type of family households are 2-person households, comprising 235, and the most common type of nonfamily households are 2-person households, comprising 137.
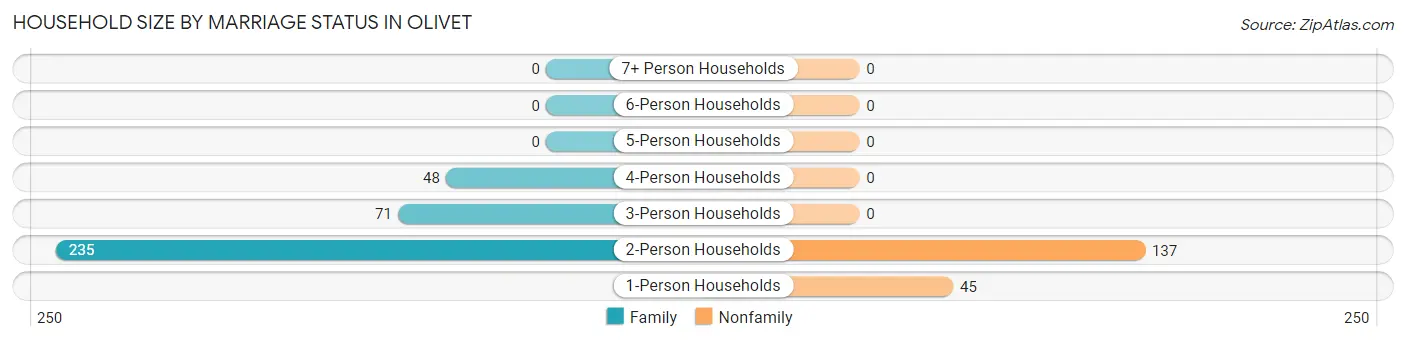
| Household Size | Family Households | Nonfamily Households |
| 1-Person Households | - | 45 (8.4%) |
| 2-Person Households | 235 (43.8%) | 137 (25.6%) |
| 3-Person Households | 71 (13.3%) | 0 (0.0%) |
| 4-Person Households | 48 (9.0%) | 0 (0.0%) |
| 5-Person Households | 0 (0.0%) | 0 (0.0%) |
| 6-Person Households | 0 (0.0%) | 0 (0.0%) |
| 7+ Person Households | 0 (0.0%) | 0 (0.0%) |
| Total | 354 (66.0%) | 182 (34.0%) |
Female Fertility in Olivet
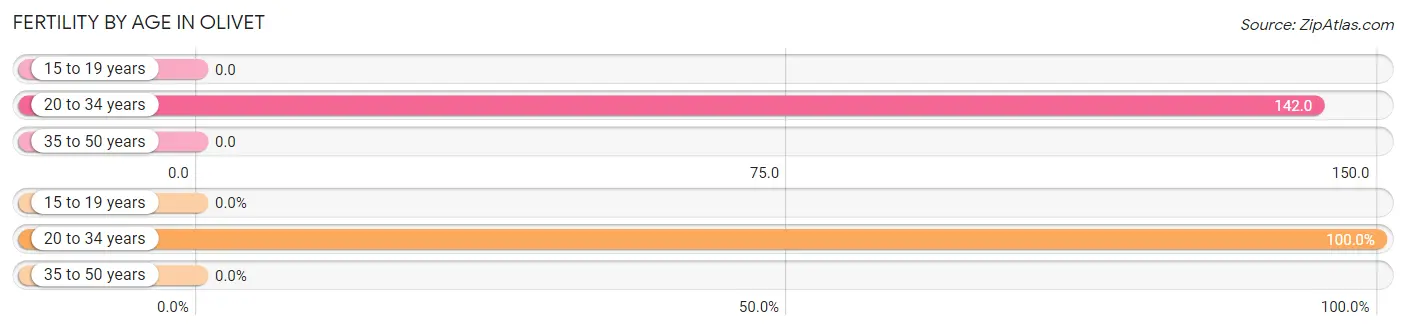
Fertility by Age in Olivet
Average fertility rate in Olivet is 65.0 births per 1,000 women. Women in the age bracket of 20 to 34 years have the highest fertility rate with 142.0 births per 1,000 women. Women in the age bracket of 20 to 34 years acount for 100.0% of all women with births.
| Age Bracket | Women with Births | Births / 1,000 Women |
| 15 to 19 years | 0 (0.0%) | 0.0 |
| 20 to 34 years | 24 (100.0%) | 142.0 |
| 35 to 50 years | 0 (0.0%) | 0.0 |
| Total | 24 (100.0%) | 65.0 |
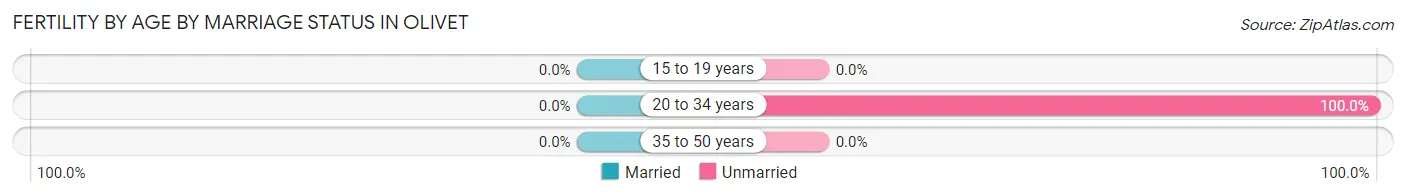
Fertility by Age by Marriage Status in Olivet
| Age Bracket | Married | Unmarried |
| 15 to 19 years | 0 (0.0%) | 0 (0.0%) |
| 20 to 34 years | 0 (0.0%) | 24 (100.0%) |
| 35 to 50 years | 0 (0.0%) | 0 (0.0%) |
| Total | 0 (0.0%) | 24 (100.0%) |
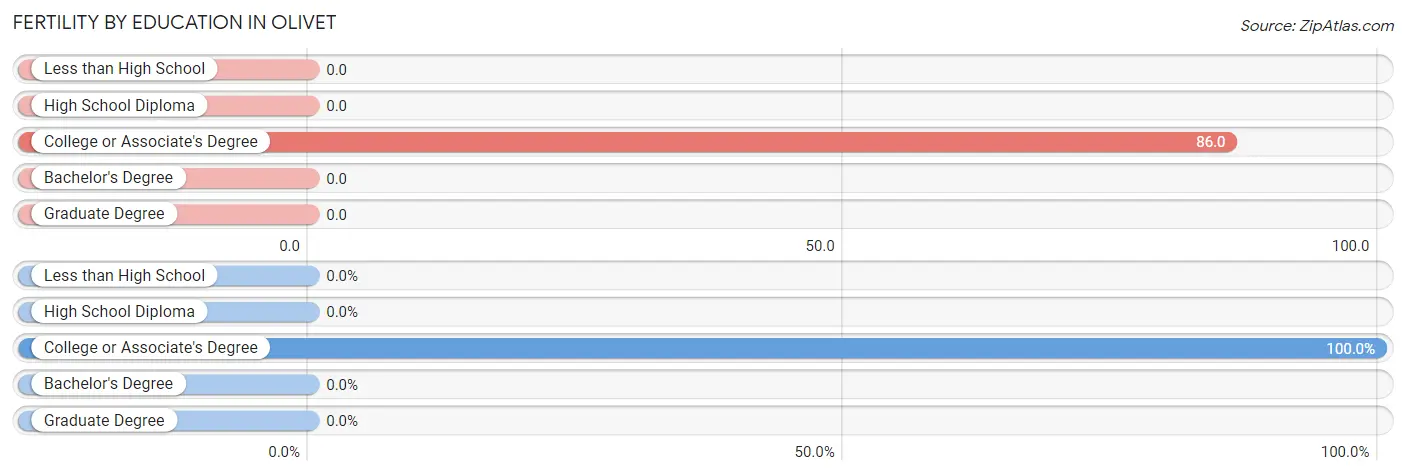
Fertility by Education in Olivet
| Educational Attainment | Women with Births | Births / 1,000 Women |
| Less than High School | 0 (0.0%) | 0.0 |
| High School Diploma | 0 (0.0%) | 0.0 |
| College or Associate's Degree | 24 (100.0%) | 86.0 |
| Bachelor's Degree | 0 (0.0%) | 0.0 |
| Graduate Degree | 0 (0.0%) | 0.0 |
| Total | 24 (100.0%) | 65.0 |
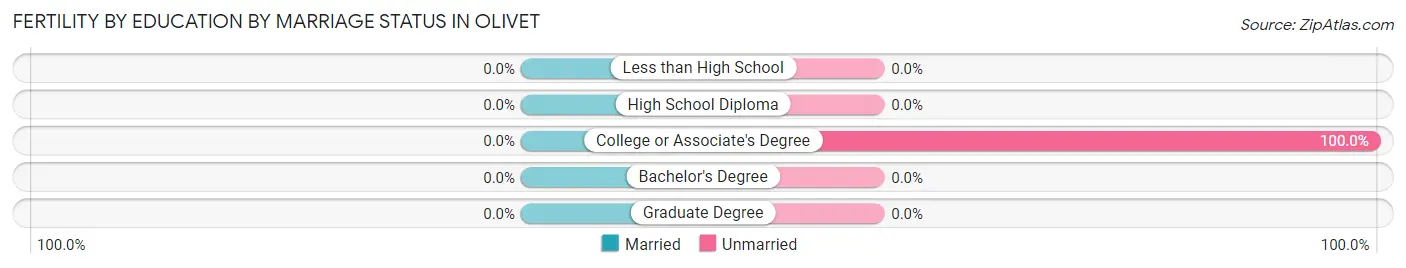
Fertility by Education by Marriage Status in Olivet
| Educational Attainment | Married | Unmarried |
| Less than High School | 0 (0.0%) | 0 (0.0%) |
| High School Diploma | 0 (0.0%) | 0 (0.0%) |
| College or Associate's Degree | 0 (0.0%) | 24 (100.0%) |
| Bachelor's Degree | 0 (0.0%) | 0 (0.0%) |
| Graduate Degree | 0 (0.0%) | 0 (0.0%) |
| Total | 0 (0.0%) | 24 (100.0%) |
Employment Characteristics in Olivet
Employment by Class of Employer in Olivet
Among the 585 employed individuals in Olivet, private company employees (394 | 67.3%), self-employed (not incorporated) (65 | 11.1%), and not-for-profit organizations (56 | 9.6%) make up the most common classes of employment.
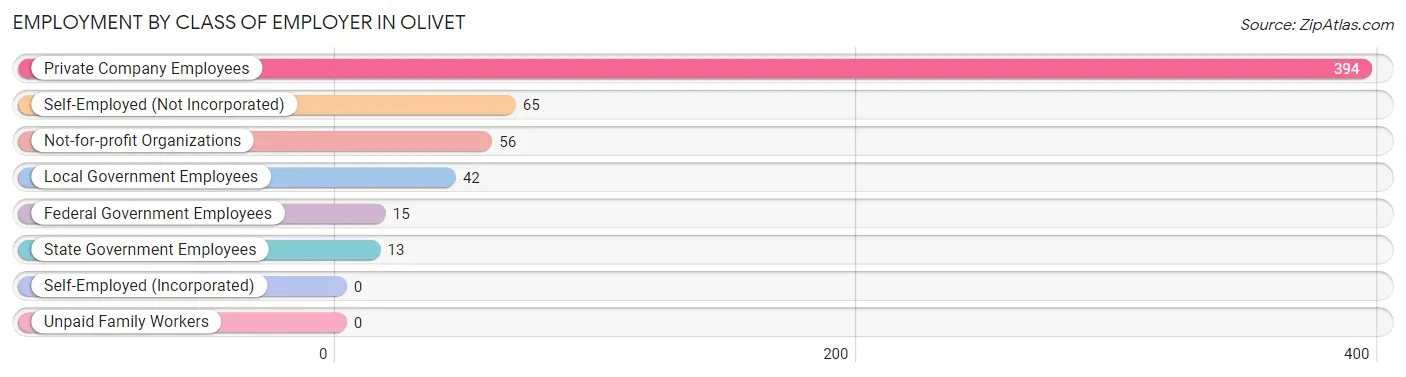
| Employer Class | # Employees | % Employees |
| Private Company Employees | 394 | 67.3% |
| Self-Employed (Incorporated) | 0 | 0.0% |
| Self-Employed (Not Incorporated) | 65 | 11.1% |
| Not-for-profit Organizations | 56 | 9.6% |
| Local Government Employees | 42 | 7.2% |
| State Government Employees | 13 | 2.2% |
| Federal Government Employees | 15 | 2.6% |
| Unpaid Family Workers | 0 | 0.0% |
| Total | 585 | 100.0% |
Employment Status by Age in Olivet
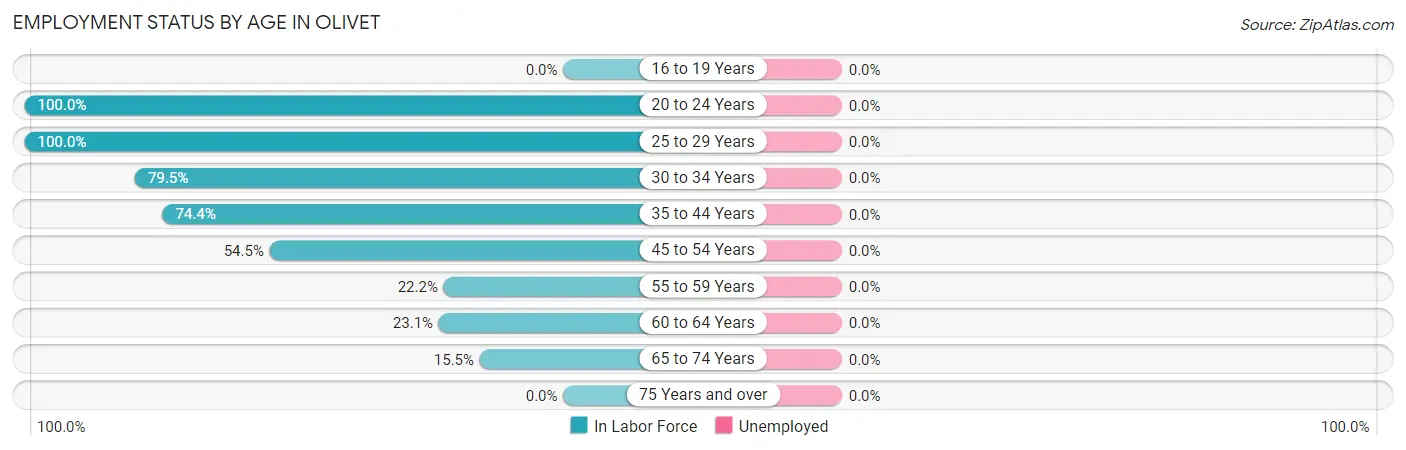
| Age Bracket | In Labor Force | Unemployed |
| 16 to 19 Years | 0 (0.0%) | 0 (0.0%) |
| 20 to 24 Years | 71 (100.0%) | 0 (0.0%) |
| 25 to 29 Years | 27 (100.0%) | 0 (0.0%) |
| 30 to 34 Years | 209 (79.5%) | 0 (0.0%) |
| 35 to 44 Years | 67 (74.4%) | 0 (0.0%) |
| 45 to 54 Years | 163 (54.5%) | 0 (0.0%) |
| 55 to 59 Years | 34 (22.2%) | 0 (0.0%) |
| 60 to 64 Years | 6 (23.1%) | 0 (0.0%) |
| 65 to 74 Years | 32 (15.5%) | 0 (0.0%) |
| 75 Years and over | 0 (0.0%) | 0 (0.0%) |
| Total | 609 (51.0%) | 0 (0.0%) |
Employment Status by Educational Attainment in Olivet
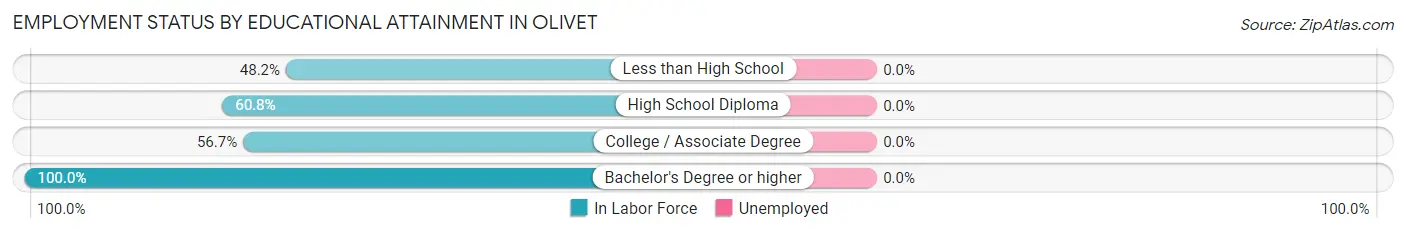
| Educational Attainment | In Labor Force | Unemployed |
| Less than High School | 27 (48.2%) | 0 (0.0%) |
| High School Diploma | 285 (60.8%) | 0 (0.0%) |
| College / Associate Degree | 182 (56.7%) | 0 (0.0%) |
| Bachelor's Degree or higher | 12 (100.0%) | 0 (0.0%) |
| Total | 506 (59.0%) | 0 (0.0%) |
Employment Occupations by Sex in Olivet
Management, Business, Science and Arts Occupations
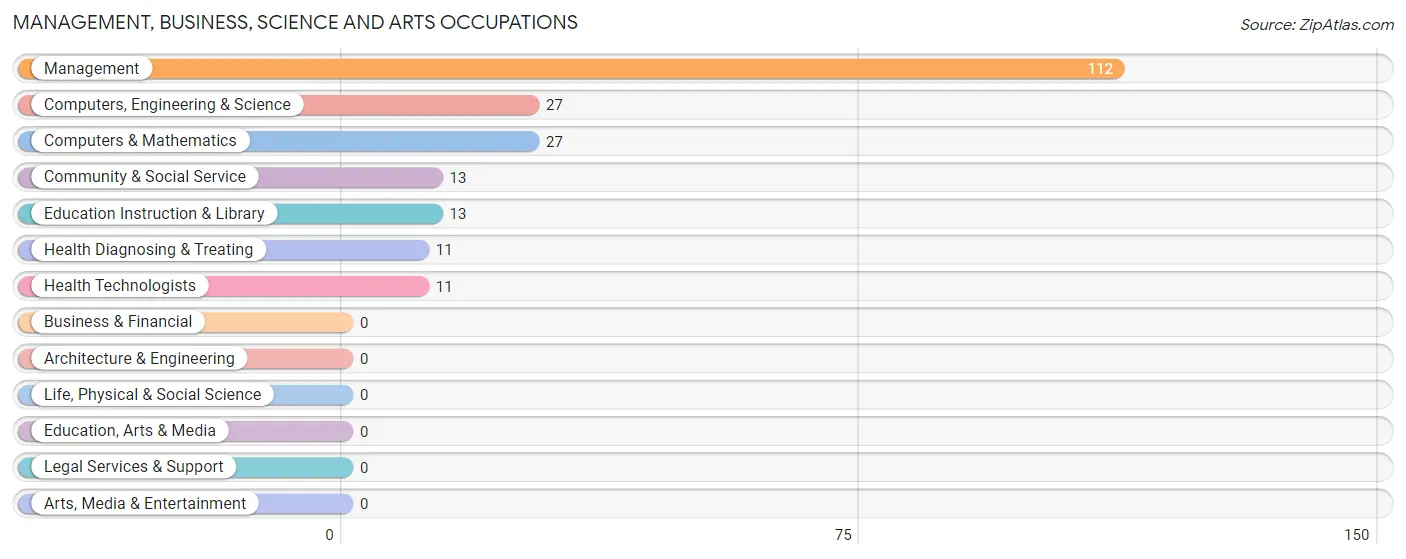
The most common Management, Business, Science and Arts occupations in Olivet are Management (112 | 18.4%), Computers, Engineering & Science (27 | 4.4%), Computers & Mathematics (27 | 4.4%), Community & Social Service (13 | 2.1%), and Education Instruction & Library (13 | 2.1%).
Management, Business, Science and Arts Occupations by Sex
Within the Management, Business, Science and Arts occupations in Olivet, the most male-oriented occupations are Management (100.0%), Computers, Engineering & Science (100.0%), and Computers & Mathematics (100.0%), while the most female-oriented occupations are Community & Social Service (100.0%), and Education Instruction & Library (100.0%).
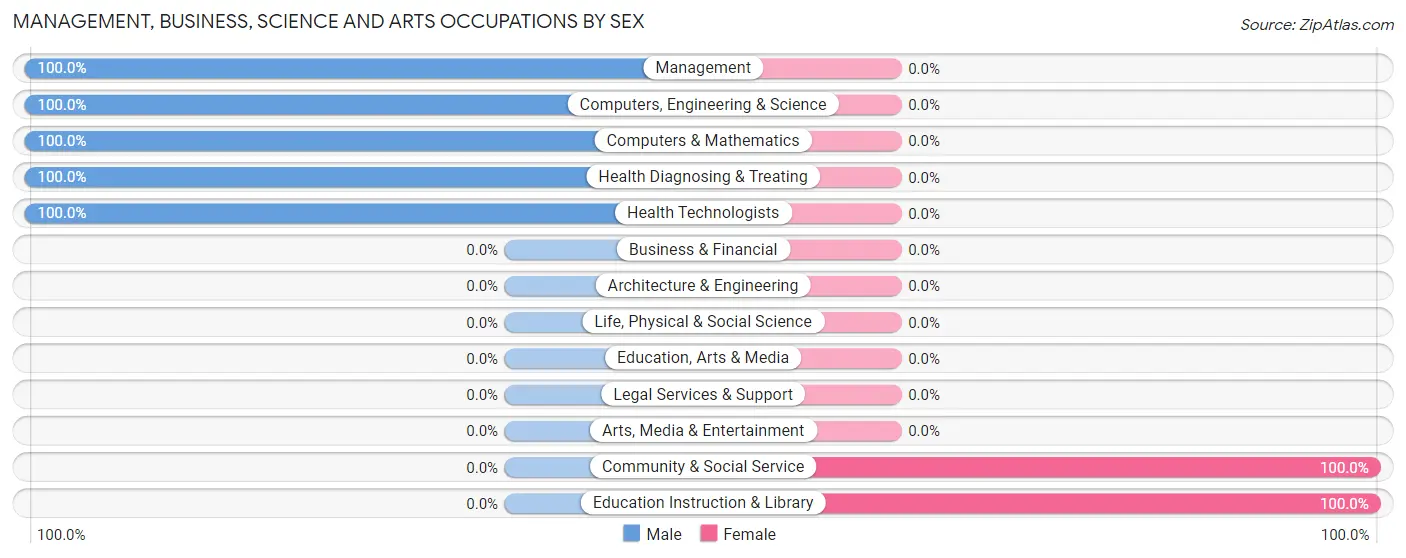
| Occupation | Male | Female |
| Management | 112 (100.0%) | 0 (0.0%) |
| Business & Financial | 0 (0.0%) | 0 (0.0%) |
| Computers, Engineering & Science | 27 (100.0%) | 0 (0.0%) |
| Computers & Mathematics | 27 (100.0%) | 0 (0.0%) |
| Architecture & Engineering | 0 (0.0%) | 0 (0.0%) |
| Life, Physical & Social Science | 0 (0.0%) | 0 (0.0%) |
| Community & Social Service | 0 (0.0%) | 13 (100.0%) |
| Education, Arts & Media | 0 (0.0%) | 0 (0.0%) |
| Legal Services & Support | 0 (0.0%) | 0 (0.0%) |
| Education Instruction & Library | 0 (0.0%) | 13 (100.0%) |
| Arts, Media & Entertainment | 0 (0.0%) | 0 (0.0%) |
| Health Diagnosing & Treating | 11 (100.0%) | 0 (0.0%) |
| Health Technologists | 11 (100.0%) | 0 (0.0%) |
| Total (Category) | 150 (92.0%) | 13 (8.0%) |
| Total (Overall) | 389 (63.9%) | 220 (36.1%) |
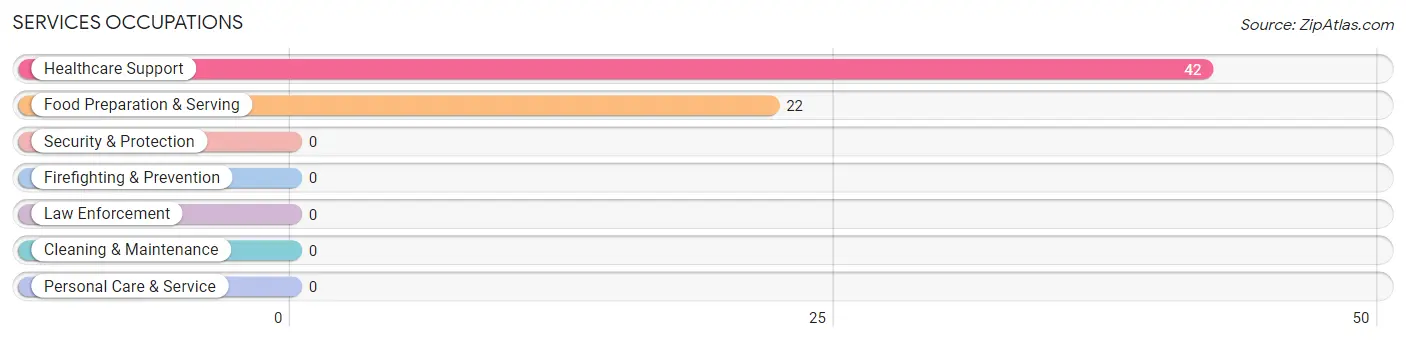
Services Occupations
The most common Services occupations in Olivet are Healthcare Support (42 | 6.9%), and Food Preparation & Serving (22 | 3.6%).
Services Occupations by Sex
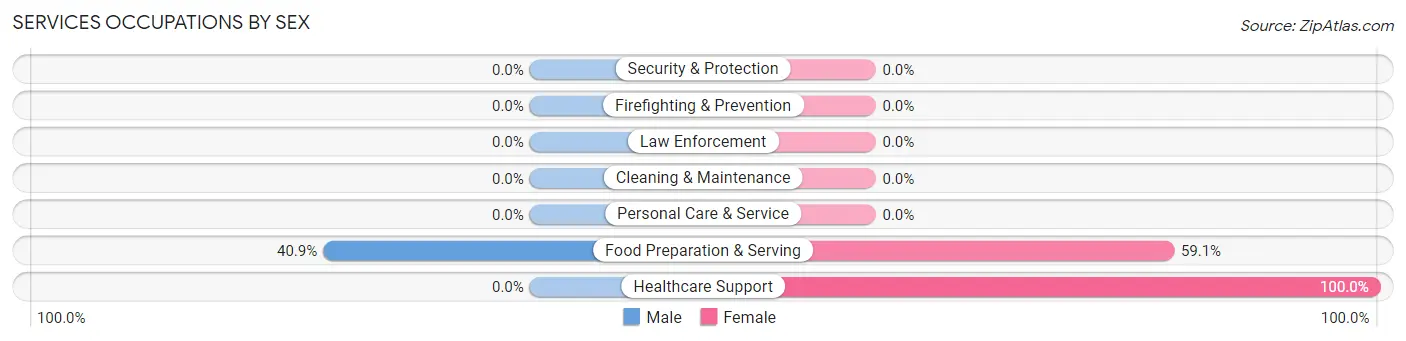
| Occupation | Male | Female |
| Healthcare Support | 0 (0.0%) | 42 (100.0%) |
| Security & Protection | 0 (0.0%) | 0 (0.0%) |
| Firefighting & Prevention | 0 (0.0%) | 0 (0.0%) |
| Law Enforcement | 0 (0.0%) | 0 (0.0%) |
| Food Preparation & Serving | 9 (40.9%) | 13 (59.1%) |
| Cleaning & Maintenance | 0 (0.0%) | 0 (0.0%) |
| Personal Care & Service | 0 (0.0%) | 0 (0.0%) |
| Total (Category) | 9 (14.1%) | 55 (85.9%) |
| Total (Overall) | 389 (63.9%) | 220 (36.1%) |
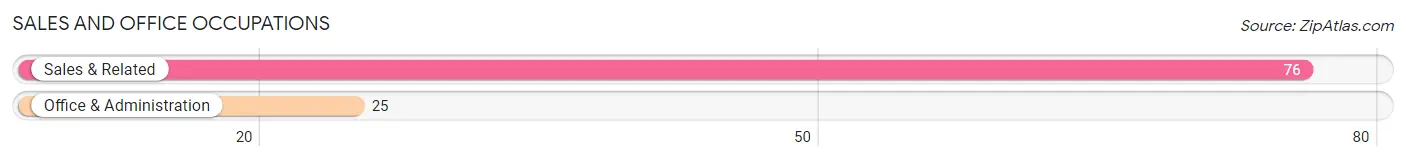
Sales and Office Occupations
The most common Sales and Office occupations in Olivet are Sales & Related (76 | 12.5%), and Office & Administration (25 | 4.1%).
Sales and Office Occupations by Sex
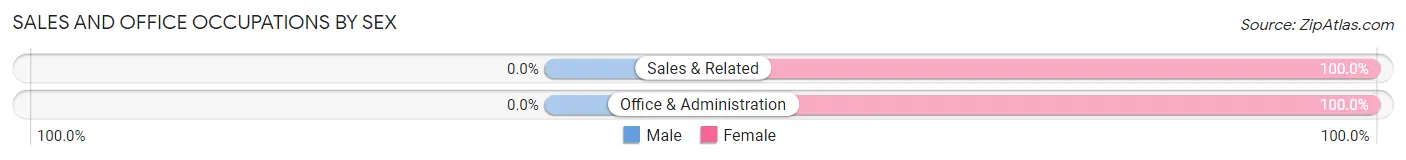
| Occupation | Male | Female |
| Sales & Related | 0 (0.0%) | 76 (100.0%) |
| Office & Administration | 0 (0.0%) | 25 (100.0%) |
| Total (Category) | 0 (0.0%) | 101 (100.0%) |
| Total (Overall) | 389 (63.9%) | 220 (36.1%) |
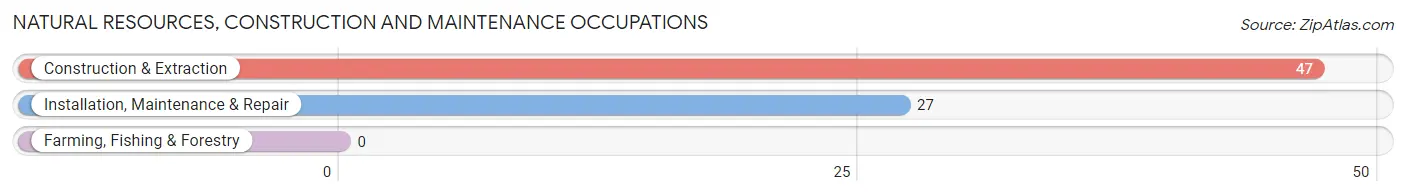
Natural Resources, Construction and Maintenance Occupations
The most common Natural Resources, Construction and Maintenance occupations in Olivet are Construction & Extraction (47 | 7.7%), and Installation, Maintenance & Repair (27 | 4.4%).
Natural Resources, Construction and Maintenance Occupations by Sex
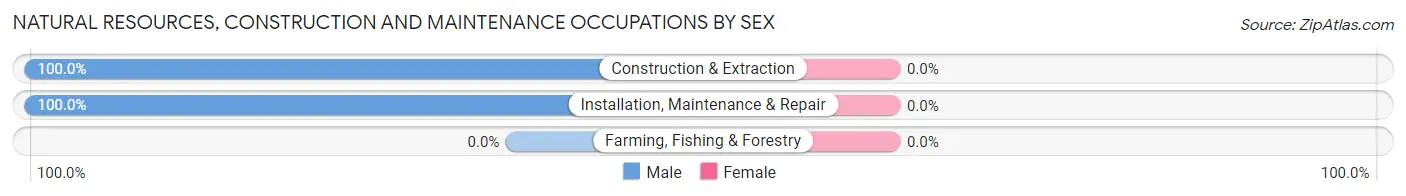
| Occupation | Male | Female |
| Farming, Fishing & Forestry | 0 (0.0%) | 0 (0.0%) |
| Construction & Extraction | 47 (100.0%) | 0 (0.0%) |
| Installation, Maintenance & Repair | 27 (100.0%) | 0 (0.0%) |
| Total (Category) | 74 (100.0%) | 0 (0.0%) |
| Total (Overall) | 389 (63.9%) | 220 (36.1%) |
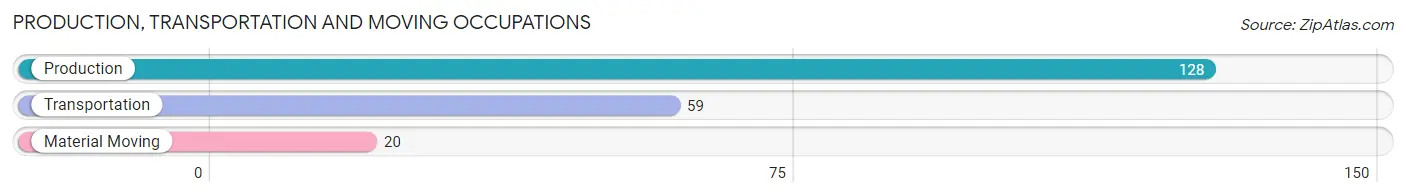
Production, Transportation and Moving Occupations
The most common Production, Transportation and Moving occupations in Olivet are Production (128 | 21.0%), Transportation (59 | 9.7%), and Material Moving (20 | 3.3%).
Production, Transportation and Moving Occupations by Sex
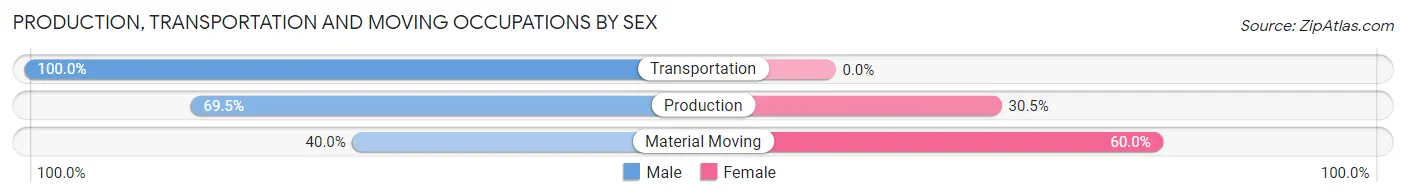
| Occupation | Male | Female |
| Production | 89 (69.5%) | 39 (30.5%) |
| Transportation | 59 (100.0%) | 0 (0.0%) |
| Material Moving | 8 (40.0%) | 12 (60.0%) |
| Total (Category) | 156 (75.4%) | 51 (24.6%) |
| Total (Overall) | 389 (63.9%) | 220 (36.1%) |
Employment Industries by Sex in Olivet
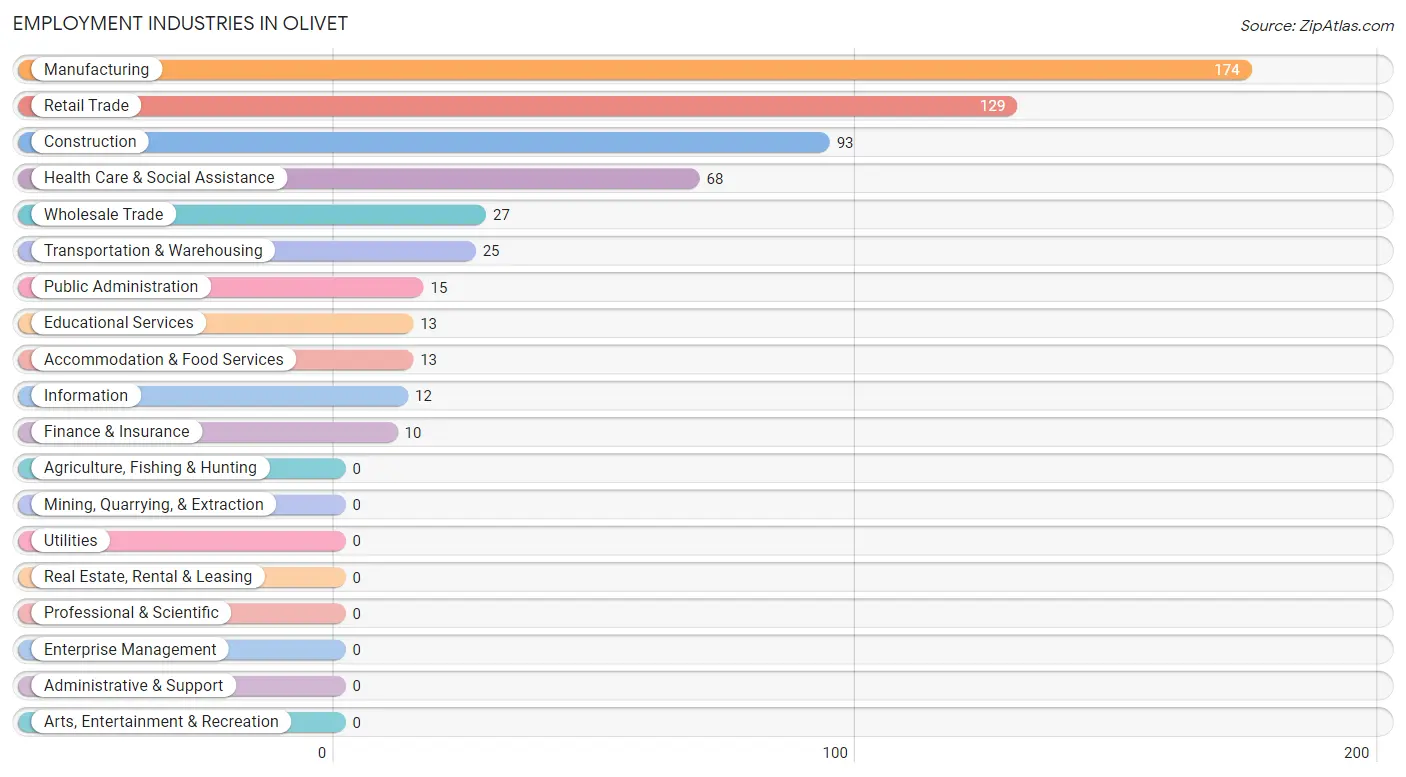
Employment Industries in Olivet
The major employment industries in Olivet include Manufacturing (174 | 28.6%), Retail Trade (129 | 21.2%), Construction (93 | 15.3%), Health Care & Social Assistance (68 | 11.2%), and Wholesale Trade (27 | 4.4%).
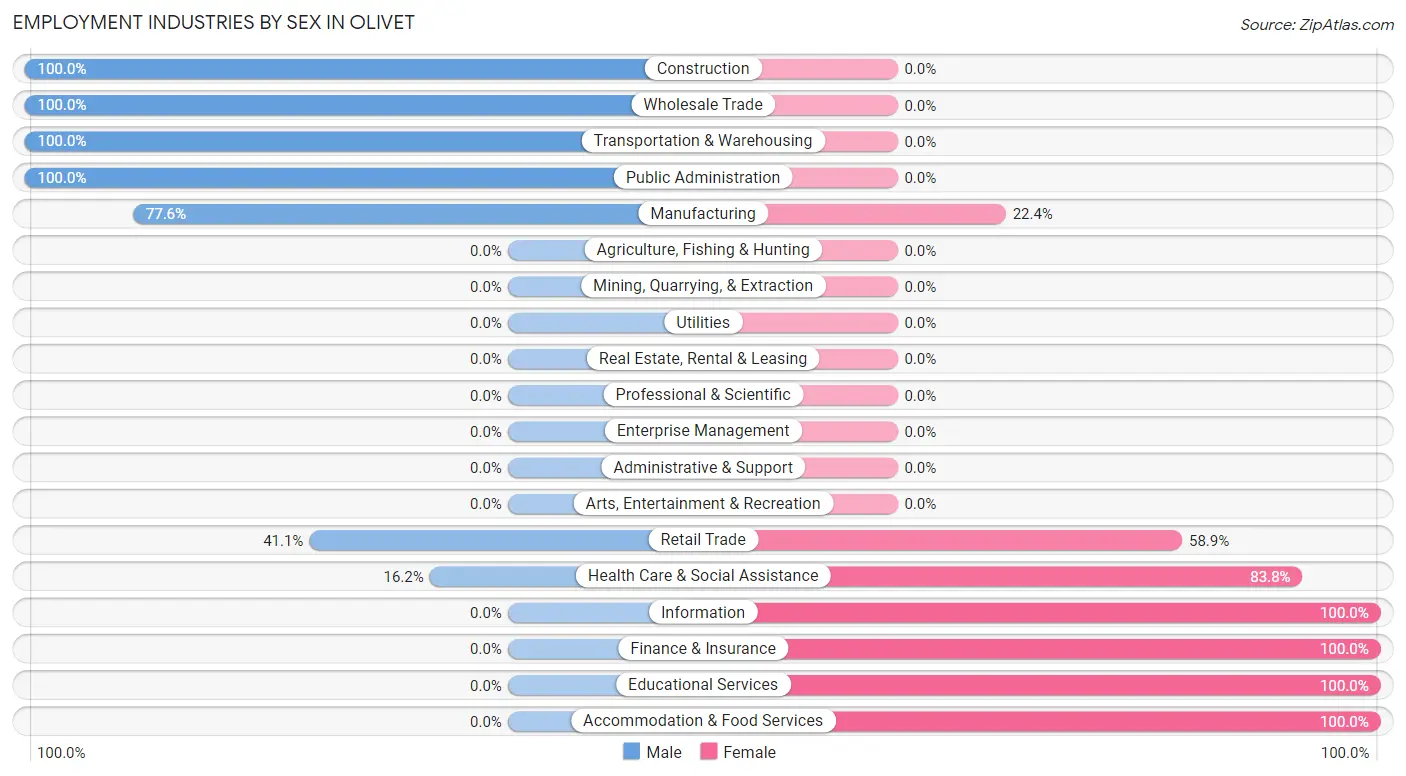
Employment Industries by Sex in Olivet
The Olivet industries that see more men than women are Construction (100.0%), Wholesale Trade (100.0%), and Transportation & Warehousing (100.0%), whereas the industries that tend to have a higher number of women are Information (100.0%), Finance & Insurance (100.0%), and Educational Services (100.0%).
| Industry | Male | Female |
| Agriculture, Fishing & Hunting | 0 (0.0%) | 0 (0.0%) |
| Mining, Quarrying, & Extraction | 0 (0.0%) | 0 (0.0%) |
| Construction | 93 (100.0%) | 0 (0.0%) |
| Manufacturing | 135 (77.6%) | 39 (22.4%) |
| Wholesale Trade | 27 (100.0%) | 0 (0.0%) |
| Retail Trade | 53 (41.1%) | 76 (58.9%) |
| Transportation & Warehousing | 25 (100.0%) | 0 (0.0%) |
| Utilities | 0 (0.0%) | 0 (0.0%) |
| Information | 0 (0.0%) | 12 (100.0%) |
| Finance & Insurance | 0 (0.0%) | 10 (100.0%) |
| Real Estate, Rental & Leasing | 0 (0.0%) | 0 (0.0%) |
| Professional & Scientific | 0 (0.0%) | 0 (0.0%) |
| Enterprise Management | 0 (0.0%) | 0 (0.0%) |
| Administrative & Support | 0 (0.0%) | 0 (0.0%) |
| Educational Services | 0 (0.0%) | 13 (100.0%) |
| Health Care & Social Assistance | 11 (16.2%) | 57 (83.8%) |
| Arts, Entertainment & Recreation | 0 (0.0%) | 0 (0.0%) |
| Accommodation & Food Services | 0 (0.0%) | 13 (100.0%) |
| Public Administration | 15 (100.0%) | 0 (0.0%) |
| Total | 389 (63.9%) | 220 (36.1%) |
Education in Olivet
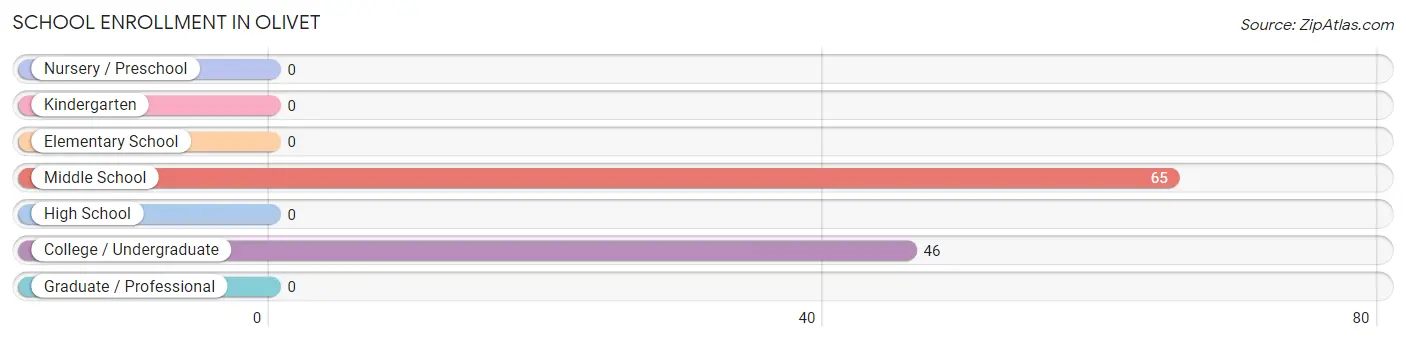
School Enrollment in Olivet
The most common levels of schooling among the 111 students in Olivet are middle school (65 | 58.6%), and college / undergraduate (46 | 41.4%).
| School Level | # Students | % Students |
| Nursery / Preschool | 0 | 0.0% |
| Kindergarten | 0 | 0.0% |
| Elementary School | 0 | 0.0% |
| Middle School | 65 | 58.6% |
| High School | 0 | 0.0% |
| College / Undergraduate | 46 | 41.4% |
| Graduate / Professional | 0 | 0.0% |
| Total | 111 | 100.0% |
School Enrollment by Age by Funding Source in Olivet
Out of a total of 111 students who are enrolled in schools in Olivet, 29 (26.1%) attend a private institution, while the remaining 82 (73.9%) are enrolled in public schools. The age group of 10 to 14 year olds has the highest likelihood of being enrolled in private schools, with 29 (44.6% in the age bracket) enrolled. Conversely, the age group of 18 to 19 year olds has the lowest likelihood of being enrolled in a private school, with 22 (100.0% in the age bracket) attending a public institution.
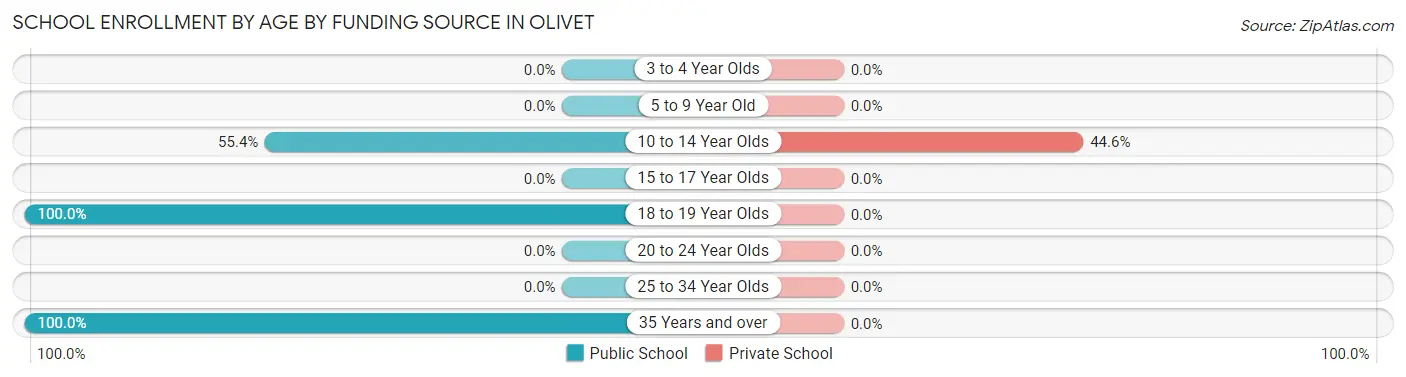
| Age Bracket | Public School | Private School |
| 3 to 4 Year Olds | 0 (0.0%) | 0 (0.0%) |
| 5 to 9 Year Old | 0 (0.0%) | 0 (0.0%) |
| 10 to 14 Year Olds | 36 (55.4%) | 29 (44.6%) |
| 15 to 17 Year Olds | 0 (0.0%) | 0 (0.0%) |
| 18 to 19 Year Olds | 22 (100.0%) | 0 (0.0%) |
| 20 to 24 Year Olds | 0 (0.0%) | 0 (0.0%) |
| 25 to 34 Year Olds | 0 (0.0%) | 0 (0.0%) |
| 35 Years and over | 24 (100.0%) | 0 (0.0%) |
| Total | 82 (73.9%) | 29 (26.1%) |
Educational Attainment by Field of Study in Olivet
Education (54 | 54.5%), science & technology (33 | 33.3%), and business (12 | 12.1%) are the most common fields of study among 99 individuals in Olivet who have obtained a bachelor's degree or higher.
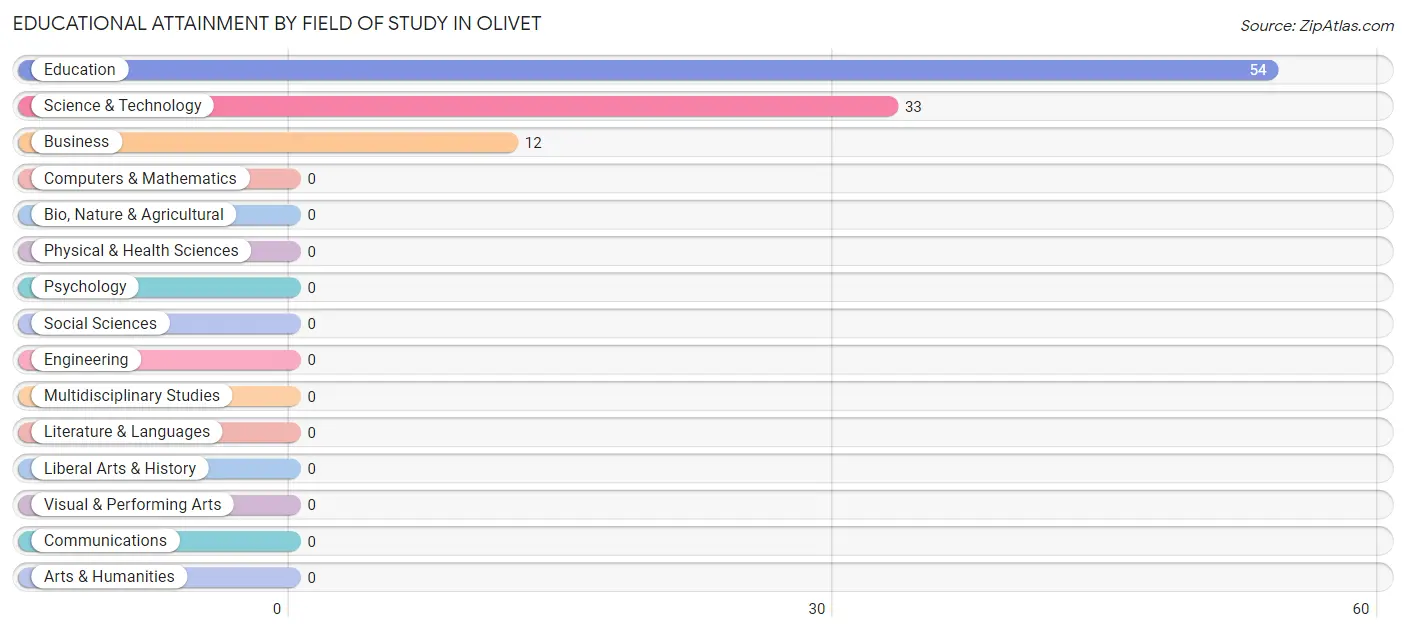
| Field of Study | # Graduates | % Graduates |
| Computers & Mathematics | 0 | 0.0% |
| Bio, Nature & Agricultural | 0 | 0.0% |
| Physical & Health Sciences | 0 | 0.0% |
| Psychology | 0 | 0.0% |
| Social Sciences | 0 | 0.0% |
| Engineering | 0 | 0.0% |
| Multidisciplinary Studies | 0 | 0.0% |
| Science & Technology | 33 | 33.3% |
| Business | 12 | 12.1% |
| Education | 54 | 54.5% |
| Literature & Languages | 0 | 0.0% |
| Liberal Arts & History | 0 | 0.0% |
| Visual & Performing Arts | 0 | 0.0% |
| Communications | 0 | 0.0% |
| Arts & Humanities | 0 | 0.0% |
| Total | 99 | 100.0% |
Transportation & Commute in Olivet
Vehicle Availability by Sex in Olivet
The most prevalent vehicle ownership categories in Olivet are males with 3 vehicles (151, accounting for 38.8%) and females with 3 vehicles (99, making up 77.0%).
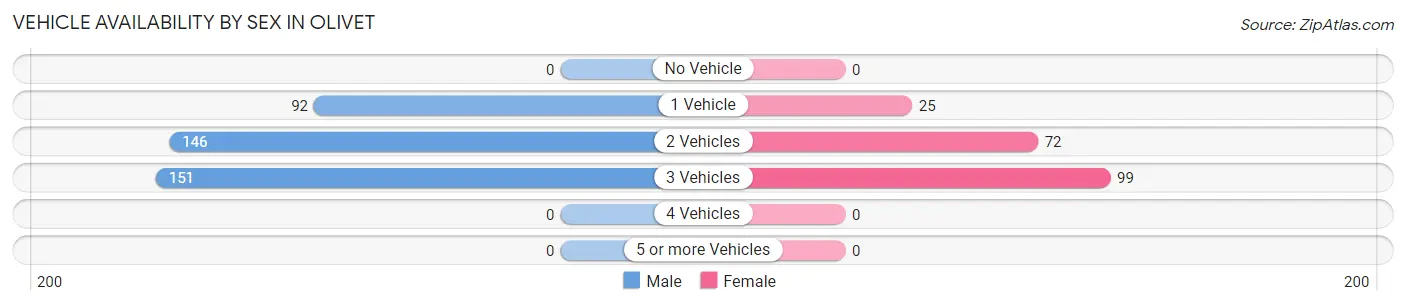
| Vehicles Available | Male | Female |
| No Vehicle | 0 (0.0%) | 0 (0.0%) |
| 1 Vehicle | 92 (23.6%) | 25 (12.8%) |
| 2 Vehicles | 146 (37.5%) | 72 (36.7%) |
| 3 Vehicles | 151 (38.8%) | 99 (50.5%) |
| 4 Vehicles | 0 (0.0%) | 0 (0.0%) |
| 5 or more Vehicles | 0 (0.0%) | 0 (0.0%) |
| Total | 389 (100.0%) | 196 (100.0%) |
Commute Time in Olivet
The most frequently occuring commute durations in Olivet are 10 to 14 minutes (201 commuters, 37.3%), 90 or more minutes (116 commuters, 21.5%), and 5 to 9 minutes (77 commuters, 14.3%).
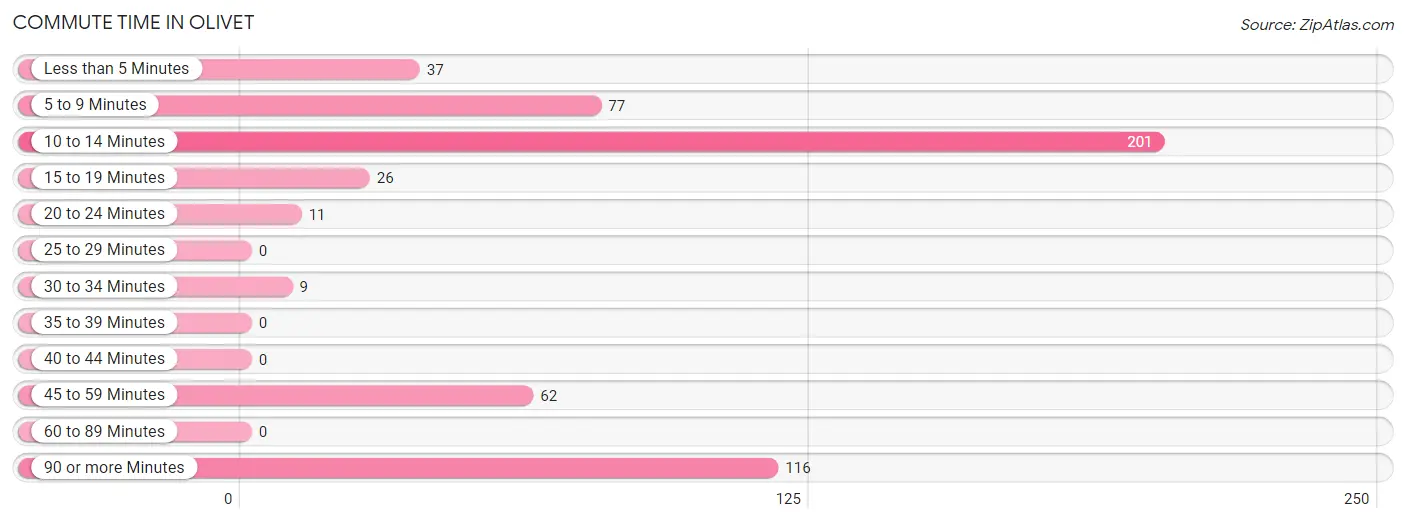
| Commute Time | # Commuters | % Commuters |
| Less than 5 Minutes | 37 | 6.9% |
| 5 to 9 Minutes | 77 | 14.3% |
| 10 to 14 Minutes | 201 | 37.3% |
| 15 to 19 Minutes | 26 | 4.8% |
| 20 to 24 Minutes | 11 | 2.0% |
| 25 to 29 Minutes | 0 | 0.0% |
| 30 to 34 Minutes | 9 | 1.7% |
| 35 to 39 Minutes | 0 | 0.0% |
| 40 to 44 Minutes | 0 | 0.0% |
| 45 to 59 Minutes | 62 | 11.5% |
| 60 to 89 Minutes | 0 | 0.0% |
| 90 or more Minutes | 116 | 21.5% |
Commute Time by Sex in Olivet
The most common commute times in Olivet are 90 or more minutes (116 commuters, 33.8%) for males and 10 to 14 minutes (145 commuters, 74.0%) for females.
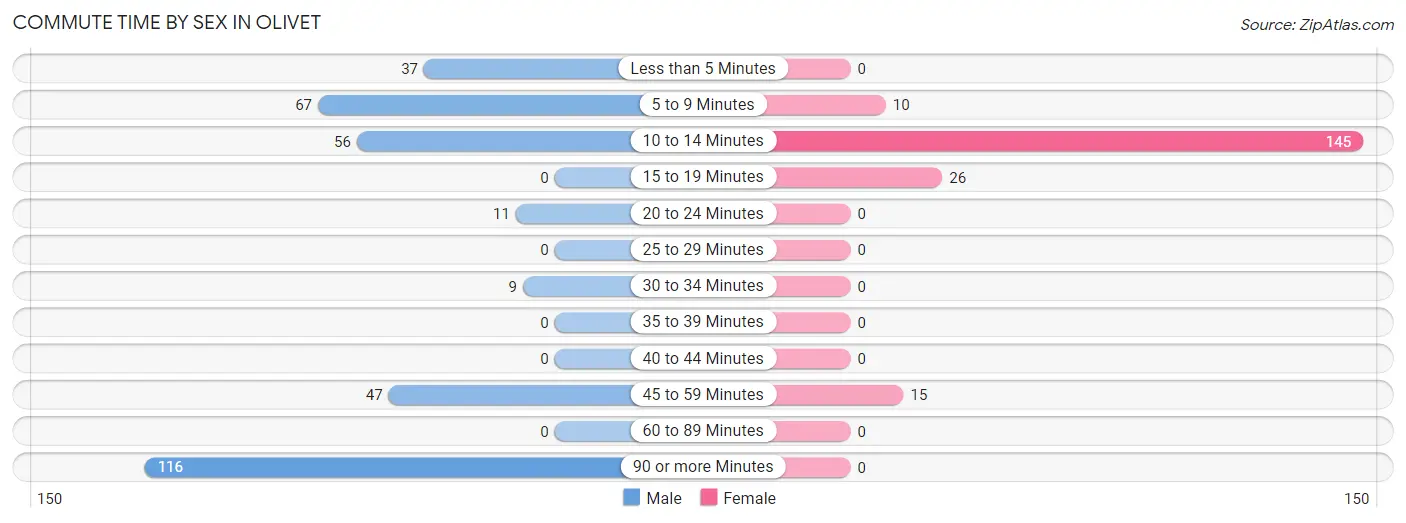
| Commute Time | Male | Female |
| Less than 5 Minutes | 37 (10.8%) | 0 (0.0%) |
| 5 to 9 Minutes | 67 (19.5%) | 10 (5.1%) |
| 10 to 14 Minutes | 56 (16.3%) | 145 (74.0%) |
| 15 to 19 Minutes | 0 (0.0%) | 26 (13.3%) |
| 20 to 24 Minutes | 11 (3.2%) | 0 (0.0%) |
| 25 to 29 Minutes | 0 (0.0%) | 0 (0.0%) |
| 30 to 34 Minutes | 9 (2.6%) | 0 (0.0%) |
| 35 to 39 Minutes | 0 (0.0%) | 0 (0.0%) |
| 40 to 44 Minutes | 0 (0.0%) | 0 (0.0%) |
| 45 to 59 Minutes | 47 (13.7%) | 15 (7.6%) |
| 60 to 89 Minutes | 0 (0.0%) | 0 (0.0%) |
| 90 or more Minutes | 116 (33.8%) | 0 (0.0%) |
Time of Departure to Work by Sex in Olivet
The most frequent times of departure to work in Olivet are 4:00 PM to 11:59 PM (95, 27.7%) for males and 6:30 AM to 6:59 AM (101, 51.5%) for females.
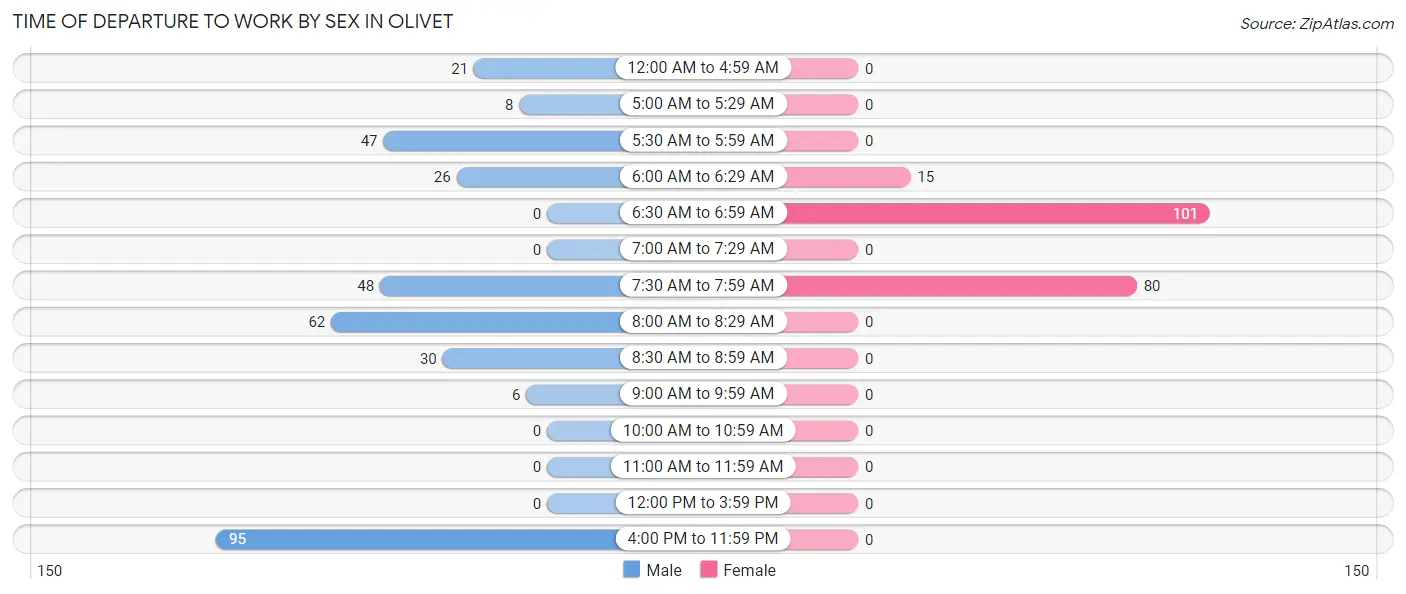
| Time of Departure | Male | Female |
| 12:00 AM to 4:59 AM | 21 (6.1%) | 0 (0.0%) |
| 5:00 AM to 5:29 AM | 8 (2.3%) | 0 (0.0%) |
| 5:30 AM to 5:59 AM | 47 (13.7%) | 0 (0.0%) |
| 6:00 AM to 6:29 AM | 26 (7.6%) | 15 (7.6%) |
| 6:30 AM to 6:59 AM | 0 (0.0%) | 101 (51.5%) |
| 7:00 AM to 7:29 AM | 0 (0.0%) | 0 (0.0%) |
| 7:30 AM to 7:59 AM | 48 (14.0%) | 80 (40.8%) |
| 8:00 AM to 8:29 AM | 62 (18.1%) | 0 (0.0%) |
| 8:30 AM to 8:59 AM | 30 (8.7%) | 0 (0.0%) |
| 9:00 AM to 9:59 AM | 6 (1.8%) | 0 (0.0%) |
| 10:00 AM to 10:59 AM | 0 (0.0%) | 0 (0.0%) |
| 11:00 AM to 11:59 AM | 0 (0.0%) | 0 (0.0%) |
| 12:00 PM to 3:59 PM | 0 (0.0%) | 0 (0.0%) |
| 4:00 PM to 11:59 PM | 95 (27.7%) | 0 (0.0%) |
| Total | 343 (100.0%) | 196 (100.0%) |
Housing Occupancy in Olivet
Occupancy by Ownership in Olivet
Of the total 536 dwellings in Olivet, owner-occupied units account for 428 (79.8%), while renter-occupied units make up 108 (20.2%).
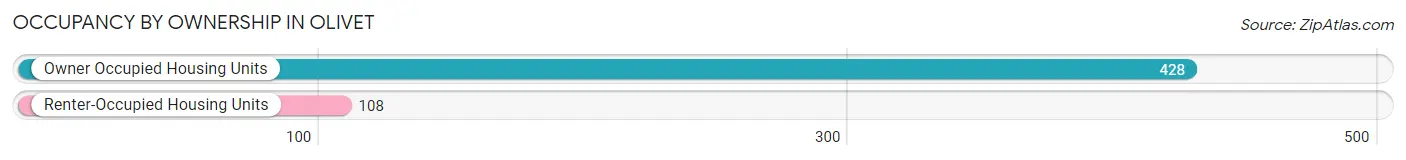
| Occupancy | # Housing Units | % Housing Units |
| Owner Occupied Housing Units | 428 | 79.8% |
| Renter-Occupied Housing Units | 108 | 20.2% |
| Total Occupied Housing Units | 536 | 100.0% |
Occupancy by Household Size in Olivet
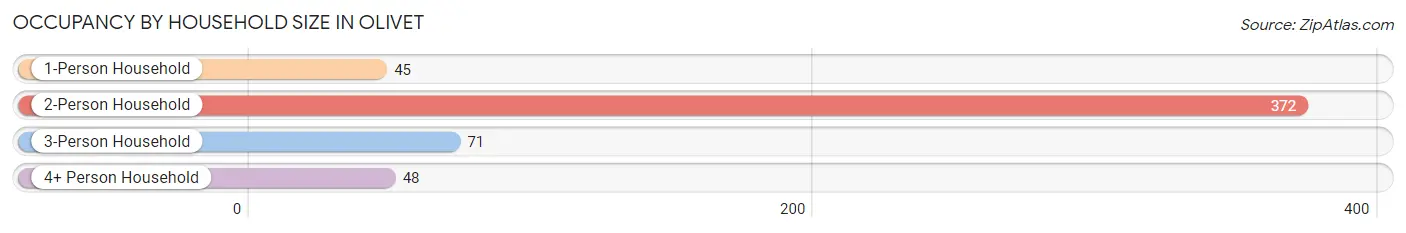
| Household Size | # Housing Units | % Housing Units |
| 1-Person Household | 45 | 8.4% |
| 2-Person Household | 372 | 69.4% |
| 3-Person Household | 71 | 13.3% |
| 4+ Person Household | 48 | 9.0% |
| Total Housing Units | 536 | 100.0% |
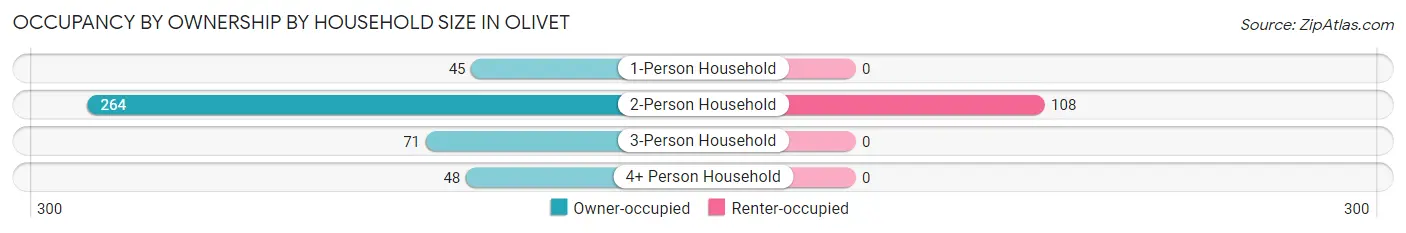
Occupancy by Ownership by Household Size in Olivet
| Household Size | Owner-occupied | Renter-occupied |
| 1-Person Household | 45 (100.0%) | 0 (0.0%) |
| 2-Person Household | 264 (71.0%) | 108 (29.0%) |
| 3-Person Household | 71 (100.0%) | 0 (0.0%) |
| 4+ Person Household | 48 (100.0%) | 0 (0.0%) |
| Total Housing Units | 428 (79.8%) | 108 (20.2%) |
Occupancy by Educational Attainment in Olivet
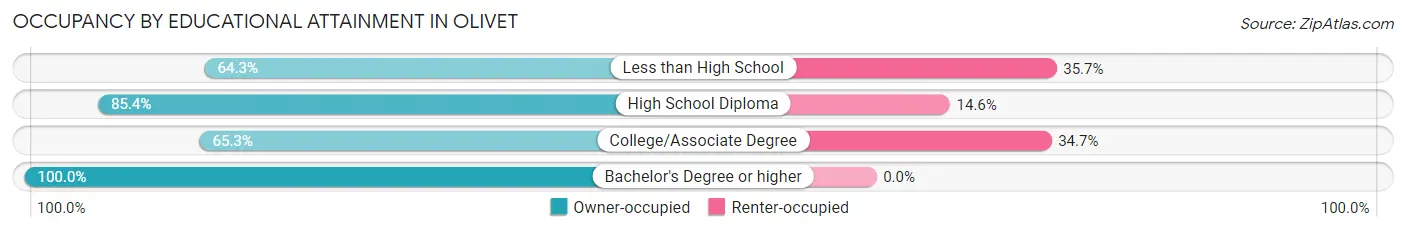
| Household Size | Owner-occupied | Renter-occupied |
| Less than High School | 36 (64.3%) | 20 (35.7%) |
| High School Diploma | 270 (85.4%) | 46 (14.6%) |
| College/Associate Degree | 79 (65.3%) | 42 (34.7%) |
| Bachelor's Degree or higher | 43 (100.0%) | 0 (0.0%) |
Occupancy by Age of Householder in Olivet
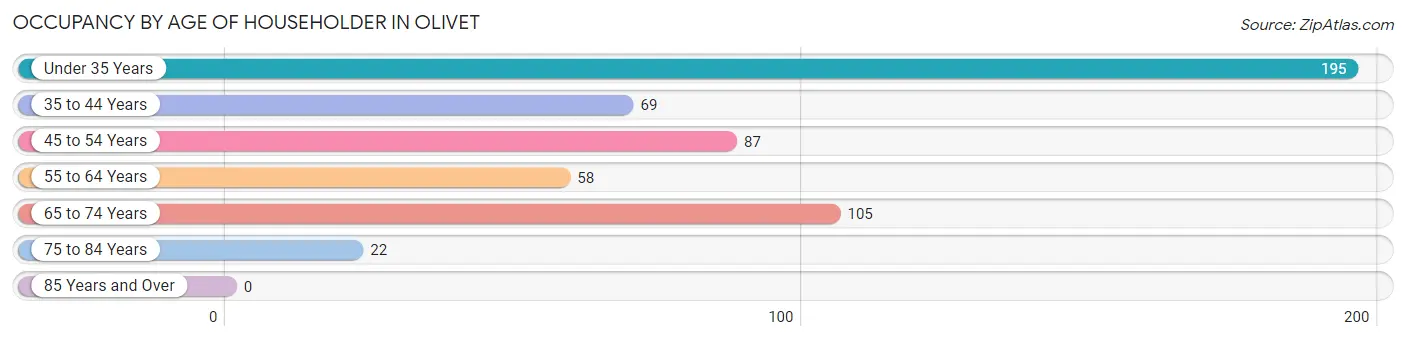
| Age Bracket | # Households | % Households |
| Under 35 Years | 195 | 36.4% |
| 35 to 44 Years | 69 | 12.9% |
| 45 to 54 Years | 87 | 16.2% |
| 55 to 64 Years | 58 | 10.8% |
| 65 to 74 Years | 105 | 19.6% |
| 75 to 84 Years | 22 | 4.1% |
| 85 Years and Over | 0 | 0.0% |
| Total | 536 | 100.0% |
Housing Finances in Olivet
Median Income by Occupancy in Olivet
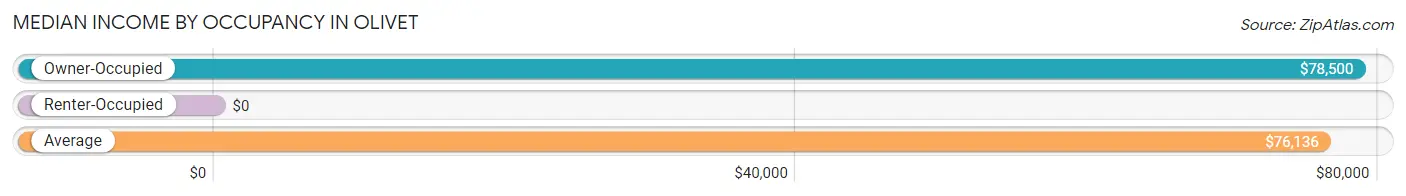
| Occupancy Type | # Households | Median Income |
| Owner-Occupied | 428 (79.8%) | $78,500 |
| Renter-Occupied | 108 (20.2%) | $0 |
| Average | 536 (100.0%) | $76,136 |
Occupancy by Householder Income Bracket in Olivet
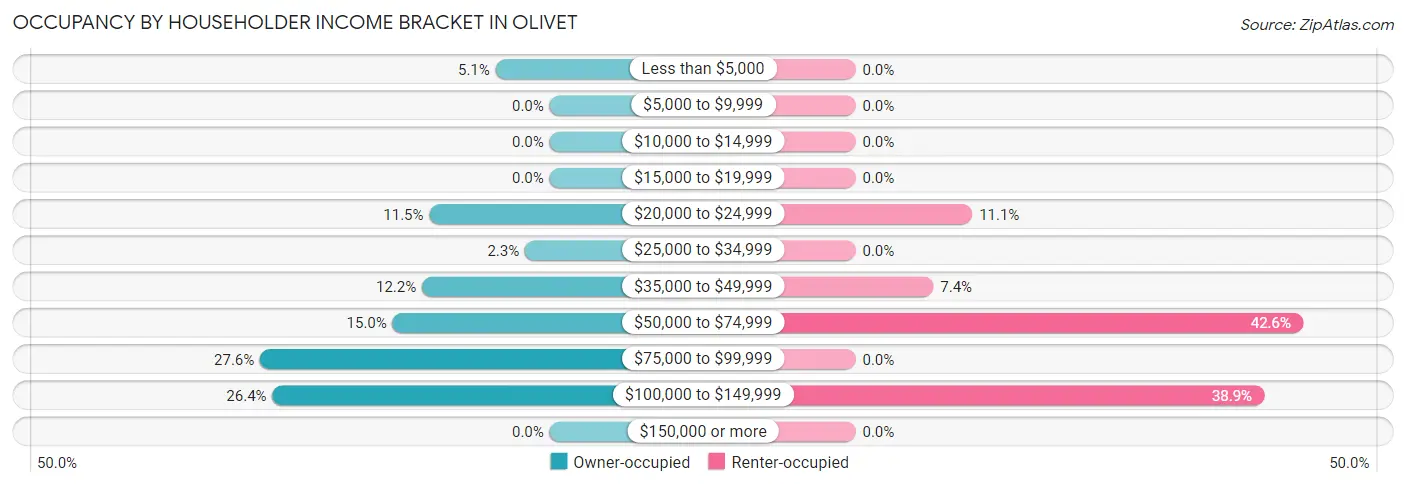
| Income Bracket | Owner-occupied | Renter-occupied |
| Less than $5,000 | 22 (5.1%) | 0 (0.0%) |
| $5,000 to $9,999 | 0 (0.0%) | 0 (0.0%) |
| $10,000 to $14,999 | 0 (0.0%) | 0 (0.0%) |
| $15,000 to $19,999 | 0 (0.0%) | 0 (0.0%) |
| $20,000 to $24,999 | 49 (11.5%) | 12 (11.1%) |
| $25,000 to $34,999 | 10 (2.3%) | 0 (0.0%) |
| $35,000 to $49,999 | 52 (12.1%) | 8 (7.4%) |
| $50,000 to $74,999 | 64 (14.9%) | 46 (42.6%) |
| $75,000 to $99,999 | 118 (27.6%) | 0 (0.0%) |
| $100,000 to $149,999 | 113 (26.4%) | 42 (38.9%) |
| $150,000 or more | 0 (0.0%) | 0 (0.0%) |
| Total | 428 (100.0%) | 108 (100.0%) |
Monthly Housing Cost Tiers in Olivet
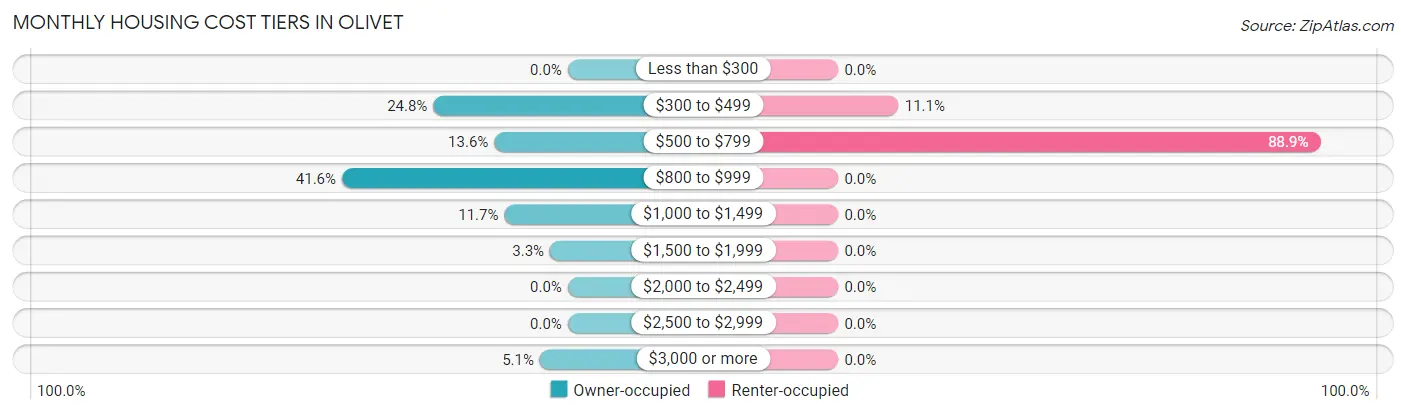
| Monthly Cost | Owner-occupied | Renter-occupied |
| Less than $300 | 0 (0.0%) | 0 (0.0%) |
| $300 to $499 | 106 (24.8%) | 12 (11.1%) |
| $500 to $799 | 58 (13.6%) | 96 (88.9%) |
| $800 to $999 | 178 (41.6%) | 0 (0.0%) |
| $1,000 to $1,499 | 50 (11.7%) | 0 (0.0%) |
| $1,500 to $1,999 | 14 (3.3%) | 0 (0.0%) |
| $2,000 to $2,499 | 0 (0.0%) | 0 (0.0%) |
| $2,500 to $2,999 | 0 (0.0%) | 0 (0.0%) |
| $3,000 or more | 22 (5.1%) | 0 (0.0%) |
| Total | 428 (100.0%) | 108 (100.0%) |
Physical Housing Characteristics in Olivet
Housing Structures in Olivet
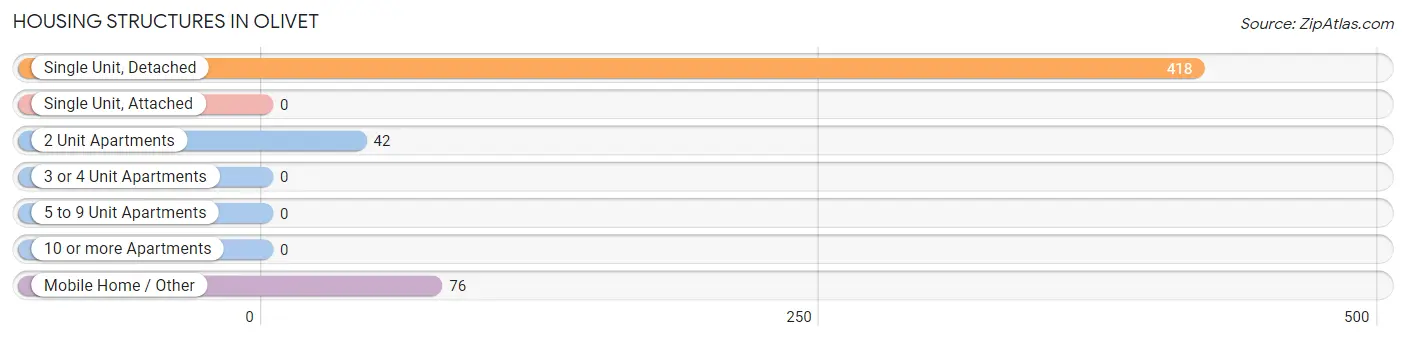
| Structure Type | # Housing Units | % Housing Units |
| Single Unit, Detached | 418 | 78.0% |
| Single Unit, Attached | 0 | 0.0% |
| 2 Unit Apartments | 42 | 7.8% |
| 3 or 4 Unit Apartments | 0 | 0.0% |
| 5 to 9 Unit Apartments | 0 | 0.0% |
| 10 or more Apartments | 0 | 0.0% |
| Mobile Home / Other | 76 | 14.2% |
| Total | 536 | 100.0% |
Housing Structures by Occupancy in Olivet
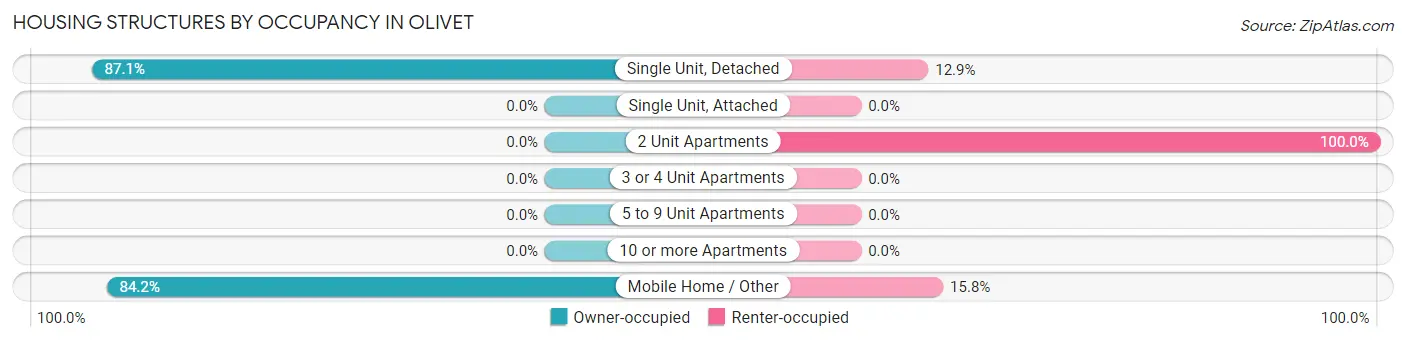
| Structure Type | Owner-occupied | Renter-occupied |
| Single Unit, Detached | 364 (87.1%) | 54 (12.9%) |
| Single Unit, Attached | 0 (0.0%) | 0 (0.0%) |
| 2 Unit Apartments | 0 (0.0%) | 42 (100.0%) |
| 3 or 4 Unit Apartments | 0 (0.0%) | 0 (0.0%) |
| 5 to 9 Unit Apartments | 0 (0.0%) | 0 (0.0%) |
| 10 or more Apartments | 0 (0.0%) | 0 (0.0%) |
| Mobile Home / Other | 64 (84.2%) | 12 (15.8%) |
| Total | 428 (79.8%) | 108 (20.2%) |
Housing Structures by Number of Rooms in Olivet
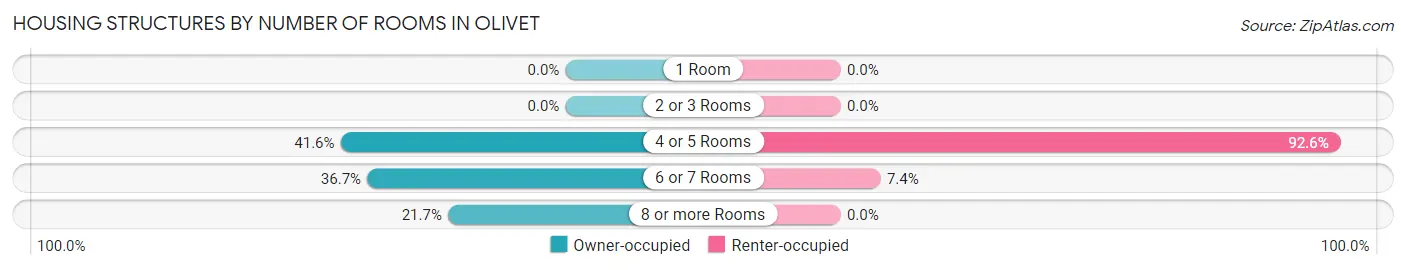
| Number of Rooms | Owner-occupied | Renter-occupied |
| 1 Room | 0 (0.0%) | 0 (0.0%) |
| 2 or 3 Rooms | 0 (0.0%) | 0 (0.0%) |
| 4 or 5 Rooms | 178 (41.6%) | 100 (92.6%) |
| 6 or 7 Rooms | 157 (36.7%) | 8 (7.4%) |
| 8 or more Rooms | 93 (21.7%) | 0 (0.0%) |
| Total | 428 (100.0%) | 108 (100.0%) |
Housing Structure by Heating Type in Olivet
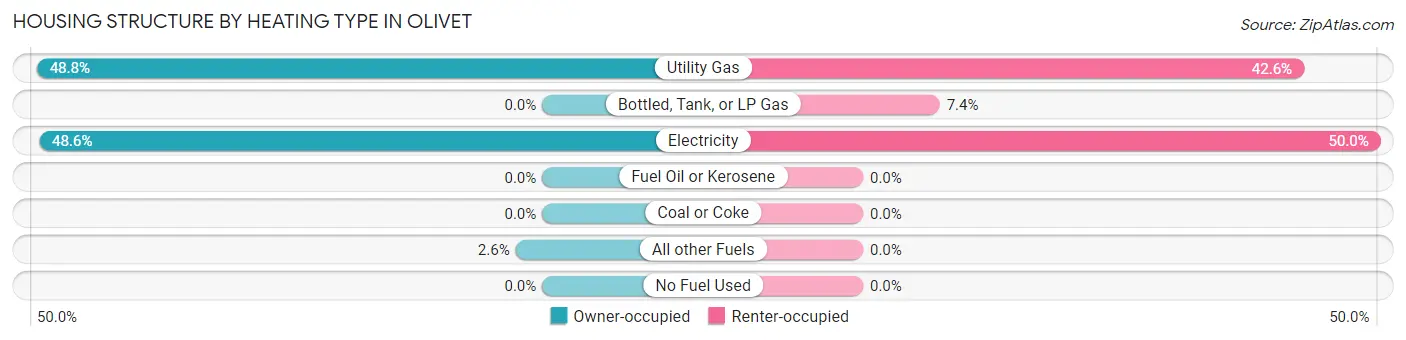
| Heating Type | Owner-occupied | Renter-occupied |
| Utility Gas | 209 (48.8%) | 46 (42.6%) |
| Bottled, Tank, or LP Gas | 0 (0.0%) | 8 (7.4%) |
| Electricity | 208 (48.6%) | 54 (50.0%) |
| Fuel Oil or Kerosene | 0 (0.0%) | 0 (0.0%) |
| Coal or Coke | 0 (0.0%) | 0 (0.0%) |
| All other Fuels | 11 (2.6%) | 0 (0.0%) |
| No Fuel Used | 0 (0.0%) | 0 (0.0%) |
| Total | 428 (100.0%) | 108 (100.0%) |
Household Vehicle Usage in Olivet
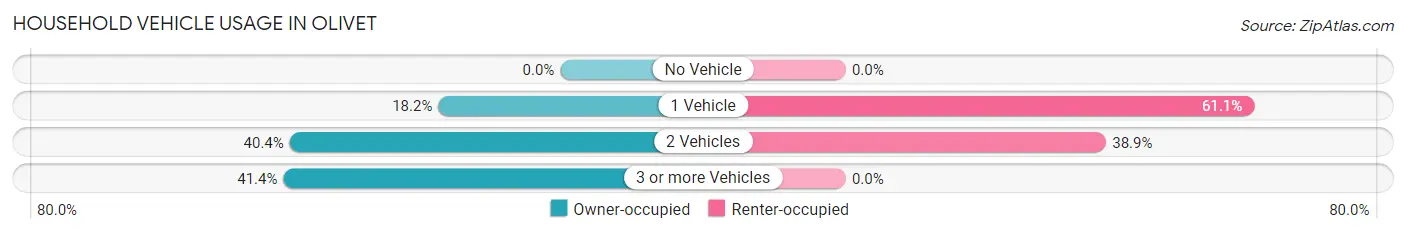
| Vehicles per Household | Owner-occupied | Renter-occupied |
| No Vehicle | 0 (0.0%) | 0 (0.0%) |
| 1 Vehicle | 78 (18.2%) | 66 (61.1%) |
| 2 Vehicles | 173 (40.4%) | 42 (38.9%) |
| 3 or more Vehicles | 177 (41.4%) | 0 (0.0%) |
| Total | 428 (100.0%) | 108 (100.0%) |
Real Estate & Mortgages in Olivet
Real Estate and Mortgage Overview in Olivet
| Characteristic | Without Mortgage | With Mortgage |
| Housing Units | 111 | 317 |
| Median Property Value | $189,600 | $121,600 |
| Median Household Income | $44,659 | $0 |
| Monthly Housing Costs | $384 | $22 |
| Real Estate Taxes | $562 | $26 |
Property Value by Mortgage Status in Olivet
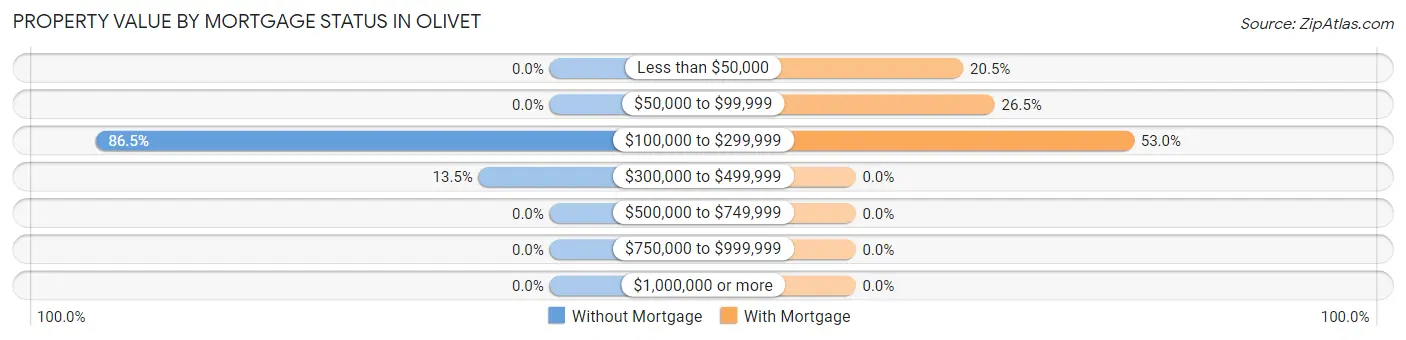
| Property Value | Without Mortgage | With Mortgage |
| Less than $50,000 | 0 (0.0%) | 65 (20.5%) |
| $50,000 to $99,999 | 0 (0.0%) | 84 (26.5%) |
| $100,000 to $299,999 | 96 (86.5%) | 168 (53.0%) |
| $300,000 to $499,999 | 15 (13.5%) | 0 (0.0%) |
| $500,000 to $749,999 | 0 (0.0%) | 0 (0.0%) |
| $750,000 to $999,999 | 0 (0.0%) | 0 (0.0%) |
| $1,000,000 or more | 0 (0.0%) | 0 (0.0%) |
| Total | 111 (100.0%) | 317 (100.0%) |
Household Income by Mortgage Status in Olivet
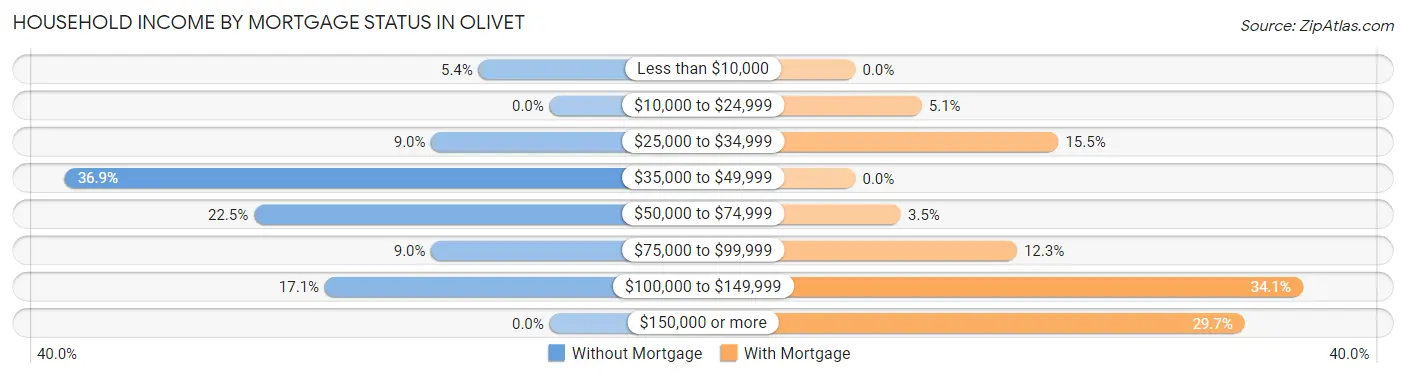
| Household Income | Without Mortgage | With Mortgage |
| Less than $10,000 | 6 (5.4%) | 0 (0.0%) |
| $10,000 to $24,999 | 0 (0.0%) | 16 (5.1%) |
| $25,000 to $34,999 | 10 (9.0%) | 49 (15.5%) |
| $35,000 to $49,999 | 41 (36.9%) | 0 (0.0%) |
| $50,000 to $74,999 | 25 (22.5%) | 11 (3.5%) |
| $75,000 to $99,999 | 10 (9.0%) | 39 (12.3%) |
| $100,000 to $149,999 | 19 (17.1%) | 108 (34.1%) |
| $150,000 or more | 0 (0.0%) | 94 (29.6%) |
| Total | 111 (100.0%) | 317 (100.0%) |
Property Value to Household Income Ratio in Olivet
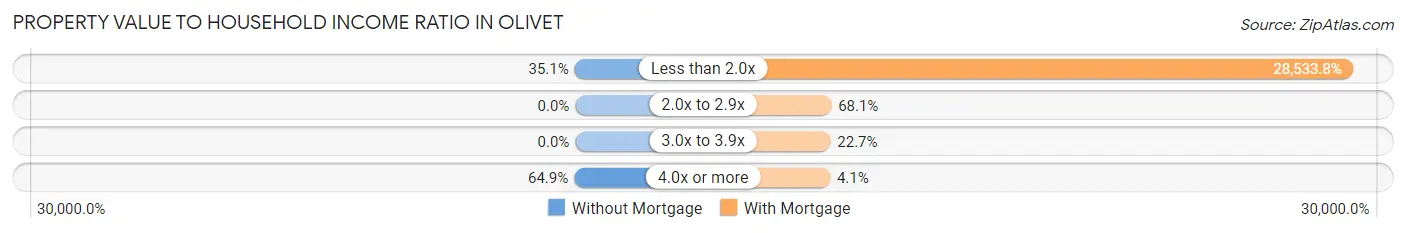
| Value-to-Income Ratio | Without Mortgage | With Mortgage |
| Less than 2.0x | 39 (35.1%) | 90,452 (28,533.7%) |
| 2.0x to 2.9x | 0 (0.0%) | 216 (68.1%) |
| 3.0x to 3.9x | 0 (0.0%) | 72 (22.7%) |
| 4.0x or more | 72 (64.9%) | 13 (4.1%) |
| Total | 111 (100.0%) | 317 (100.0%) |
Real Estate Taxes by Mortgage Status in Olivet
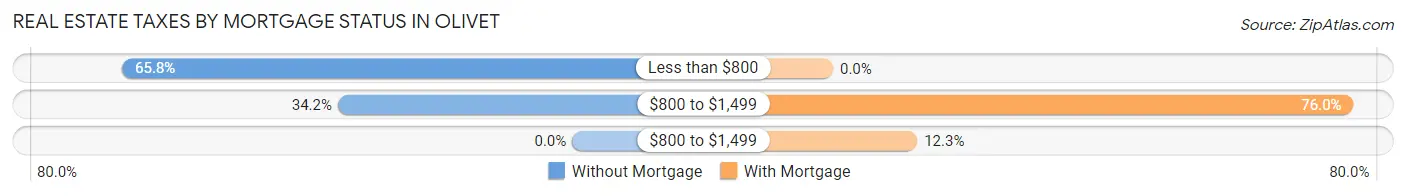
| Property Taxes | Without Mortgage | With Mortgage |
| Less than $800 | 73 (65.8%) | 0 (0.0%) |
| $800 to $1,499 | 38 (34.2%) | 241 (76.0%) |
| $800 to $1,499 | 0 (0.0%) | 39 (12.3%) |
| Total | 111 (100.0%) | 317 (100.0%) |
Health & Disability in Olivet
Health Insurance Coverage by Age in Olivet
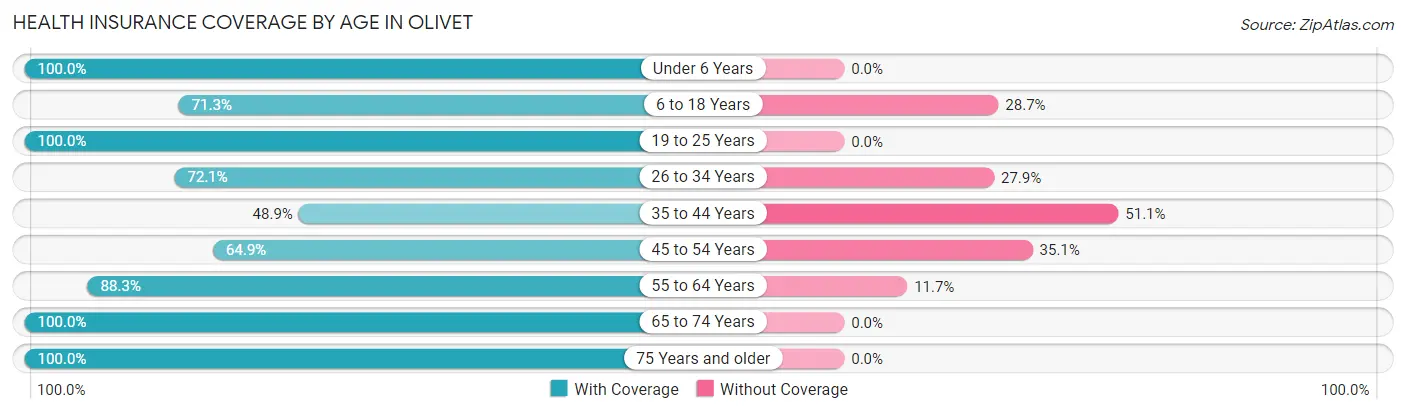
| Age Bracket | With Coverage | Without Coverage |
| Under 6 Years | 55 (100.0%) | 0 (0.0%) |
| 6 to 18 Years | 62 (71.3%) | 25 (28.7%) |
| 19 to 25 Years | 71 (100.0%) | 0 (0.0%) |
| 26 to 34 Years | 209 (72.1%) | 81 (27.9%) |
| 35 to 44 Years | 44 (48.9%) | 46 (51.1%) |
| 45 to 54 Years | 194 (64.9%) | 105 (35.1%) |
| 55 to 64 Years | 158 (88.3%) | 21 (11.7%) |
| 65 to 74 Years | 206 (100.0%) | 0 (0.0%) |
| 75 Years and older | 37 (100.0%) | 0 (0.0%) |
| Total | 1,036 (78.8%) | 278 (21.2%) |
Health Insurance Coverage by Citizenship Status in Olivet
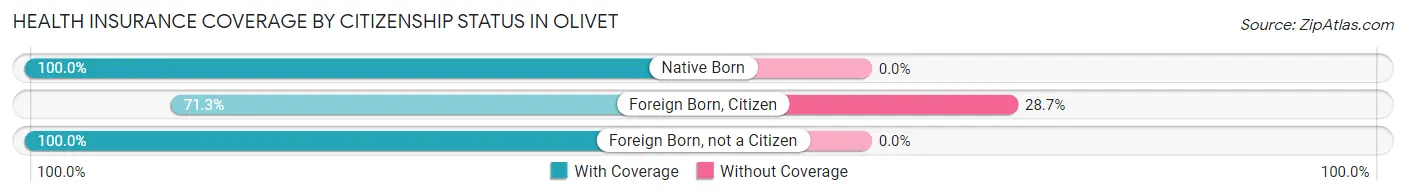
| Citizenship Status | With Coverage | Without Coverage |
| Native Born | 55 (100.0%) | 0 (0.0%) |
| Foreign Born, Citizen | 62 (71.3%) | 25 (28.7%) |
| Foreign Born, not a Citizen | 71 (100.0%) | 0 (0.0%) |
Health Insurance Coverage by Household Income in Olivet
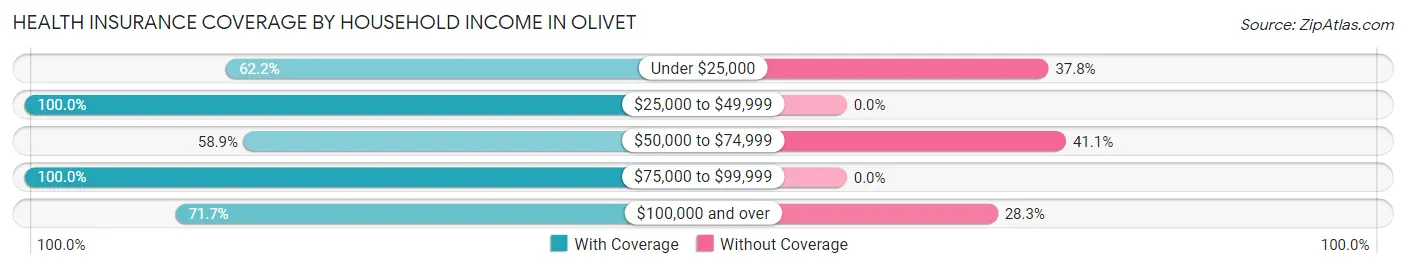
| Household Income | With Coverage | Without Coverage |
| Under $25,000 | 112 (62.2%) | 68 (37.8%) |
| $25,000 to $49,999 | 132 (100.0%) | 0 (0.0%) |
| $50,000 to $74,999 | 165 (58.9%) | 115 (41.1%) |
| $75,000 to $99,999 | 386 (100.0%) | 0 (0.0%) |
| $100,000 and over | 241 (71.7%) | 95 (28.3%) |
Public vs Private Health Insurance Coverage by Age in Olivet
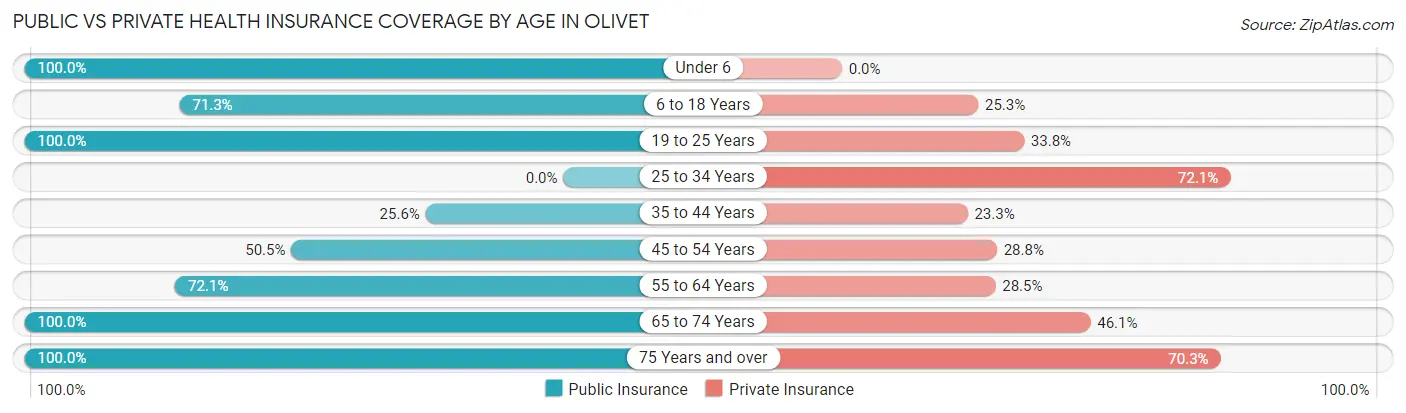
| Age Bracket | Public Insurance | Private Insurance |
| Under 6 | 55 (100.0%) | 0 (0.0%) |
| 6 to 18 Years | 62 (71.3%) | 22 (25.3%) |
| 19 to 25 Years | 71 (100.0%) | 24 (33.8%) |
| 25 to 34 Years | 0 (0.0%) | 209 (72.1%) |
| 35 to 44 Years | 23 (25.6%) | 21 (23.3%) |
| 45 to 54 Years | 151 (50.5%) | 86 (28.8%) |
| 55 to 64 Years | 129 (72.1%) | 51 (28.5%) |
| 65 to 74 Years | 206 (100.0%) | 95 (46.1%) |
| 75 Years and over | 37 (100.0%) | 26 (70.3%) |
| Total | 734 (55.9%) | 534 (40.6%) |
Disability Status by Sex by Age in Olivet
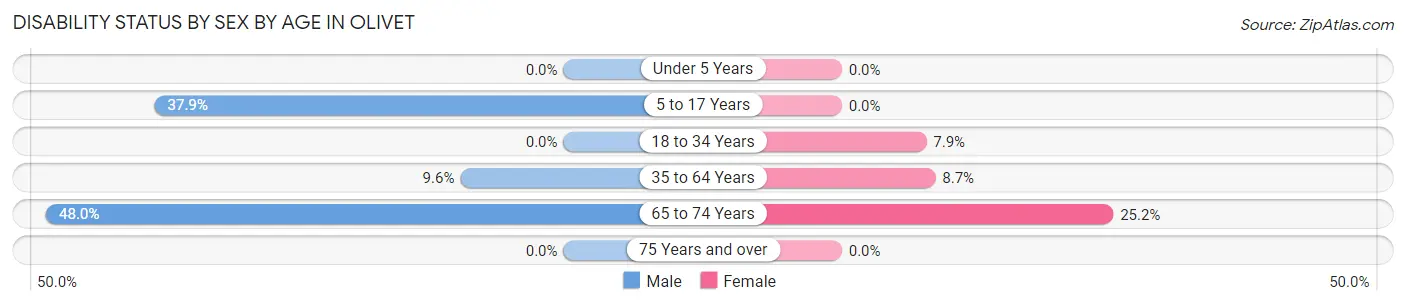
| Age Bracket | Male | Female |
| Under 5 Years | 0 (0.0%) | 0 (0.0%) |
| 5 to 17 Years | 22 (37.9%) | 0 (0.0%) |
| 18 to 34 Years | 0 (0.0%) | 15 (7.9%) |
| 35 to 64 Years | 29 (9.6%) | 23 (8.7%) |
| 65 to 74 Years | 36 (48.0%) | 33 (25.2%) |
| 75 Years and over | 0 (0.0%) | 0 (0.0%) |
Disability Class by Sex by Age in Olivet
Disability Class: Hearing Difficulty
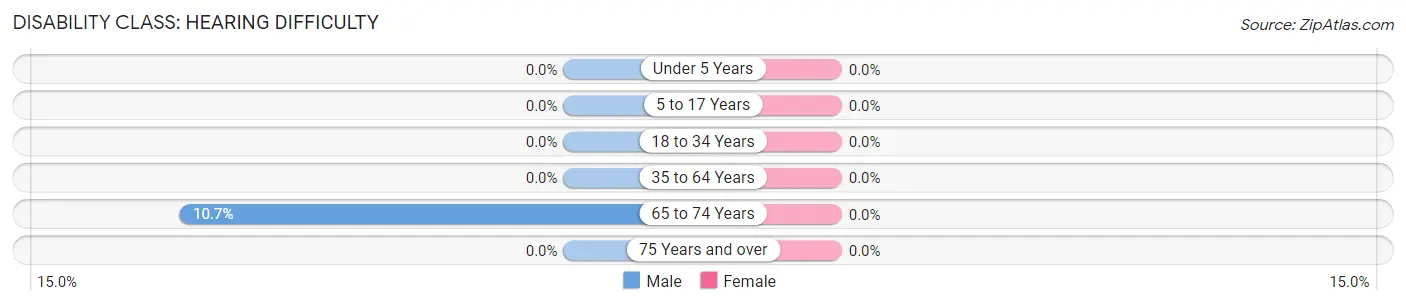
| Age Bracket | Male | Female |
| Under 5 Years | 0 (0.0%) | 0 (0.0%) |
| 5 to 17 Years | 0 (0.0%) | 0 (0.0%) |
| 18 to 34 Years | 0 (0.0%) | 0 (0.0%) |
| 35 to 64 Years | 0 (0.0%) | 0 (0.0%) |
| 65 to 74 Years | 8 (10.7%) | 0 (0.0%) |
| 75 Years and over | 0 (0.0%) | 0 (0.0%) |
Disability Class: Vision Difficulty
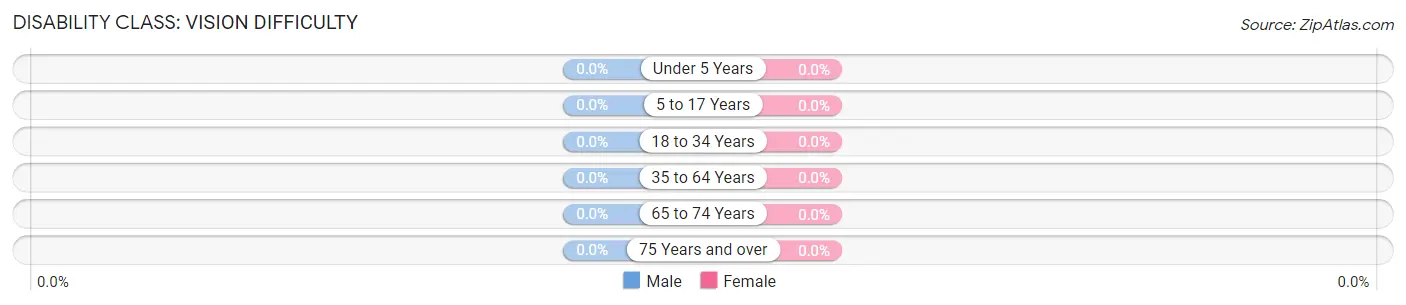
| Age Bracket | Male | Female |
| Under 5 Years | 0 (0.0%) | 0 (0.0%) |
| 5 to 17 Years | 0 (0.0%) | 0 (0.0%) |
| 18 to 34 Years | 0 (0.0%) | 0 (0.0%) |
| 35 to 64 Years | 0 (0.0%) | 0 (0.0%) |
| 65 to 74 Years | 0 (0.0%) | 0 (0.0%) |
| 75 Years and over | 0 (0.0%) | 0 (0.0%) |
Disability Class: Cognitive Difficulty
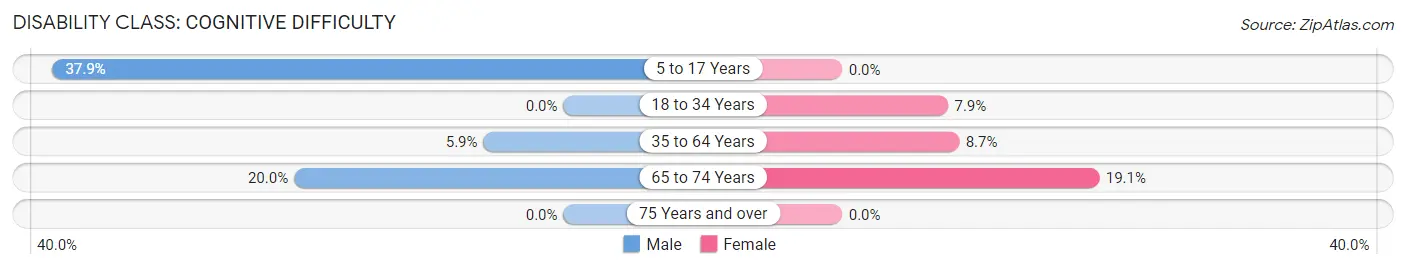
| Age Bracket | Male | Female |
| 5 to 17 Years | 22 (37.9%) | 0 (0.0%) |
| 18 to 34 Years | 0 (0.0%) | 15 (7.9%) |
| 35 to 64 Years | 18 (5.9%) | 23 (8.7%) |
| 65 to 74 Years | 15 (20.0%) | 25 (19.1%) |
| 75 Years and over | 0 (0.0%) | 0 (0.0%) |
Disability Class: Ambulatory Difficulty
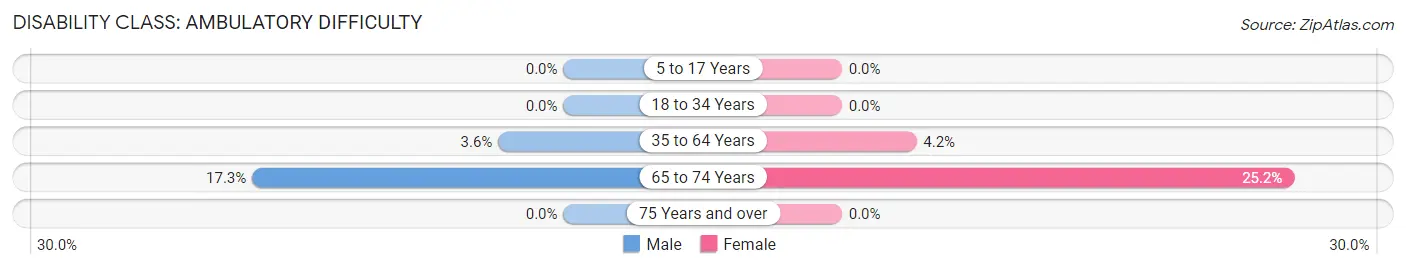
| Age Bracket | Male | Female |
| 5 to 17 Years | 0 (0.0%) | 0 (0.0%) |
| 18 to 34 Years | 0 (0.0%) | 0 (0.0%) |
| 35 to 64 Years | 11 (3.6%) | 11 (4.2%) |
| 65 to 74 Years | 13 (17.3%) | 33 (25.2%) |
| 75 Years and over | 0 (0.0%) | 0 (0.0%) |
Disability Class: Self-Care Difficulty
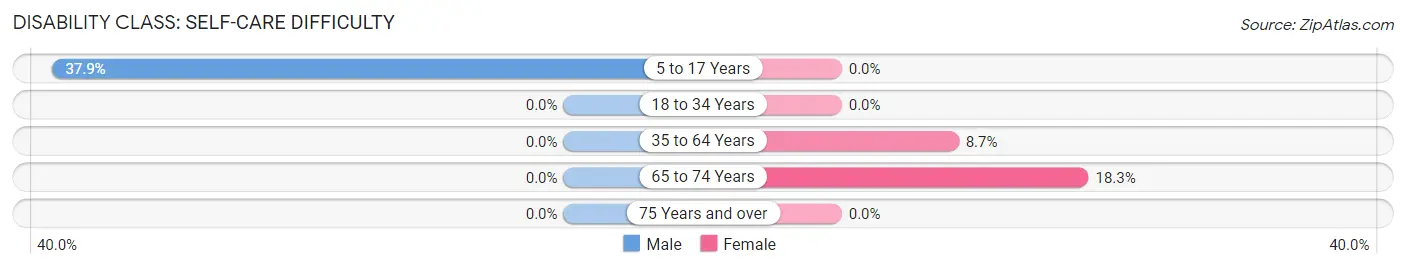
| Age Bracket | Male | Female |
| 5 to 17 Years | 22 (37.9%) | 0 (0.0%) |
| 18 to 34 Years | 0 (0.0%) | 0 (0.0%) |
| 35 to 64 Years | 0 (0.0%) | 23 (8.7%) |
| 65 to 74 Years | 0 (0.0%) | 24 (18.3%) |
| 75 Years and over | 0 (0.0%) | 0 (0.0%) |
Technology Access in Olivet
Computing Device Access in Olivet
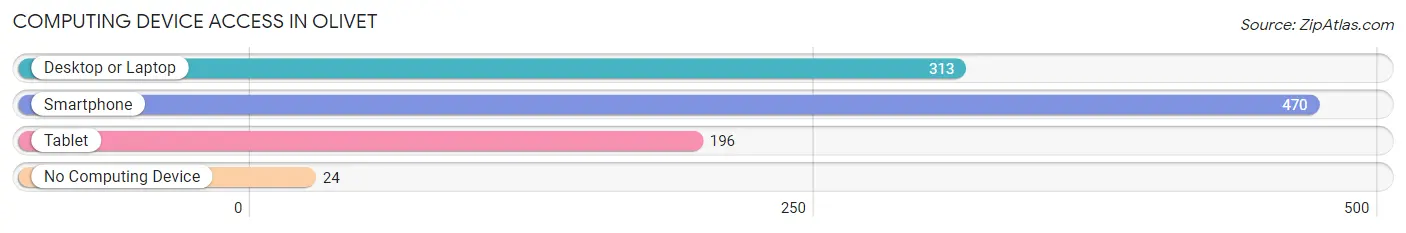
| Device Type | # Households | % Households |
| Desktop or Laptop | 313 | 58.4% |
| Smartphone | 470 | 87.7% |
| Tablet | 196 | 36.6% |
| No Computing Device | 24 | 4.5% |
| Total | 536 | 100.0% |
Internet Access in Olivet
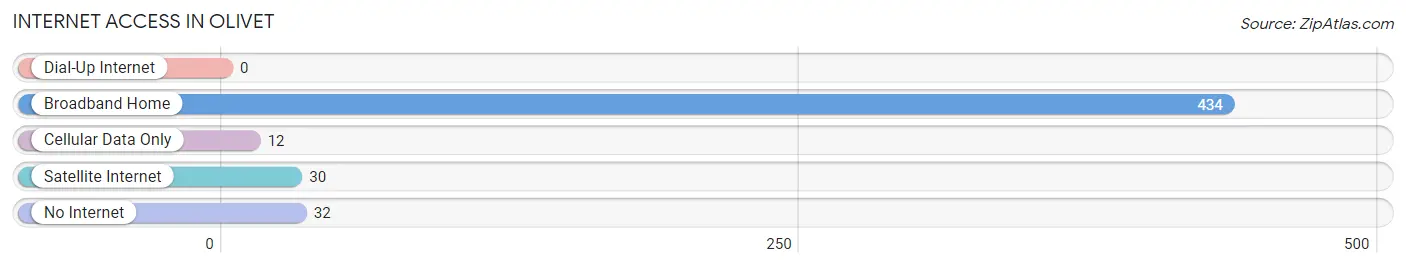
| Internet Type | # Households | % Households |
| Dial-Up Internet | 0 | 0.0% |
| Broadband Home | 434 | 81.0% |
| Cellular Data Only | 12 | 2.2% |
| Satellite Internet | 30 | 5.6% |
| No Internet | 32 | 6.0% |
| Total | 536 | 100.0% |
Olivet Summary
Olivet, Tennessee is a small town located in the southeastern part of the state, in the foothills of the Appalachian Mountains. It is situated in the county of Cocke, and is part of the Morristown Metropolitan Statistical Area. The town has a population of just over 1,000 people, and is known for its rural charm and small-town atmosphere.
History
Olivet was first settled in the early 1800s by a group of settlers from North Carolina. The town was originally known as “Olive Branch”, and was named after the olive trees that grew in the area. The town was officially incorporated in 1845, and the name was changed to Olivet.
The town was an important stop on the East Tennessee and Virginia Railroad, which ran through the area in the late 1800s. The railroad brought new industry and jobs to the area, and the town grew rapidly. By the early 1900s, Olivet had become a thriving community with a variety of businesses, including a cotton mill, a sawmill, and a gristmill.
Geography
Olivet is located in the foothills of the Appalachian Mountains, in the southeastern part of the state. The town is situated in the county of Cocke, and is part of the Morristown Metropolitan Statistical Area. The town is located at an elevation of 1,000 feet, and is surrounded by rolling hills and lush forests. The town is located near the French Broad River, and is just a short drive from the Great Smoky Mountains National Park.
Economy
Olivet’s economy is largely based on agriculture and tourism. The town is home to several farms, which produce a variety of crops, including corn, soybeans, and hay. The town is also home to several small businesses, including restaurants, shops, and a variety of other services.
Tourism is an important part of the local economy, as the town is located near the Great Smoky Mountains National Park. The park attracts thousands of visitors each year, and the town benefits from the influx of tourists.
Demographics
As of the 2010 census, Olivet had a population of 1,072 people. The town is predominantly white, with a small African American population. The median household income is $30,000, and the median age is 44. The town has a low unemployment rate, and the poverty rate is below the national average.
Conclusion
Olivet, Tennessee is a small town located in the southeastern part of the state, in the foothills of the Appalachian Mountains. The town has a population of just over 1,000 people, and is known for its rural charm and small-town atmosphere. The town’s economy is largely based on agriculture and tourism, and the town is home to several small businesses. The town is predominantly white, with a small African American population, and the median household income is $30,000. Olivet is an ideal place to live for those looking for a peaceful, rural lifestyle.
Common Questions
What is Per Capita Income in Olivet?
Per Capita income in Olivet is $31,910.
What is the Median Family Income in Olivet?
Median Family Income in Olivet is $54,130.
What is the Median Household income in Olivet?
Median Household Income in Olivet is $76,136.
What is Income or Wage Gap in Olivet?
Income or Wage Gap in Olivet is 61.7%.
Women in Olivet earn 38.3 cents for every dollar earned by a man.
What is Inequality or Gini Index in Olivet?
Inequality or Gini Index in Olivet is 0.30.
What is the Total Population of Olivet?
Total Population of Olivet is 1,314.
What is the Total Male Population of Olivet?
Total Male Population of Olivet is 677.
What is the Total Female Population of Olivet?
Total Female Population of Olivet is 637.
What is the Ratio of Males per 100 Females in Olivet?
There are 106.28 Males per 100 Females in Olivet.
What is the Ratio of Females per 100 Males in Olivet?
There are 94.09 Females per 100 Males in Olivet.
What is the Median Population Age in Olivet?
Median Population Age in Olivet is 45.7 Years.
What is the Average Family Size in Olivet
Average Family Size in Olivet is 2.7 People.
What is the Average Household Size in Olivet
Average Household Size in Olivet is 2.5 People.
How Large is the Labor Force in Olivet?
There are 609 People in the Labor Forcein in Olivet.
What is the Percentage of People in the Labor Force in Olivet?
51.0% of People are in the Labor Force in Olivet.