Enville, TN Map & Demographics
Enville Map
Enville Overview
$21,938
PER CAPITA INCOME
$58,750
AVG FAMILY INCOME
$17,143
AVG HOUSEHOLD INCOME
0.53
INEQUALITY / GINI INDEX
157
TOTAL POPULATION
83
MALE POPULATION
74
FEMALE POPULATION
112.16
MALES / 100 FEMALES
89.16
FEMALES / 100 MALES
61.5
MEDIAN AGE
3.1
AVG FAMILY SIZE
1.6
AVG HOUSEHOLD SIZE
38
LABOR FORCE [ PEOPLE ]
27.5%
PERCENT IN LABOR FORCE
5.3%
UNEMPLOYMENT RATE
Enville Zip Codes
Income in Enville
Income Overview in Enville
Per Capita Income in Enville is $21,938, while median incomes of families and households are $58,750 and $17,143 respectively.
| Characteristic | Number | Measure |
| Per Capita Income | 157 | $21,938 |
| Median Family Income | 28 | $58,750 |
| Mean Family Income | 28 | $68,529 |
| Median Household Income | 96 | $17,143 |
| Mean Household Income | 96 | $33,181 |
| Income Deficit | 28 | $0 |
| Wage / Income Gap (%) | 157 | 0.00% |
| Wage / Income Gap ($) | 157 | 100.00¢ per $1 |
| Gini / Inequality Index | 157 | 0.53 |
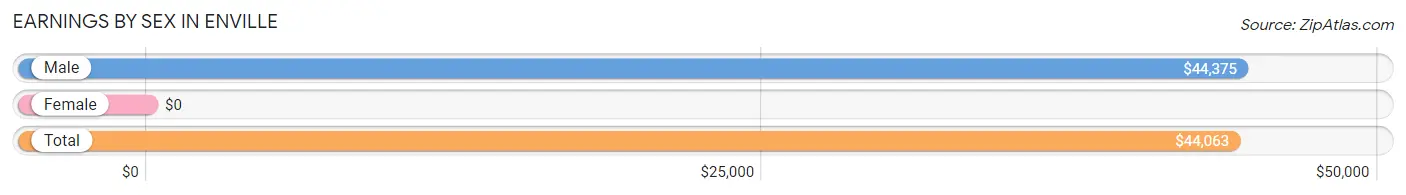
Earnings by Sex in Enville
| Sex | Number | Average Earnings |
| Male | 18 (46.2%) | $44,375 |
| Female | 21 (53.8%) | $0 |
| Total | 39 (100.0%) | $44,063 |
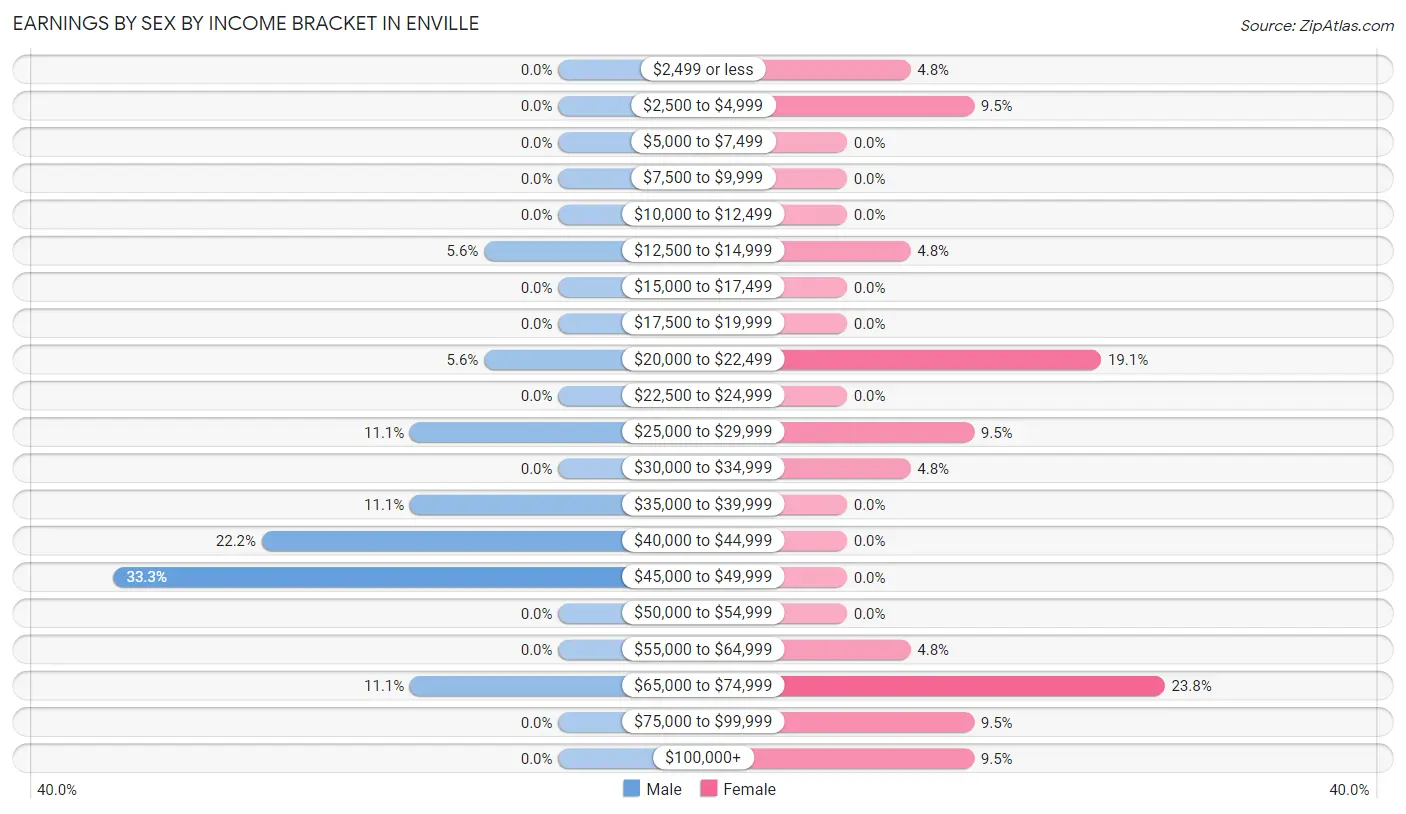
Earnings by Sex by Income Bracket in Enville
The most common earnings brackets in Enville are $45,000 to $49,999 for men (6 | 33.3%) and $65,000 to $74,999 for women (5 | 23.8%).
| Income | Male | Female |
| $2,499 or less | 0 (0.0%) | 1 (4.8%) |
| $2,500 to $4,999 | 0 (0.0%) | 2 (9.5%) |
| $5,000 to $7,499 | 0 (0.0%) | 0 (0.0%) |
| $7,500 to $9,999 | 0 (0.0%) | 0 (0.0%) |
| $10,000 to $12,499 | 0 (0.0%) | 0 (0.0%) |
| $12,500 to $14,999 | 1 (5.6%) | 1 (4.8%) |
| $15,000 to $17,499 | 0 (0.0%) | 0 (0.0%) |
| $17,500 to $19,999 | 0 (0.0%) | 0 (0.0%) |
| $20,000 to $22,499 | 1 (5.6%) | 4 (19.1%) |
| $22,500 to $24,999 | 0 (0.0%) | 0 (0.0%) |
| $25,000 to $29,999 | 2 (11.1%) | 2 (9.5%) |
| $30,000 to $34,999 | 0 (0.0%) | 1 (4.8%) |
| $35,000 to $39,999 | 2 (11.1%) | 0 (0.0%) |
| $40,000 to $44,999 | 4 (22.2%) | 0 (0.0%) |
| $45,000 to $49,999 | 6 (33.3%) | 0 (0.0%) |
| $50,000 to $54,999 | 0 (0.0%) | 0 (0.0%) |
| $55,000 to $64,999 | 0 (0.0%) | 1 (4.8%) |
| $65,000 to $74,999 | 2 (11.1%) | 5 (23.8%) |
| $75,000 to $99,999 | 0 (0.0%) | 2 (9.5%) |
| $100,000+ | 0 (0.0%) | 2 (9.5%) |
| Total | 18 (100.0%) | 21 (100.0%) |
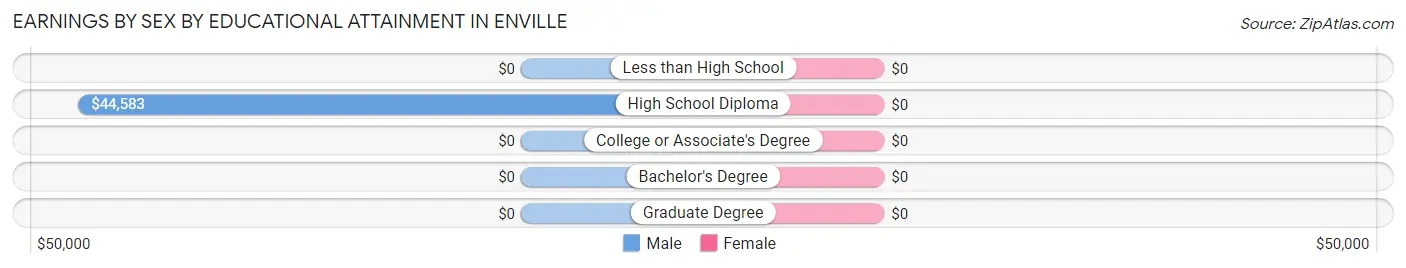
Earnings by Sex by Educational Attainment in Enville
| Educational Attainment | Male Income | Female Income |
| Less than High School | - | - |
| High School Diploma | $44,583 | $0 |
| College or Associate's Degree | - | - |
| Bachelor's Degree | - | - |
| Graduate Degree | - | - |
| Total | $44,375 | $0 |
Family Income in Enville
Family Income Brackets in Enville
According to the Enville family income data, there are 7 families falling into the $50,000 to $74,999 income range, which is the most common income bracket and makes up 25.0% of all families.
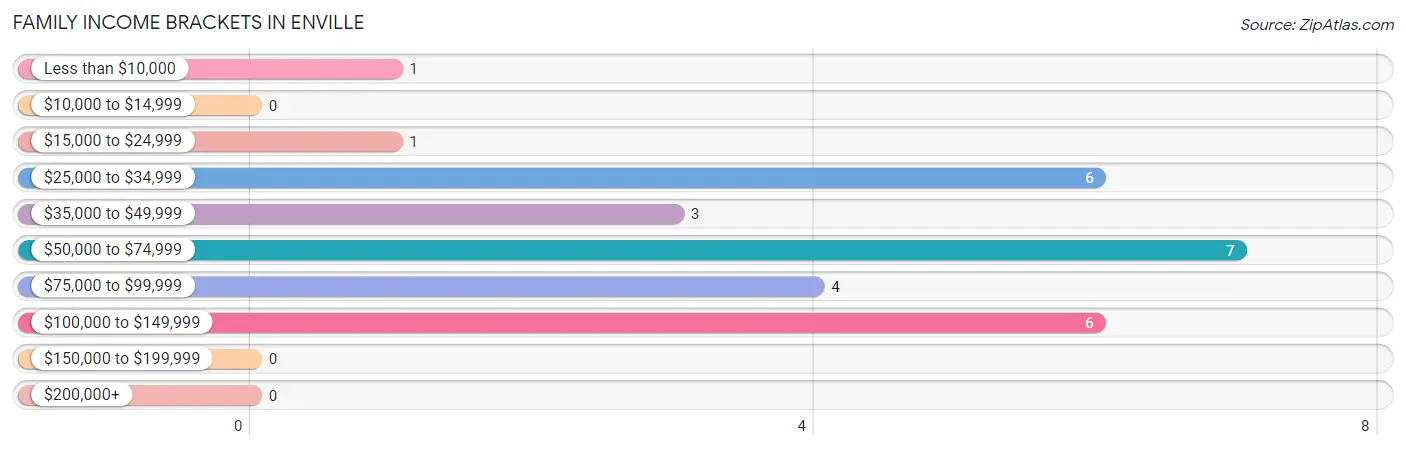
| Income Bracket | # Families | % Families |
| Less than $10,000 | 1 | 3.6% |
| $10,000 to $14,999 | 0 | 0.0% |
| $15,000 to $24,999 | 1 | 3.6% |
| $25,000 to $34,999 | 6 | 21.4% |
| $35,000 to $49,999 | 3 | 10.7% |
| $50,000 to $74,999 | 7 | 25.0% |
| $75,000 to $99,999 | 4 | 14.3% |
| $100,000 to $149,999 | 6 | 21.4% |
| $150,000 to $199,999 | 0 | 0.0% |
| $200,000+ | 0 | 0.0% |
Family Income by Famaliy Size in Enville
2-person families (19 | 67.9%) account for the highest median family income in Enville with $56,250 per family, while 2-person families (19 | 67.9%) have the highest median income of $28,125 per family member.
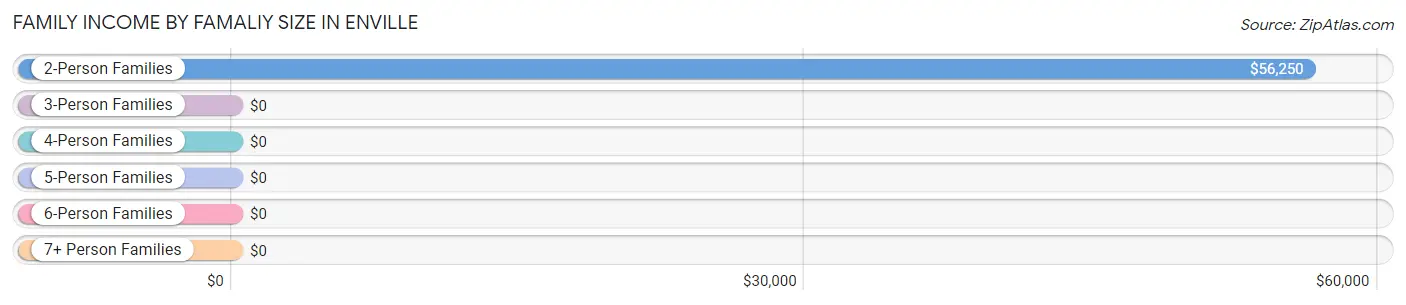
| Income Bracket | # Families | Median Income |
| 2-Person Families | 19 (67.9%) | $56,250 |
| 3-Person Families | 3 (10.7%) | $0 |
| 4-Person Families | 1 (3.6%) | $0 |
| 5-Person Families | 3 (10.7%) | $0 |
| 6-Person Families | 2 (7.1%) | $0 |
| 7+ Person Families | 0 (0.0%) | $0 |
| Total | 28 (100.0%) | $58,750 |
Family Income by Number of Earners in Enville
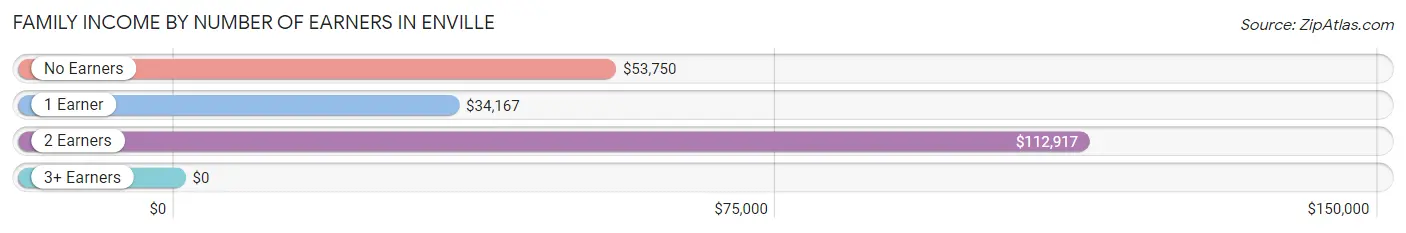
| Number of Earners | # Families | Median Income |
| No Earners | 9 (32.1%) | $53,750 |
| 1 Earner | 8 (28.6%) | $34,167 |
| 2 Earners | 11 (39.3%) | $112,917 |
| 3+ Earners | 0 (0.0%) | $0 |
| Total | 28 (100.0%) | $58,750 |
Household Income in Enville
Household Income Brackets in Enville
With 31 households falling in the category, the $15,000 to $24,999 income range is the most frequent in Enville, accounting for 32.3% of all households.
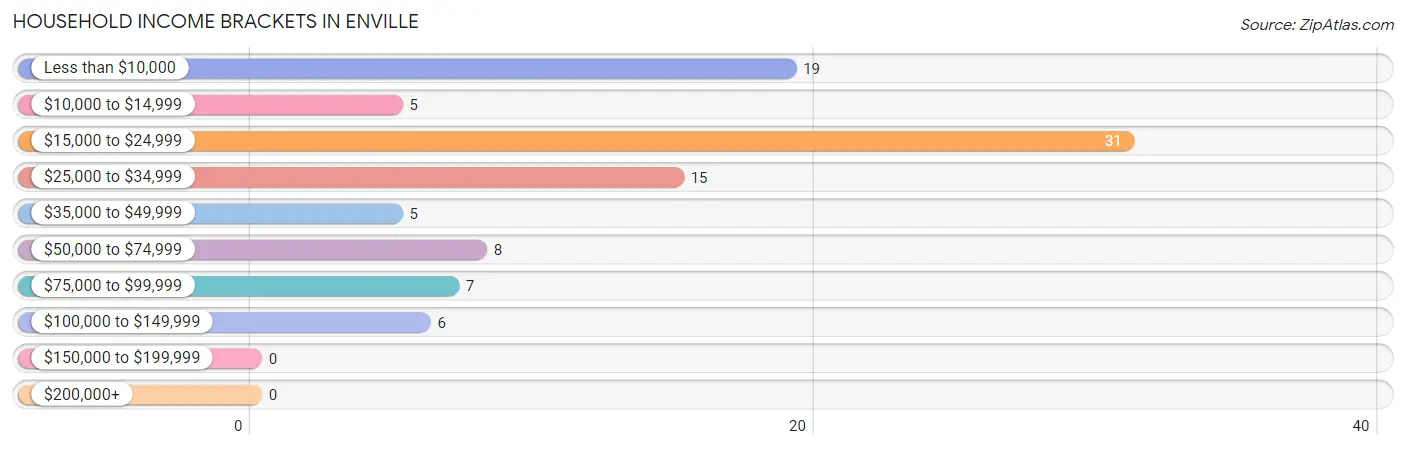
| Income Bracket | # Households | % Households |
| Less than $10,000 | 19 | 19.8% |
| $10,000 to $14,999 | 5 | 5.2% |
| $15,000 to $24,999 | 31 | 32.3% |
| $25,000 to $34,999 | 15 | 15.6% |
| $35,000 to $49,999 | 5 | 5.2% |
| $50,000 to $74,999 | 8 | 8.3% |
| $75,000 to $99,999 | 7 | 7.3% |
| $100,000 to $149,999 | 6 | 6.3% |
| $150,000 to $199,999 | 0 | 0.0% |
| $200,000+ | 0 | 0.0% |
Household Income by Householder Age in Enville
The median household income in Enville is $17,143, with the highest median household income of $16,615 found in the 45 to 64 years age bracket for the primary householder. A total of 57 households (59.4%) fall into this category.
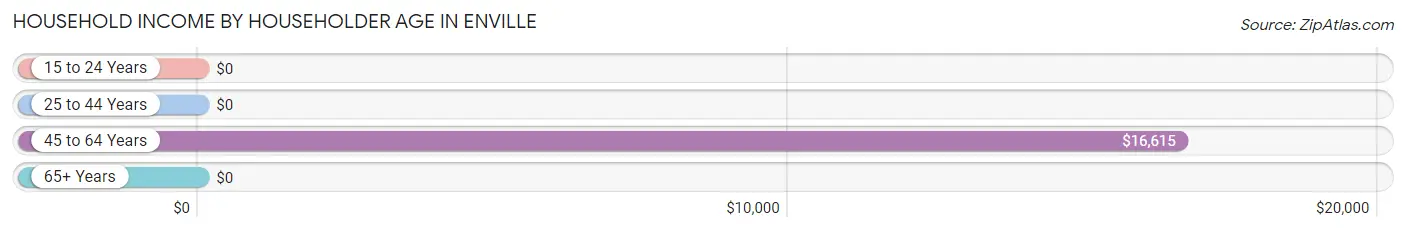
| Income Bracket | # Households | Median Income |
| 15 to 24 Years | 0 (0.0%) | $0 |
| 25 to 44 Years | 8 (8.3%) | $0 |
| 45 to 64 Years | 57 (59.4%) | $16,615 |
| 65+ Years | 31 (32.3%) | $0 |
| Total | 96 (100.0%) | $17,143 |
Poverty in Enville
Income Below Poverty by Sex and Age in Enville
With 9.6% poverty level for males and 26.0% for females among the residents of Enville, 45 to 54 year old males and 18 to 24 year old females are the most vulnerable to poverty, with 5 males (33.3%) and 1 females (100.0%) in their respective age groups living below the poverty level.
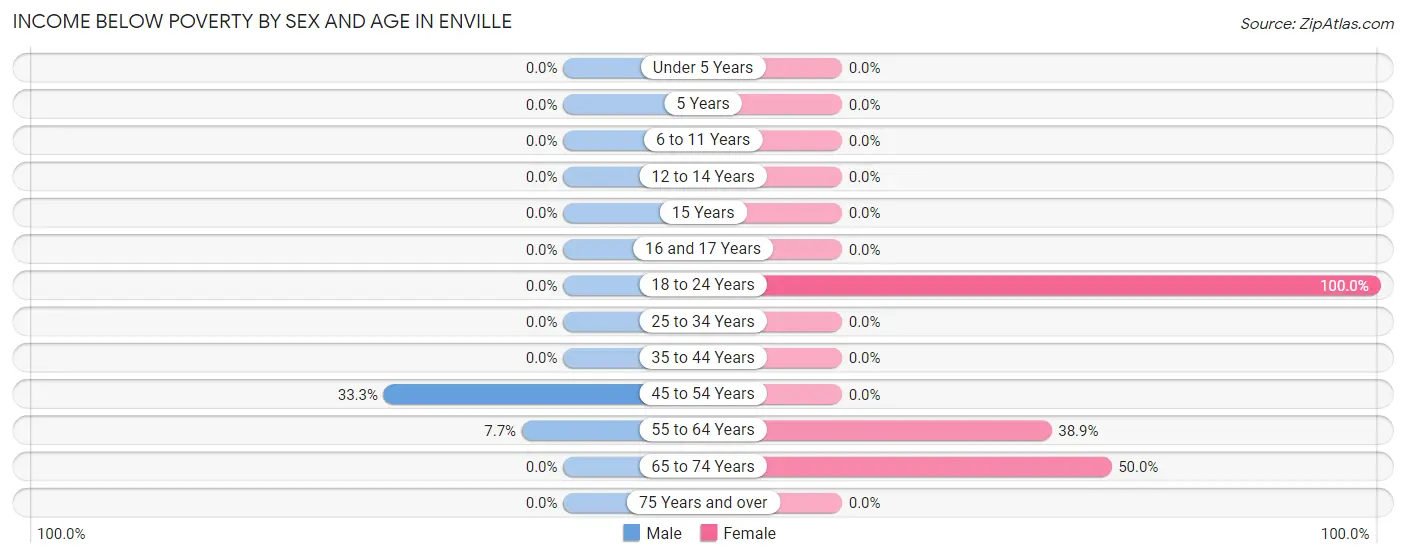
| Age Bracket | Male | Female |
| Under 5 Years | 0 (0.0%) | 0 (0.0%) |
| 5 Years | 0 (0.0%) | 0 (0.0%) |
| 6 to 11 Years | 0 (0.0%) | 0 (0.0%) |
| 12 to 14 Years | 0 (0.0%) | 0 (0.0%) |
| 15 Years | 0 (0.0%) | 0 (0.0%) |
| 16 and 17 Years | 0 (0.0%) | 0 (0.0%) |
| 18 to 24 Years | 0 (0.0%) | 1 (100.0%) |
| 25 to 34 Years | 0 (0.0%) | 0 (0.0%) |
| 35 to 44 Years | 0 (0.0%) | 0 (0.0%) |
| 45 to 54 Years | 5 (33.3%) | 0 (0.0%) |
| 55 to 64 Years | 3 (7.7%) | 7 (38.9%) |
| 65 to 74 Years | 0 (0.0%) | 11 (50.0%) |
| 75 Years and over | 0 (0.0%) | 0 (0.0%) |
| Total | 8 (9.6%) | 19 (26.0%) |
Income Above Poverty by Sex and Age in Enville
According to the poverty statistics in Enville, males aged under 5 years and females aged under 5 years are the age groups that are most secure financially, with 100.0% of males and 100.0% of females in these age groups living above the poverty line.
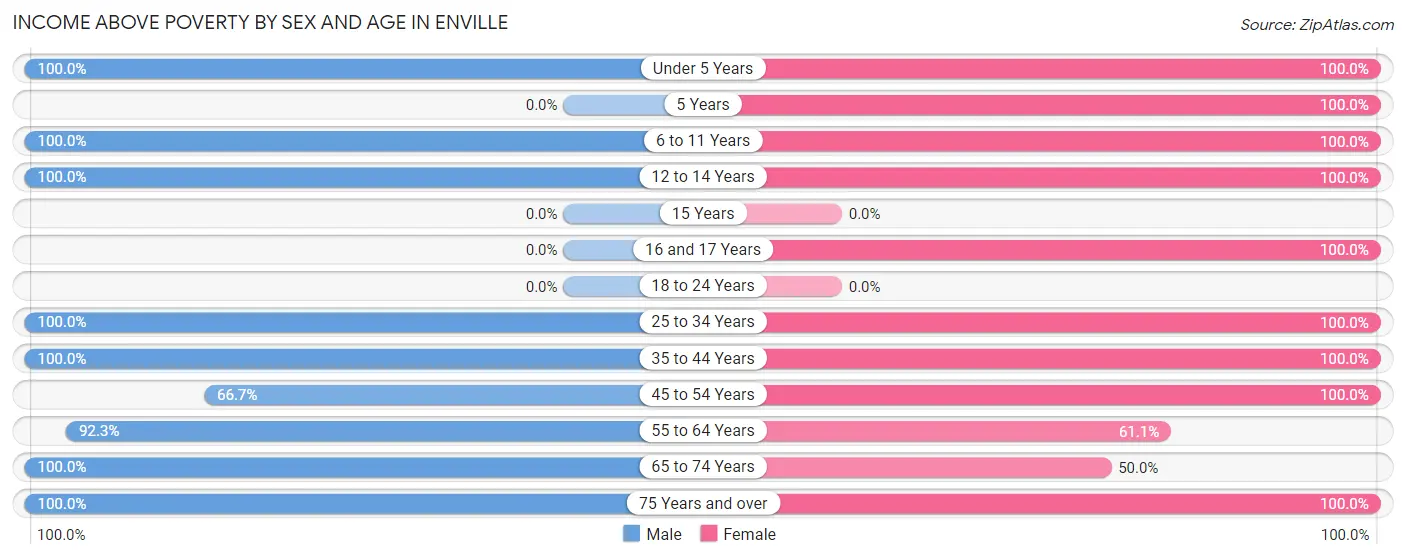
| Age Bracket | Male | Female |
| Under 5 Years | 1 (100.0%) | 2 (100.0%) |
| 5 Years | 0 (0.0%) | 2 (100.0%) |
| 6 to 11 Years | 3 (100.0%) | 4 (100.0%) |
| 12 to 14 Years | 4 (100.0%) | 2 (100.0%) |
| 15 Years | 0 (0.0%) | 0 (0.0%) |
| 16 and 17 Years | 0 (0.0%) | 1 (100.0%) |
| 18 to 24 Years | 0 (0.0%) | 0 (0.0%) |
| 25 to 34 Years | 7 (100.0%) | 5 (100.0%) |
| 35 to 44 Years | 2 (100.0%) | 4 (100.0%) |
| 45 to 54 Years | 10 (66.7%) | 4 (100.0%) |
| 55 to 64 Years | 36 (92.3%) | 11 (61.1%) |
| 65 to 74 Years | 8 (100.0%) | 11 (50.0%) |
| 75 Years and over | 4 (100.0%) | 8 (100.0%) |
| Total | 75 (90.4%) | 54 (74.0%) |
Income Below Poverty Among Married-Couple Families in Enville
The poverty statistics for married-couple families in Enville show that 4.0% or 1 of the total 25 families live below the poverty line. Families with no children have the highest poverty rate of 5.9%, comprising of 1 families. On the other hand, families with 1 or 2 children have the lowest poverty rate of 0.0%, which includes 0 families.
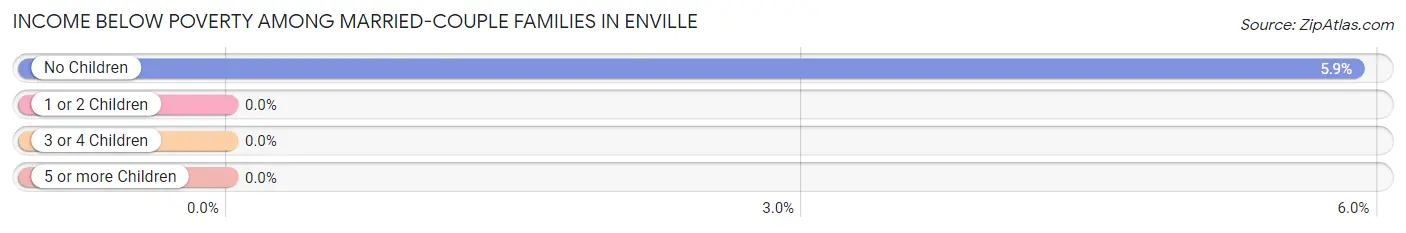
| Children | Above Poverty | Below Poverty |
| No Children | 16 (94.1%) | 1 (5.9%) |
| 1 or 2 Children | 4 (100.0%) | 0 (0.0%) |
| 3 or 4 Children | 4 (100.0%) | 0 (0.0%) |
| 5 or more Children | 0 (0.0%) | 0 (0.0%) |
| Total | 24 (96.0%) | 1 (4.0%) |
Income Below Poverty Among Single-Parent Households in Enville
| Children | Single Father | Single Mother |
| No Children | 0 (0.0%) | 0 (0.0%) |
| 1 or 2 Children | 0 (0.0%) | 0 (0.0%) |
| 3 or 4 Children | 0 (0.0%) | 0 (0.0%) |
| 5 or more Children | 0 (0.0%) | 0 (0.0%) |
| Total | 0 (0.0%) | 0 (0.0%) |
Income Below Poverty Among Married-Couple vs Single-Parent Households in Enville
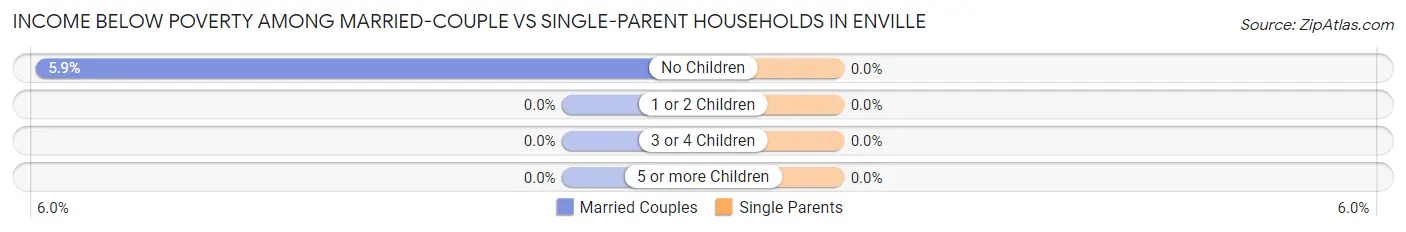
| Children | Married-Couple Families | Single-Parent Households |
| No Children | 1 (5.9%) | 0 (0.0%) |
| 1 or 2 Children | 0 (0.0%) | 0 (0.0%) |
| 3 or 4 Children | 0 (0.0%) | 0 (0.0%) |
| 5 or more Children | 0 (0.0%) | 0 (0.0%) |
| Total | 1 (4.0%) | 0 (0.0%) |
Race in Enville
The most populous races in Enville are White / Caucasian (151 | 96.2%), Two or more Races (4 | 2.5%), and Some other Race (2 | 1.3%).
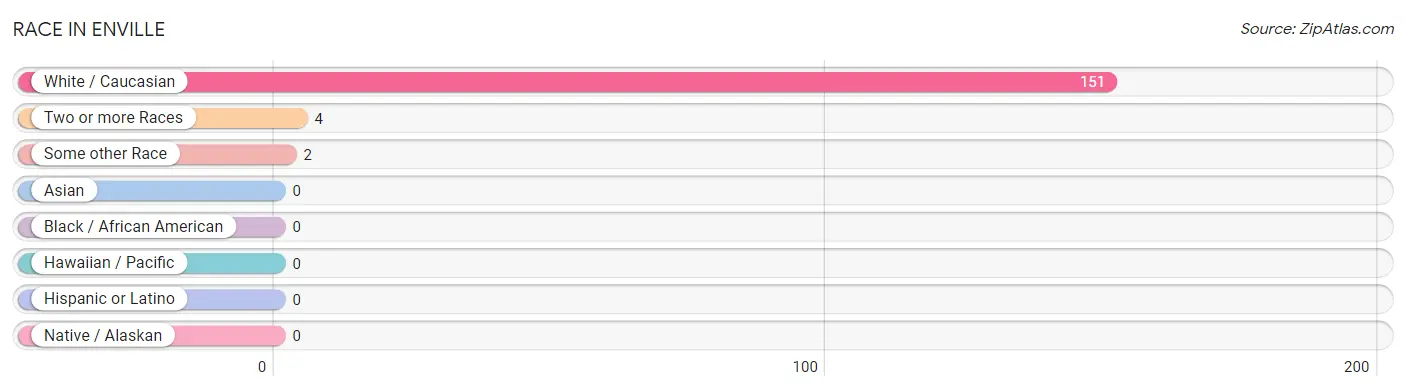
| Race | # Population | % Population |
| Asian | 0 | 0.0% |
| Black / African American | 0 | 0.0% |
| Hawaiian / Pacific | 0 | 0.0% |
| Hispanic or Latino | 0 | 0.0% |
| Native / Alaskan | 0 | 0.0% |
| White / Caucasian | 151 | 96.2% |
| Two or more Races | 4 | 2.5% |
| Some other Race | 2 | 1.3% |
| Total | 157 | 100.0% |
Ancestry in Enville
The most populous ancestries reported in Enville are English (27 | 17.2%), American (21 | 13.4%), Irish (17 | 10.8%), Russian (11 | 7.0%), and German (7 | 4.5%), together accounting for 52.9% of all Enville residents.
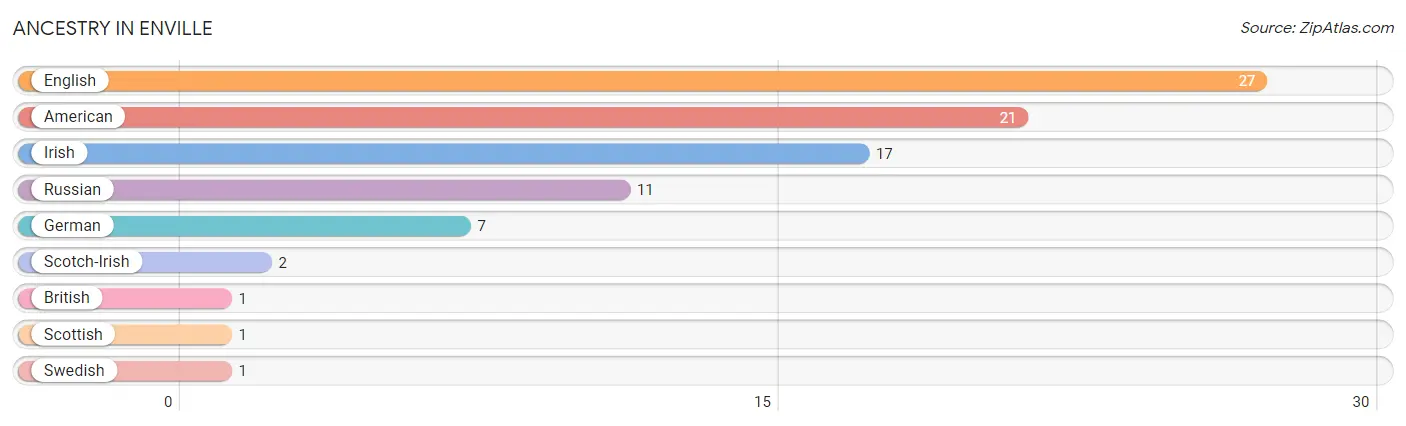
| Ancestry | # Population | % Population |
| American | 21 | 13.4% |
| British | 1 | 0.6% |
| English | 27 | 17.2% |
| German | 7 | 4.5% |
| Irish | 17 | 10.8% |
| Russian | 11 | 7.0% |
| Scotch-Irish | 2 | 1.3% |
| Scottish | 1 | 0.6% |
| Swedish | 1 | 0.6% | View All 9 Rows |
Immigrants in Enville

| Immigration Origin | # Population | % Population | View All 0 Rows |
Sex and Age in Enville
Sex and Age in Enville
The most populous age groups in Enville are 60 to 64 Years (33 | 39.8%) for men and 65 to 69 Years (19 | 25.7%) for women.
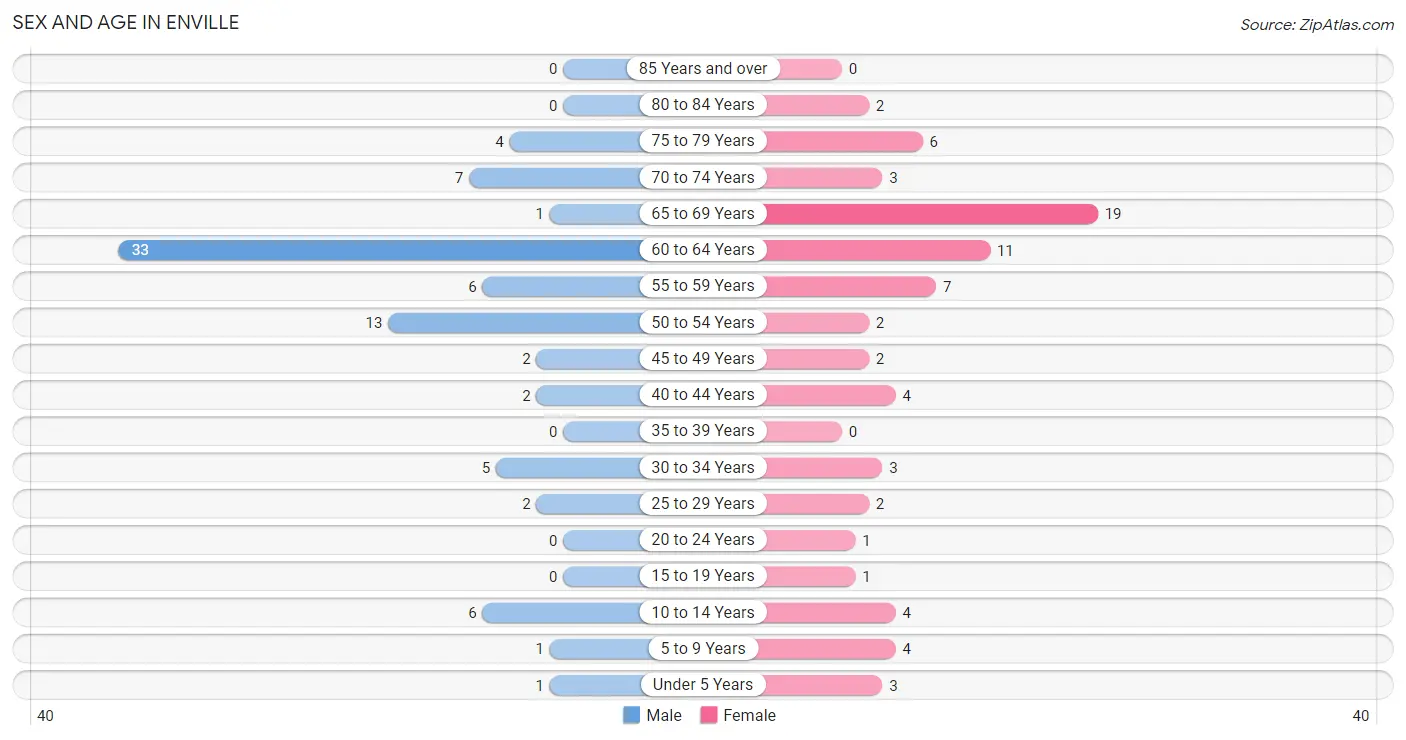
| Age Bracket | Male | Female |
| Under 5 Years | 1 (1.2%) | 3 (4.1%) |
| 5 to 9 Years | 1 (1.2%) | 4 (5.4%) |
| 10 to 14 Years | 6 (7.2%) | 4 (5.4%) |
| 15 to 19 Years | 0 (0.0%) | 1 (1.3%) |
| 20 to 24 Years | 0 (0.0%) | 1 (1.3%) |
| 25 to 29 Years | 2 (2.4%) | 2 (2.7%) |
| 30 to 34 Years | 5 (6.0%) | 3 (4.1%) |
| 35 to 39 Years | 0 (0.0%) | 0 (0.0%) |
| 40 to 44 Years | 2 (2.4%) | 4 (5.4%) |
| 45 to 49 Years | 2 (2.4%) | 2 (2.7%) |
| 50 to 54 Years | 13 (15.7%) | 2 (2.7%) |
| 55 to 59 Years | 6 (7.2%) | 7 (9.5%) |
| 60 to 64 Years | 33 (39.8%) | 11 (14.9%) |
| 65 to 69 Years | 1 (1.2%) | 19 (25.7%) |
| 70 to 74 Years | 7 (8.4%) | 3 (4.1%) |
| 75 to 79 Years | 4 (4.8%) | 6 (8.1%) |
| 80 to 84 Years | 0 (0.0%) | 2 (2.7%) |
| 85 Years and over | 0 (0.0%) | 0 (0.0%) |
| Total | 83 (100.0%) | 74 (100.0%) |
Families and Households in Enville
Median Family Size in Enville
The median family size in Enville is 3.11 persons per family, with single male/father families (1 | 3.6%) accounting for the largest median family size of 7 persons per family. On the other hand, single female/mother families (2 | 7.1%) represent the smallest median family size with 1.50 persons per family.
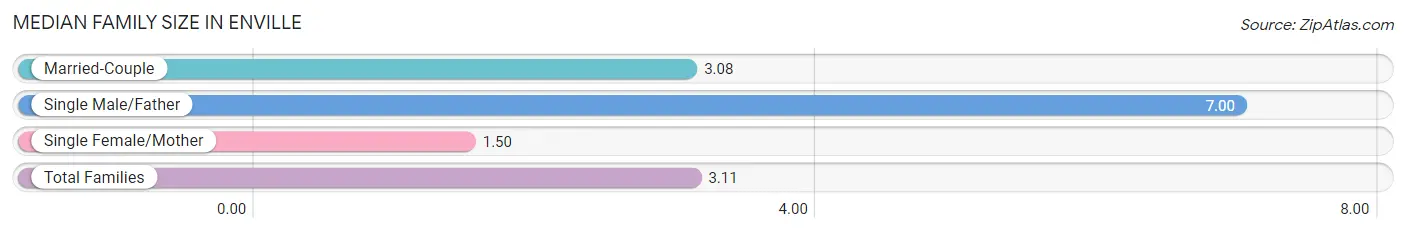
| Family Type | # Families | Family Size |
| Married-Couple | 25 (89.3%) | 3.08 |
| Single Male/Father | 1 (3.6%) | 7.00 |
| Single Female/Mother | 2 (7.1%) | 1.50 |
| Total Families | 28 (100.0%) | 3.11 |
Median Household Size in Enville
The median household size in Enville is 1.64 persons per household, with single male/father households (1 | 1.0%) accounting for the largest median household size of 7 persons per household. non-family households (68 | 70.8%) represent the smallest median household size with 1.03 persons per household.
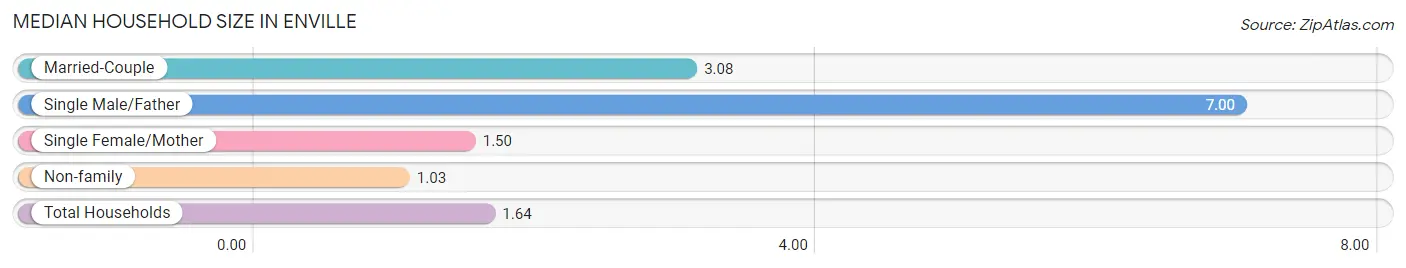
| Household Type | # Households | Household Size |
| Married-Couple | 25 (26.0%) | 3.08 |
| Single Male/Father | 1 (1.0%) | 7.00 |
| Single Female/Mother | 2 (2.1%) | 1.50 |
| Non-family | 68 (70.8%) | 1.03 |
| Total Households | 96 (100.0%) | 1.64 |
Household Size by Marriage Status in Enville
Out of a total of 96 households in Enville, 28 (29.2%) are family households, while 68 (70.8%) are nonfamily households. The most numerous type of family households are 2-person households, comprising 19, and the most common type of nonfamily households are 1-person households, comprising 66.
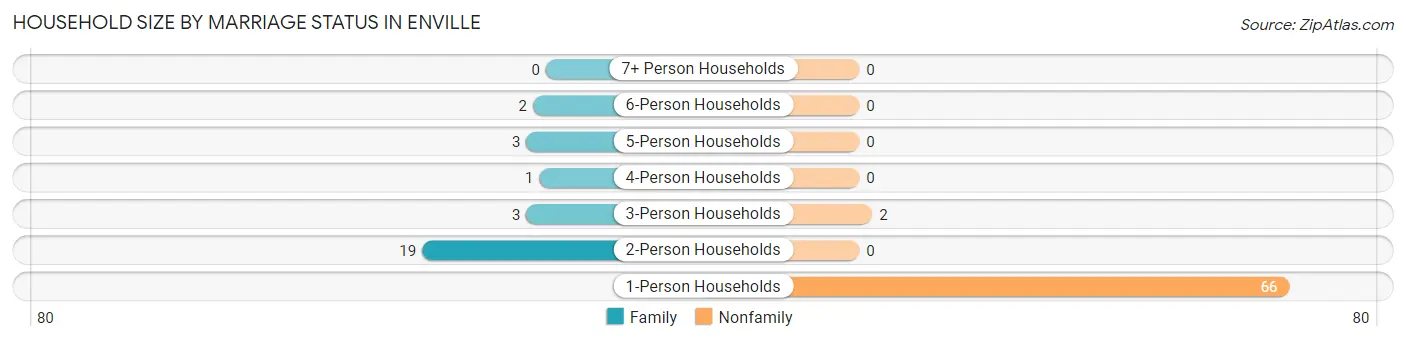
| Household Size | Family Households | Nonfamily Households |
| 1-Person Households | - | 66 (68.8%) |
| 2-Person Households | 19 (19.8%) | 0 (0.0%) |
| 3-Person Households | 3 (3.1%) | 2 (2.1%) |
| 4-Person Households | 1 (1.0%) | 0 (0.0%) |
| 5-Person Households | 3 (3.1%) | 0 (0.0%) |
| 6-Person Households | 2 (2.1%) | 0 (0.0%) |
| 7+ Person Households | 0 (0.0%) | 0 (0.0%) |
| Total | 28 (29.2%) | 68 (70.8%) |
Female Fertility in Enville
Fertility by Age in Enville
| Age Bracket | Women with Births | Births / 1,000 Women |
| 15 to 19 years | 0 (0.0%) | 0.0 |
| 20 to 34 years | 0 (0.0%) | 0.0 |
| 35 to 50 years | 0 (0.0%) | 0.0 |
| Total | 0 (0.0%) | 0.0 |
Fertility by Age by Marriage Status in Enville
| Age Bracket | Married | Unmarried |
| 15 to 19 years | 0 (0.0%) | 0 (0.0%) |
| 20 to 34 years | 0 (0.0%) | 0 (0.0%) |
| 35 to 50 years | 0 (0.0%) | 0 (0.0%) |
| Total | 0 (0.0%) | 0 (0.0%) |
Fertility by Education in Enville
| Educational Attainment | Women with Births | Births / 1,000 Women |
| Less than High School | 0 (0.0%) | 0.0 |
| High School Diploma | 0 (0.0%) | 0.0 |
| College or Associate's Degree | 0 (0.0%) | 0.0 |
| Bachelor's Degree | 0 (0.0%) | 0.0 |
| Graduate Degree | 0 (0.0%) | 0.0 |
| Total | 0 (0.0%) | 0.0 |
Fertility by Education by Marriage Status in Enville
| Educational Attainment | Married | Unmarried |
| Less than High School | 0 (0.0%) | 0 (0.0%) |
| High School Diploma | 0 (0.0%) | 0 (0.0%) |
| College or Associate's Degree | 0 (0.0%) | 0 (0.0%) |
| Bachelor's Degree | 0 (0.0%) | 0 (0.0%) |
| Graduate Degree | 0 (0.0%) | 0 (0.0%) |
| Total | 0 (0.0%) | 0 (0.0%) |
Employment Characteristics in Enville
Employment by Class of Employer in Enville
Among the 36 employed individuals in Enville, private company employees (23 | 63.9%), self-employed (not incorporated) (5 | 13.9%), and not-for-profit organizations (4 | 11.1%) make up the most common classes of employment.
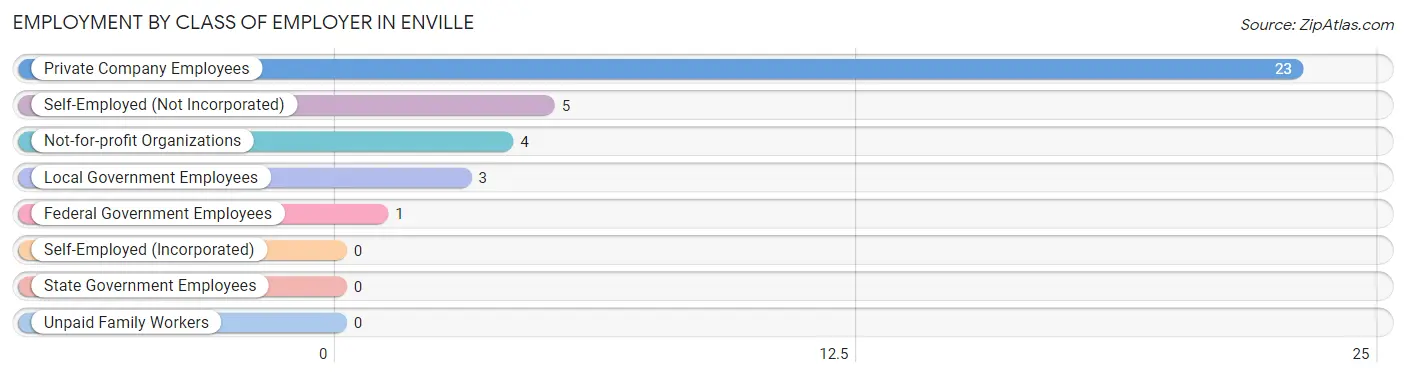
| Employer Class | # Employees | % Employees |
| Private Company Employees | 23 | 63.9% |
| Self-Employed (Incorporated) | 0 | 0.0% |
| Self-Employed (Not Incorporated) | 5 | 13.9% |
| Not-for-profit Organizations | 4 | 11.1% |
| Local Government Employees | 3 | 8.3% |
| State Government Employees | 0 | 0.0% |
| Federal Government Employees | 1 | 2.8% |
| Unpaid Family Workers | 0 | 0.0% |
| Total | 36 | 100.0% |
Employment Status by Age in Enville
According to the labor force statistics for Enville, out of the total population over 16 years of age (138), 27.5% or 38 individuals are in the labor force, with 5.3% or 2 of them unemployed. The age group with the highest labor force participation rate is 35 to 44 years, with 100.0% or 6 individuals in the labor force. Within the labor force, the 35 to 44 years age range has the highest percentage of unemployed individuals, with 33.3% or 2 of them being unemployed.
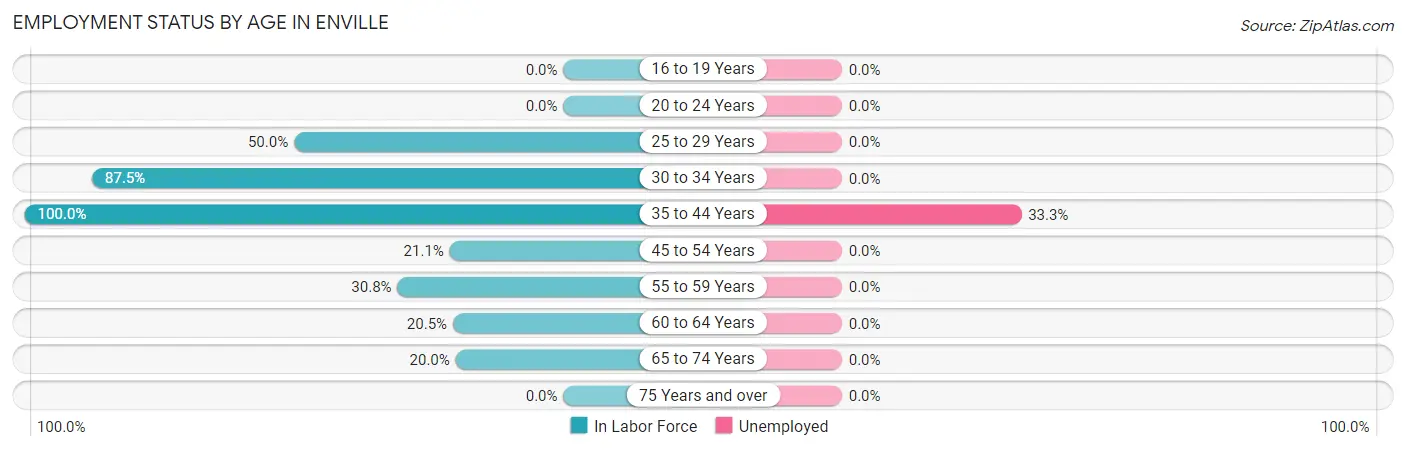
| Age Bracket | In Labor Force | Unemployed |
| 16 to 19 Years | 0 (0.0%) | 0 (0.0%) |
| 20 to 24 Years | 0 (0.0%) | 0 (0.0%) |
| 25 to 29 Years | 2 (50.0%) | 0 (0.0%) |
| 30 to 34 Years | 7 (87.5%) | 0 (0.0%) |
| 35 to 44 Years | 6 (100.0%) | 2 (33.3%) |
| 45 to 54 Years | 4 (21.1%) | 0 (0.0%) |
| 55 to 59 Years | 4 (30.8%) | 0 (0.0%) |
| 60 to 64 Years | 9 (20.5%) | 0 (0.0%) |
| 65 to 74 Years | 6 (20.0%) | 0 (0.0%) |
| 75 Years and over | 0 (0.0%) | 0 (0.0%) |
| Total | 38 (27.5%) | 2 (5.3%) |
Employment Status by Educational Attainment in Enville
According to labor force statistics for Enville, 34.0% of individuals (32) out of the total population between 25 and 64 years of age (94) are in the labor force, with 6.3% or 2 of them being unemployed. The group with the highest labor force participation rate are those with the educational attainment of college / associate degree, with 100.0% or 4 individuals in the labor force. Within the labor force, individuals with high school diploma education have the highest percentage of unemployment, with 10.0% or 2 of them being unemployed.
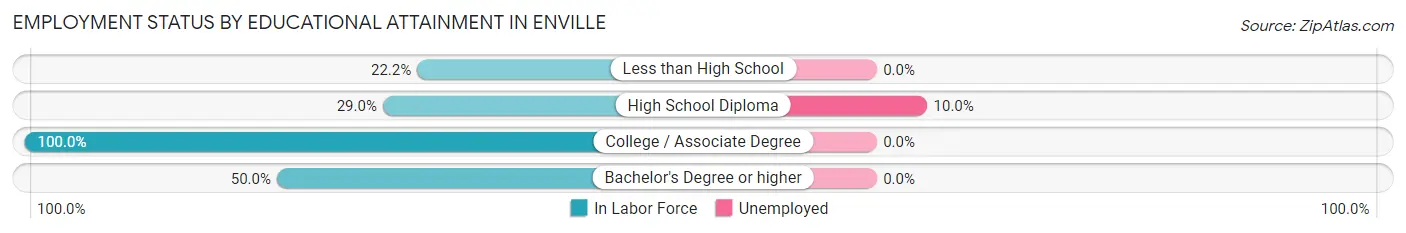
| Educational Attainment | In Labor Force | Unemployed |
| Less than High School | 2 (22.2%) | 0 (0.0%) |
| High School Diploma | 20 (29.0%) | 7 (10.0%) |
| College / Associate Degree | 4 (100.0%) | 0 (0.0%) |
| Bachelor's Degree or higher | 6 (50.0%) | 0 (0.0%) |
| Total | 32 (34.0%) | 6 (6.3%) |
Employment Occupations by Sex in Enville
Management, Business, Science and Arts Occupations
The most common Management, Business, Science and Arts occupations in Enville are Community & Social Service (7 | 19.4%), Arts, Media & Entertainment (4 | 11.1%), Management (3 | 8.3%), Education Instruction & Library (2 | 5.6%), and Health Diagnosing & Treating (2 | 5.6%).
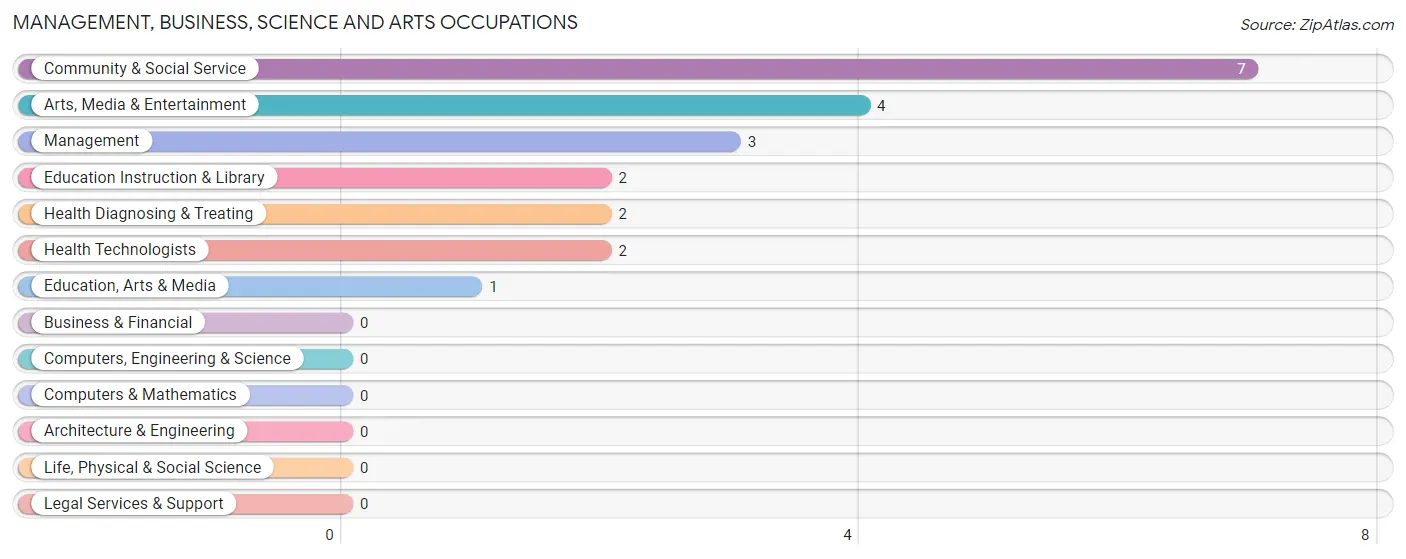
Management, Business, Science and Arts Occupations by Sex
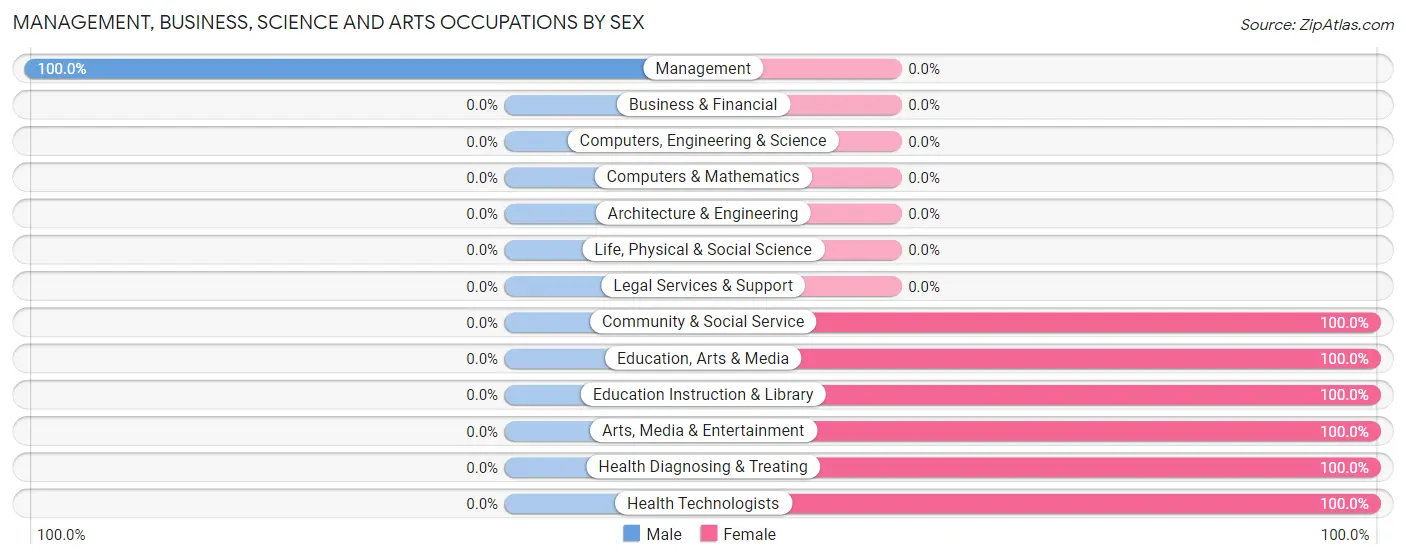
| Occupation | Male | Female |
| Management | 3 (100.0%) | 0 (0.0%) |
| Business & Financial | 0 (0.0%) | 0 (0.0%) |
| Computers, Engineering & Science | 0 (0.0%) | 0 (0.0%) |
| Computers & Mathematics | 0 (0.0%) | 0 (0.0%) |
| Architecture & Engineering | 0 (0.0%) | 0 (0.0%) |
| Life, Physical & Social Science | 0 (0.0%) | 0 (0.0%) |
| Community & Social Service | 0 (0.0%) | 7 (100.0%) |
| Education, Arts & Media | 0 (0.0%) | 1 (100.0%) |
| Legal Services & Support | 0 (0.0%) | 0 (0.0%) |
| Education Instruction & Library | 0 (0.0%) | 2 (100.0%) |
| Arts, Media & Entertainment | 0 (0.0%) | 4 (100.0%) |
| Health Diagnosing & Treating | 0 (0.0%) | 2 (100.0%) |
| Health Technologists | 0 (0.0%) | 2 (100.0%) |
| Total (Category) | 3 (25.0%) | 9 (75.0%) |
| Total (Overall) | 18 (50.0%) | 18 (50.0%) |
Services Occupations
The most common Services occupations in Enville are Healthcare Support (2 | 5.6%), and Personal Care & Service (1 | 2.8%).
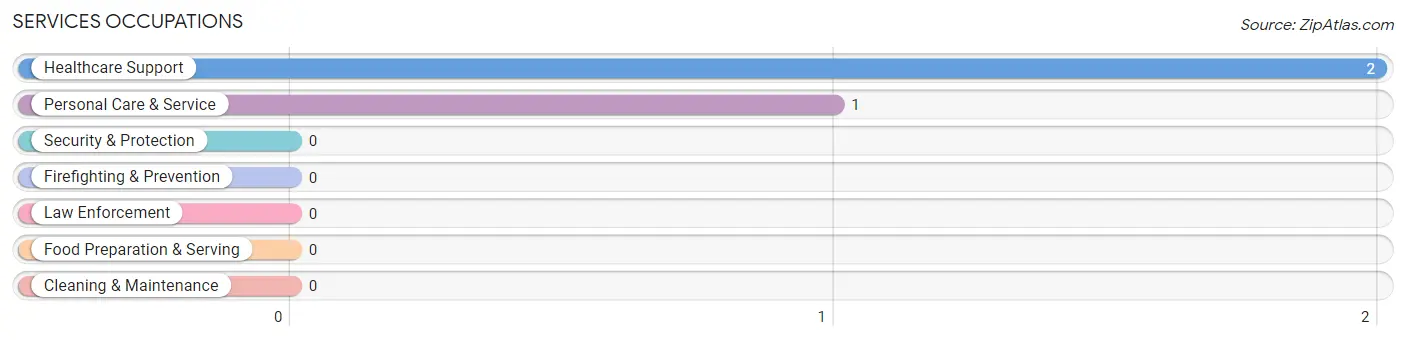
Services Occupations by Sex
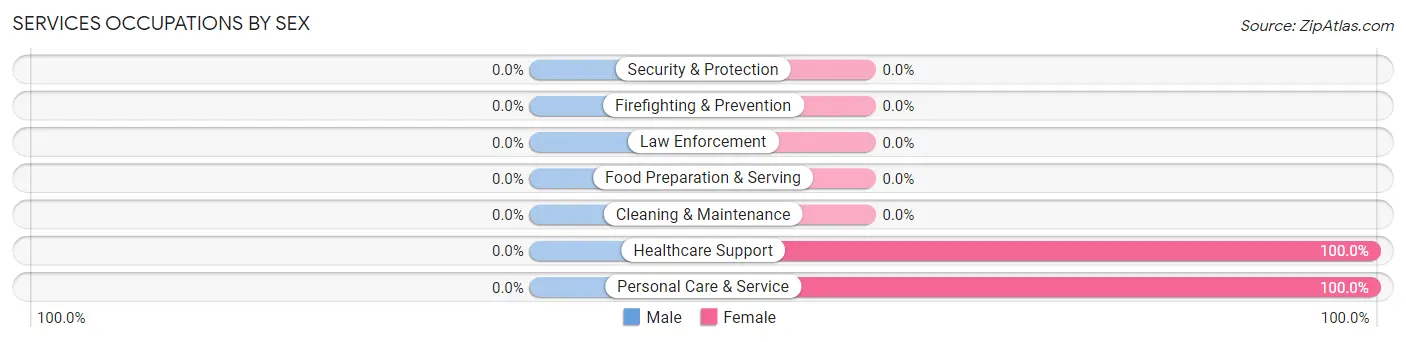
| Occupation | Male | Female |
| Healthcare Support | 0 (0.0%) | 2 (100.0%) |
| Security & Protection | 0 (0.0%) | 0 (0.0%) |
| Firefighting & Prevention | 0 (0.0%) | 0 (0.0%) |
| Law Enforcement | 0 (0.0%) | 0 (0.0%) |
| Food Preparation & Serving | 0 (0.0%) | 0 (0.0%) |
| Cleaning & Maintenance | 0 (0.0%) | 0 (0.0%) |
| Personal Care & Service | 0 (0.0%) | 1 (100.0%) |
| Total (Category) | 0 (0.0%) | 3 (100.0%) |
| Total (Overall) | 18 (50.0%) | 18 (50.0%) |
Sales and Office Occupations
The most common Sales and Office occupations in Enville are , and Office & Administration (5 | 13.9%).
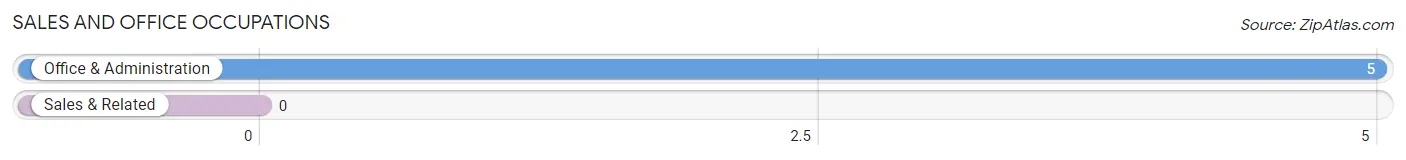
Sales and Office Occupations by Sex
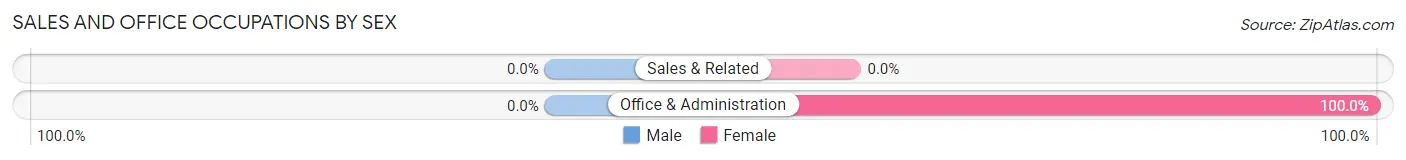
| Occupation | Male | Female |
| Sales & Related | 0 (0.0%) | 0 (0.0%) |
| Office & Administration | 0 (0.0%) | 5 (100.0%) |
| Total (Category) | 0 (0.0%) | 5 (100.0%) |
| Total (Overall) | 18 (50.0%) | 18 (50.0%) |
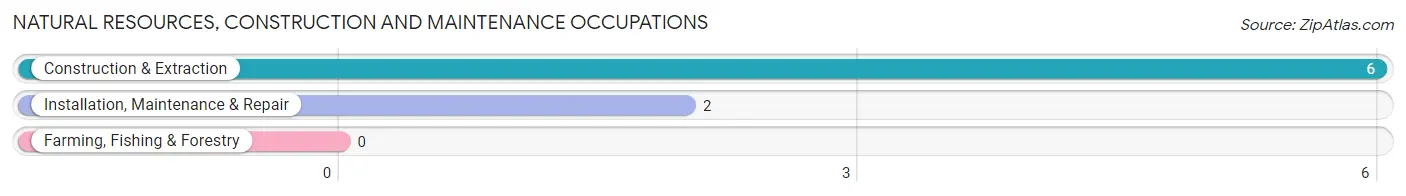
Natural Resources, Construction and Maintenance Occupations
The most common Natural Resources, Construction and Maintenance occupations in Enville are Construction & Extraction (6 | 16.7%), and Installation, Maintenance & Repair (2 | 5.6%).
Natural Resources, Construction and Maintenance Occupations by Sex
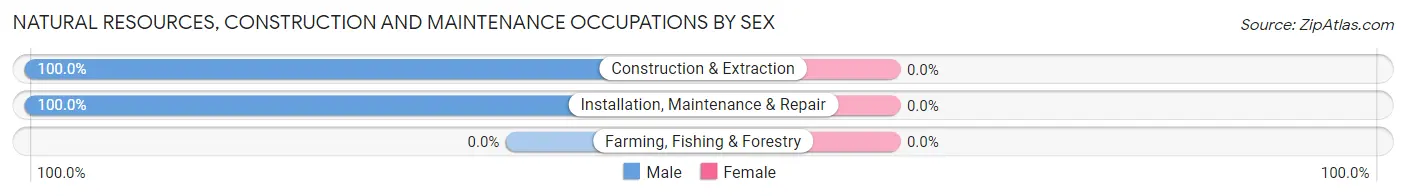
| Occupation | Male | Female |
| Farming, Fishing & Forestry | 0 (0.0%) | 0 (0.0%) |
| Construction & Extraction | 6 (100.0%) | 0 (0.0%) |
| Installation, Maintenance & Repair | 2 (100.0%) | 0 (0.0%) |
| Total (Category) | 8 (100.0%) | 0 (0.0%) |
| Total (Overall) | 18 (50.0%) | 18 (50.0%) |
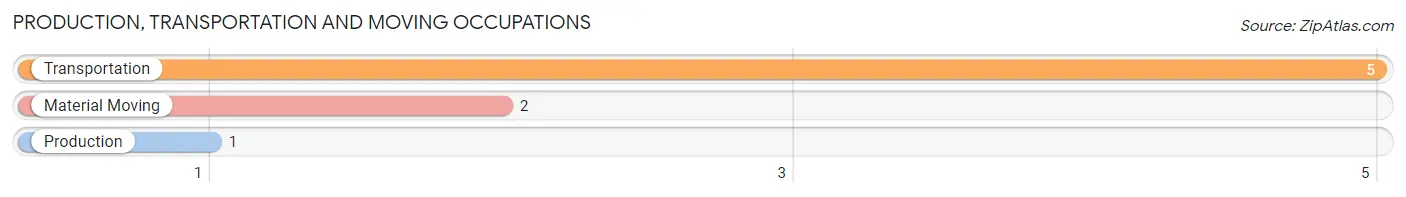
Production, Transportation and Moving Occupations
The most common Production, Transportation and Moving occupations in Enville are Transportation (5 | 13.9%), Material Moving (2 | 5.6%), and Production (1 | 2.8%).
Production, Transportation and Moving Occupations by Sex
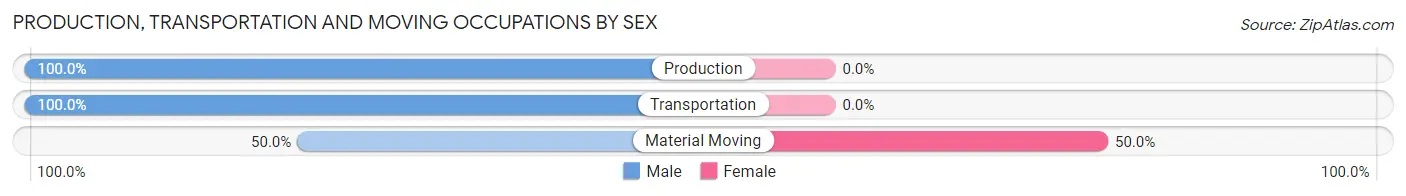
| Occupation | Male | Female |
| Production | 1 (100.0%) | 0 (0.0%) |
| Transportation | 5 (100.0%) | 0 (0.0%) |
| Material Moving | 1 (50.0%) | 1 (50.0%) |
| Total (Category) | 7 (87.5%) | 1 (12.5%) |
| Total (Overall) | 18 (50.0%) | 18 (50.0%) |
Employment Industries by Sex in Enville
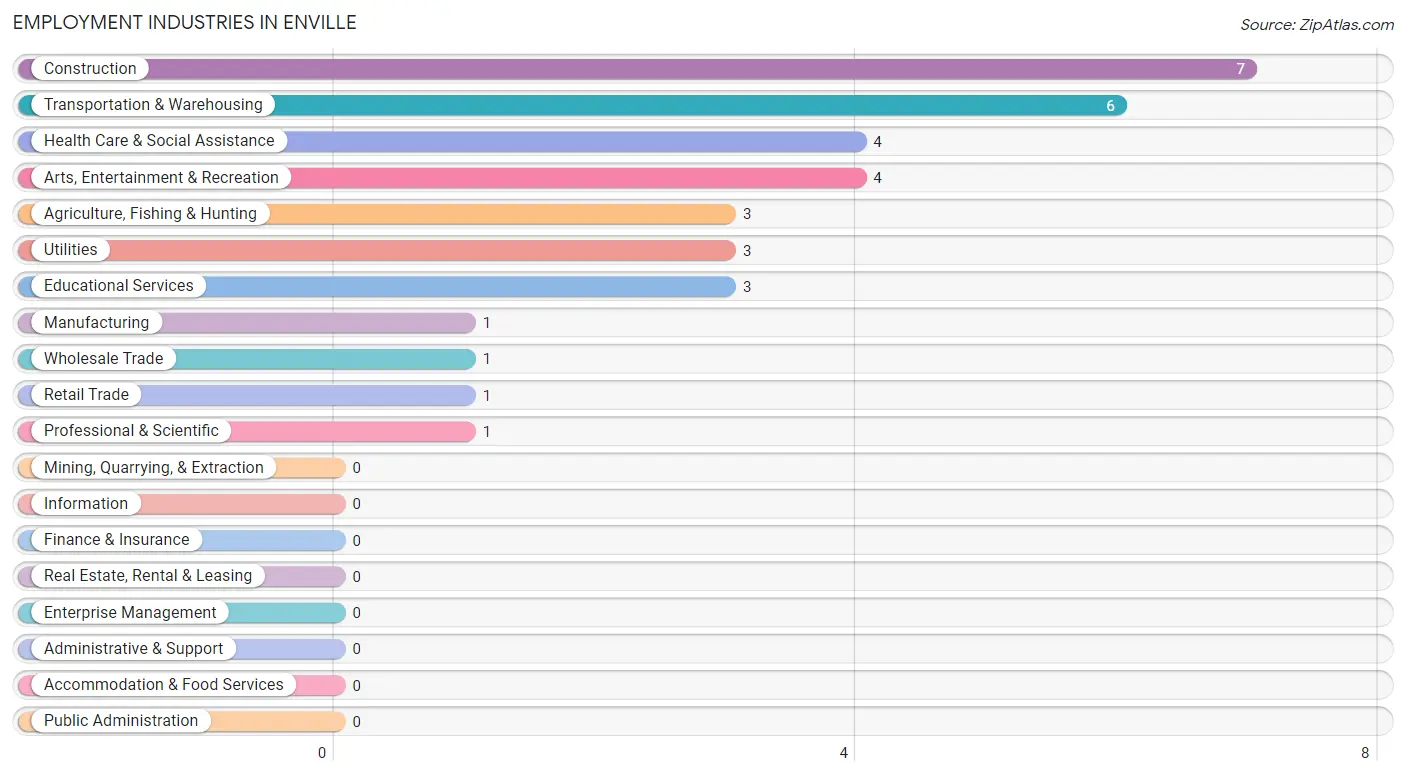
Employment Industries in Enville
The major employment industries in Enville include Construction (7 | 19.4%), Transportation & Warehousing (6 | 16.7%), Health Care & Social Assistance (4 | 11.1%), Arts, Entertainment & Recreation (4 | 11.1%), and Agriculture, Fishing & Hunting (3 | 8.3%).
Employment Industries by Sex in Enville
The Enville industries that see more men than women are Agriculture, Fishing & Hunting (100.0%), Construction (100.0%), and Manufacturing (100.0%), whereas the industries that tend to have a higher number of women are Retail Trade (100.0%), Utilities (100.0%), and Educational Services (100.0%).
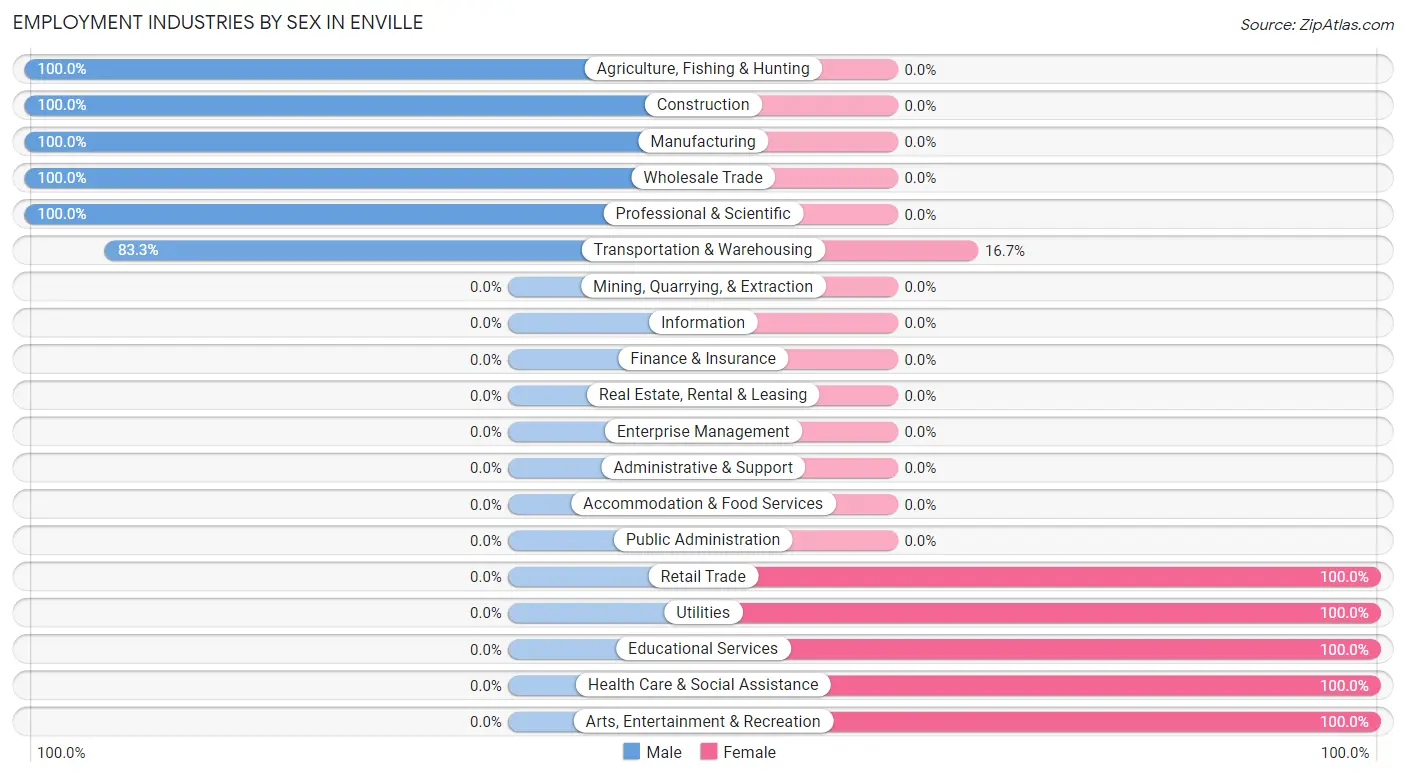
| Industry | Male | Female |
| Agriculture, Fishing & Hunting | 3 (100.0%) | 0 (0.0%) |
| Mining, Quarrying, & Extraction | 0 (0.0%) | 0 (0.0%) |
| Construction | 7 (100.0%) | 0 (0.0%) |
| Manufacturing | 1 (100.0%) | 0 (0.0%) |
| Wholesale Trade | 1 (100.0%) | 0 (0.0%) |
| Retail Trade | 0 (0.0%) | 1 (100.0%) |
| Transportation & Warehousing | 5 (83.3%) | 1 (16.7%) |
| Utilities | 0 (0.0%) | 3 (100.0%) |
| Information | 0 (0.0%) | 0 (0.0%) |
| Finance & Insurance | 0 (0.0%) | 0 (0.0%) |
| Real Estate, Rental & Leasing | 0 (0.0%) | 0 (0.0%) |
| Professional & Scientific | 1 (100.0%) | 0 (0.0%) |
| Enterprise Management | 0 (0.0%) | 0 (0.0%) |
| Administrative & Support | 0 (0.0%) | 0 (0.0%) |
| Educational Services | 0 (0.0%) | 3 (100.0%) |
| Health Care & Social Assistance | 0 (0.0%) | 4 (100.0%) |
| Arts, Entertainment & Recreation | 0 (0.0%) | 4 (100.0%) |
| Accommodation & Food Services | 0 (0.0%) | 0 (0.0%) |
| Public Administration | 0 (0.0%) | 0 (0.0%) |
| Total | 18 (50.0%) | 18 (50.0%) |
Education in Enville
School Enrollment in Enville
The most common levels of schooling among the 20 students in Enville are elementary school (5 | 25.0%), high school (5 | 25.0%), and middle school (4 | 20.0%).
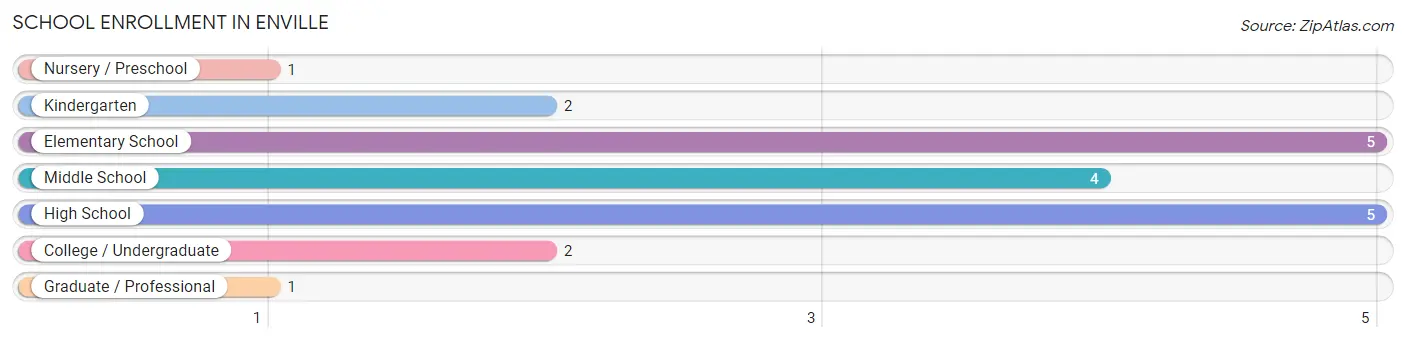
| School Level | # Students | % Students |
| Nursery / Preschool | 1 | 5.0% |
| Kindergarten | 2 | 10.0% |
| Elementary School | 5 | 25.0% |
| Middle School | 4 | 20.0% |
| High School | 5 | 25.0% |
| College / Undergraduate | 2 | 10.0% |
| Graduate / Professional | 1 | 5.0% |
| Total | 20 | 100.0% |
School Enrollment by Age by Funding Source in Enville
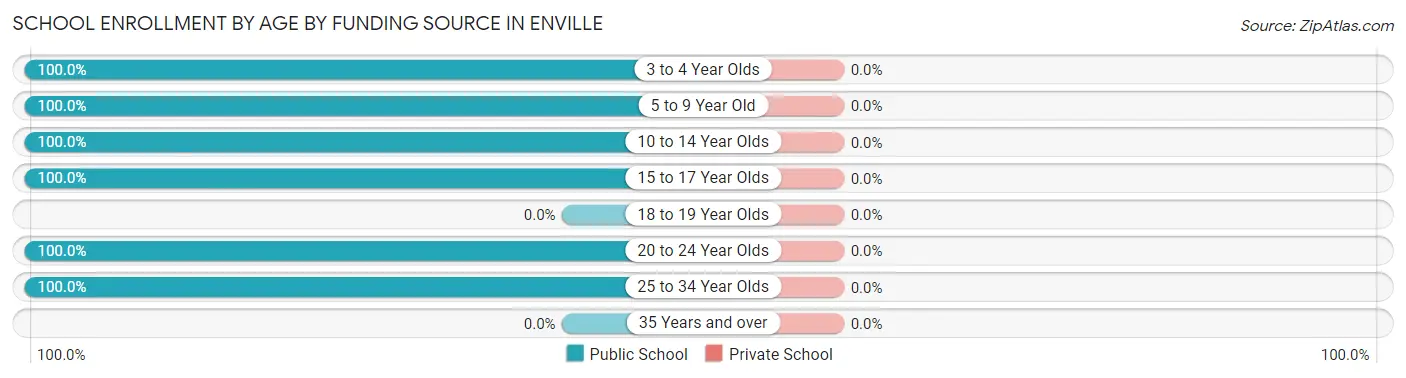
| Age Bracket | Public School | Private School |
| 3 to 4 Year Olds | 1 (100.0%) | 0 (0.0%) |
| 5 to 9 Year Old | 5 (100.0%) | 0 (0.0%) |
| 10 to 14 Year Olds | 10 (100.0%) | 0 (0.0%) |
| 15 to 17 Year Olds | 1 (100.0%) | 0 (0.0%) |
| 18 to 19 Year Olds | 0 (0.0%) | 0 (0.0%) |
| 20 to 24 Year Olds | 1 (100.0%) | 0 (0.0%) |
| 25 to 34 Year Olds | 2 (100.0%) | 0 (0.0%) |
| 35 Years and over | 0 (0.0%) | 0 (0.0%) |
| Total | 20 (100.0%) | 0 (0.0%) |
Educational Attainment by Field of Study in Enville
Engineering (11 | 42.3%), arts & humanities (5 | 19.2%), education (4 | 15.4%), science & technology (3 | 11.5%), and business (2 | 7.7%) are the most common fields of study among 26 individuals in Enville who have obtained a bachelor's degree or higher.
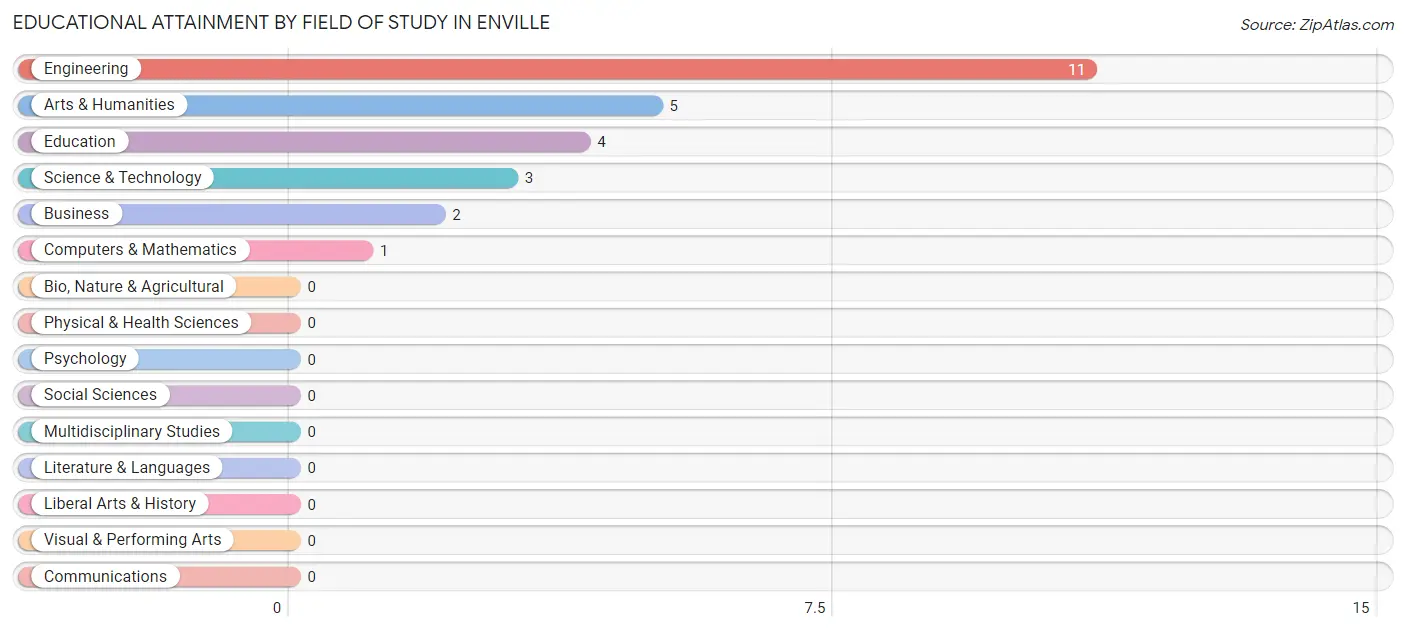
| Field of Study | # Graduates | % Graduates |
| Computers & Mathematics | 1 | 3.8% |
| Bio, Nature & Agricultural | 0 | 0.0% |
| Physical & Health Sciences | 0 | 0.0% |
| Psychology | 0 | 0.0% |
| Social Sciences | 0 | 0.0% |
| Engineering | 11 | 42.3% |
| Multidisciplinary Studies | 0 | 0.0% |
| Science & Technology | 3 | 11.5% |
| Business | 2 | 7.7% |
| Education | 4 | 15.4% |
| Literature & Languages | 0 | 0.0% |
| Liberal Arts & History | 0 | 0.0% |
| Visual & Performing Arts | 0 | 0.0% |
| Communications | 0 | 0.0% |
| Arts & Humanities | 5 | 19.2% |
| Total | 26 | 100.0% |
Transportation & Commute in Enville
Vehicle Availability by Sex in Enville
The most prevalent vehicle ownership categories in Enville are males with 2 vehicles (9, accounting for 50.0%) and females with 2 vehicles (9, making up 50.0%).
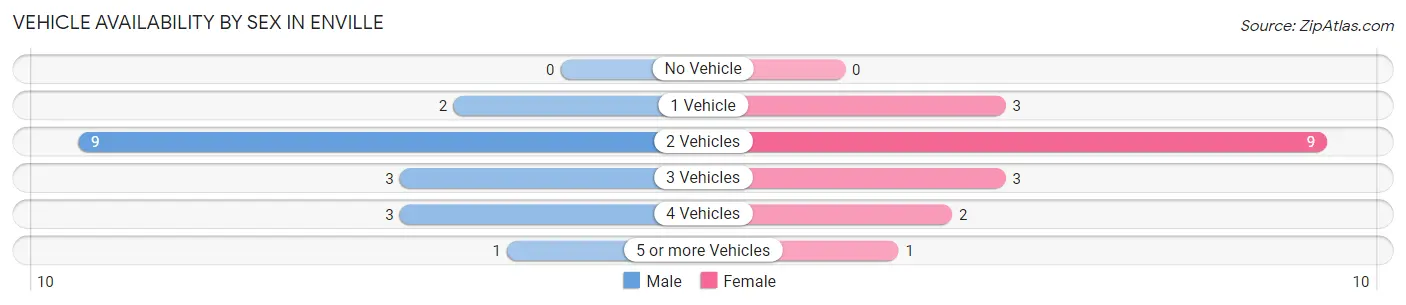
| Vehicles Available | Male | Female |
| No Vehicle | 0 (0.0%) | 0 (0.0%) |
| 1 Vehicle | 2 (11.1%) | 3 (16.7%) |
| 2 Vehicles | 9 (50.0%) | 9 (50.0%) |
| 3 Vehicles | 3 (16.7%) | 3 (16.7%) |
| 4 Vehicles | 3 (16.7%) | 2 (11.1%) |
| 5 or more Vehicles | 1 (5.6%) | 1 (5.6%) |
| Total | 18 (100.0%) | 18 (100.0%) |
Commute Time in Enville
The most frequently occuring commute durations in Enville are 45 to 59 minutes (9 commuters, 27.3%), 40 to 44 minutes (7 commuters, 21.2%), and 15 to 19 minutes (4 commuters, 12.1%).
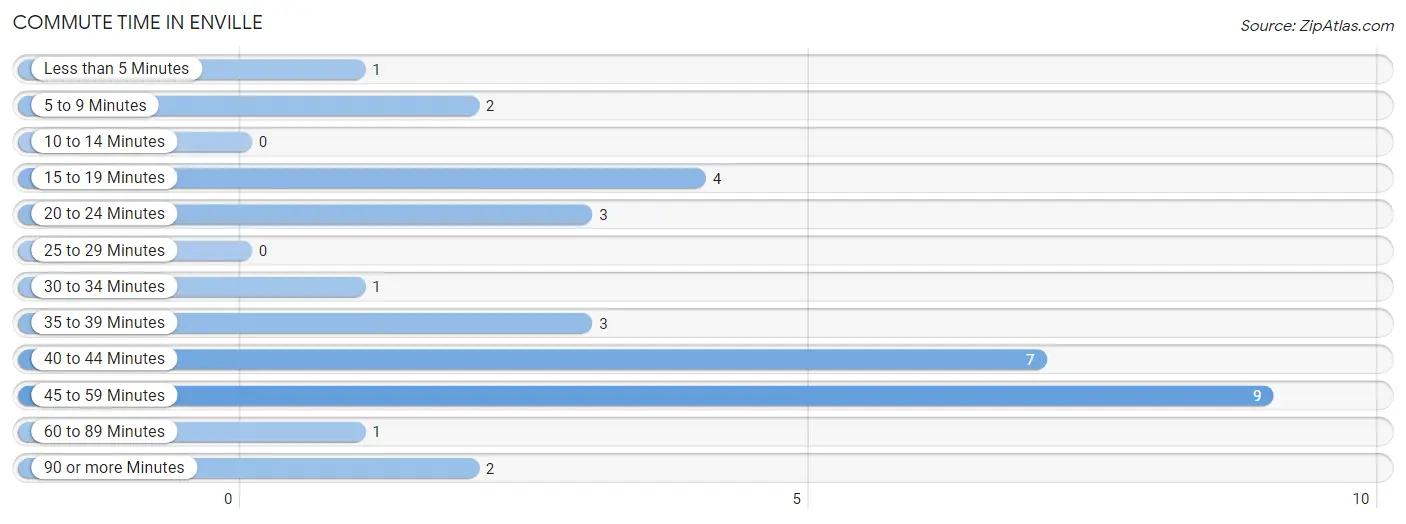
| Commute Time | # Commuters | % Commuters |
| Less than 5 Minutes | 1 | 3.0% |
| 5 to 9 Minutes | 2 | 6.1% |
| 10 to 14 Minutes | 0 | 0.0% |
| 15 to 19 Minutes | 4 | 12.1% |
| 20 to 24 Minutes | 3 | 9.1% |
| 25 to 29 Minutes | 0 | 0.0% |
| 30 to 34 Minutes | 1 | 3.0% |
| 35 to 39 Minutes | 3 | 9.1% |
| 40 to 44 Minutes | 7 | 21.2% |
| 45 to 59 Minutes | 9 | 27.3% |
| 60 to 89 Minutes | 1 | 3.0% |
| 90 or more Minutes | 2 | 6.1% |
Commute Time by Sex in Enville
The most common commute times in Enville are 40 to 44 minutes (3 commuters, 20.0%) for males and 45 to 59 minutes (6 commuters, 33.3%) for females.
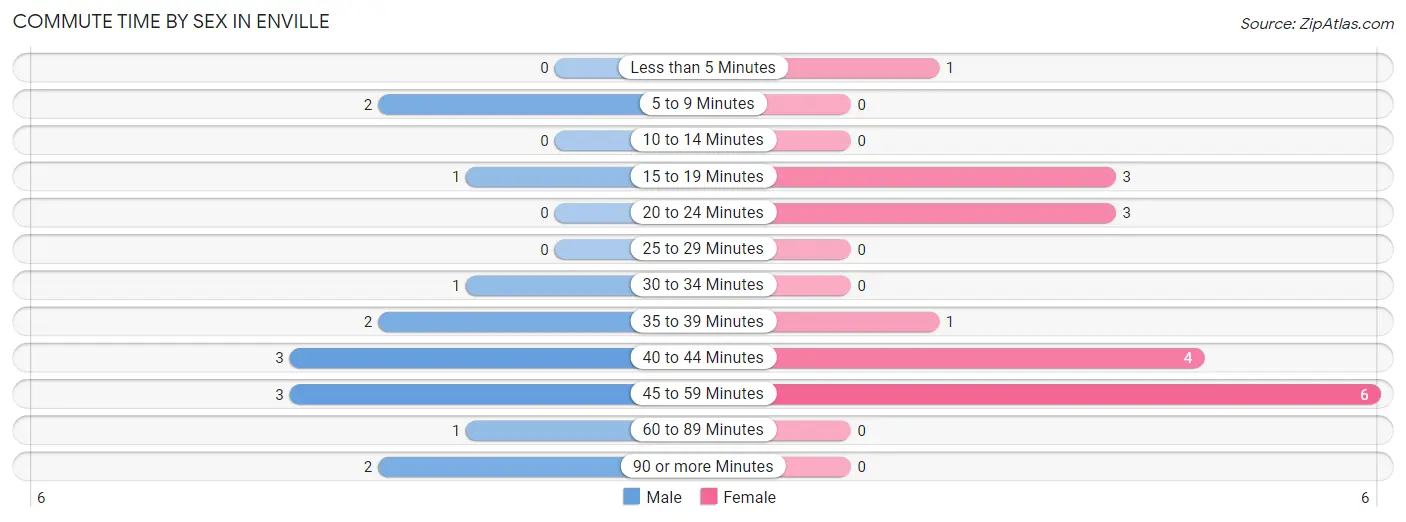
| Commute Time | Male | Female |
| Less than 5 Minutes | 0 (0.0%) | 1 (5.6%) |
| 5 to 9 Minutes | 2 (13.3%) | 0 (0.0%) |
| 10 to 14 Minutes | 0 (0.0%) | 0 (0.0%) |
| 15 to 19 Minutes | 1 (6.7%) | 3 (16.7%) |
| 20 to 24 Minutes | 0 (0.0%) | 3 (16.7%) |
| 25 to 29 Minutes | 0 (0.0%) | 0 (0.0%) |
| 30 to 34 Minutes | 1 (6.7%) | 0 (0.0%) |
| 35 to 39 Minutes | 2 (13.3%) | 1 (5.6%) |
| 40 to 44 Minutes | 3 (20.0%) | 4 (22.2%) |
| 45 to 59 Minutes | 3 (20.0%) | 6 (33.3%) |
| 60 to 89 Minutes | 1 (6.7%) | 0 (0.0%) |
| 90 or more Minutes | 2 (13.3%) | 0 (0.0%) |
Time of Departure to Work by Sex in Enville
The most frequent times of departure to work in Enville are 7:00 AM to 7:29 AM (5, 33.3%) for males and 6:30 AM to 6:59 AM (7, 38.9%) for females.
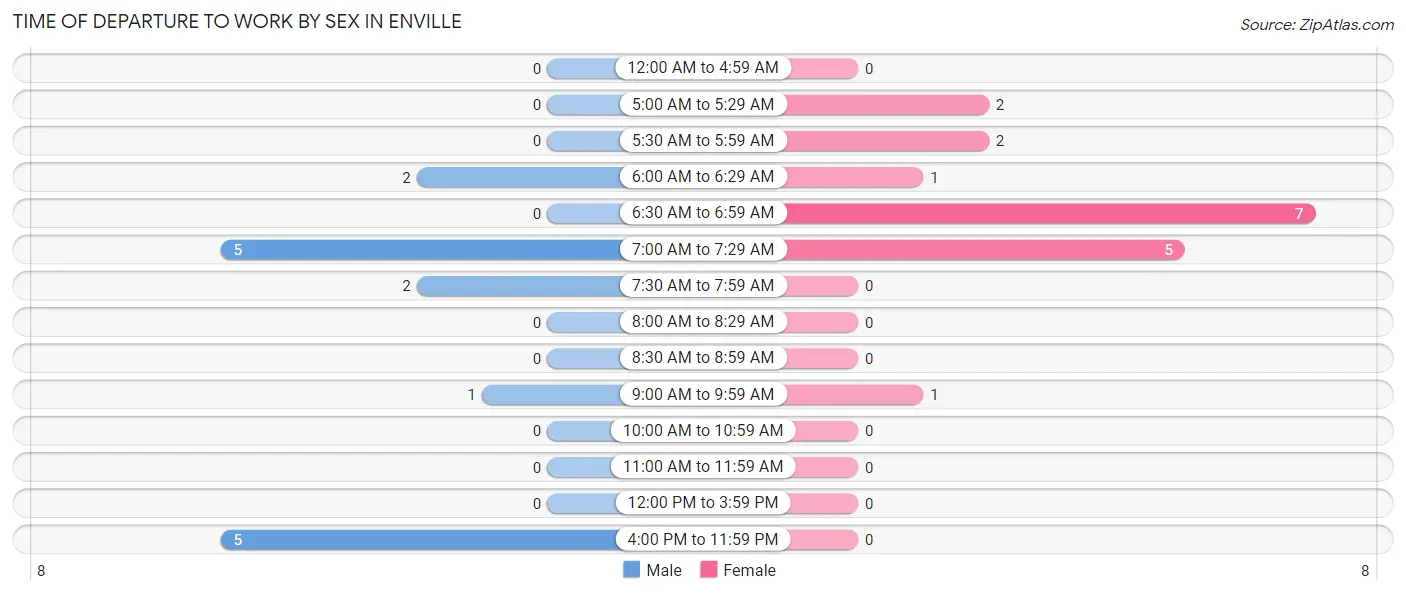
| Time of Departure | Male | Female |
| 12:00 AM to 4:59 AM | 0 (0.0%) | 0 (0.0%) |
| 5:00 AM to 5:29 AM | 0 (0.0%) | 2 (11.1%) |
| 5:30 AM to 5:59 AM | 0 (0.0%) | 2 (11.1%) |
| 6:00 AM to 6:29 AM | 2 (13.3%) | 1 (5.6%) |
| 6:30 AM to 6:59 AM | 0 (0.0%) | 7 (38.9%) |
| 7:00 AM to 7:29 AM | 5 (33.3%) | 5 (27.8%) |
| 7:30 AM to 7:59 AM | 2 (13.3%) | 0 (0.0%) |
| 8:00 AM to 8:29 AM | 0 (0.0%) | 0 (0.0%) |
| 8:30 AM to 8:59 AM | 0 (0.0%) | 0 (0.0%) |
| 9:00 AM to 9:59 AM | 1 (6.7%) | 1 (5.6%) |
| 10:00 AM to 10:59 AM | 0 (0.0%) | 0 (0.0%) |
| 11:00 AM to 11:59 AM | 0 (0.0%) | 0 (0.0%) |
| 12:00 PM to 3:59 PM | 0 (0.0%) | 0 (0.0%) |
| 4:00 PM to 11:59 PM | 5 (33.3%) | 0 (0.0%) |
| Total | 15 (100.0%) | 18 (100.0%) |
Housing Occupancy in Enville
Occupancy by Ownership in Enville
Of the total 96 dwellings in Enville, owner-occupied units account for 60 (62.5%), while renter-occupied units make up 36 (37.5%).
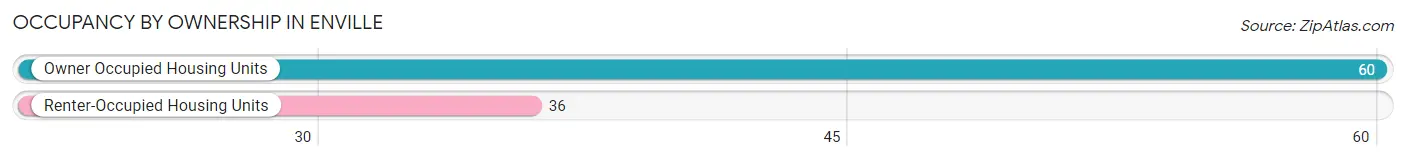
| Occupancy | # Housing Units | % Housing Units |
| Owner Occupied Housing Units | 60 | 62.5% |
| Renter-Occupied Housing Units | 36 | 37.5% |
| Total Occupied Housing Units | 96 | 100.0% |
Occupancy by Household Size in Enville
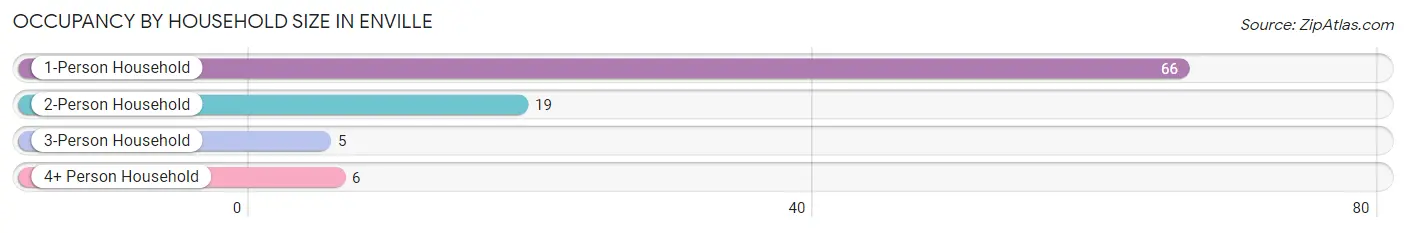
| Household Size | # Housing Units | % Housing Units |
| 1-Person Household | 66 | 68.8% |
| 2-Person Household | 19 | 19.8% |
| 3-Person Household | 5 | 5.2% |
| 4+ Person Household | 6 | 6.2% |
| Total Housing Units | 96 | 100.0% |
Occupancy by Ownership by Household Size in Enville
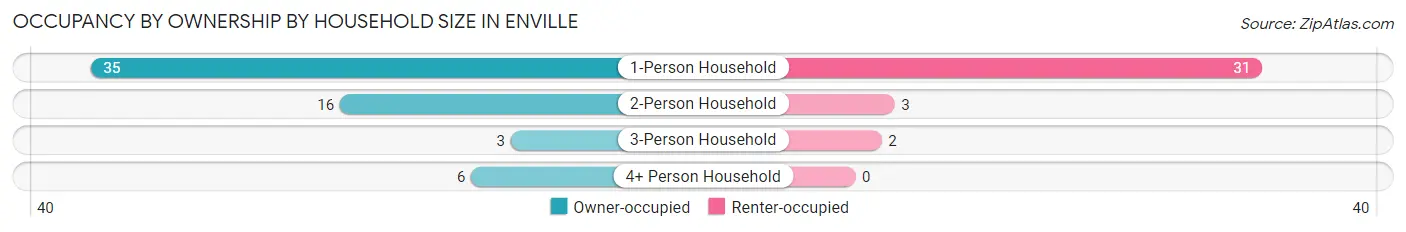
| Household Size | Owner-occupied | Renter-occupied |
| 1-Person Household | 35 (53.0%) | 31 (47.0%) |
| 2-Person Household | 16 (84.2%) | 3 (15.8%) |
| 3-Person Household | 3 (60.0%) | 2 (40.0%) |
| 4+ Person Household | 6 (100.0%) | 0 (0.0%) |
| Total Housing Units | 60 (62.5%) | 36 (37.5%) |
Occupancy by Educational Attainment in Enville
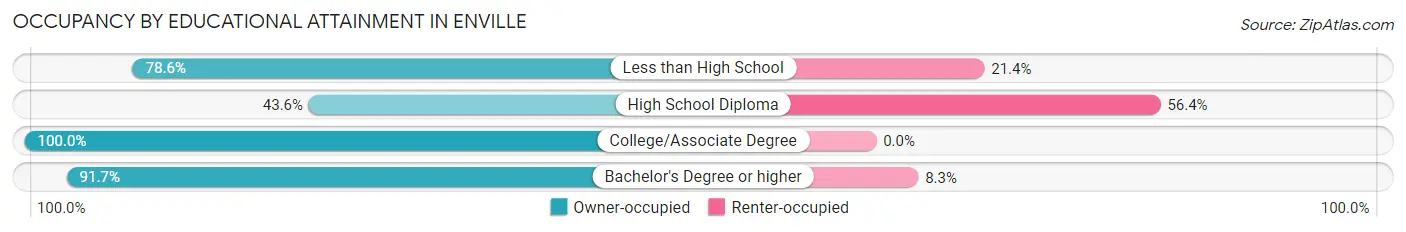
| Household Size | Owner-occupied | Renter-occupied |
| Less than High School | 11 (78.6%) | 3 (21.4%) |
| High School Diploma | 24 (43.6%) | 31 (56.4%) |
| College/Associate Degree | 3 (100.0%) | 0 (0.0%) |
| Bachelor's Degree or higher | 22 (91.7%) | 2 (8.3%) |
Occupancy by Age of Householder in Enville
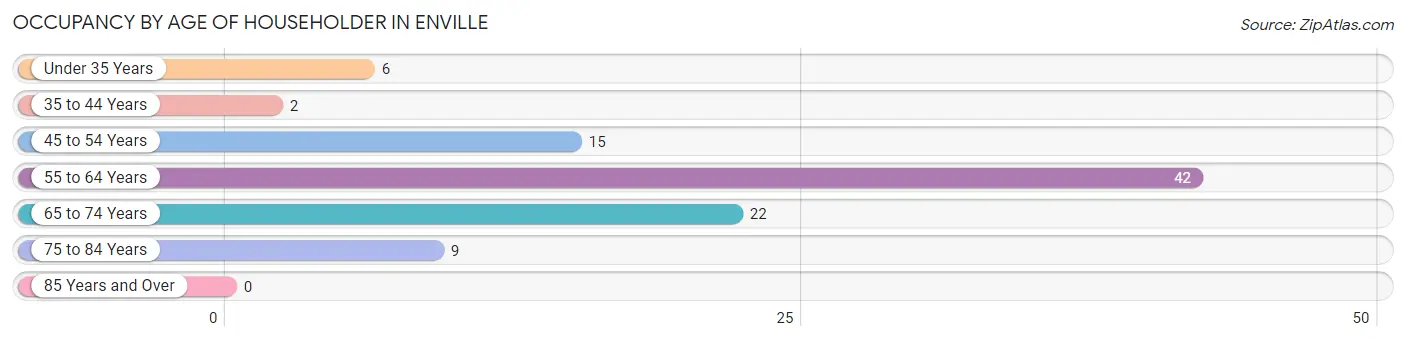
| Age Bracket | # Households | % Households |
| Under 35 Years | 6 | 6.2% |
| 35 to 44 Years | 2 | 2.1% |
| 45 to 54 Years | 15 | 15.6% |
| 55 to 64 Years | 42 | 43.8% |
| 65 to 74 Years | 22 | 22.9% |
| 75 to 84 Years | 9 | 9.4% |
| 85 Years and Over | 0 | 0.0% |
| Total | 96 | 100.0% |
Housing Finances in Enville
Median Income by Occupancy in Enville
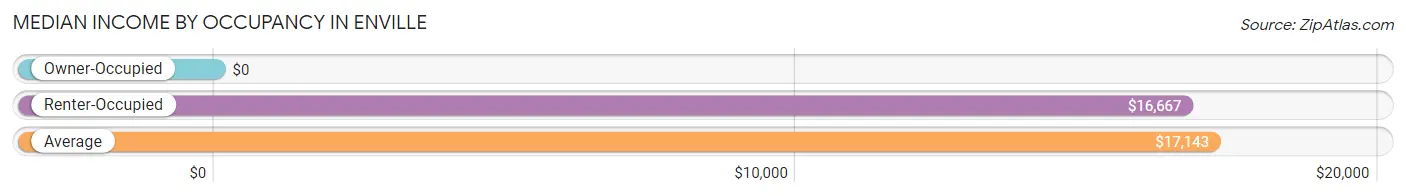
| Occupancy Type | # Households | Median Income |
| Owner-Occupied | 60 (62.5%) | $0 |
| Renter-Occupied | 36 (37.5%) | $16,667 |
| Average | 96 (100.0%) | $17,143 |
Occupancy by Householder Income Bracket in Enville
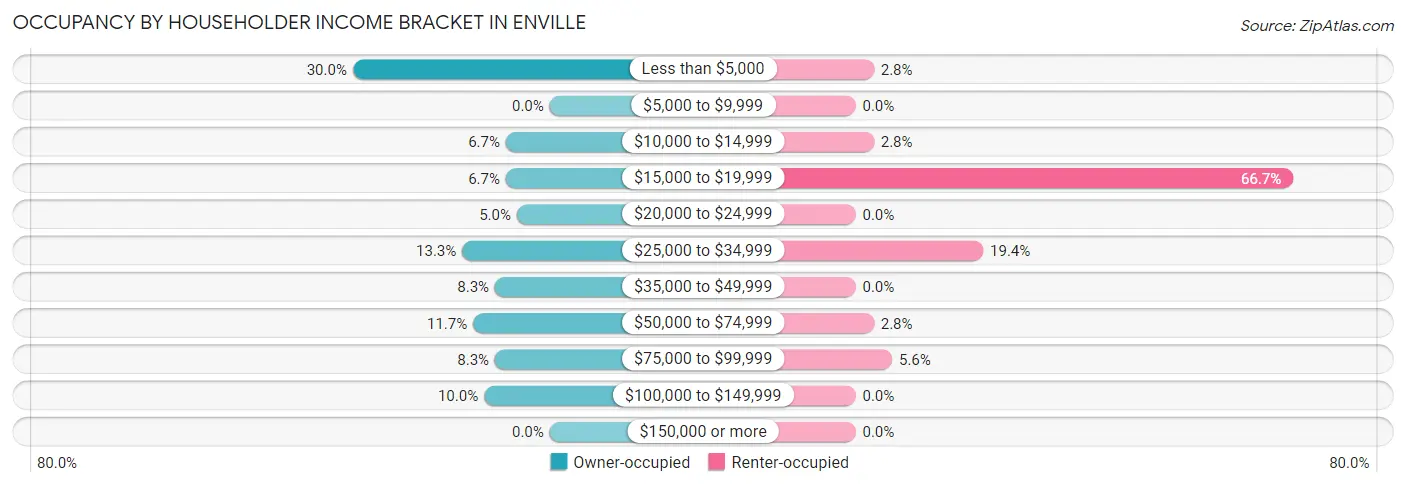
| Income Bracket | Owner-occupied | Renter-occupied |
| Less than $5,000 | 18 (30.0%) | 1 (2.8%) |
| $5,000 to $9,999 | 0 (0.0%) | 0 (0.0%) |
| $10,000 to $14,999 | 4 (6.7%) | 1 (2.8%) |
| $15,000 to $19,999 | 4 (6.7%) | 24 (66.7%) |
| $20,000 to $24,999 | 3 (5.0%) | 0 (0.0%) |
| $25,000 to $34,999 | 8 (13.3%) | 7 (19.4%) |
| $35,000 to $49,999 | 5 (8.3%) | 0 (0.0%) |
| $50,000 to $74,999 | 7 (11.7%) | 1 (2.8%) |
| $75,000 to $99,999 | 5 (8.3%) | 2 (5.6%) |
| $100,000 to $149,999 | 6 (10.0%) | 0 (0.0%) |
| $150,000 or more | 0 (0.0%) | 0 (0.0%) |
| Total | 60 (100.0%) | 36 (100.0%) |
Monthly Housing Cost Tiers in Enville
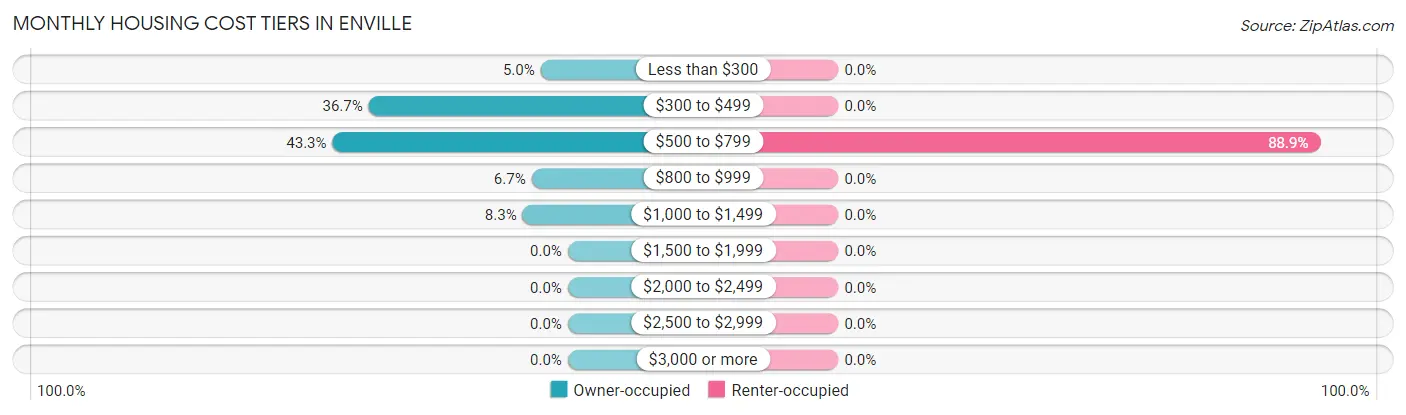
| Monthly Cost | Owner-occupied | Renter-occupied |
| Less than $300 | 3 (5.0%) | 0 (0.0%) |
| $300 to $499 | 22 (36.7%) | 0 (0.0%) |
| $500 to $799 | 26 (43.3%) | 32 (88.9%) |
| $800 to $999 | 4 (6.7%) | 0 (0.0%) |
| $1,000 to $1,499 | 5 (8.3%) | 0 (0.0%) |
| $1,500 to $1,999 | 0 (0.0%) | 0 (0.0%) |
| $2,000 to $2,499 | 0 (0.0%) | 0 (0.0%) |
| $2,500 to $2,999 | 0 (0.0%) | 0 (0.0%) |
| $3,000 or more | 0 (0.0%) | 0 (0.0%) |
| Total | 60 (100.0%) | 36 (100.0%) |
Physical Housing Characteristics in Enville
Housing Structures in Enville
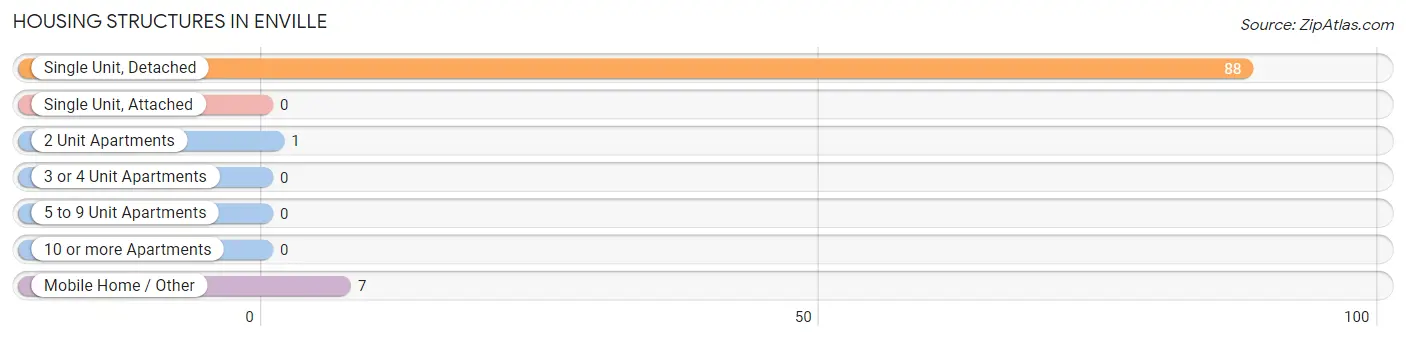
| Structure Type | # Housing Units | % Housing Units |
| Single Unit, Detached | 88 | 91.7% |
| Single Unit, Attached | 0 | 0.0% |
| 2 Unit Apartments | 1 | 1.0% |
| 3 or 4 Unit Apartments | 0 | 0.0% |
| 5 to 9 Unit Apartments | 0 | 0.0% |
| 10 or more Apartments | 0 | 0.0% |
| Mobile Home / Other | 7 | 7.3% |
| Total | 96 | 100.0% |
Housing Structures by Occupancy in Enville
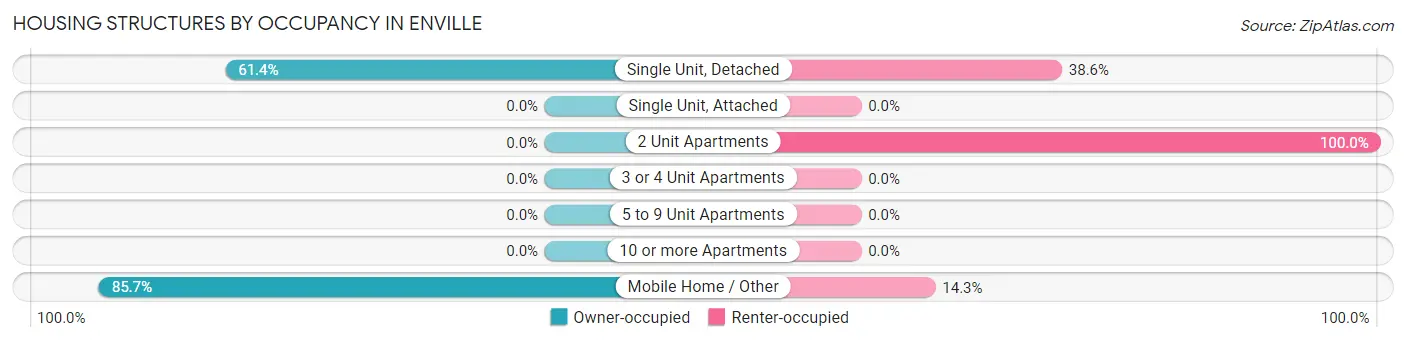
| Structure Type | Owner-occupied | Renter-occupied |
| Single Unit, Detached | 54 (61.4%) | 34 (38.6%) |
| Single Unit, Attached | 0 (0.0%) | 0 (0.0%) |
| 2 Unit Apartments | 0 (0.0%) | 1 (100.0%) |
| 3 or 4 Unit Apartments | 0 (0.0%) | 0 (0.0%) |
| 5 to 9 Unit Apartments | 0 (0.0%) | 0 (0.0%) |
| 10 or more Apartments | 0 (0.0%) | 0 (0.0%) |
| Mobile Home / Other | 6 (85.7%) | 1 (14.3%) |
| Total | 60 (62.5%) | 36 (37.5%) |
Housing Structures by Number of Rooms in Enville
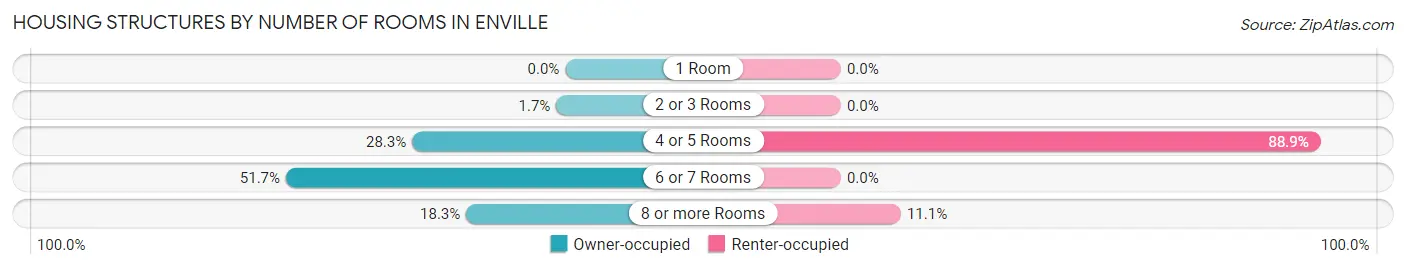
| Number of Rooms | Owner-occupied | Renter-occupied |
| 1 Room | 0 (0.0%) | 0 (0.0%) |
| 2 or 3 Rooms | 1 (1.7%) | 0 (0.0%) |
| 4 or 5 Rooms | 17 (28.3%) | 32 (88.9%) |
| 6 or 7 Rooms | 31 (51.7%) | 0 (0.0%) |
| 8 or more Rooms | 11 (18.3%) | 4 (11.1%) |
| Total | 60 (100.0%) | 36 (100.0%) |
Housing Structure by Heating Type in Enville
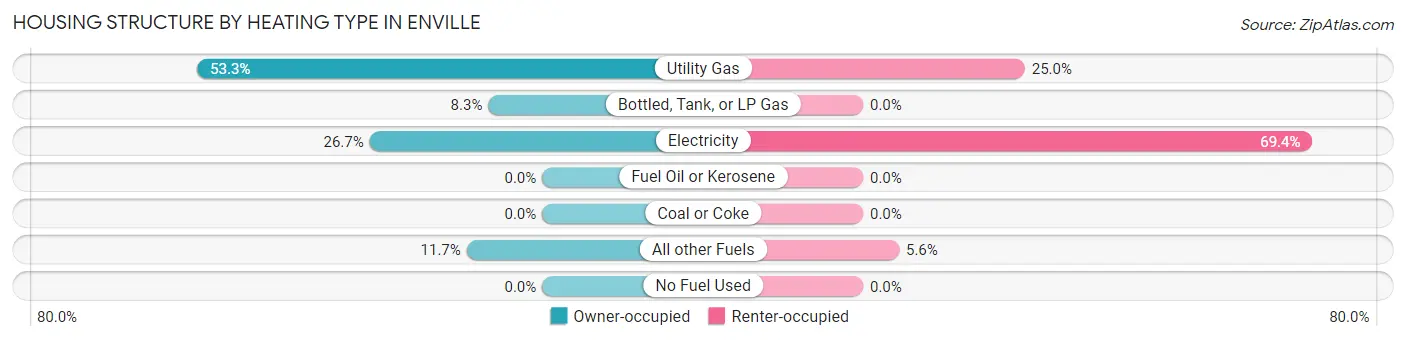
| Heating Type | Owner-occupied | Renter-occupied |
| Utility Gas | 32 (53.3%) | 9 (25.0%) |
| Bottled, Tank, or LP Gas | 5 (8.3%) | 0 (0.0%) |
| Electricity | 16 (26.7%) | 25 (69.4%) |
| Fuel Oil or Kerosene | 0 (0.0%) | 0 (0.0%) |
| Coal or Coke | 0 (0.0%) | 0 (0.0%) |
| All other Fuels | 7 (11.7%) | 2 (5.6%) |
| No Fuel Used | 0 (0.0%) | 0 (0.0%) |
| Total | 60 (100.0%) | 36 (100.0%) |
Household Vehicle Usage in Enville
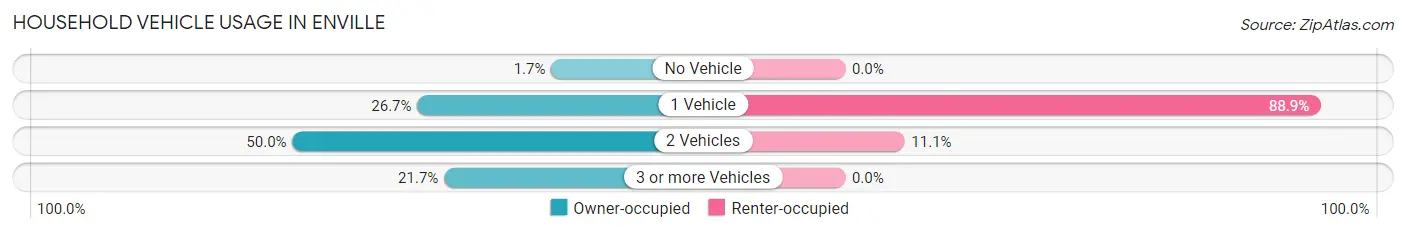
| Vehicles per Household | Owner-occupied | Renter-occupied |
| No Vehicle | 1 (1.7%) | 0 (0.0%) |
| 1 Vehicle | 16 (26.7%) | 32 (88.9%) |
| 2 Vehicles | 30 (50.0%) | 4 (11.1%) |
| 3 or more Vehicles | 13 (21.7%) | 0 (0.0%) |
| Total | 60 (100.0%) | 36 (100.0%) |
Real Estate & Mortgages in Enville
Real Estate and Mortgage Overview in Enville
| Characteristic | Without Mortgage | With Mortgage |
| Housing Units | 41 | 19 |
| Median Property Value | - | - |
| Median Household Income | - | - |
| Monthly Housing Costs | $482 | $0 |
| Real Estate Taxes | $925 | $0 |
Property Value by Mortgage Status in Enville
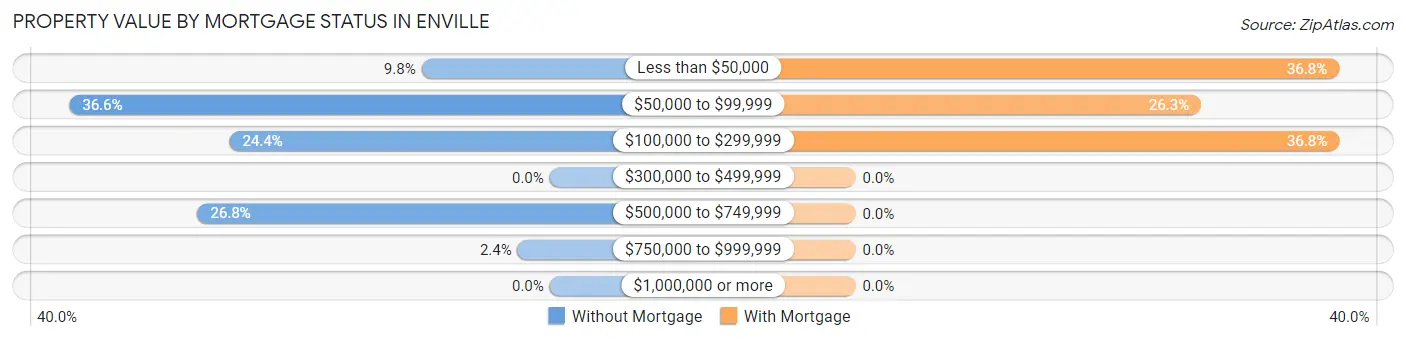
| Property Value | Without Mortgage | With Mortgage |
| Less than $50,000 | 4 (9.8%) | 7 (36.8%) |
| $50,000 to $99,999 | 15 (36.6%) | 5 (26.3%) |
| $100,000 to $299,999 | 10 (24.4%) | 7 (36.8%) |
| $300,000 to $499,999 | 0 (0.0%) | 0 (0.0%) |
| $500,000 to $749,999 | 11 (26.8%) | 0 (0.0%) |
| $750,000 to $999,999 | 1 (2.4%) | 0 (0.0%) |
| $1,000,000 or more | 0 (0.0%) | 0 (0.0%) |
| Total | 41 (100.0%) | 19 (100.0%) |
Household Income by Mortgage Status in Enville
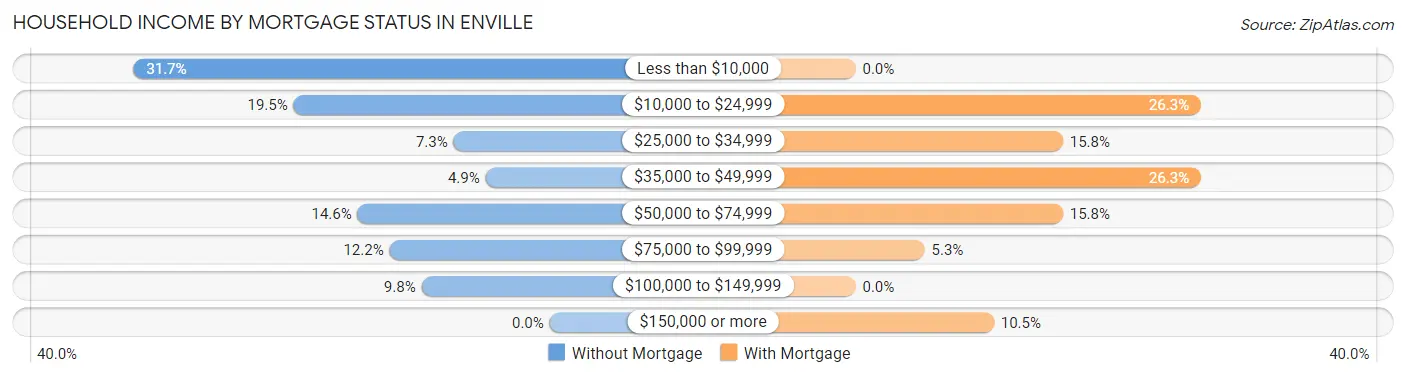
| Household Income | Without Mortgage | With Mortgage |
| Less than $10,000 | 13 (31.7%) | 0 (0.0%) |
| $10,000 to $24,999 | 8 (19.5%) | 5 (26.3%) |
| $25,000 to $34,999 | 3 (7.3%) | 3 (15.8%) |
| $35,000 to $49,999 | 2 (4.9%) | 5 (26.3%) |
| $50,000 to $74,999 | 6 (14.6%) | 3 (15.8%) |
| $75,000 to $99,999 | 5 (12.2%) | 1 (5.3%) |
| $100,000 to $149,999 | 4 (9.8%) | 0 (0.0%) |
| $150,000 or more | 0 (0.0%) | 2 (10.5%) |
| Total | 41 (100.0%) | 19 (100.0%) |
Property Value to Household Income Ratio in Enville
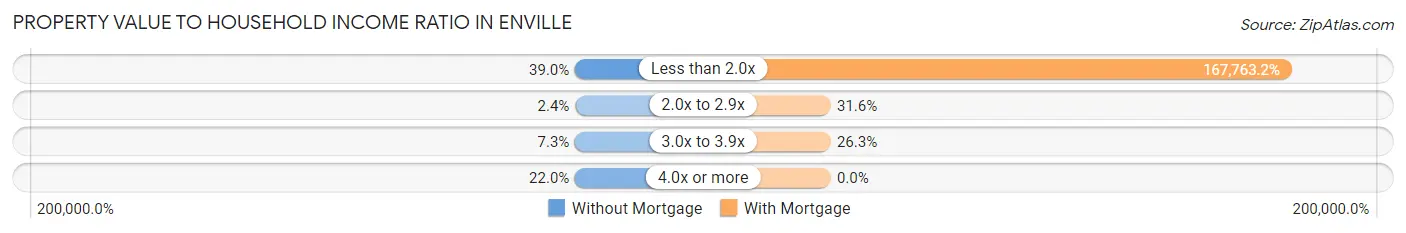
| Value-to-Income Ratio | Without Mortgage | With Mortgage |
| Less than 2.0x | 16 (39.0%) | 31,875 (167,763.2%) |
| 2.0x to 2.9x | 1 (2.4%) | 6 (31.6%) |
| 3.0x to 3.9x | 3 (7.3%) | 5 (26.3%) |
| 4.0x or more | 9 (22.0%) | 0 (0.0%) |
| Total | 41 (100.0%) | 19 (100.0%) |
Real Estate Taxes by Mortgage Status in Enville
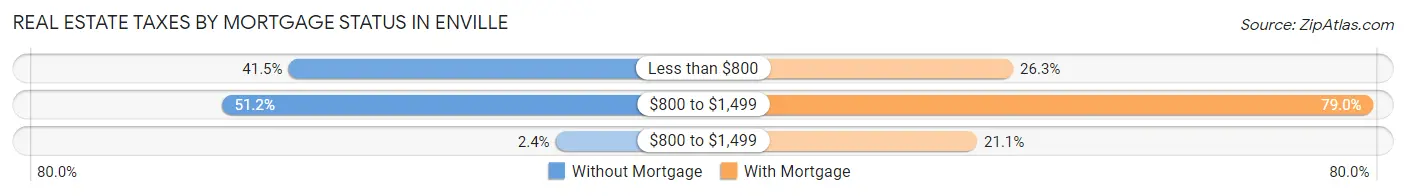
| Property Taxes | Without Mortgage | With Mortgage |
| Less than $800 | 17 (41.5%) | 5 (26.3%) |
| $800 to $1,499 | 21 (51.2%) | 15 (78.9%) |
| $800 to $1,499 | 1 (2.4%) | 4 (21.0%) |
| Total | 41 (100.0%) | 19 (100.0%) |
Health & Disability in Enville
Health Insurance Coverage by Age in Enville
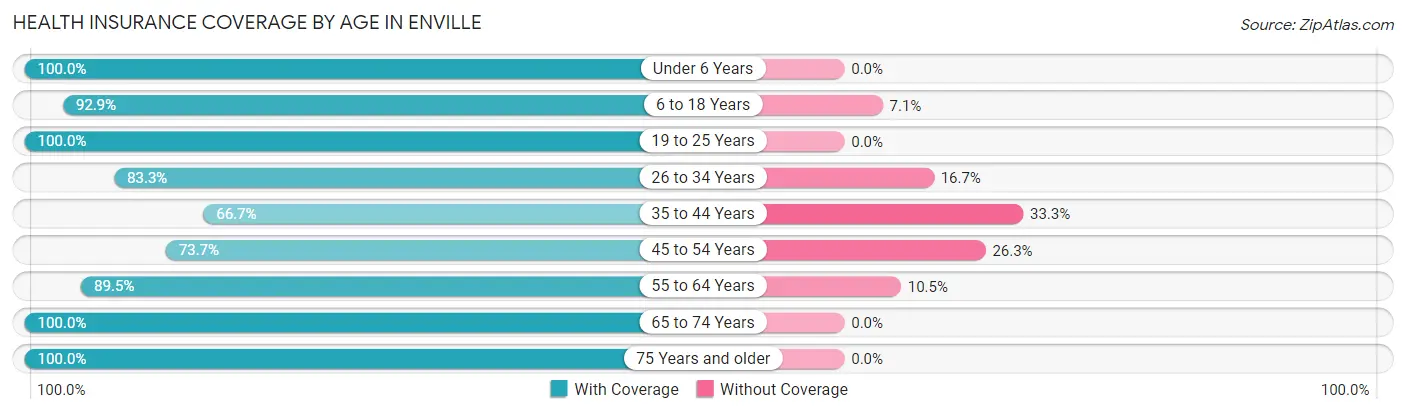
| Age Bracket | With Coverage | Without Coverage |
| Under 6 Years | 6 (100.0%) | 0 (0.0%) |
| 6 to 18 Years | 13 (92.9%) | 1 (7.1%) |
| 19 to 25 Years | 1 (100.0%) | 0 (0.0%) |
| 26 to 34 Years | 10 (83.3%) | 2 (16.7%) |
| 35 to 44 Years | 4 (66.7%) | 2 (33.3%) |
| 45 to 54 Years | 14 (73.7%) | 5 (26.3%) |
| 55 to 64 Years | 51 (89.5%) | 6 (10.5%) |
| 65 to 74 Years | 30 (100.0%) | 0 (0.0%) |
| 75 Years and older | 12 (100.0%) | 0 (0.0%) |
| Total | 141 (89.8%) | 16 (10.2%) |
Health Insurance Coverage by Citizenship Status in Enville
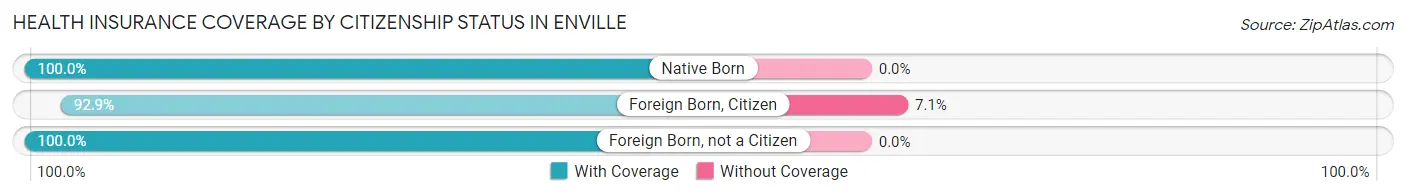
| Citizenship Status | With Coverage | Without Coverage |
| Native Born | 6 (100.0%) | 0 (0.0%) |
| Foreign Born, Citizen | 13 (92.9%) | 1 (7.1%) |
| Foreign Born, not a Citizen | 1 (100.0%) | 0 (0.0%) |
Health Insurance Coverage by Household Income in Enville
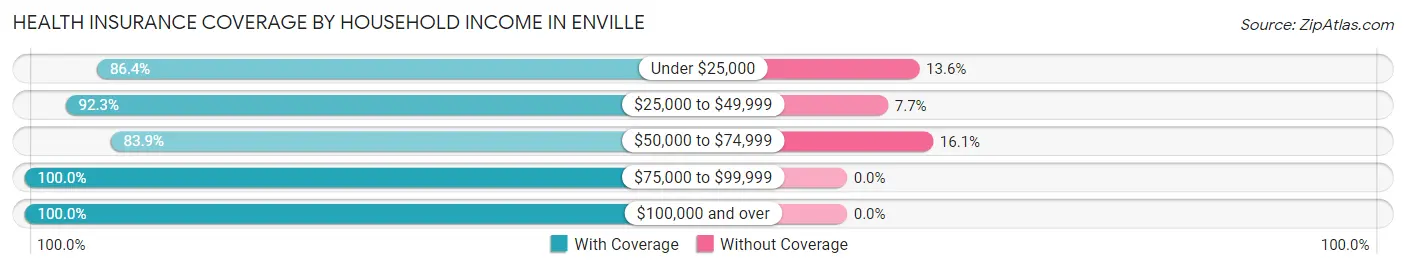
| Household Income | With Coverage | Without Coverage |
| Under $25,000 | 51 (86.4%) | 8 (13.6%) |
| $25,000 to $49,999 | 36 (92.3%) | 3 (7.7%) |
| $50,000 to $74,999 | 26 (83.9%) | 5 (16.1%) |
| $75,000 to $99,999 | 10 (100.0%) | 0 (0.0%) |
| $100,000 and over | 18 (100.0%) | 0 (0.0%) |
Public vs Private Health Insurance Coverage by Age in Enville
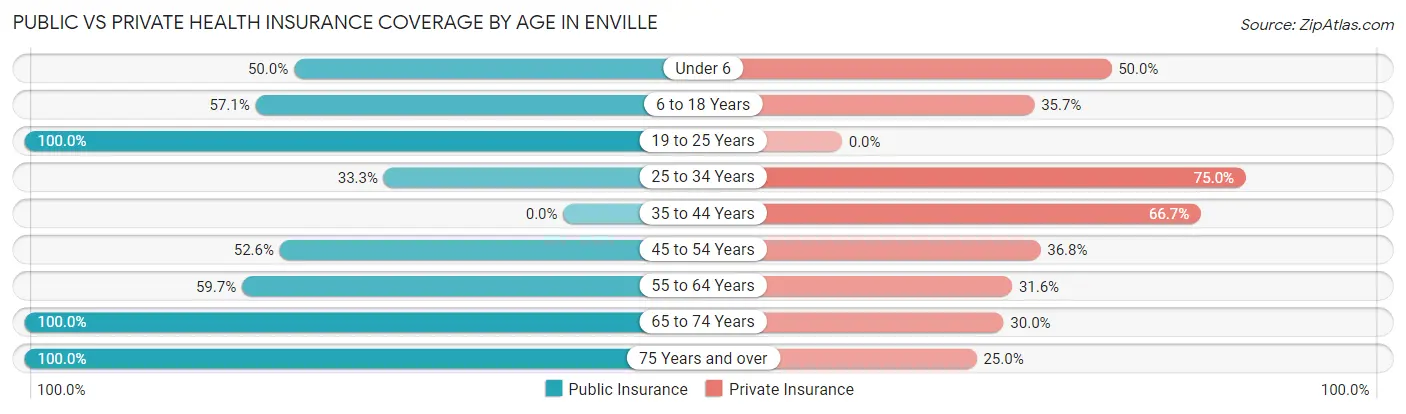
| Age Bracket | Public Insurance | Private Insurance |
| Under 6 | 3 (50.0%) | 3 (50.0%) |
| 6 to 18 Years | 8 (57.1%) | 5 (35.7%) |
| 19 to 25 Years | 1 (100.0%) | 0 (0.0%) |
| 25 to 34 Years | 4 (33.3%) | 9 (75.0%) |
| 35 to 44 Years | 0 (0.0%) | 4 (66.7%) |
| 45 to 54 Years | 10 (52.6%) | 7 (36.8%) |
| 55 to 64 Years | 34 (59.7%) | 18 (31.6%) |
| 65 to 74 Years | 30 (100.0%) | 9 (30.0%) |
| 75 Years and over | 12 (100.0%) | 3 (25.0%) |
| Total | 102 (65.0%) | 58 (36.9%) |
Disability Status by Sex by Age in Enville
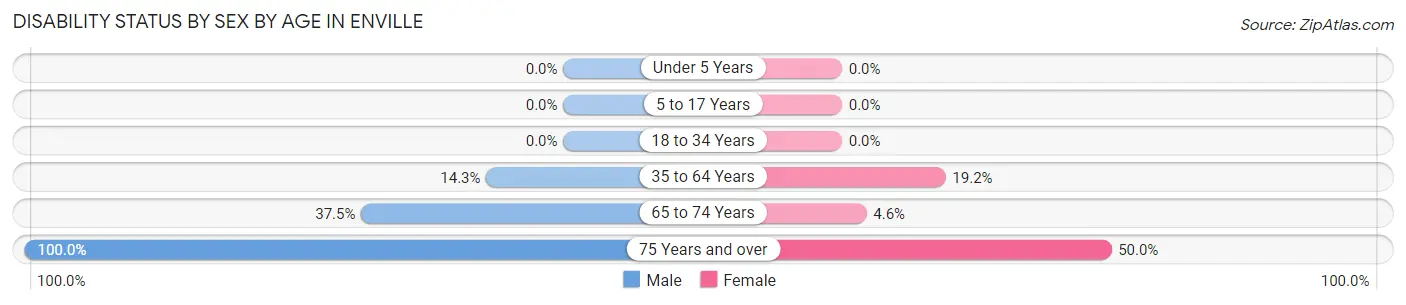
| Age Bracket | Male | Female |
| Under 5 Years | 0 (0.0%) | 0 (0.0%) |
| 5 to 17 Years | 0 (0.0%) | 0 (0.0%) |
| 18 to 34 Years | 0 (0.0%) | 0 (0.0%) |
| 35 to 64 Years | 8 (14.3%) | 5 (19.2%) |
| 65 to 74 Years | 3 (37.5%) | 1 (4.5%) |
| 75 Years and over | 4 (100.0%) | 4 (50.0%) |
Disability Class by Sex by Age in Enville
Disability Class: Hearing Difficulty
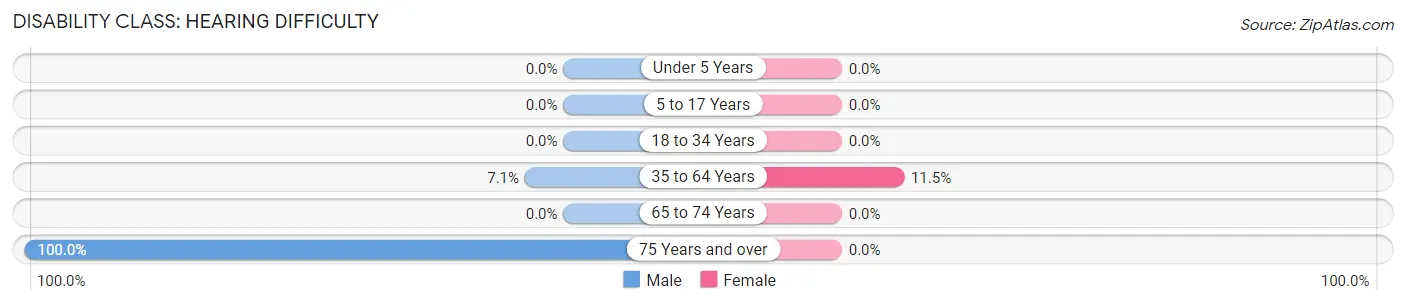
| Age Bracket | Male | Female |
| Under 5 Years | 0 (0.0%) | 0 (0.0%) |
| 5 to 17 Years | 0 (0.0%) | 0 (0.0%) |
| 18 to 34 Years | 0 (0.0%) | 0 (0.0%) |
| 35 to 64 Years | 4 (7.1%) | 3 (11.5%) |
| 65 to 74 Years | 0 (0.0%) | 0 (0.0%) |
| 75 Years and over | 4 (100.0%) | 0 (0.0%) |
Disability Class: Vision Difficulty
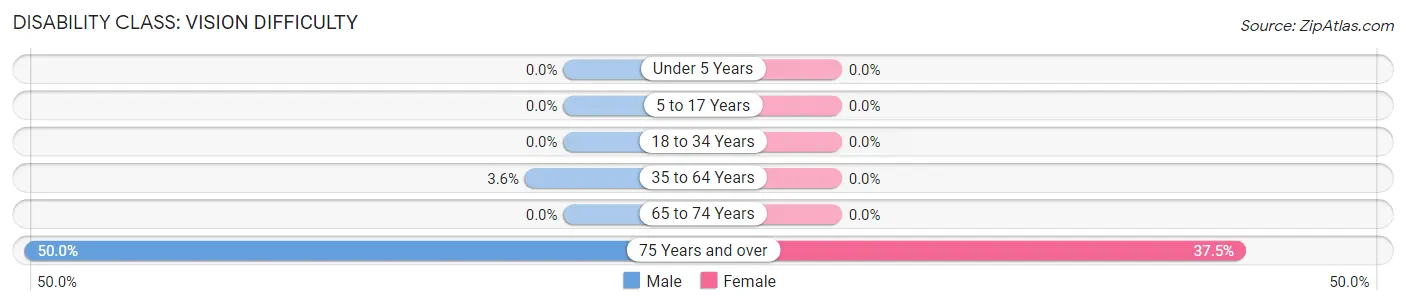
| Age Bracket | Male | Female |
| Under 5 Years | 0 (0.0%) | 0 (0.0%) |
| 5 to 17 Years | 0 (0.0%) | 0 (0.0%) |
| 18 to 34 Years | 0 (0.0%) | 0 (0.0%) |
| 35 to 64 Years | 2 (3.6%) | 0 (0.0%) |
| 65 to 74 Years | 0 (0.0%) | 0 (0.0%) |
| 75 Years and over | 2 (50.0%) | 3 (37.5%) |
Disability Class: Cognitive Difficulty
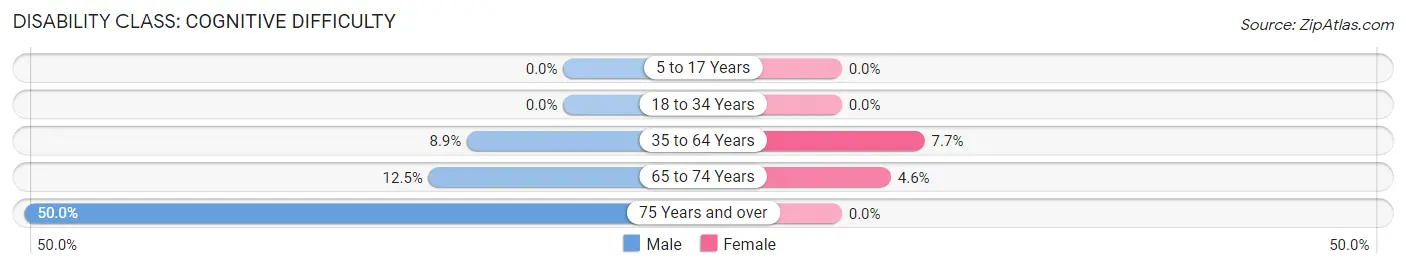
| Age Bracket | Male | Female |
| 5 to 17 Years | 0 (0.0%) | 0 (0.0%) |
| 18 to 34 Years | 0 (0.0%) | 0 (0.0%) |
| 35 to 64 Years | 5 (8.9%) | 2 (7.7%) |
| 65 to 74 Years | 1 (12.5%) | 1 (4.5%) |
| 75 Years and over | 2 (50.0%) | 0 (0.0%) |
Disability Class: Ambulatory Difficulty
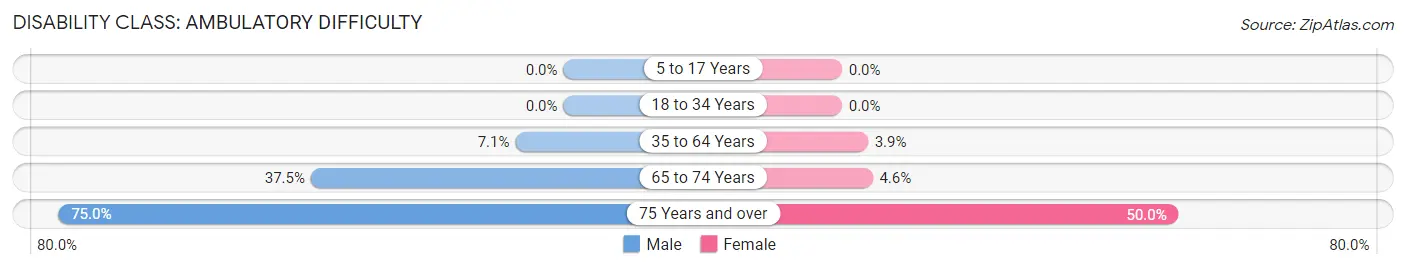
| Age Bracket | Male | Female |
| 5 to 17 Years | 0 (0.0%) | 0 (0.0%) |
| 18 to 34 Years | 0 (0.0%) | 0 (0.0%) |
| 35 to 64 Years | 4 (7.1%) | 1 (3.8%) |
| 65 to 74 Years | 3 (37.5%) | 1 (4.5%) |
| 75 Years and over | 3 (75.0%) | 4 (50.0%) |
Disability Class: Self-Care Difficulty
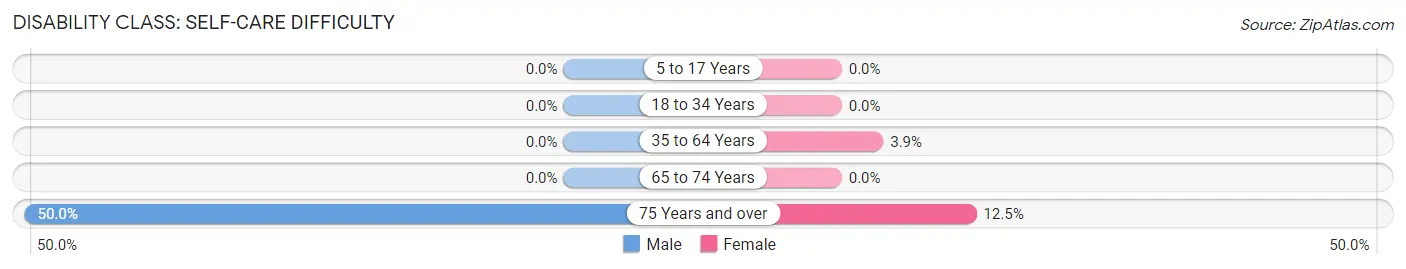
| Age Bracket | Male | Female |
| 5 to 17 Years | 0 (0.0%) | 0 (0.0%) |
| 18 to 34 Years | 0 (0.0%) | 0 (0.0%) |
| 35 to 64 Years | 0 (0.0%) | 1 (3.8%) |
| 65 to 74 Years | 0 (0.0%) | 0 (0.0%) |
| 75 Years and over | 2 (50.0%) | 1 (12.5%) |
Technology Access in Enville
Computing Device Access in Enville
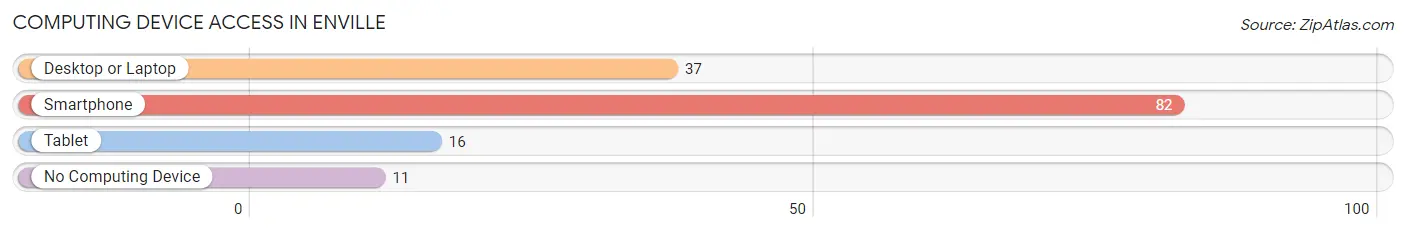
| Device Type | # Households | % Households |
| Desktop or Laptop | 37 | 38.5% |
| Smartphone | 82 | 85.4% |
| Tablet | 16 | 16.7% |
| No Computing Device | 11 | 11.5% |
| Total | 96 | 100.0% |
Internet Access in Enville
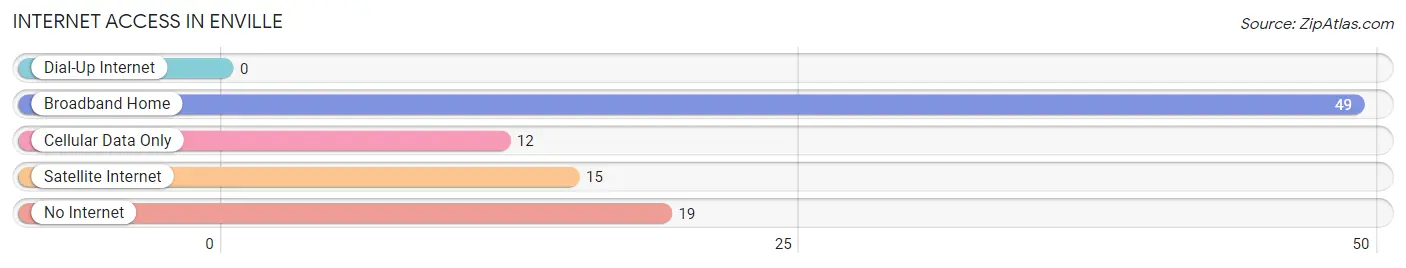
| Internet Type | # Households | % Households |
| Dial-Up Internet | 0 | 0.0% |
| Broadband Home | 49 | 51.0% |
| Cellular Data Only | 12 | 12.5% |
| Satellite Internet | 15 | 15.6% |
| No Internet | 19 | 19.8% |
| Total | 96 | 100.0% |
Enville Summary
Enville is a small town located in the southwestern corner of Tennessee, in the United States. It is situated in the foothills of the Appalachian Mountains, and is part of the larger Jackson metropolitan area. The town has a population of just over 1,000 people, and is known for its rural charm and friendly atmosphere.
History
Enville was first settled in the early 1800s by a group of settlers from North Carolina. The town was originally known as “Enfield”, after the nearby Enfield Creek. The name was later changed to “Enville”, after the local Enville family. The town was officially incorporated in 1845.
In the late 1800s, Enville was a thriving agricultural community, with a large number of farms and plantations. The town was also home to several mills, which provided employment for many of the town’s residents.
In the early 1900s, Enville began to experience a decline in population as many of its residents moved away in search of better economic opportunities. The town’s population continued to decline until the 1950s, when it began to experience a resurgence. This was due in part to the construction of Interstate 40, which brought new businesses and residents to the area.
Geography
Enville is located in the southwestern corner of Tennessee, in the United States. It is situated in the foothills of the Appalachian Mountains, and is part of the larger Jackson metropolitan area. The town is located approximately 30 miles south of Jackson, and is bordered by the towns of Henderson, Lexington, and Whiteville.
The town is situated on the banks of the Enfield Creek, which flows through the center of town. The creek is a tributary of the nearby Tennessee River, and is a popular spot for fishing and other recreational activities.
The town is located in a temperate climate, with hot summers and mild winters. The average annual temperature is around 70 degrees Fahrenheit, and the average annual precipitation is around 45 inches.
Economy
Enville’s economy is largely based on agriculture and tourism. The town is home to several farms and plantations, which produce a variety of crops, including corn, soybeans, and cotton. The town is also home to several wineries, which produce a variety of wines.
The town is also home to several small businesses, including restaurants, shops, and other services. The town is also home to several manufacturing plants, which produce a variety of products, including furniture, clothing, and automotive parts.
Demographics
As of the 2010 census, Enville had a population of 1,072 people. The town is predominantly white, with a small African American population. The median household income is around $35,000, and the median home value is around $90,000. The town has a low unemployment rate, and a high rate of homeownership.
Enville is a small town with a rich history and a friendly atmosphere. The town is home to a variety of businesses and attractions, and is a popular destination for tourists and locals alike. The town is a great place to live, work, and raise a family.
Common Questions
What is Per Capita Income in Enville?
Per Capita income in Enville is $21,938.
What is the Median Family Income in Enville?
Median Family Income in Enville is $58,750.
What is the Median Household income in Enville?
Median Household Income in Enville is $17,143.
What is Inequality or Gini Index in Enville?
Inequality or Gini Index in Enville is 0.53.
What is the Total Population of Enville?
Total Population of Enville is 157.
What is the Total Male Population of Enville?
Total Male Population of Enville is 83.
What is the Total Female Population of Enville?
Total Female Population of Enville is 74.
What is the Ratio of Males per 100 Females in Enville?
There are 112.16 Males per 100 Females in Enville.
What is the Ratio of Females per 100 Males in Enville?
There are 89.16 Females per 100 Males in Enville.
What is the Median Population Age in Enville?
Median Population Age in Enville is 61.5 Years.
What is the Average Family Size in Enville
Average Family Size in Enville is 3.1 People.
What is the Average Household Size in Enville
Average Household Size in Enville is 1.6 People.
How Large is the Labor Force in Enville?
There are 38 People in the Labor Forcein in Enville.
What is the Percentage of People in the Labor Force in Enville?
27.5% of People are in the Labor Force in Enville.
What is the Unemployment Rate in Enville?
Unemployment Rate in Enville is 5.3%.